Earthstone Energy — Investor Presentation (January 2019)
24 slides from Earthstone Energy's investor presentation, Jan 16, 2019
Slide 1: Investor Presentation
Exhibit 99.2 Investor Presentation January 16, 2019 1
Slide 2: Disclaimer: Forward-Looking Statements
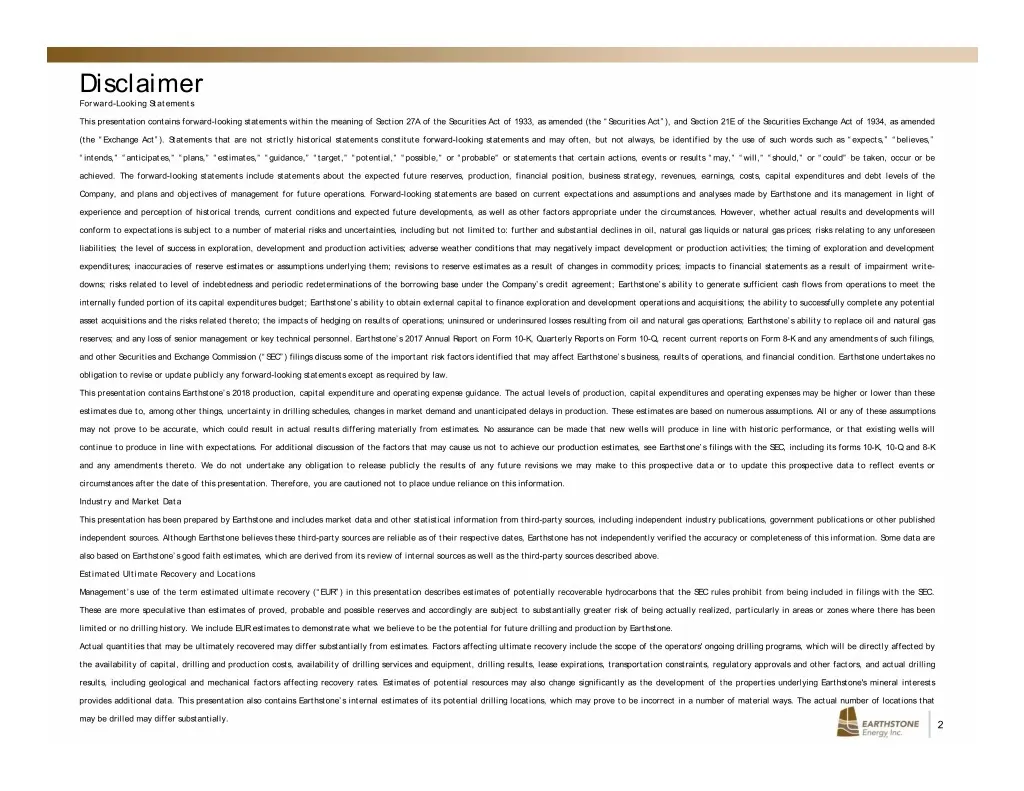
Disclaimer Forward-Looking Statements This presentation contains forward-looking statements within the meaning of Section 27A of the Securities Act of 1933, as amended (the “Securities Act”), and Section 21E of the Securities Exchange Act of 1934, as amended (the “Exchange Act”). Statements that are
Slide 3: Investment Highlights
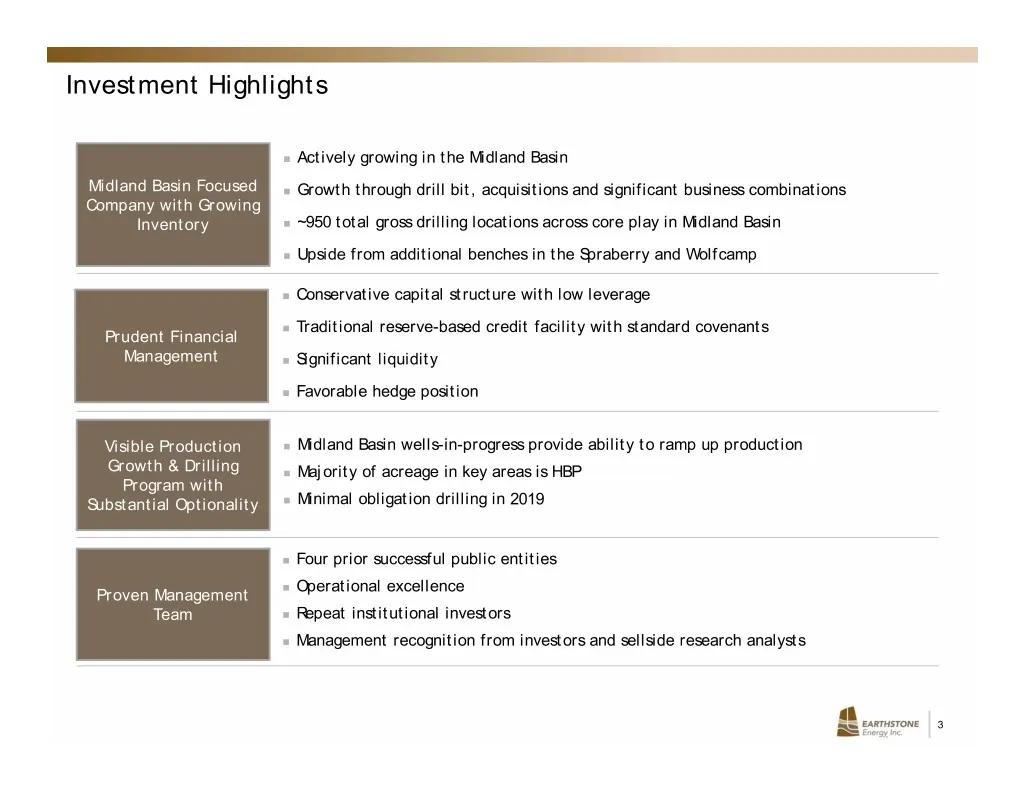
Investment Highlights Actively growing in the Midland Basin Midland Basin Focused Growth through drill bit, acquisitions and significant business combinations Company with Growing Inventory ~950 total gross drilling locations across core play in Midland Basin Upside from additional benches i
Slide 4: Proven Leadership and Track Record of Value Creation
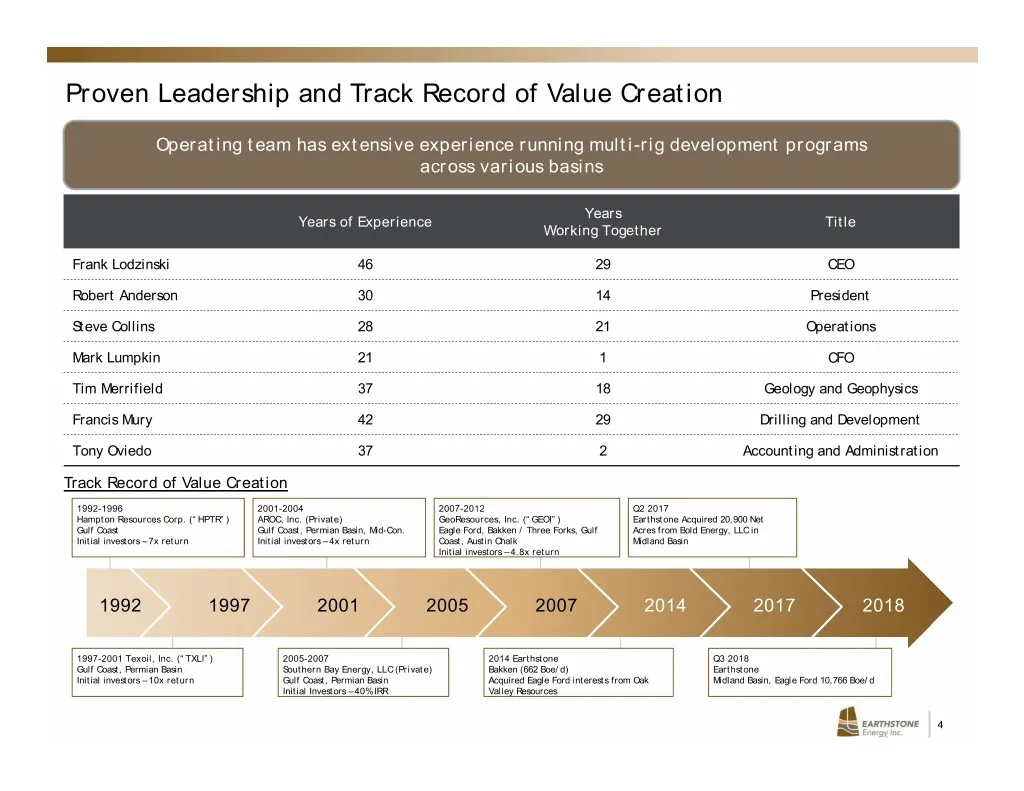
Proven Leadership and Track Record of Value Creation Operating team has extensive experience running multi-rig development programs across various basins Years Years of Experience Title Working Together Frank Lodzinski 46 29 CEO Robert Anderson 30 14 President Steve Collins 28 21 Operations Mark Lum
Slide 5: Company Overview
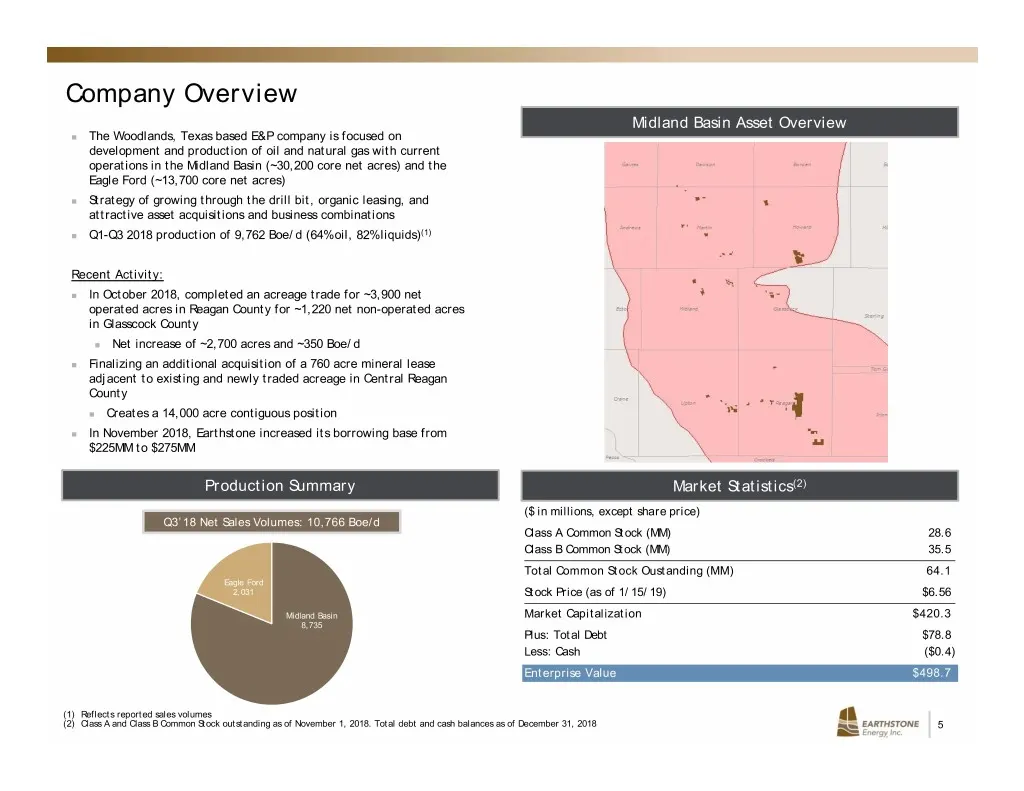
Company Overview Midland Basin Asset Overview The Woodlands, Texas based E&P company is focused on development and production of oil and natural gas with current operations in the Midland Basin (~30,200 core net acres) and the Eagle Ford (~13,700 core net acres) Strategy of growing through the d
Slide 6: Continue to Increase Size, Scale and Core Inventory in the Midland Basin
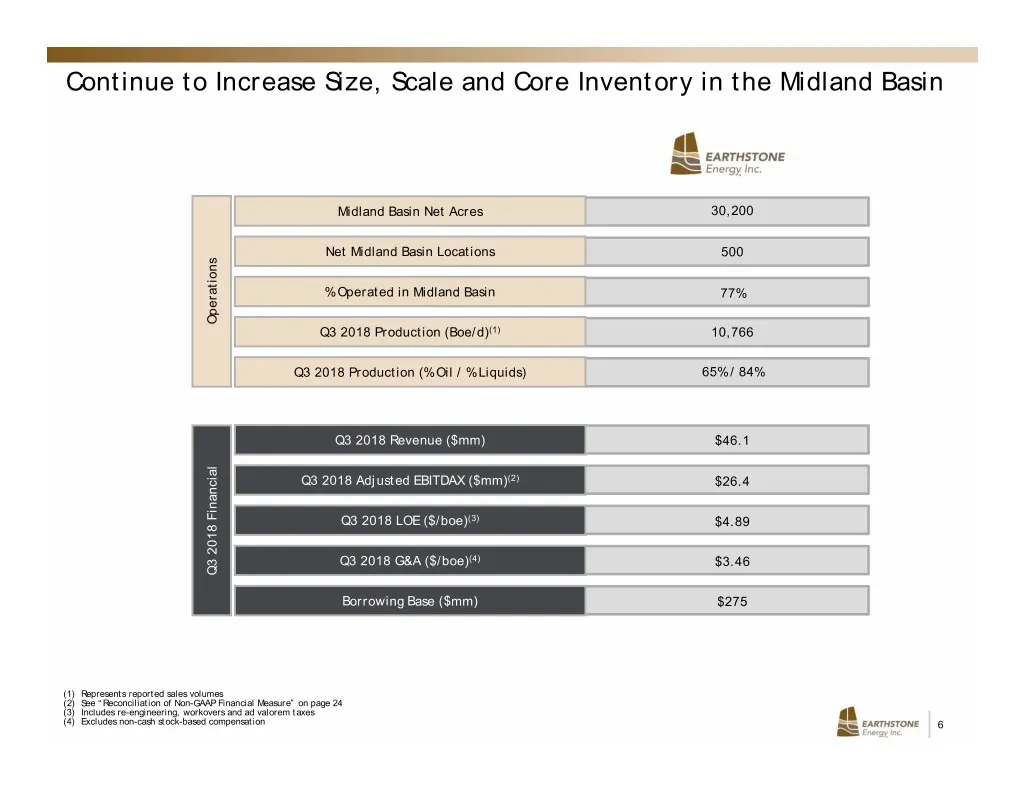
Continue to Increase Size, Scale and Core Inventory in the Midland Basin Midland Basin Net Acres 30,200 Net Midland Basin Locations 500 % Operated in Midland Basin 77% Operations Q3 2018 Production (Boe/d)(1) 10,766 Q3 2018 Production (% Oil / % Liquids) 65% / 84% Q3 2018 Revenue ($mm) $46.1 Q3 2018
Slide 7: Consistent Growth and Margin Expansion While Maintaining a Strong Balance Sheet
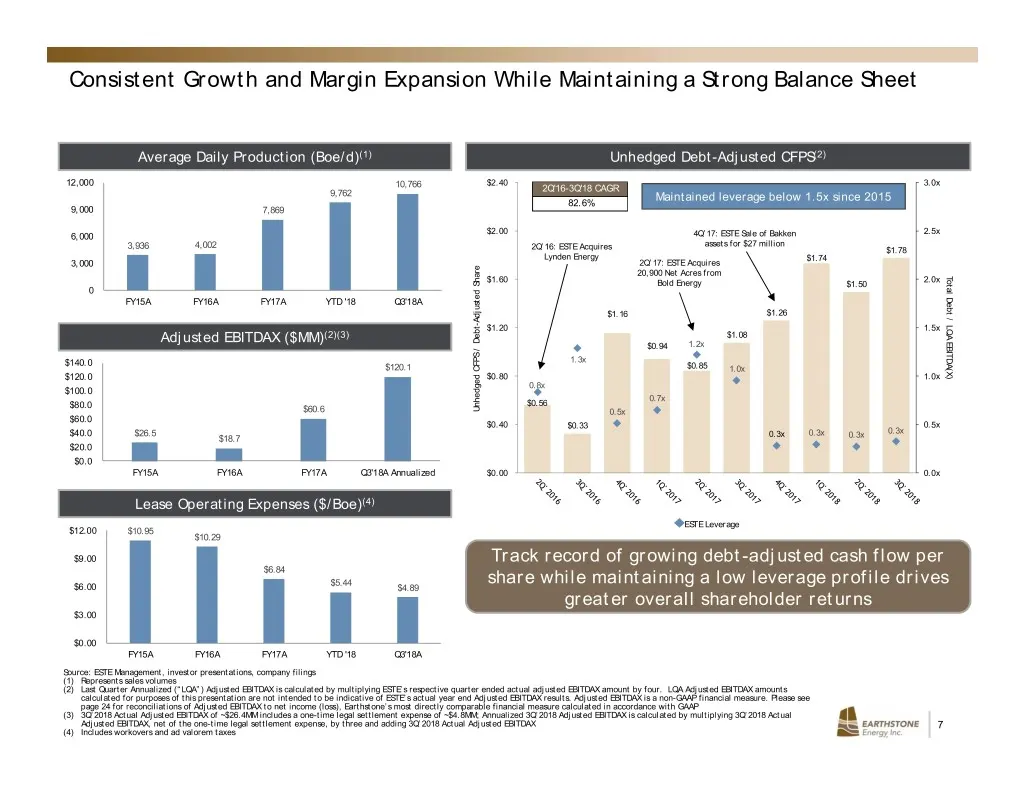
Consistent Growth and Margin Expansion While Maintaining a Strong Balance Sheet Average Daily Production (Boe/d)(1) Unhedged Debt-Adjusted CFPS(2) 12,000 $2.40 3.0x 10,766 2Q'16-3Q'18 CAGR 9,762 Maintained leverage below 1.5x since 2015 82.6% 9,000 7,869 $2.00 2.5x 6,000 4Q’17: ESTE Sale of Bakken 3
Slide 8: Areas of Operations
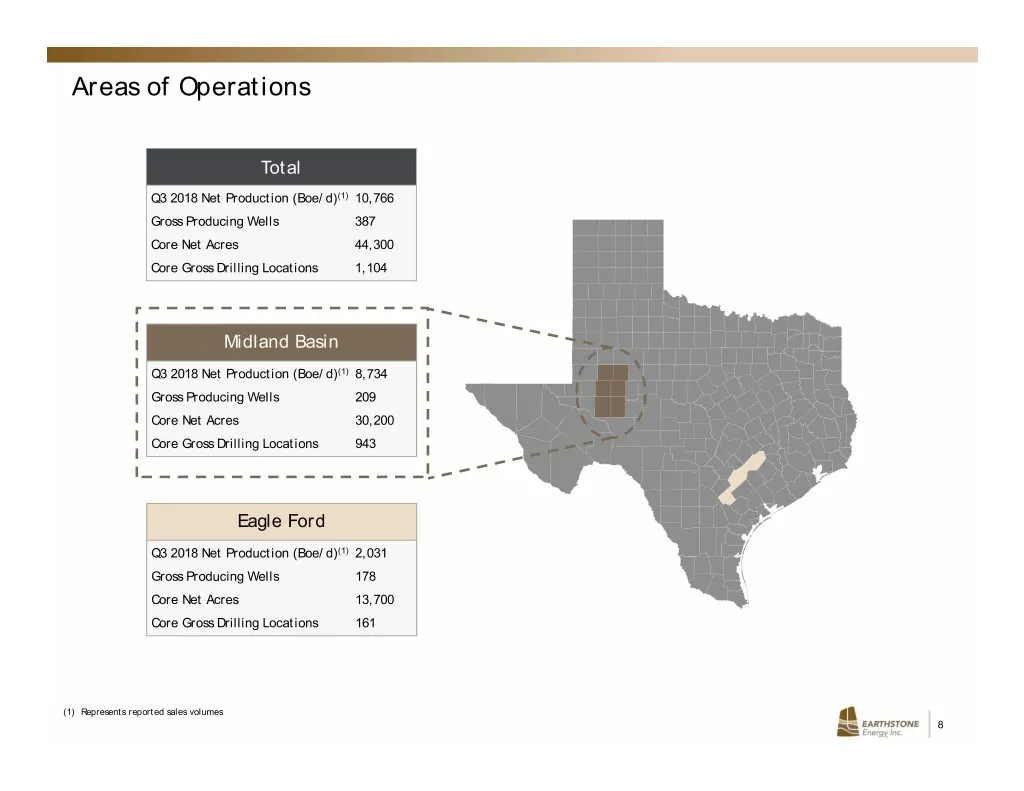
Areas of Operations Total Q3 2018 Net Production (Boe/d)(1) 10,766 Gross Producing Wells 387 Core Net Acres 44,300 Core Gross Drilling Locations 1,104 Midland Basin Q3 2018 Net Production (Boe/d)(1) 8,734 Gross Producing Wells 209 Core Net Acres 30,200 Core Gross Drilling Locations 943 Eagle Ford Q3
Slide 9: Asset Overview
Asset Overview 9
Slide 10: Significant Position in the Midland Basin
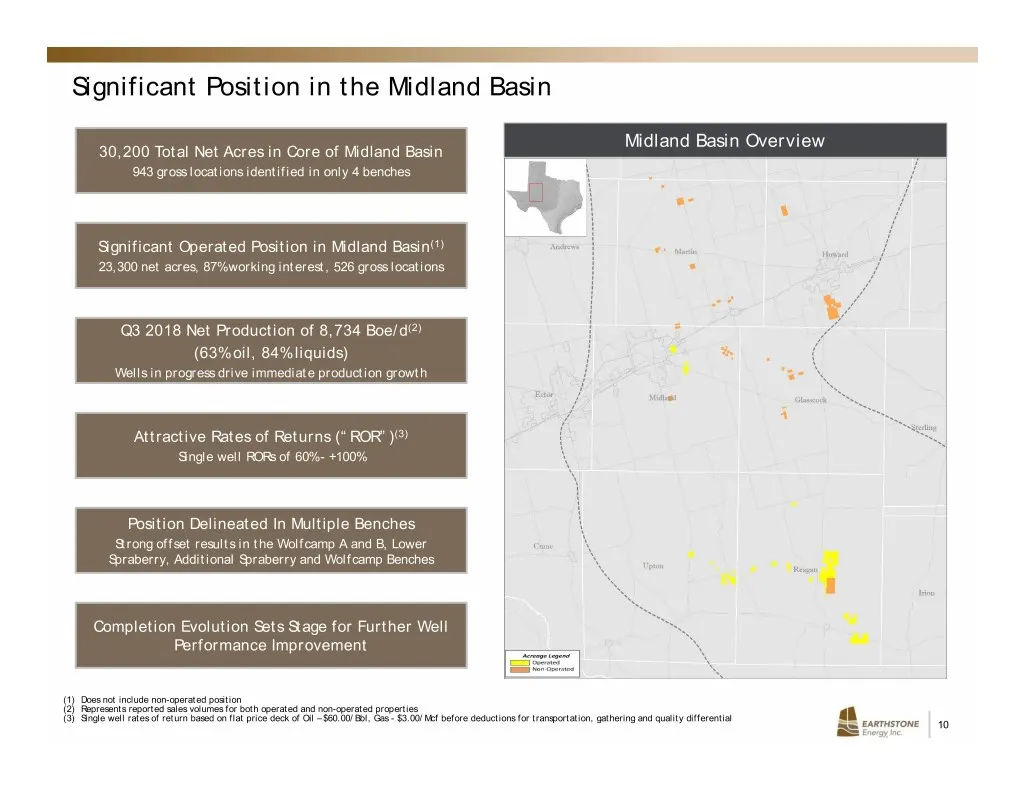
Significant Position in the Midland Basin Midland Basin Overview 30,200 Total Net Acres in Core of Midland Basin 943 gross locations identified in only 4 benches Significant Operated Position in Midland Basin(1) 23,300 net acres, 87% working interest, 526 gross locations Q3 2018 Net Production of 8,
Slide 11: Consistent Thickness in Place Across the Operated Position
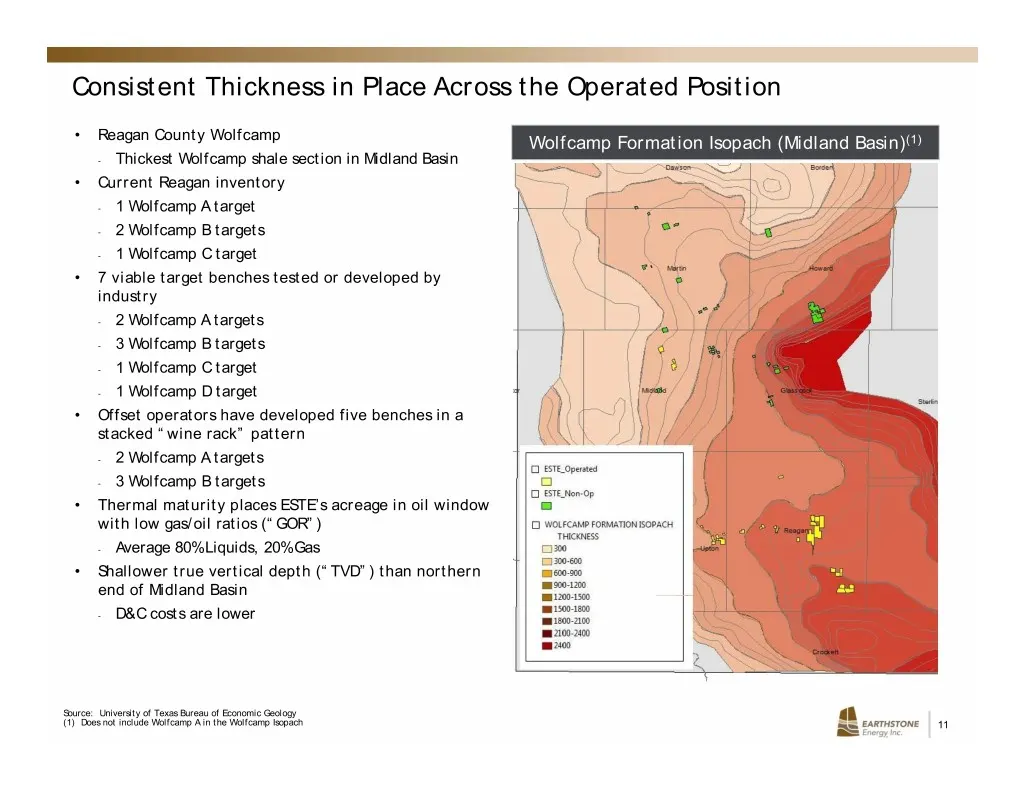
Consistent Thickness in Place Across the Operated Position • Reagan County Wolfcamp Wolfcamp Formation Isopach (Midland Basin)(1) ‐ Thickest Wolfcamp shale section in Midland Basin • Current Reagan inventory ‐ 1 Wolfcamp A target ‐ 2 Wolfcamp B targets ‐ 1 Wolfcamp C target • 7 viable target benches
Slide 12: High Quality Pay Across Multiple Zones
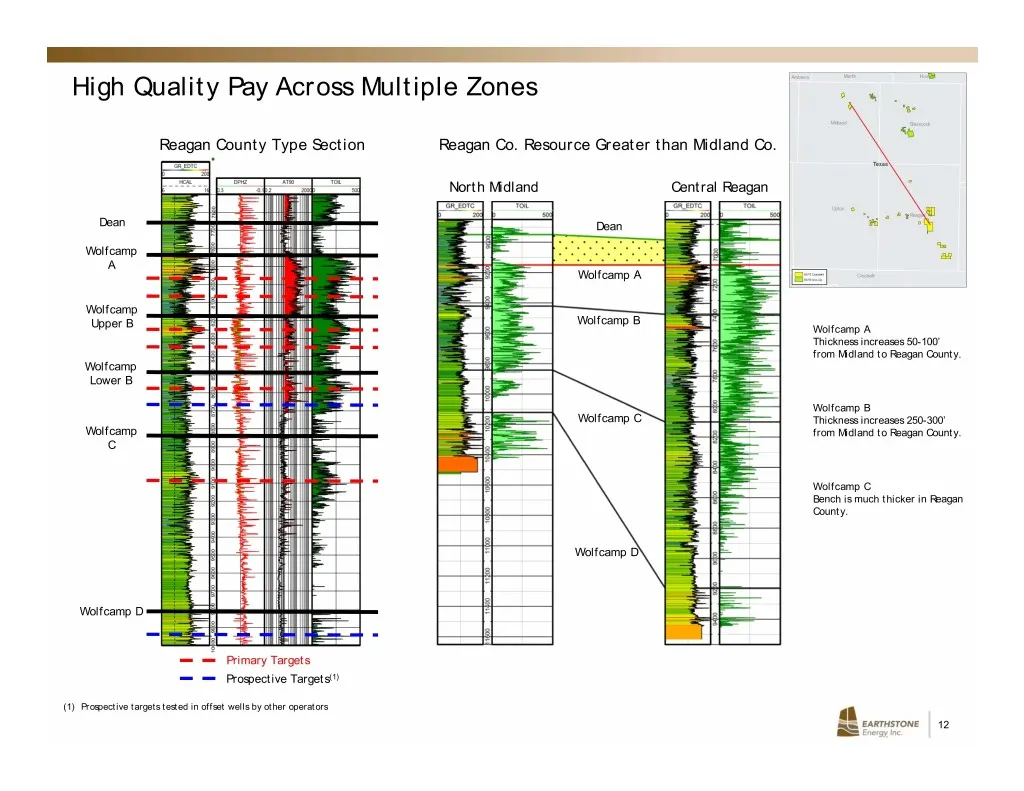
High Quality Pay Across Multiple Zones Reagan County Type Section Reagan Co. Resource Greater than Midland Co. North Midland Central Reagan Dean Dean Wolfcamp A Wolfcamp A Wolfcamp Wolfcamp B Upper B Wolfcamp A Thickness increases 50-100’ from Midland to Reagan County. Wolfcamp Lower B Wolfcamp B Wo
Slide 13: Recent Southern Midland Basin Results
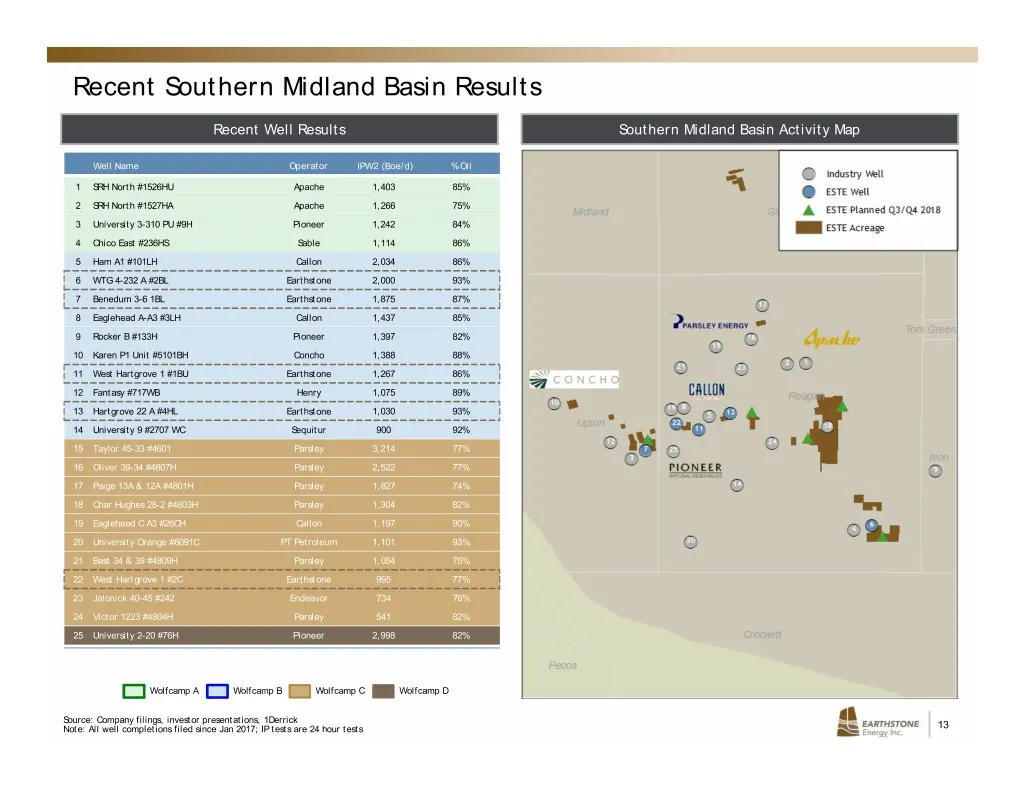
Recent Southern Midland Basin Results Recent Well Results Southern Midland Basin Activity Map Well Name Operator IPW2 (Boe/d) % Oil 1 SRH North #1526HU Apache 1,403 85% 2 SRH North #1527HA Apache 1,266 75% 3 University 3-310 PU #9H Pioneer 1,242 84% 4 Chico East #236HS Sable 1,114 86% 5 Ham A1 #101L
Slide 14: Differentiated, Balanced Inventory in Midland Basin
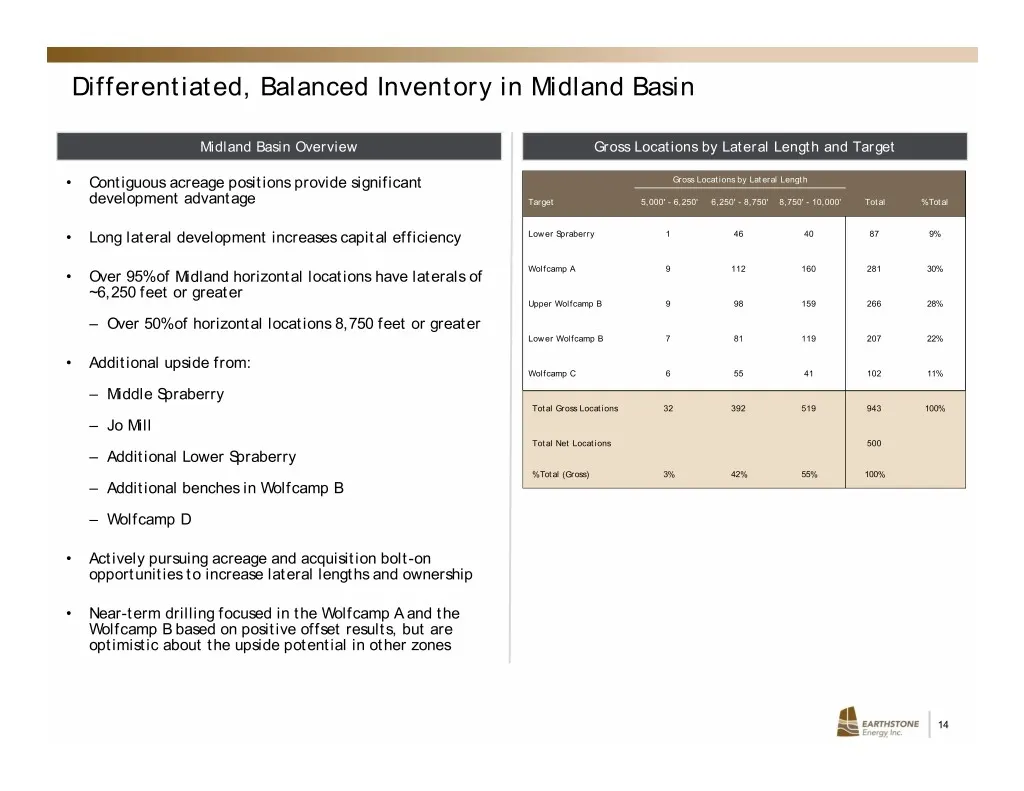
Differentiated, Balanced Inventory in Midland Basin Midland Basin Overview Gross Locations by Lateral Length and Target • Contiguous acreage positions provide significant Gross Locations by Lateral Length development advantage Target 5,000' - 6,250' 6,250' - 8,750' 8,750' - 10,000' Total % Total • L
Slide 15: Midland Basin Type Curve Overview
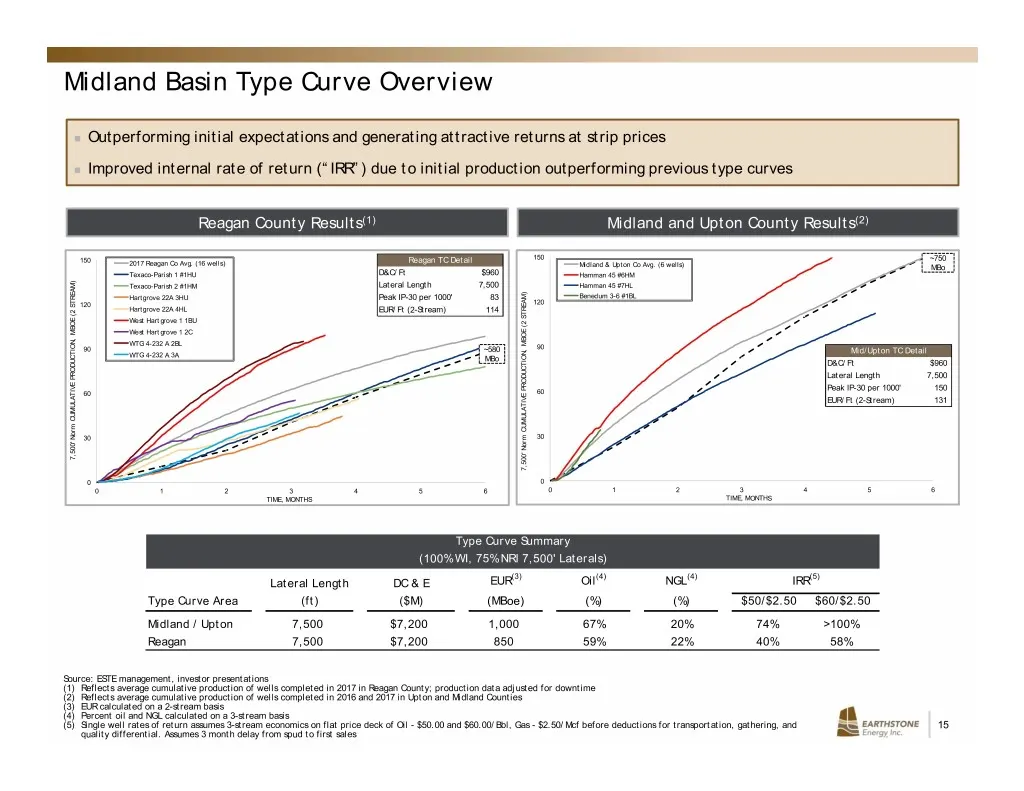
Midland Basin Type Curve Overview Outperforming initial expectations and generating attractive returns at strip prices Improved internal rate of return (“IRR”) due to initial production outperforming previous type curves Reagan County Results(1) Midland and Upton County Results(2) 150 ~750 150 2
Slide 16: Acreage Trade – Central Reagan County
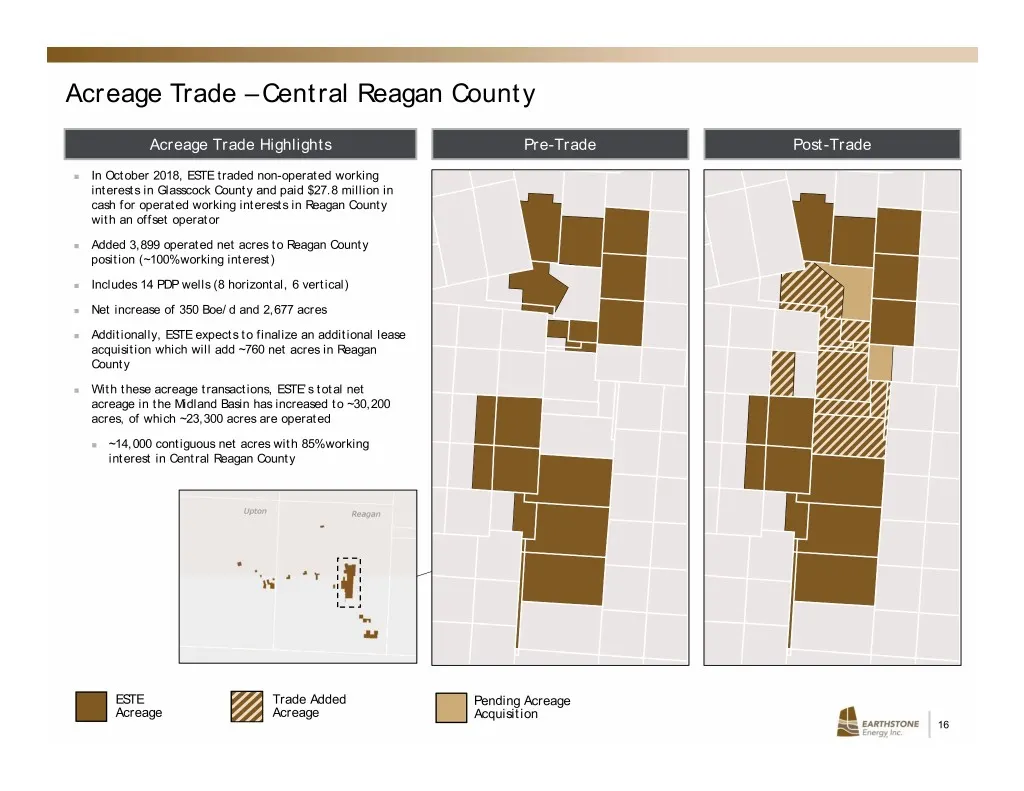
Acreage Trade – Central Reagan County Acreage Trade Highlights Pre-Trade Post-Trade In October 2018, ESTE traded non-operated working interests in Glasscock County and paid $27.8 million in cash for operated working interests in Reagan County with an offset operator Added 3,899 operated net acre
Slide 17: Eagle Ford Asset Overview
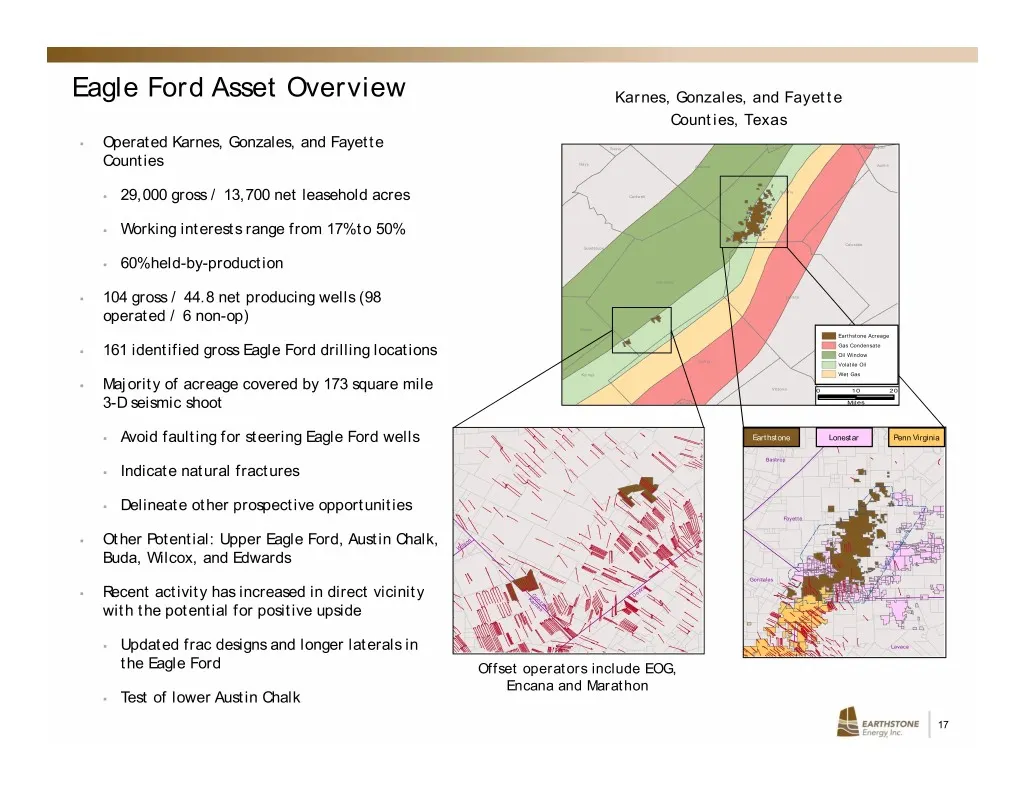
Eagle Ford Asset Overview Karnes, Gonzales, and Fayette Counties, Texas . Operated Karnes, Gonzales, and Fayette Lee Washington Tr av is Hays Counties Bastrop Austin Fa yet te . 29,000 gross / 13,700 net leasehold acres Caldwell . Working interests range from 17% to 50% Colorado Guadalupe . 60% held
Slide 18: Recent Eagle Ford Activity
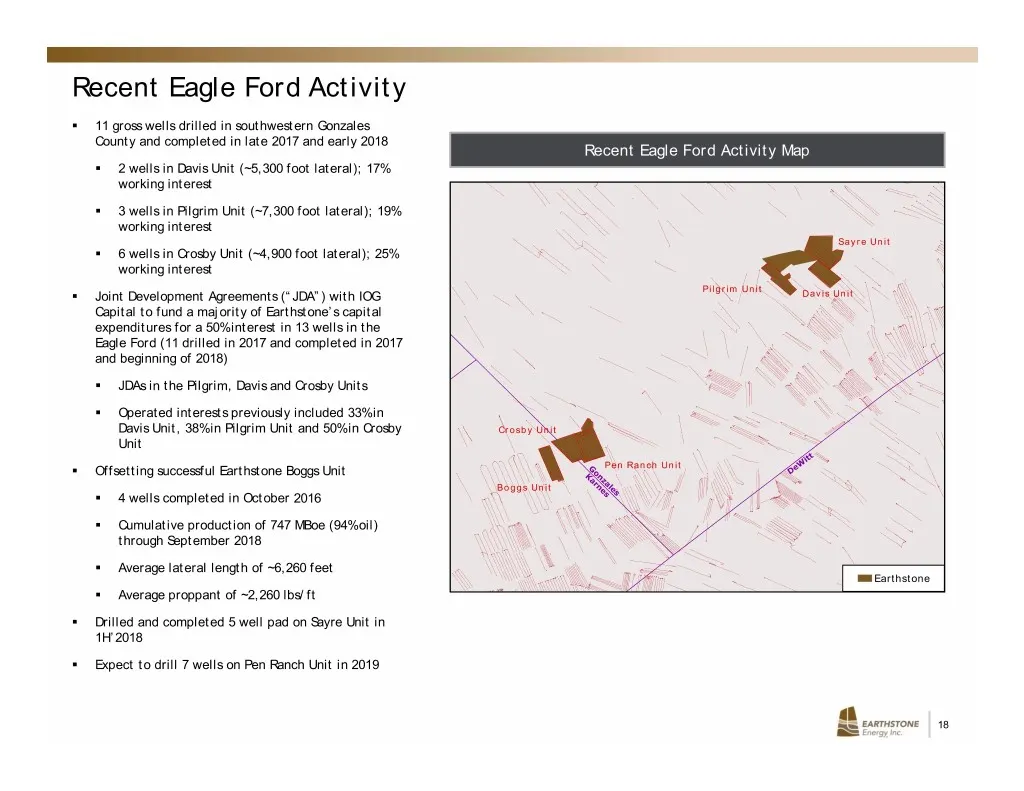
Recent Eagle Ford Activity . 11 gross wells drilled in southwestern Gonzales County and completed in late 2017 and early 2018 Recent Eagle Ford Activity Map . 2 wells in Davis Unit (~5,300 foot lateral); 17% working interest . 3 wells in Pilgrim Unit (~7,300 foot lateral); 19% working interest Sayre
Slide 19: Financial Overview
Financial Overview 19
Slide 20: Capital Budget, Guidance and Liquidity
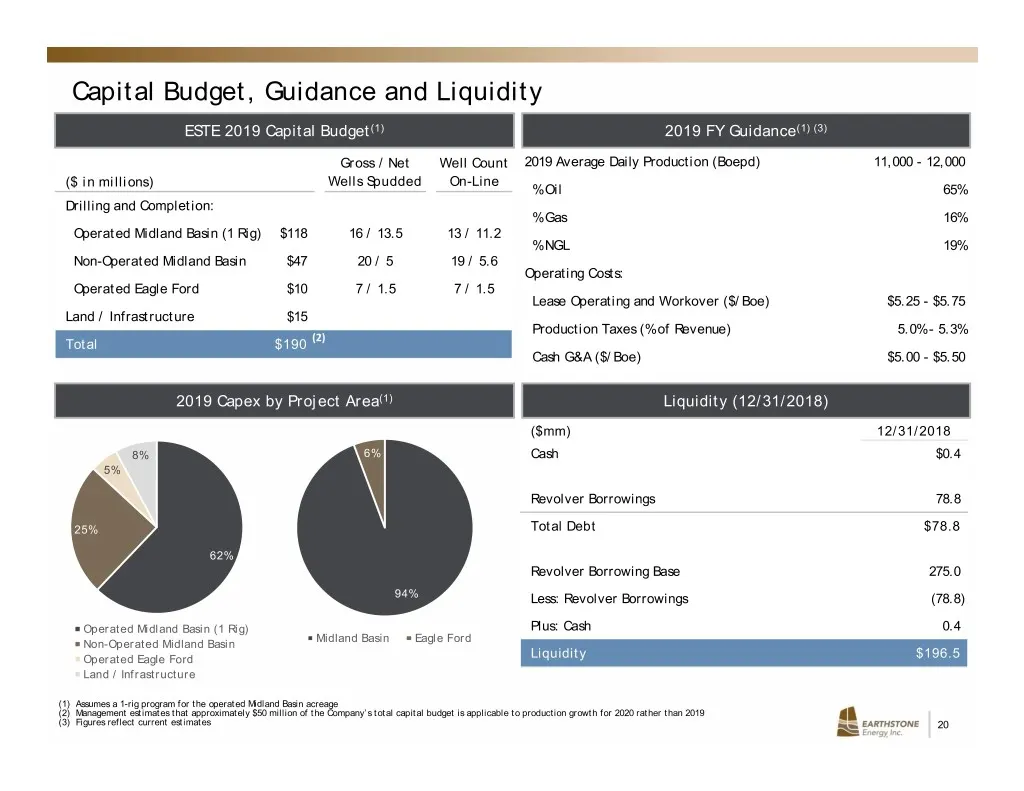
Capital Budget, Guidance and Liquidity ESTE 2019 Capital Budget(1) 2019 FY Guidance(1) (3) Gross / Net Well Count 2019 Average Daily Production (Boepd) 11,000 - 12,000 ($ in millions) Wells Spudded On-Line % Oil 65% Drilling and Completion: % Gas 16% Operated Midland Basin (1 Rig) $118 16 / 13.5 13
Slide 21: Hedge Book Summary
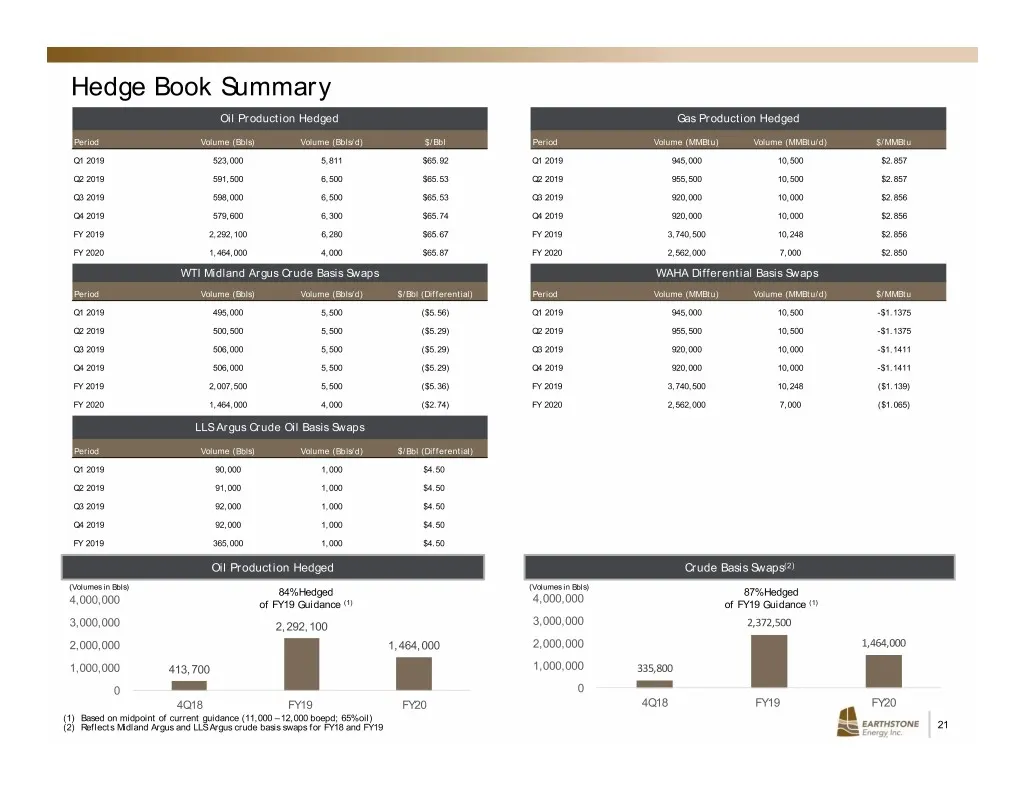
Hedge Book Summary Oil Production Hedged Gas Production Hedged Period Volume (Bbls) Volume (Bbls/d) $/Bbl Period Volume (MMBtu) Volume (MMBtu/d) $/MMBtu Q1 2019 523,000 5,811 $65.92 Q1 2019 945,000 10,500 $2.857 Q2 2019 591,500 6,500 $65.53 Q2 2019 955,500 10,500 $2.857 Q3 2019 598,000 6,500 $65.53
Slide 22: Analyst Coverage
Analyst Coverage Firm Analyst Contact Info Baird Joseph Allman / 646-557-3209 / [email protected] Coker Palmer David Beard / 631-725-8810 / [email protected] Alliance Global Partners Joel Musante / 203-349-4782 / [email protected] Imperial Capital Jason Wangler / 713-892-5603 / jwangler@
Slide 23: Contact Information
Contact Information Mark Lumpkin, Jr. EVP, Chief Financial Officer Scott Thelander Vice President of Finance Corporate Offices Houston 1400 Woodloch Forest Drive | Suite 300 | The Woodlands, TX 77380 | (281) 298-4246 Midland 600 N. Marienfeld | Suite 1000 | Midland, TX 79701 | (432) 686-1100 Website
Slide 24: Reconciliation of Non-GAAP Financial Measure
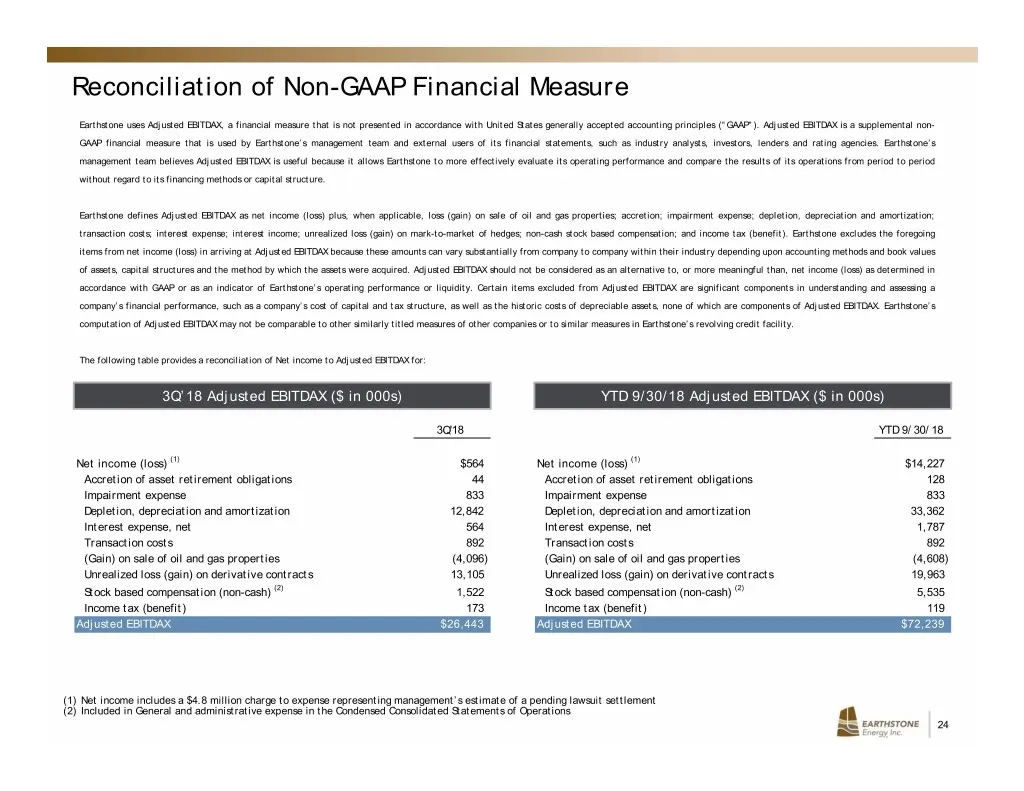
Reconciliation of Non-GAAP Financial Measure Earthstone uses Adjusted EBITDAX, a financial measure that is not presented in accordance with United States generally accepted accounting principles (“GAAP”). Adjusted EBITDAX is a supplemental non- GAAP financial measure that is used by Earthstone’s man
Source: SEC EDGAR · 8-K filed Jan 16, 2019
More decks from Earthstone Energy Inc
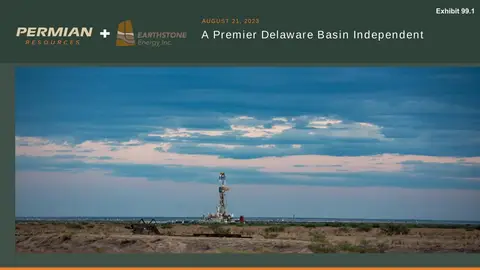 Merger or Acquisition (August 2023)20 slides · Aug 23, 2023
 EnerCom Denver 202332 slides · Aug 14, 2023
 Q2 2023 Earnings Presentation25 slides · Aug 2, 2023
 Investor Presentation (June 2023)29 slides · Jun 20, 2023
 Merger or Acquisition (June 2023)16 slides · Jun 16, 2023
 Q1 2023 Earnings Presentation33 slides · May 3, 2023