Mr. Cooper — Barclays Global Financial Services Conference 2019
25 slides from Mr. Cooper's conference presentation, Sep 9, 2019

Slide 1: Investor Update
Investor UpdateBarclays Global Financial Services Conference September 10, 2019
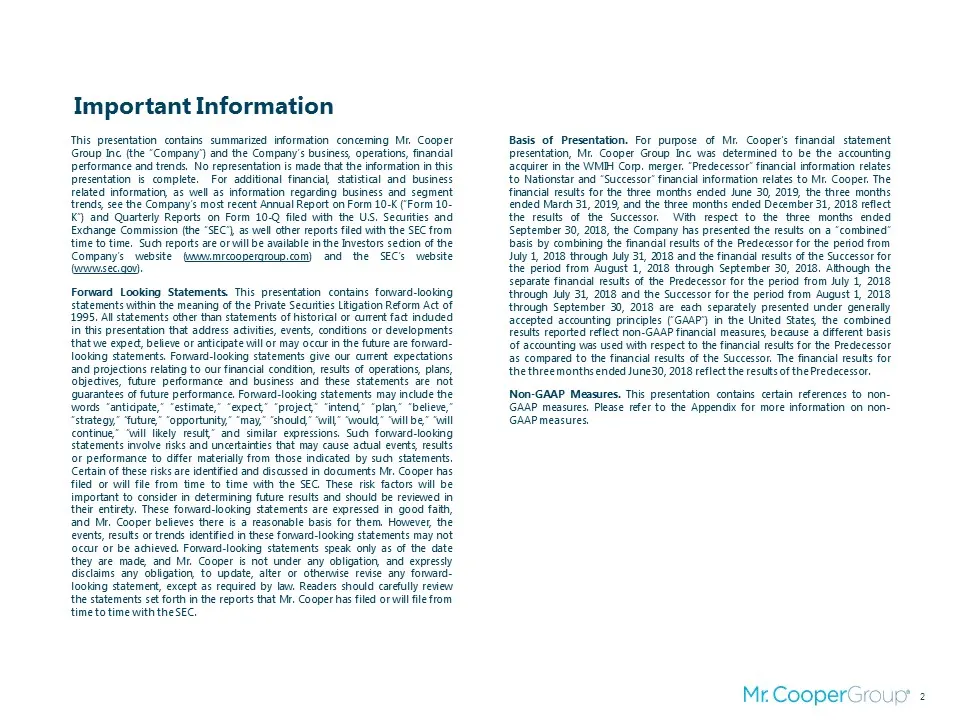
Slide 2: Forward Looking Statements
This presentation contains summarized information concerning Mr. Cooper Group Inc. (the “Company”) and the Company’s business, operations, financial performance and trends. No representation is made that the information in this presentation is complete. For additional financial, statistical and busi
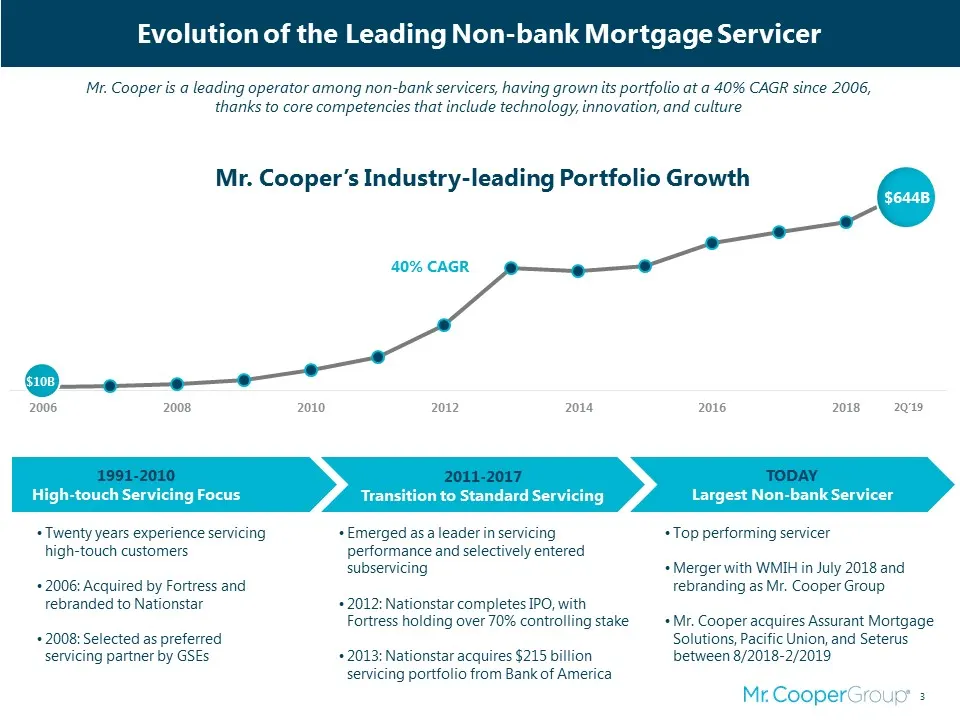
Slide 3: Industry-leading Portfolio Growth: Evolution of the Leading Non-bank Mortgage Servicer
40% CAGR Mr. Cooper’s Industry-leading Portfolio Growth Evolution of the Leading Non-bank Mortgage Servicer $10B $644B Mr. Cooper is a leading operator among non-bank servicers, having grown its portfolio at a 40% CAGR since 2006, thanks to core competencies that include technology, innovation, and
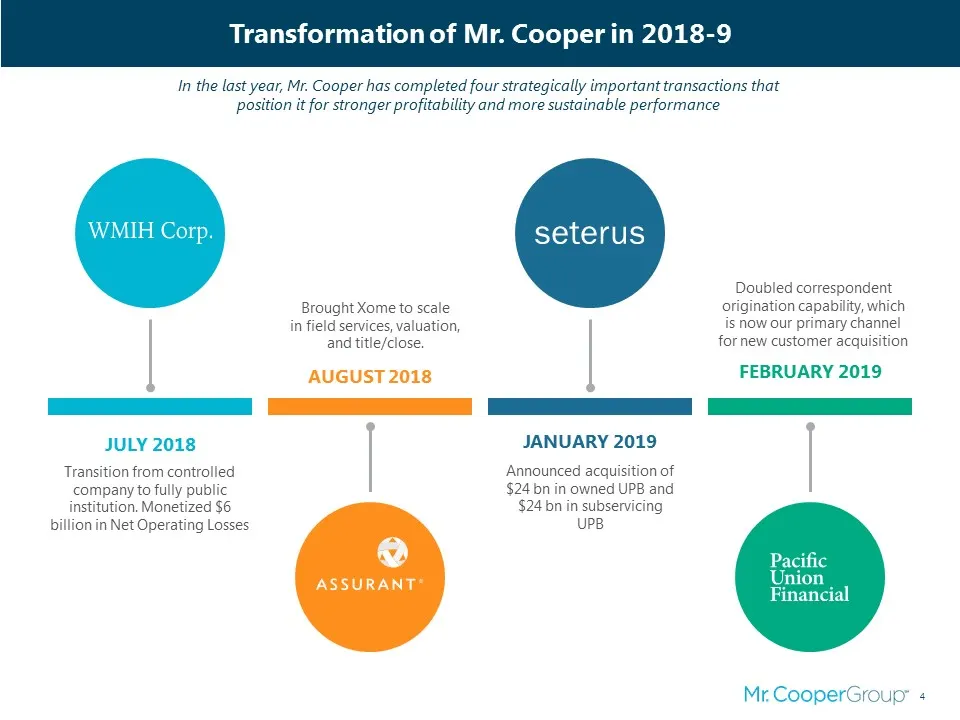
Slide 4: Transformation of Mr. Cooper in 2018-9
Transition from controlled company to fully public institution. Monetized $6 billion in Net Operating Losses JULY 2018 Brought Xome to scale in field services, valuation, and title/close. AUGUST 2018 Announced acquisition of $24 bn in owned UPB and $24 bn in subservicing UPB JANUARY 2019 Doubled cor
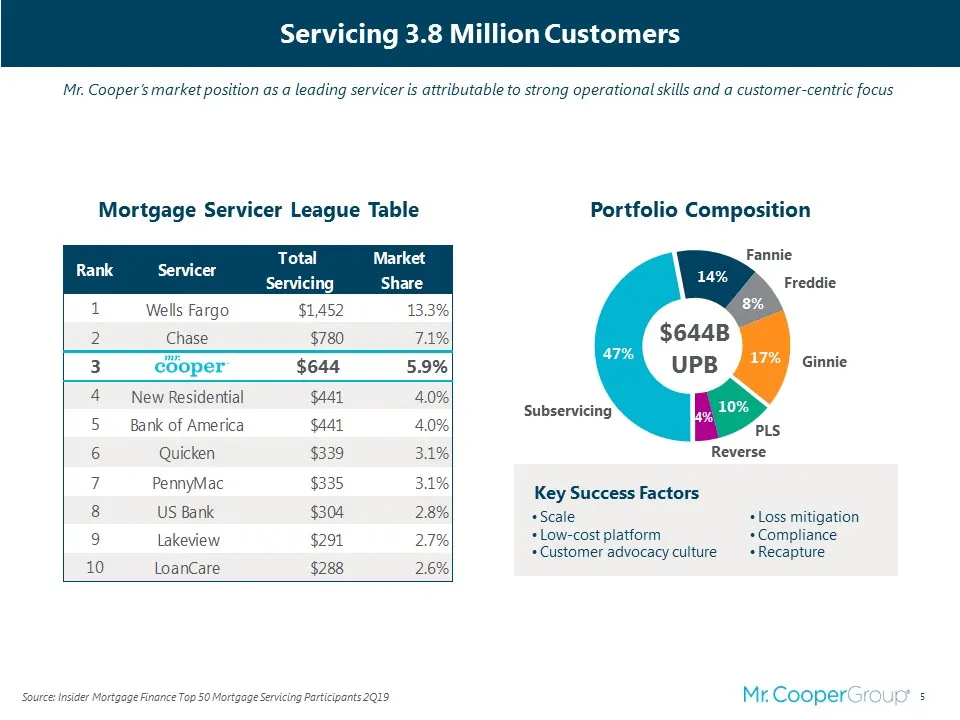
Slide 5: Key Success Factors
Key Success Factors Servicing 3.8 Million Customers Mortgage Servicer League Table Portfolio Composition Source: Insider Mortgage Finance Top 50 Mortgage Servicing Participants 2Q19 ScaleLow-cost platformCustomer advocacy culture Loss mitigationComplianceRecapture Mr. Cooper’s market position as a l
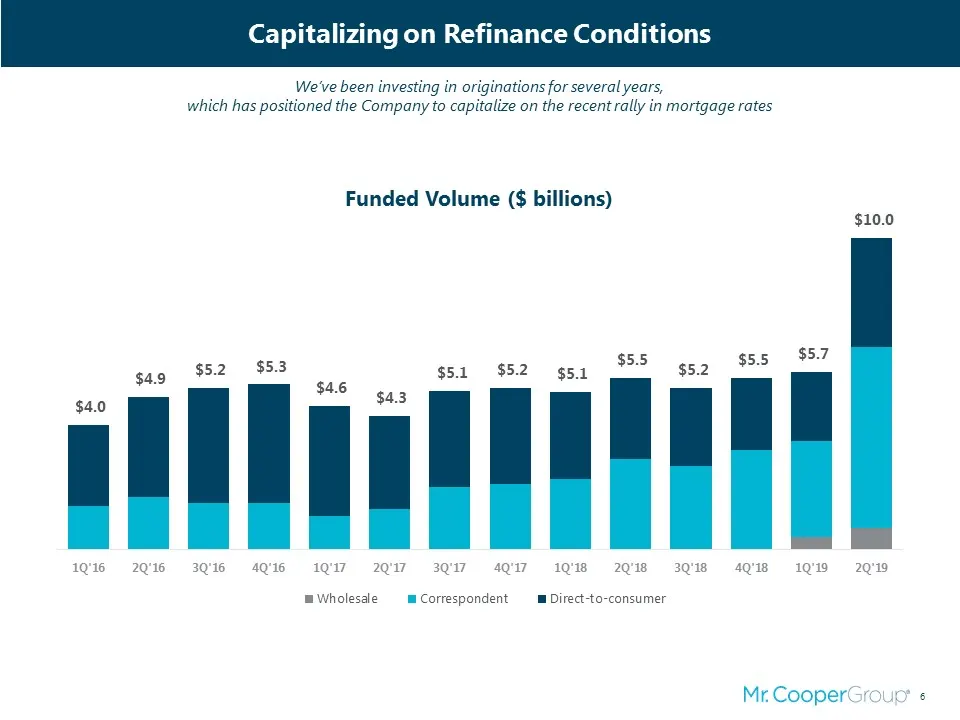
Slide 6: Capitalizing on Refinance Conditions
Capitalizing on Refinance Conditions Funded Volume ($ billions) We’ve been investing in originations for several years, which has positioned the Company to capitalize on the recent rally in mortgage rates
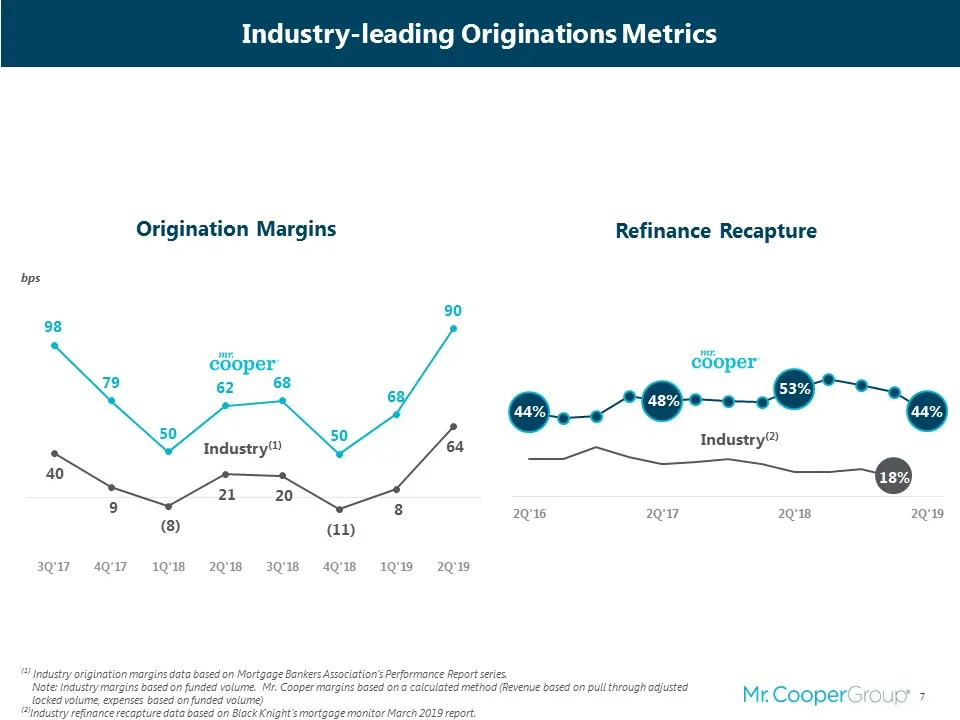
Slide 7: Industry-leading Originations Metrics
Industry(2) Industry-leading Originations Metrics Origination Margins bps Refinance Recapture Industry(1) ⁽¹⁾ Industry origination margins data based on Mortgage Bankers Association’s Performance Report series. Note: Industry margins based on funded volume. Mr. Cooper margins based on a calculated m
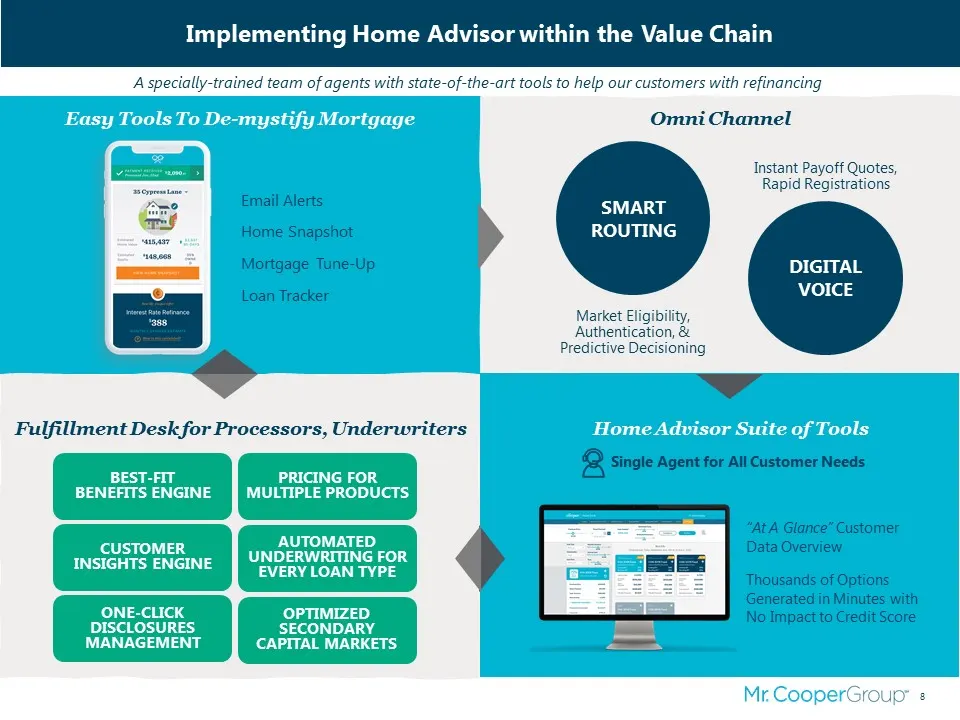
Slide 8: Implementing Home Advisor within the Value Chain
A specially-trained team of agents with state-of-the-art tools to help our customers with refinancing Implementing Home Advisor within the Value Chain Easy Tools To De-mystify Mortgage SMART ROUTING Market Eligibility, Authentication, & Predictive Decisioning DIGITAL VOICE Instant Payoff Quotes, Rap
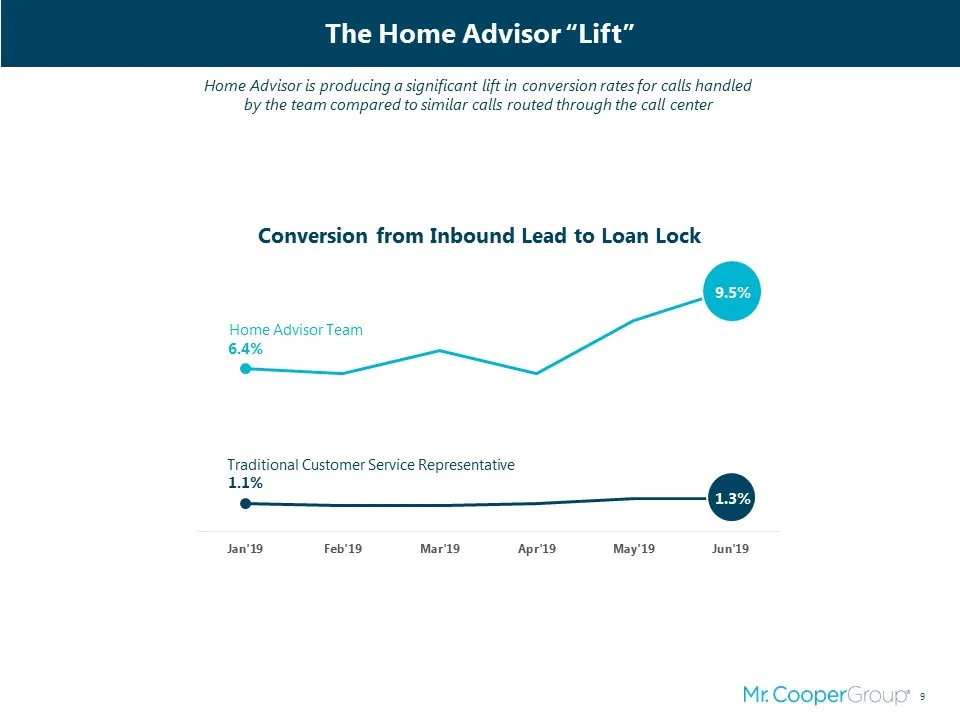
Slide 9: The Home Advisor Lift
The Home Advisor “Lift” Home Advisor Team Traditional Customer Service Representative Conversion from Inbound Lead to Loan Lock Home Advisor is producing a significant lift in conversion rates for calls handled by the team compared to similar calls routed through the call center 9.5% 1.3%
Slide 10: Fostering a High-Trust Environment
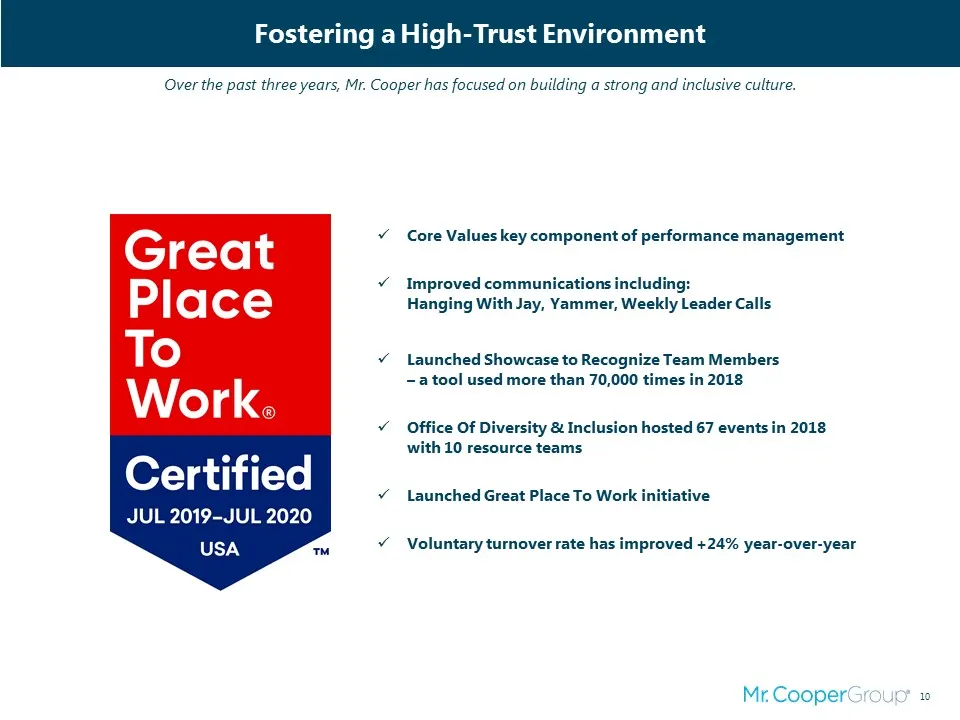
Fostering a High-Trust Environment Over the past three years, Mr. Cooper has focused on building a strong and inclusive culture. Core Values key component of performance managementImproved communications including: Hanging With Jay, Yammer, Weekly Leader CallsLaunched Showcase to Recognize Team Memb
Slide 11: Second Quarter Highlights
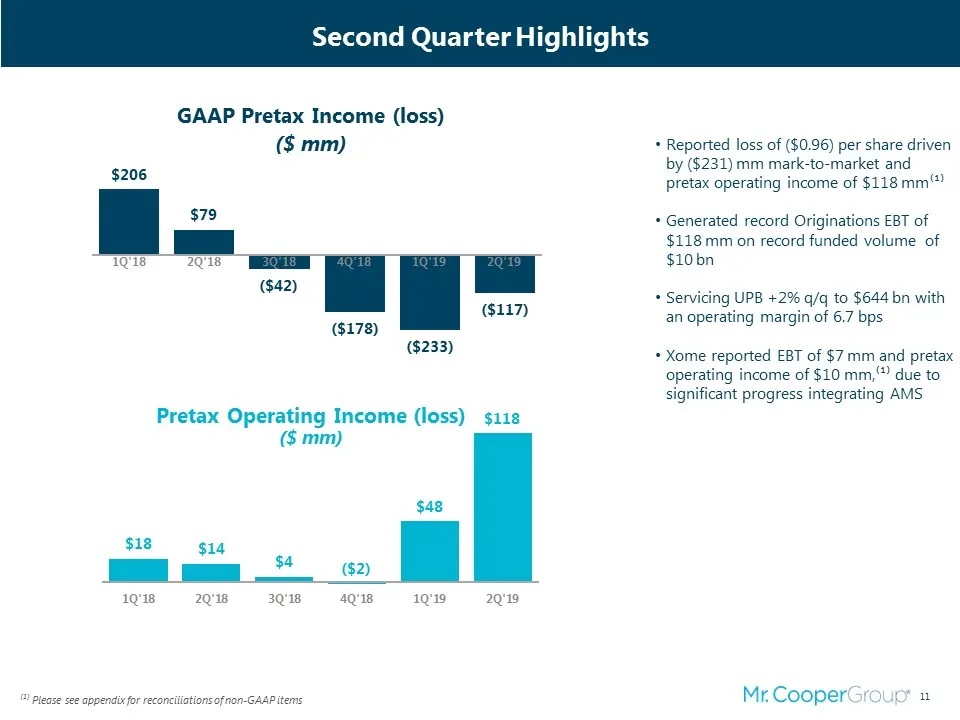
⁽¹⁾ Please see appendix for reconciliations of non-GAAP items Second Quarter Highlights Reported loss of ($0.96) per share driven by ($231) mm mark-to-market and pretax operating income of $118 mm⁽¹⁾Generated record Originations EBT of $118 mm on record funded volume of $10 bnServicing UPB +2% q/q t
Slide 12: Record Originations Results in 2Q'19
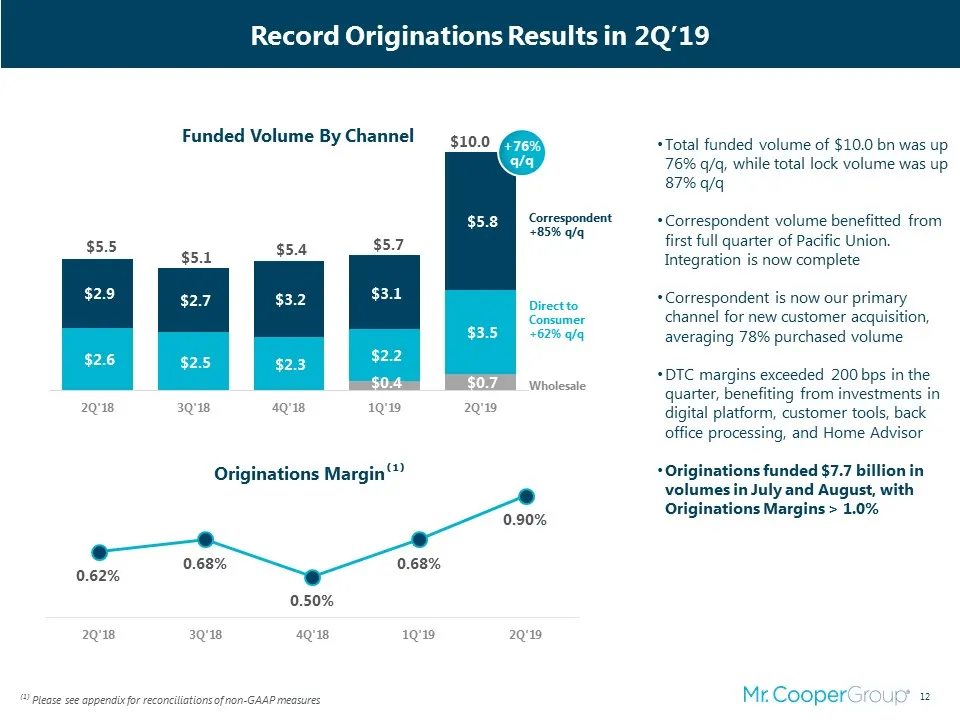
Total funded volume of $10.0 bn was up 76% q/q, while total lock volume was up 87% q/qCorrespondent volume benefitted from first full quarter of Pacific Union. Integration is now completeCorrespondent is now our primary channel for new customer acquisition, averaging 78% purchased volumeDTC margins
Slide 13: Servicing Portfolio +2% q/q during 2Q'19
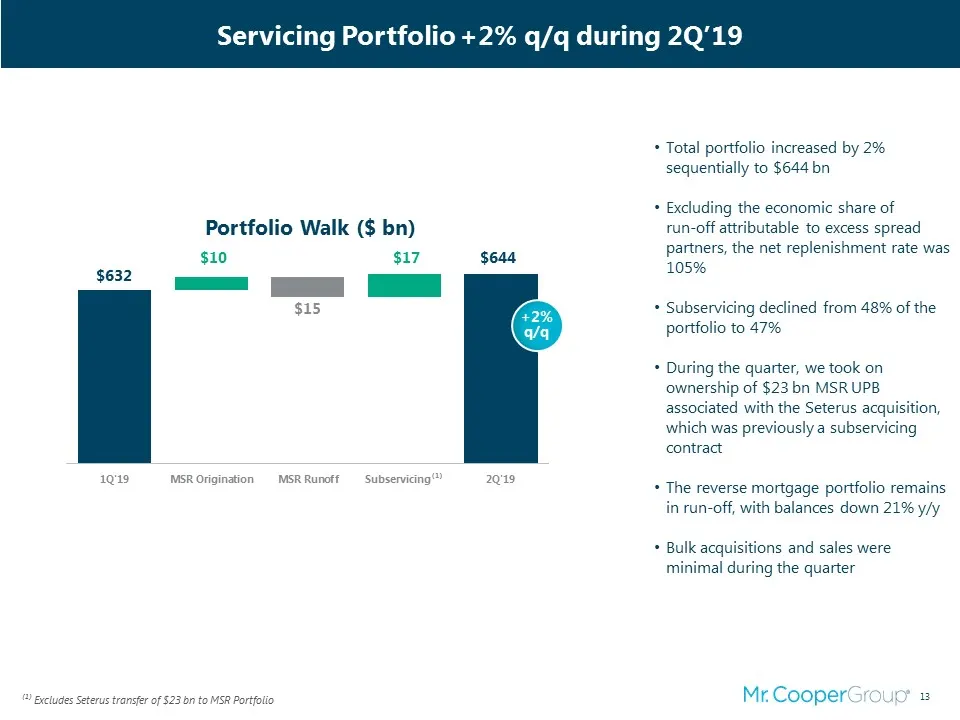
Servicing Portfolio +2% q/q during 2Q’19 Total portfolio increased by 2% sequentially to $644 bnExcluding the economic share of run-off attributable to excess spread partners, the net replenishment rate was 105%Subservicing declined from 48% of the portfolio to 47%During the quarter, we took on owne
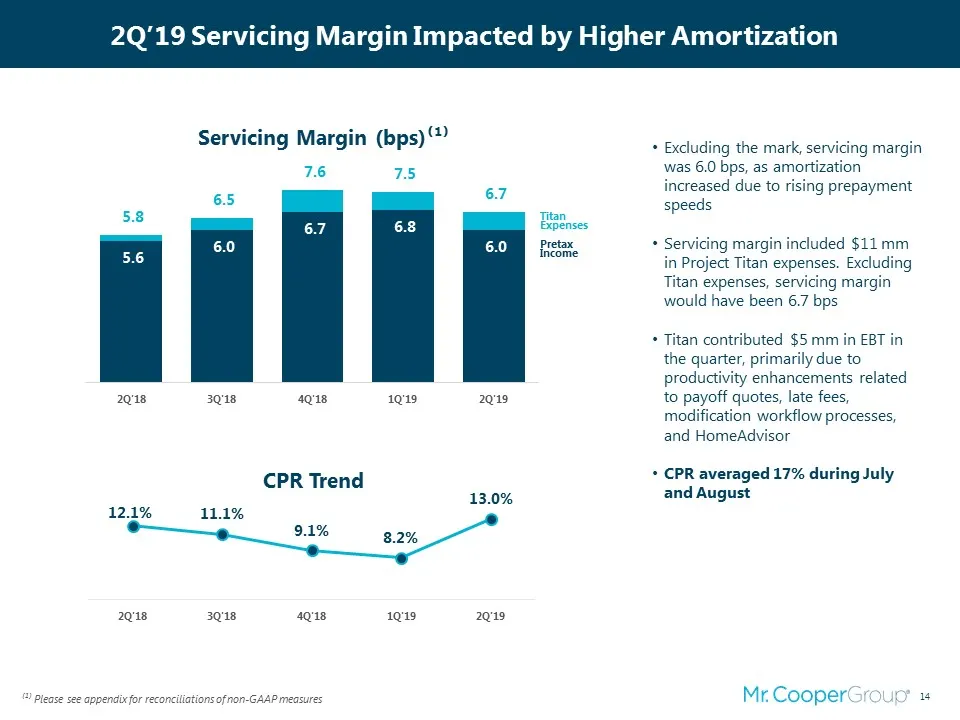
Slide 14: 2Q'19 Servicing Margin Impacted by Higher Amortization
Pretax Income TitanExpenses Servicing Margin (bps)⁽¹⁾ 2Q’19 Servicing Margin Impacted by Higher Amortization Excluding the mark, servicing margin was 6.0 bps, as amortization increased due to rising prepayment speedsServicing margin included $11 mm in Project Titan expenses. Excluding Titan expenses
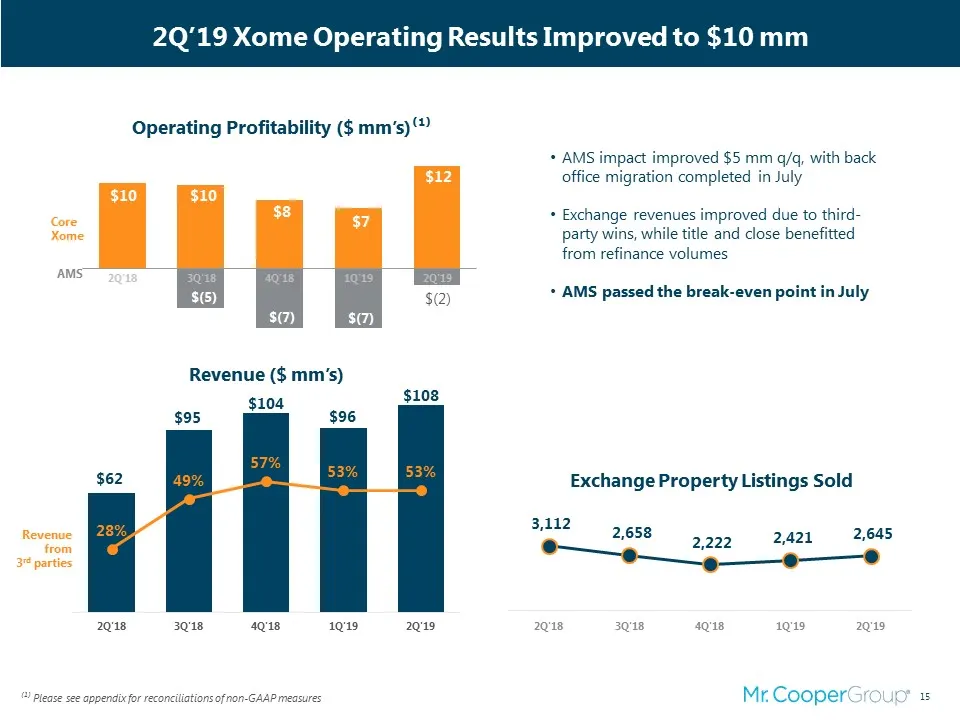
Slide 15: 2Q'19 Xome Operating Results Improved to $10 mm
AMS impact improved $5 mm q/q, with back office migration completed in JulyExchange revenues improved due to third-party wins, while title and close benefitted from refinance volumesAMS passed the break-even point in July ⁽¹⁾ Please see appendix for reconciliations of non-GAAP measures 2Q’19 Xome Op
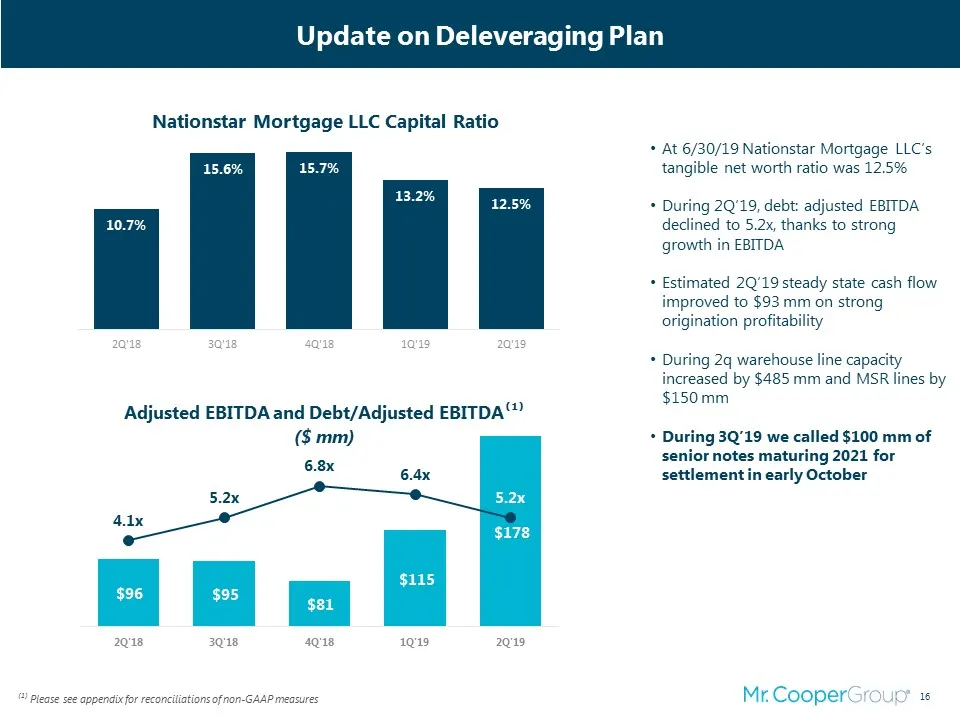
Slide 16: Update on Deleveraging Plan
Update on Deleveraging Plan ⁽¹⁾ Please see appendix for reconciliations of non-GAAP measures At 6/30/19 Nationstar Mortgage LLC’s tangible net worth ratio was 12.5%During 2Q’19, debt: adjusted EBITDA declined to 5.2x, thanks to strong growth in EBITDAEstimated 2Q’19 steady state cash flow improved t
Slide 17: Appendix
od Mr. CooperGroup Appendix
Slide 18: ROTCE Reconciliation
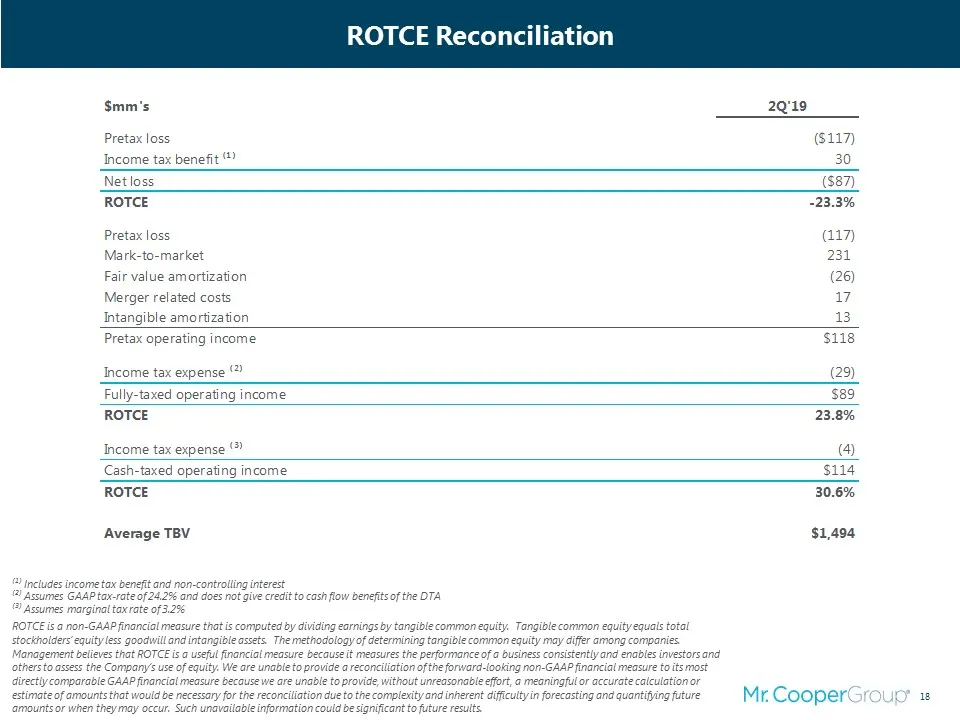
ROTCE Reconciliation ⁽¹⁾ Includes income tax benefit and non-controlling interest⁽²⁾ Assumes GAAP tax-rate of 24.2% and does not give credit to cash flow benefits of the DTA⁽³⁾ Assumes marginal tax rate of 3.2% ROTCE is a non-GAAP financial measure that is computed by dividing earnings by tangible c
Slide 19: Operating Pretax Income Reconciliation
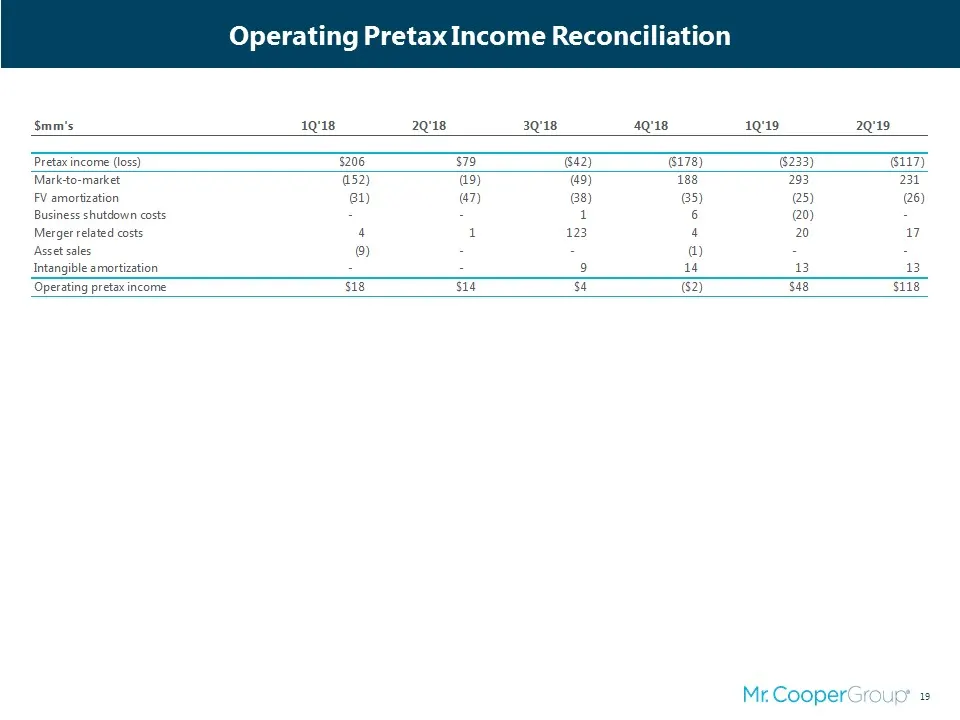
Operating Pretax Income Reconciliation
Slide 20: Servicing Non-GAAP Reconciliation
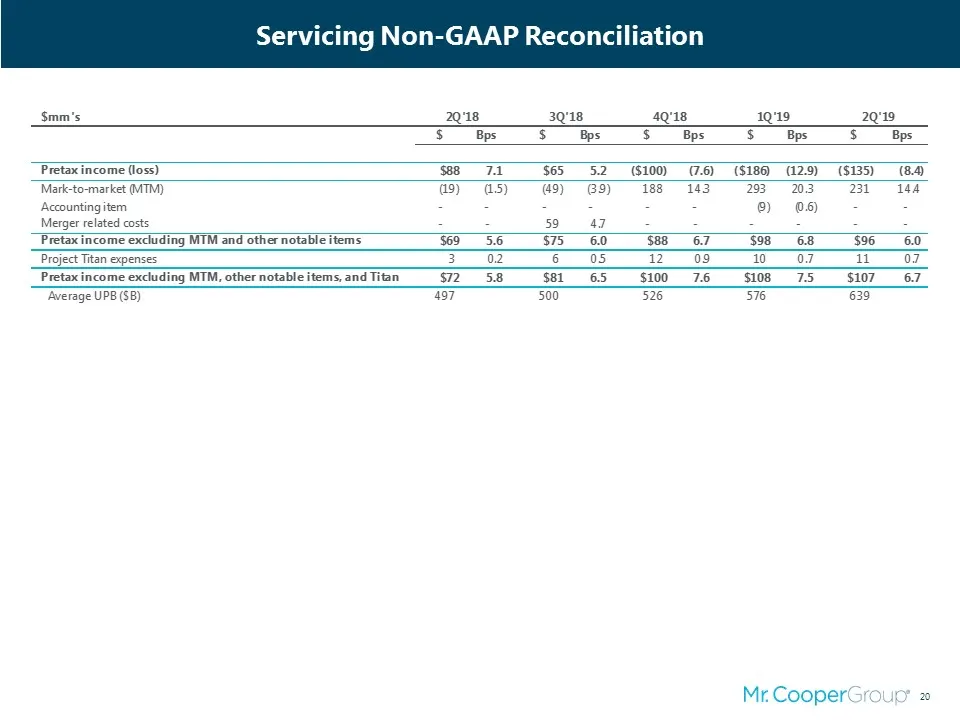
Servicing Non-GAAP Reconciliation
Slide 21: Servicing Portfolio
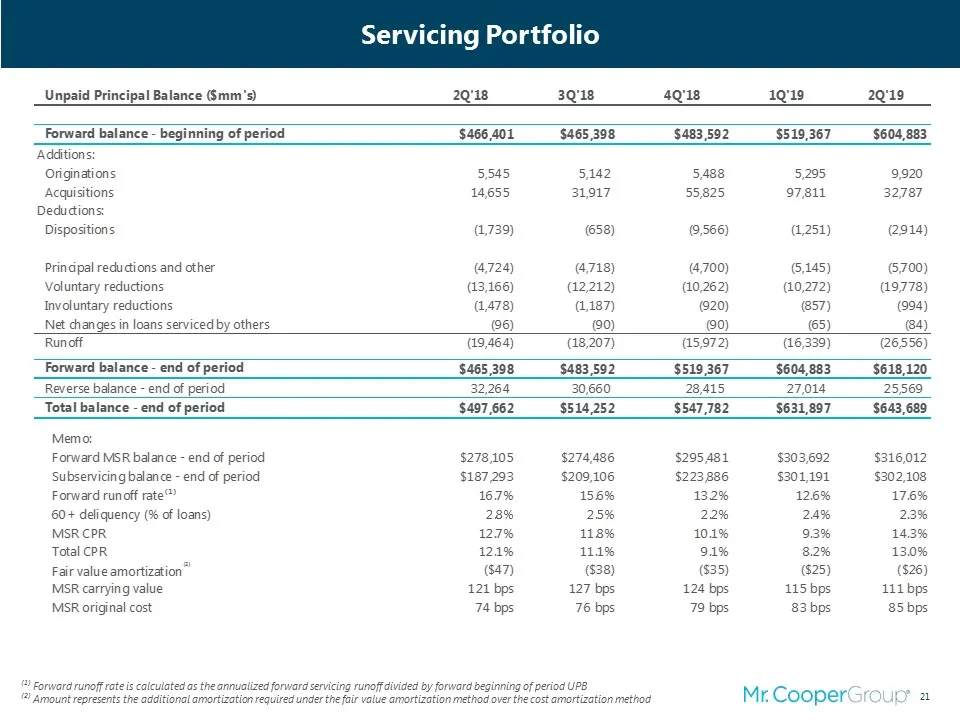
Servicing Portfolio ⁽¹⁾ Forward runoff rate is calculated as the annualized forward servicing runoff divided by forward beginning of period UPB ⁽²⁾ Amount represents the additional amortization required under the fair value amortization method over the cost amortization method
Slide 22: Originations Non-GAAP Reconciliation
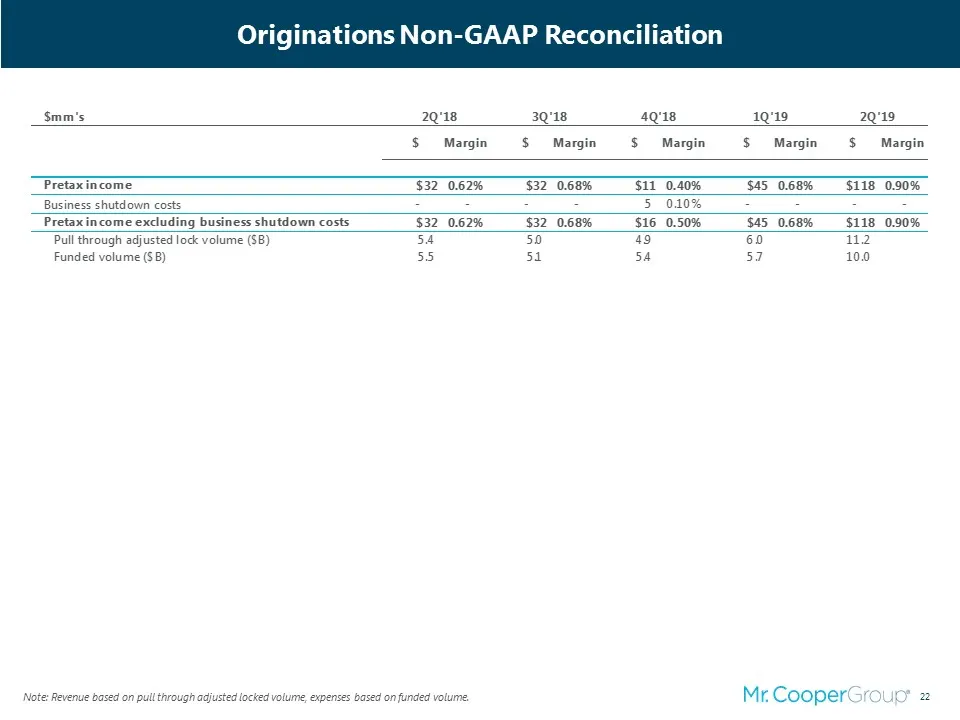
Originations Non-GAAP Reconciliation Note: Revenue based on pull through adjusted locked volume, expenses based on funded volume.
Slide 23: Xome Non-GAAP Reconciliation
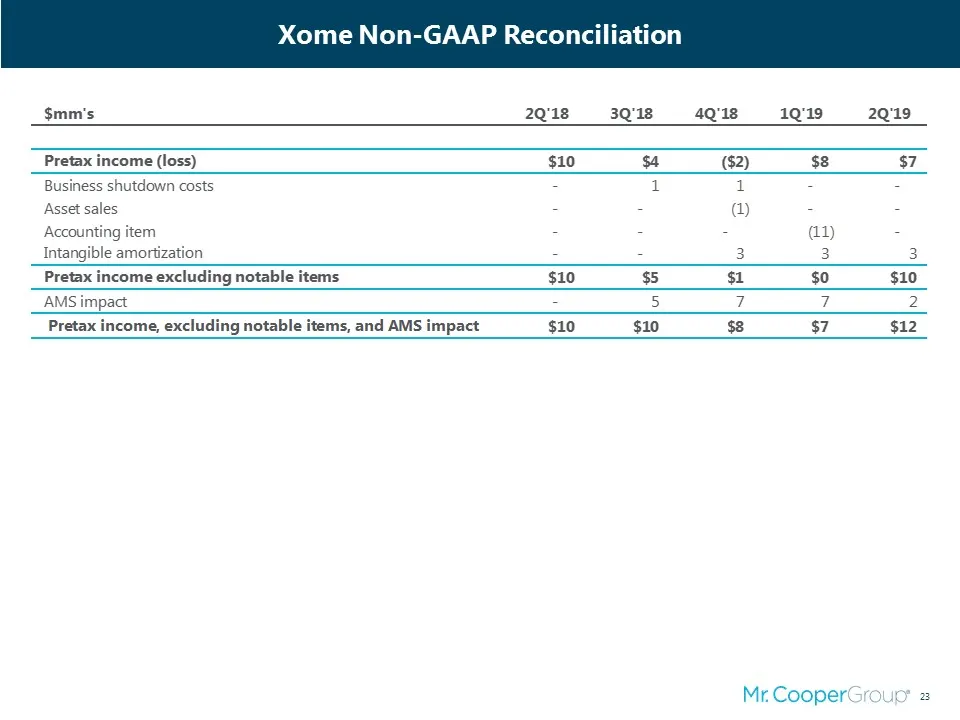
Xome Non-GAAP Reconciliation
Slide 24: Adjusted EBITDA
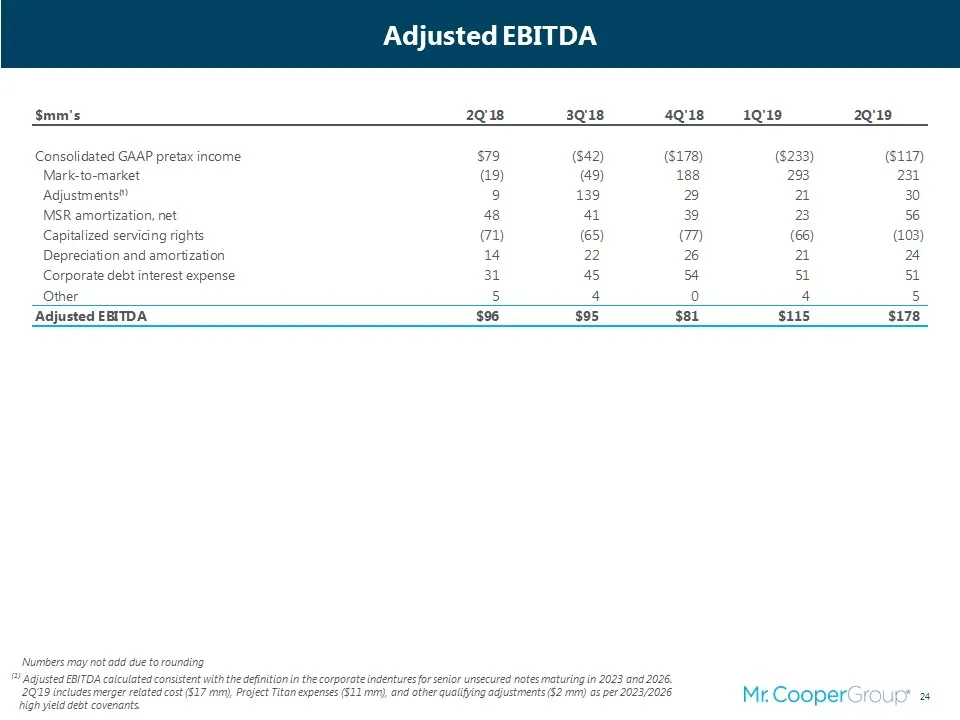
Adjusted EBITDA Numbers may not add due to rounding ⁽¹⁾ Adjusted EBITDA calculated consistent with the definition in the corporate indentures for senior unsecured notes maturing in 2023 and 2026. 2Q’19 includes merger related cost ($17 mm), Project Titan expenses ($11 mm), and other qualifying adjus
Slide 25: 2Q'19 Sources and Uses Cash Flow
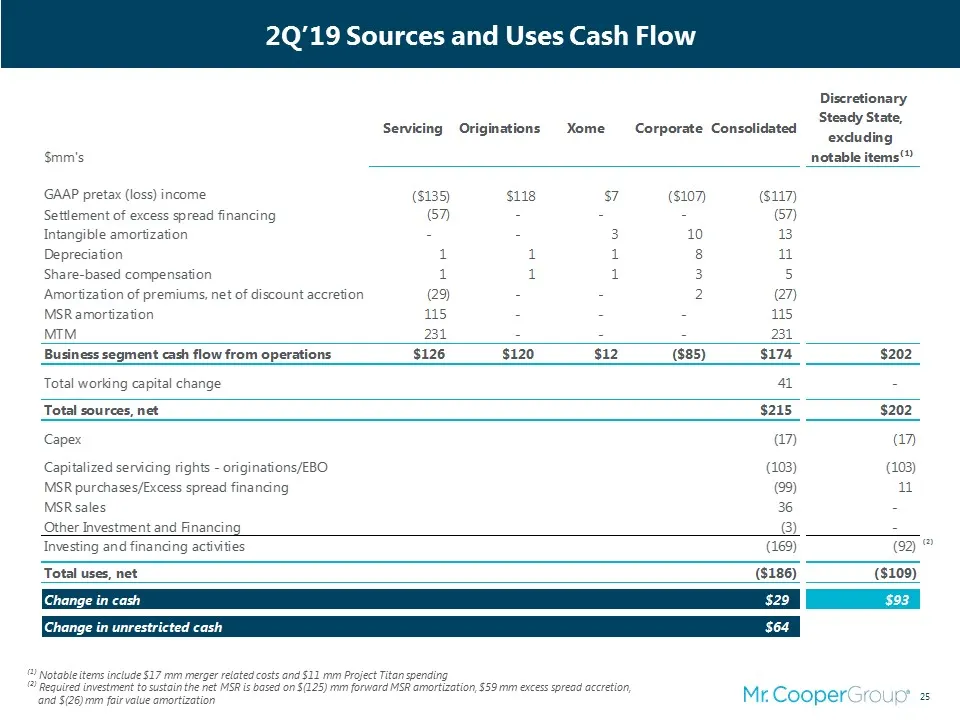
2Q’19 Sources and Uses Cash Flow ⁽¹⁾ Notable items include $17 mm merger related costs and $11 mm Project Titan spending⁽²⁾ Required investment to sustain the net MSR is based on $(125) mm forward MSR amortization, $59 mm excess spread accretion, and $(26) mm fair value amortization
Source: SEC EDGAR · 8-K filed Sep 9, 2019
More decks from Mr. Cooper Group Inc
 Q2 2025 Earnings Presentation25 slides · Jul 23, 2025
 Q1 2025 Earnings Presentation24 slides · Apr 23, 2025
 Merger or Acquisition (March 2025)23 slides · Mar 31, 2025
 Q4 2024 Earnings Presentation29 slides · Feb 12, 2025
 Q3 2024 Earnings Presentation29 slides · Oct 23, 2024
 Q2 2024 Earnings Presentation26 slides · Jul 25, 2024