Maxwell Technologies — 21st Annual Needham Growth Conference (January 2019)
15 slides from Maxwell Technologies's conference presentation, Jan 16, 2019
Slide 1: 21st Annual Needham Growth Conference
21st Annual Needham Growth Conference January 16, 2019 1
Slide 2: Safe Harbor
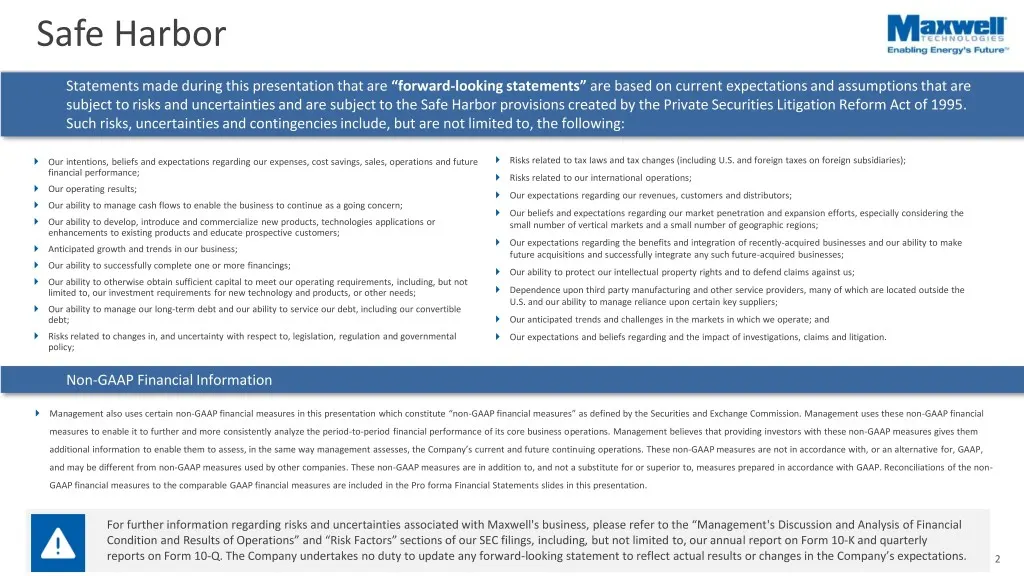
Safe Harbor Statements made during this presentation that are “forward-looking statements” are based on current expectations and assumptions that are subject to risks and uncertainties and are subject to the Safe Harbor provisions created by the Private Securities Litigation Reform Act of 1995. Such
Slide 3: Maxwell Technologies – At a Glance
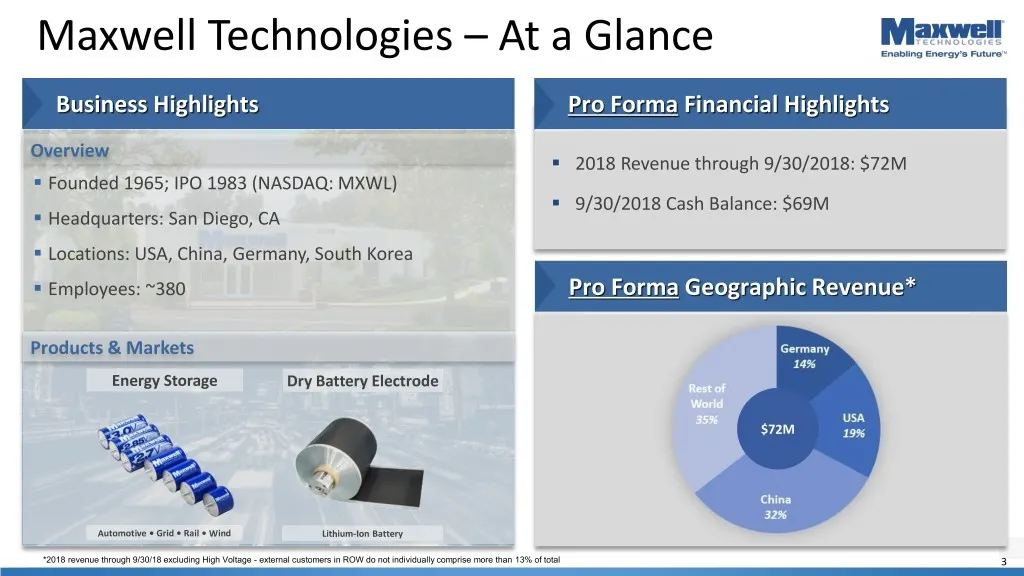
Maxwell Technologies – At a Glance Business Highlights Pro Forma Financial Highlights Overview . 2018 Revenue through 9/30/2018: $72M . Founded 1965; IPO 1983 (NASDAQ: MXWL) . 9/30/2018 Cash Balance: $69M . Headquarters: San Diego, CA . Locations: USA, China, Germany, South Korea . Employees: ~380 P
Slide 4: High Voltage Divestiture: A Strategic Transformation
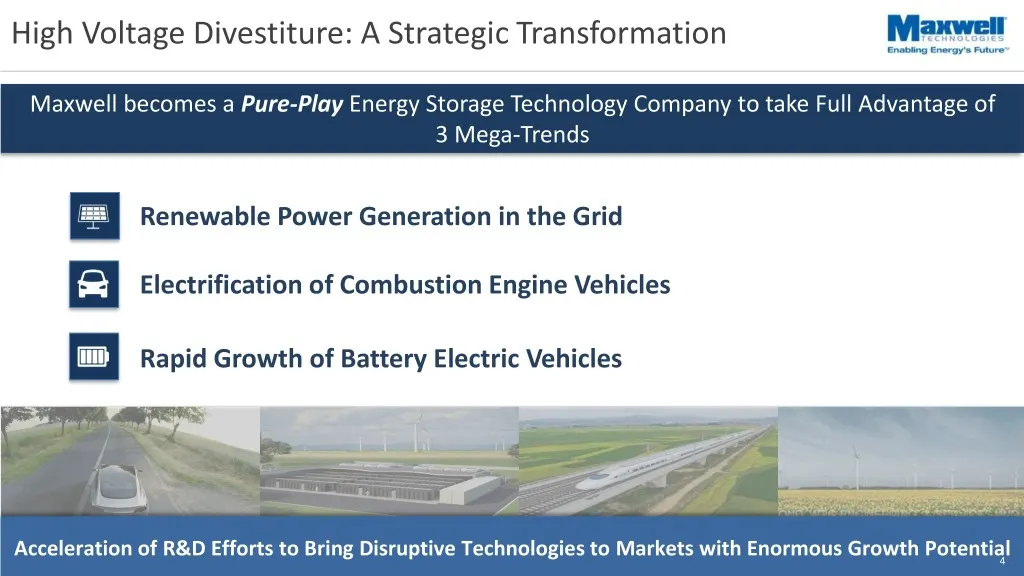
High Voltage Divestiture: A Strategic Transformation Maxwell becomes a Pure-Play Energy Storage Technology Company to take Full Advantage of 3 Mega-Trends Renewable Power Generation in the Grid Electrification of Combustion Engine Vehicles Rapid Growth of Battery Electric Vehicles Acceleration of R&
Slide 5: Overview of Deal Terms
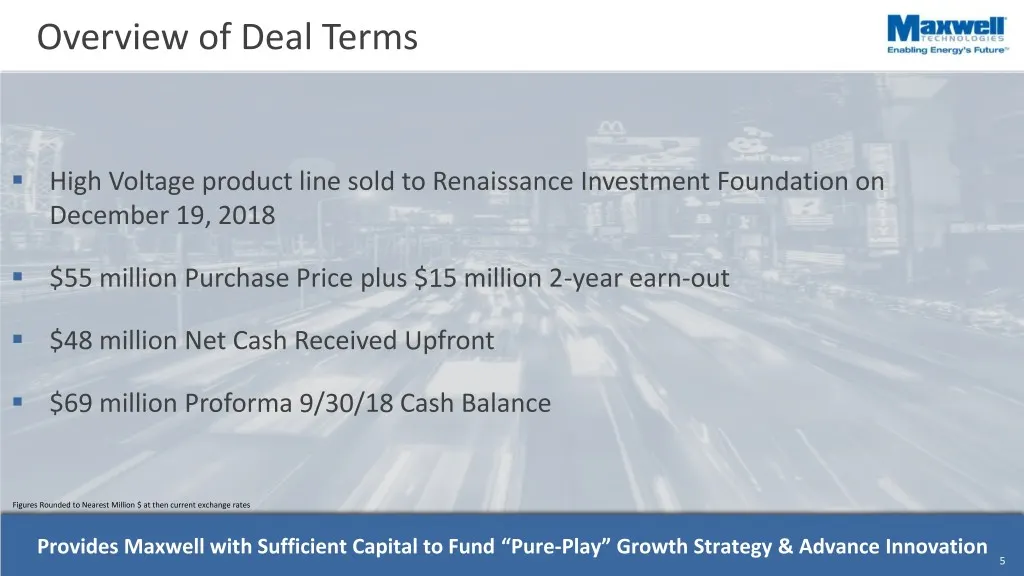
Overview of Deal Terms . High Voltage product line sold to Renaissance Investment Foundation on December 19, 2018 . $55 million Purchase Price plus $15 million 2-year earn-out . $48 million Net Cash Received Upfront . $69 million Proforma 9/30/18 Cash Balance Figures Rounded to Nearest Million $ at
Slide 6: Our Business Today: Pure Play Technology Platform in Growth Markets
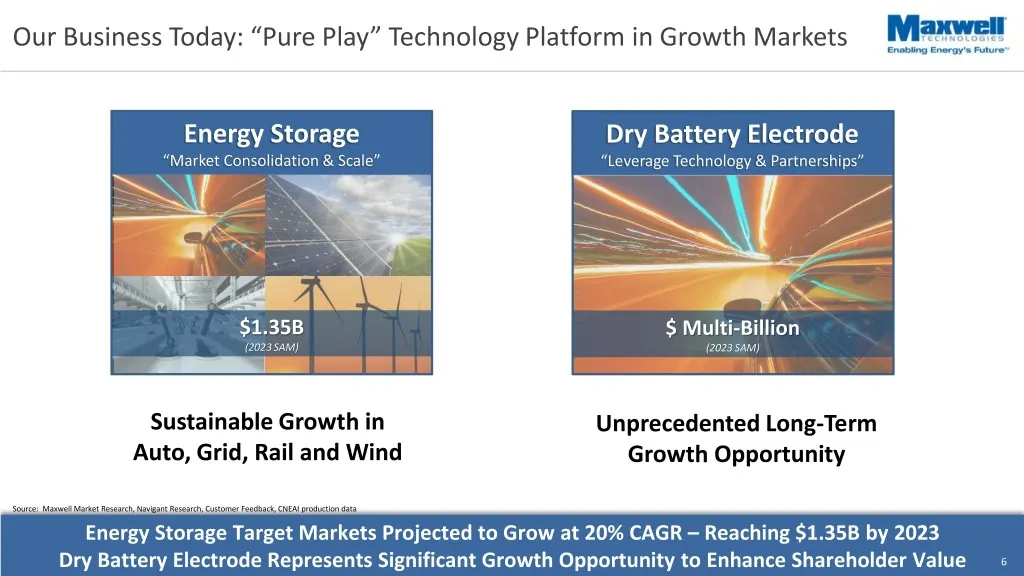
Our Business Today: “Pure Play” Technology Platform in Growth Markets Energy Storage Dry Battery Electrode “Market Consolidation & Scale” “Leverage Technology & Partnerships” $1.35B $ Multi-Billion (2023 SAM) (2023 SAM) Sustainable Growth in Unprecedented Long-Term Auto, Grid, Rail and Wind Growth O
Slide 7: Automotive Focus: Maxwell's Single Largest Growth Market
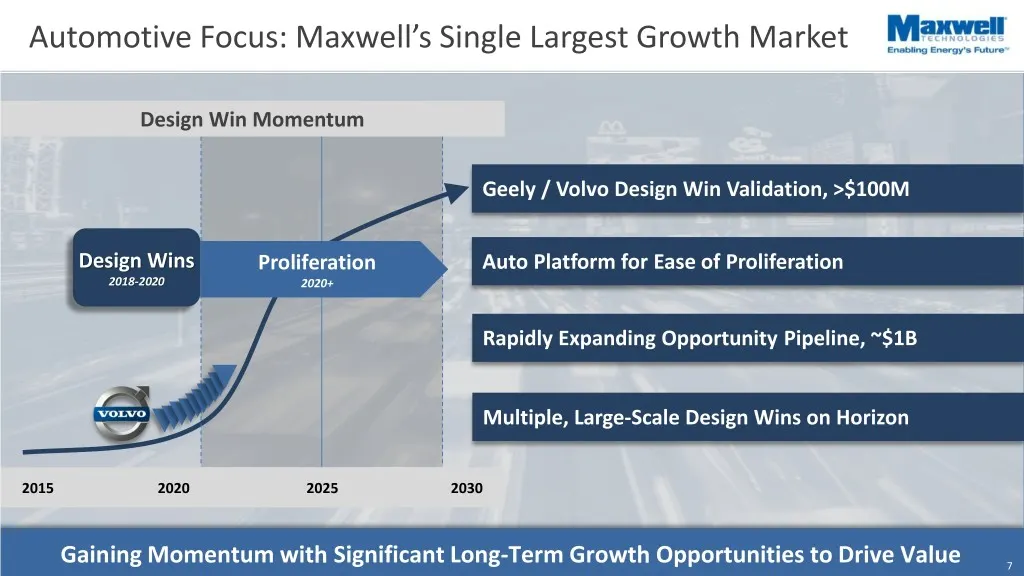
Automotive Focus: Maxwell’s Single Largest Growth Market Design Win Momentum Geely / Volvo Design Win Validation, >$100M Design Wins Proliferation Auto Platform for Ease of Proliferation 2018-2020 2020+ Rapidly Expanding Opportunity Pipeline, ~$1B Multiple, Large-Scale Design Wins on Horizon 2015 20
Slide 8: Energy Storage Focus Markets
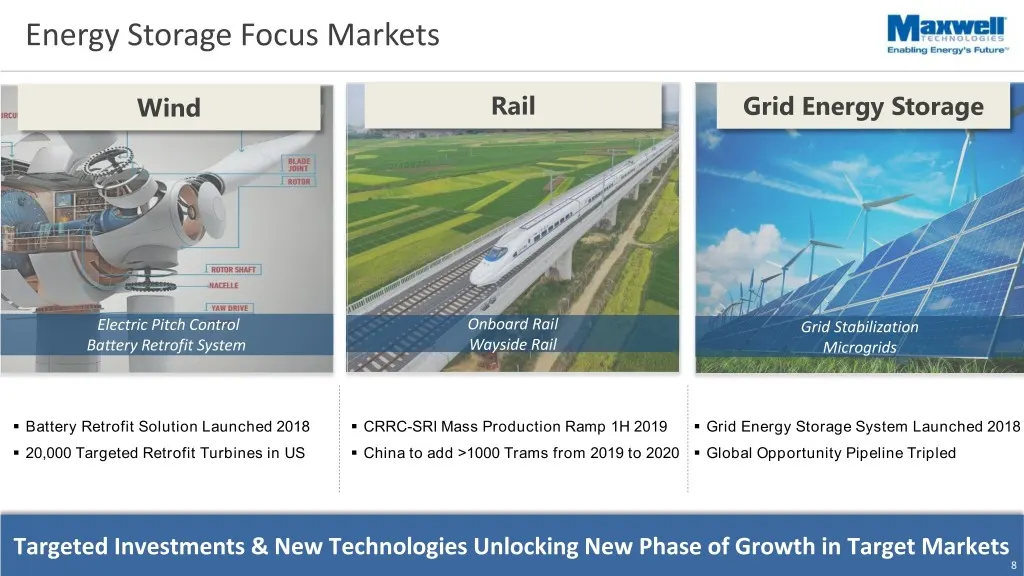
Energy Storage Focus Markets Wind Rail Grid Energy Storage E-Active Suspension Ramping Back Up Power Momentum Electric Pitch Control Onboard Rail Grid Stabilization Battery Retrofit System Wayside Rail Microgrids . Battery Retrofit Solution Launched 2018 . CRRC-SRI Mass Production Ramp 1H 2019 . Gri
Slide 9: Rapid Growth of Battery Electric Vehicles: Global Megatrend
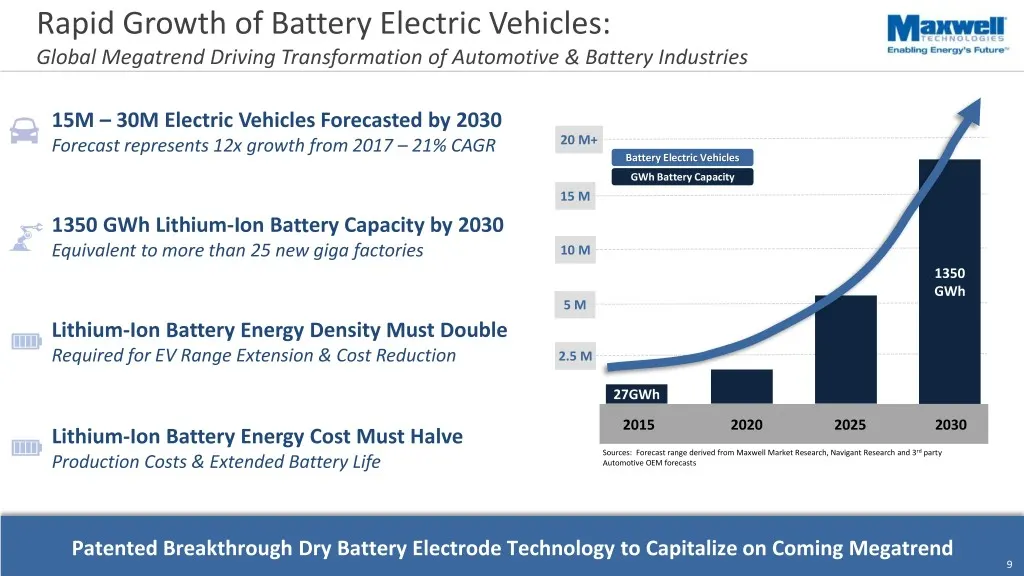
Rapid Growth of Battery Electric Vehicles: Global Megatrend Driving Transformation of Automotive & Battery Industries 15M – 30M Electric Vehicles Forecasted by 2030 Forecast represents 12x growth from 2017 – 21% CAGR 20 M+ Battery Electric Vehicles GWh Battery Capacity 15 M 1350 GWh Lithium-Ion Batt
Slide 10: Dry Battery Electrode: Completing Major Performance Milestones
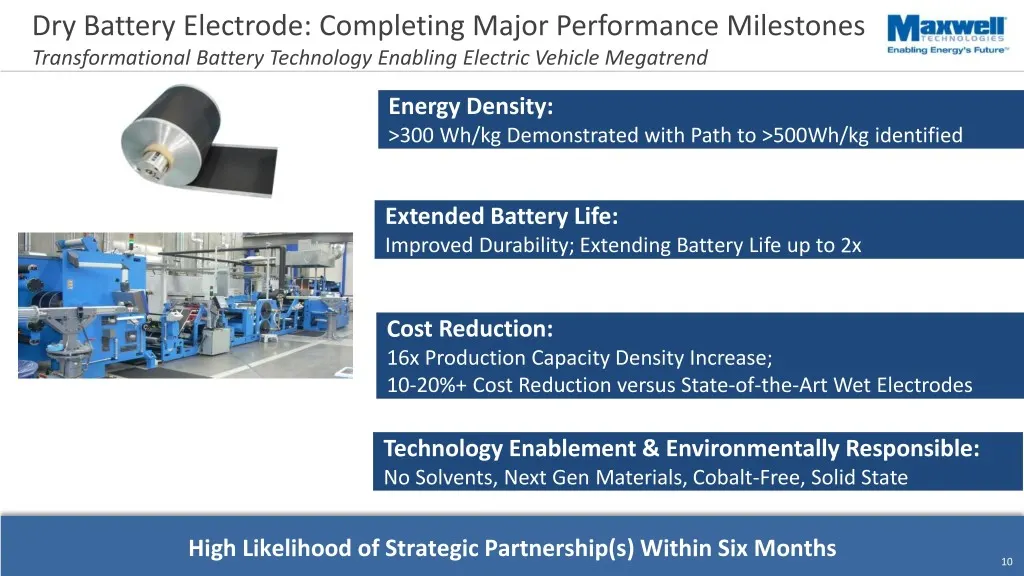
Dry Battery Electrode: Completing Major Performance Milestones Transformational Battery Technology Enabling Electric Vehicle Megatrend Energy Density: >300 Wh/kg Demonstrated with Path to >500Wh/kg identified Extended Battery Life: Improved Durability; Extending Battery Life up to 2x Cost Reduction:
Slide 11: Our Focus is Clear – Now it's About Execution
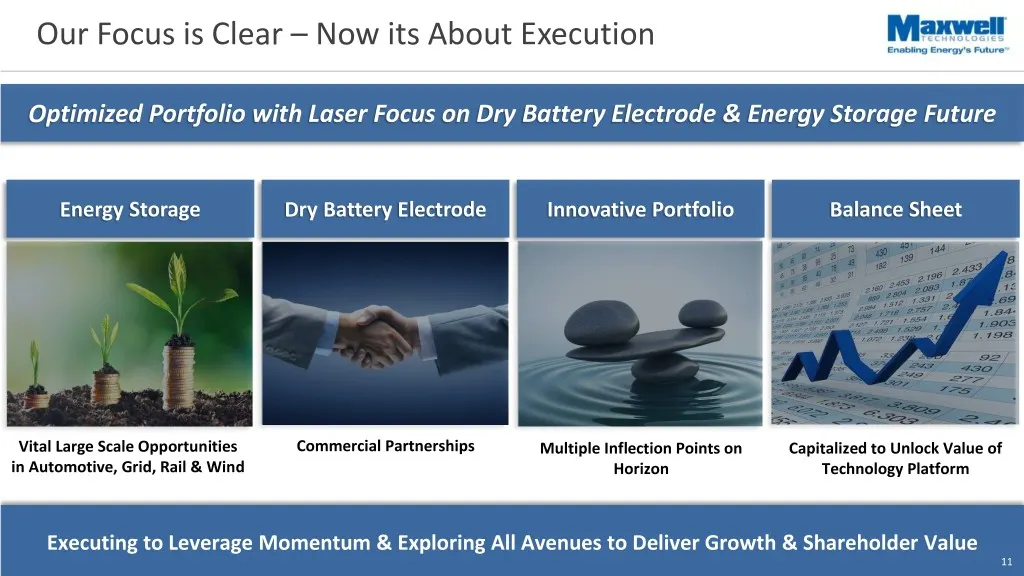
Our Focus is Clear – Now its About Execution Optimized Portfolio with Laser Focus on Dry Battery Electrode & Energy Storage Future Energy Storage Dry Battery Electrode Innovative Portfolio Balance Sheet Vital Large Scale Opportunities Commercial Partnerships Multiple Inflection Points on Capitalized
Slide 12: Maxwell – Thank You
© Maxwell Enabling Energy’s Future™ Thank You
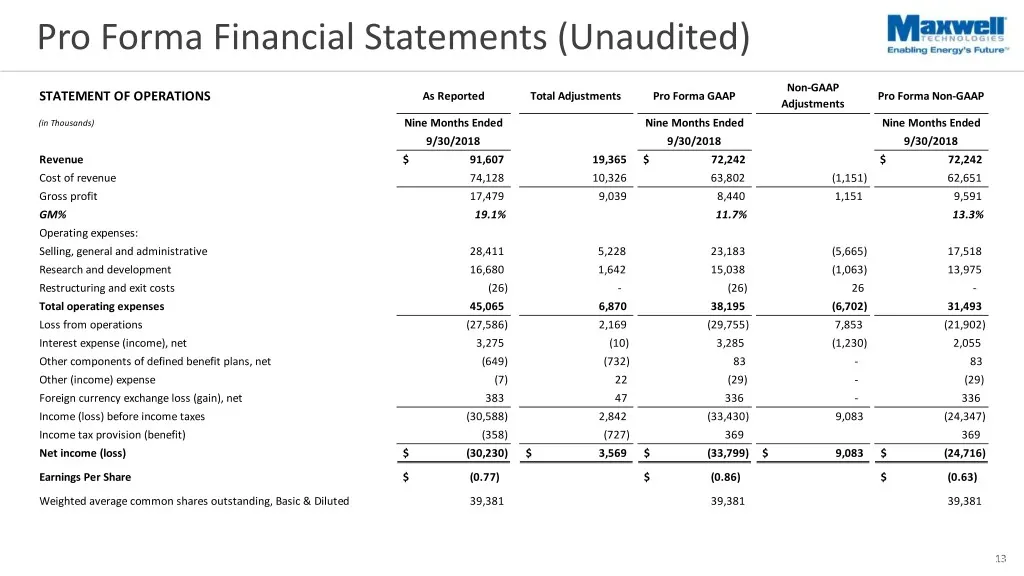
Slide 13: Pro Forma Financial Statements (Unaudited) Non-GAAP Statement of Operations
Pro Forma Financial Statements (Unaudited) Non-GAAP STATEMENT OF OPERATIONS As Reported Total Adjustments Pro Forma GAAP Pro Forma Non-GAAP Adjustments (in Thousands) Nine Months Ended Nine Months Ended Nine Months Ended 9/30/2018 9/30/2018 9/30/2018 Revenue $ 91,607 19,365 $ 72,242 $ 72,242 Cost of
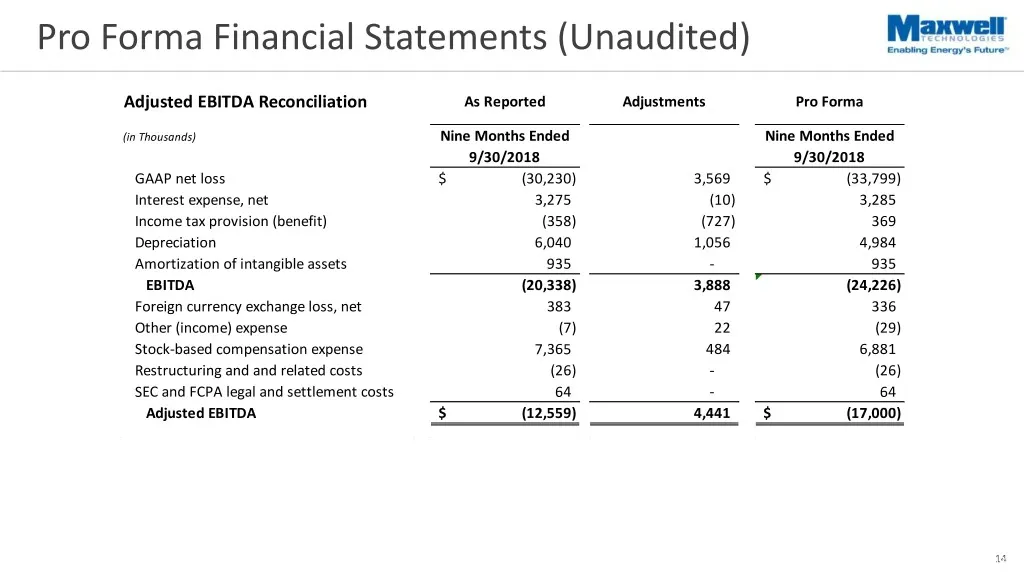
Slide 14: Pro Forma Financial Statements: Adjusted EBITDA Reconciliation
Pro Forma Financial Statements (Unaudited) Adjusted EBITDA Reconciliation As Reported Adjustments Pro Forma (in Thousands) Nine Months Ended Nine Months Ended 9/30/2018 9/30/2018 GAAP net loss $ (30,230) 3,569 $ (33,799) Interest expense, net 3,275 (10) 3,285 Income tax provision (benefit) (358) (72
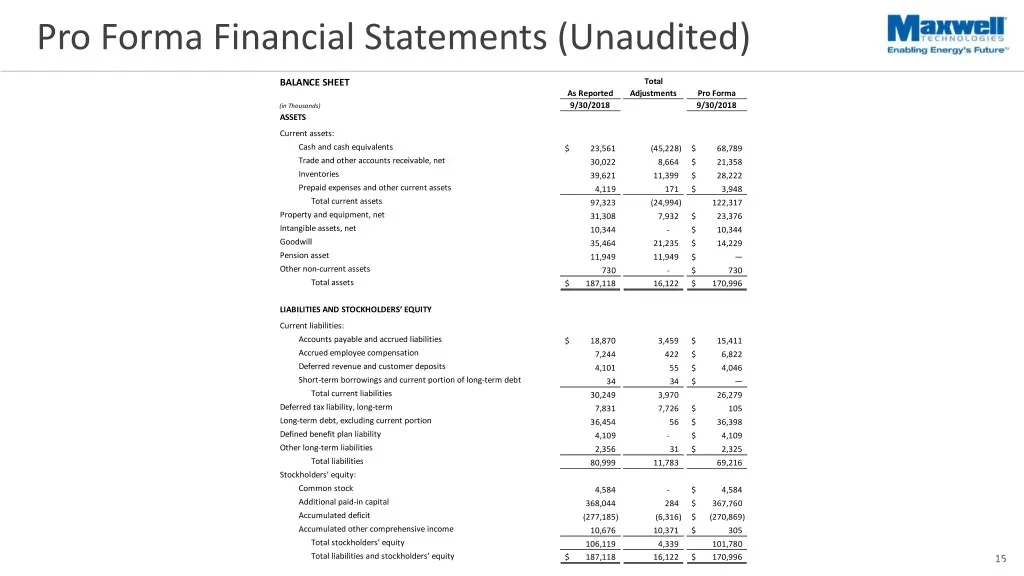
Slide 15: Pro Forma Financial Statements: Balance Sheet
Pro Forma Financial Statements (Unaudited) BALANCE SHEET Total As Reported Adjustments Pro Forma (in Thousands) 9/30/2018 9/30/2018 ASSETS Current assets: Cash and cash equivalents $ 23,561 (45,228) $ 68,789 Trade and other accounts receivable, netet 30,022 8,664 $ 21,358 Inventories 39,621 11,399 $
Source: SEC EDGAR · 8-K filed Jan 16, 2019