Mitel Networks — Oppenheimer 20th Annual Technology, Internet & Communications Conference (August 2017)
25 slides from Mitel Networks's conference presentation, Aug 9, 2017

Slide 1: Mitel + ShoreTel: Stronger Together
Mitel + ShoreTel: Stronger Together Oppenheimer 20th Annual Technology, Internet & Communications Conference Steve Spooner, CFO August 9th, 2017 Exhibit 99.1
Slide 2: Safe Harbor Statement
Safe Harbor Statement Important Information The tender offer for the outstanding shares of ShoreTel common stock to be conducted in connection with the proposed acquisition of ShoreTel referenced in this communication has not yet commenced. This communication is for informational purposes only and i
Slide 3: Non-GAAP Financial Measurements
Non-GAAP Financial Measurements In an effort to provide investors with additional information regarding the company's results as determined by generally accepted accounting principles (GAAP), the company also discusses, in its earnings press release and earnings presentation materials, the following
Slide 4: Why Acquire ShoreTel Now?
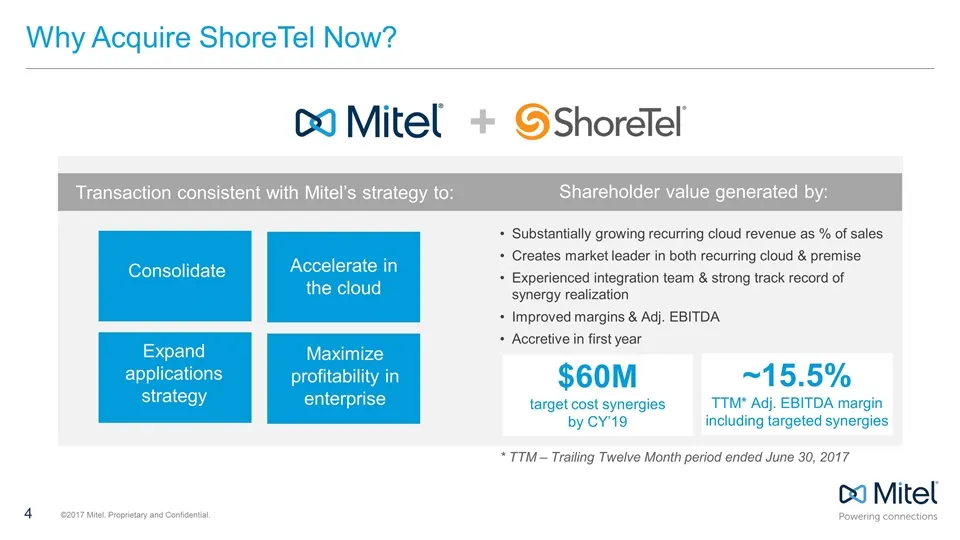
Why Acquire ShoreTel Now? + Consolidate Substantially growing recurring cloud revenue as % of sales Creates market leader in both recurring cloud & premise Experienced integration team & strong track record of synergy realization Improved margins & Adj. EBITDA Accretive in first year * TTM – Trailin
Slide 5: Stronger Together: Strategic Rationale
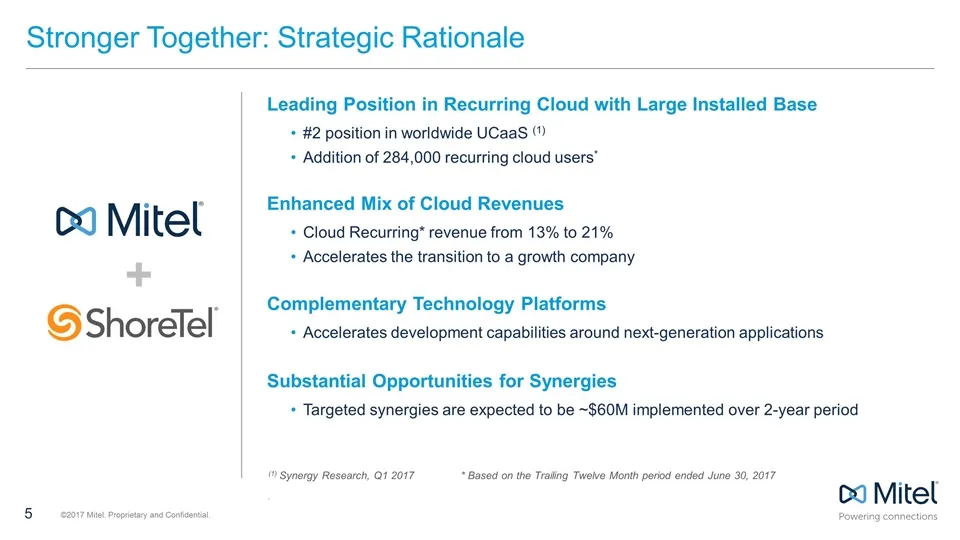
Stronger Together: Strategic Rationale Enhanced Mix of Cloud Revenues Cloud Recurring* revenue from 13% to 21% Accelerates the transition to a growth company Complementary Technology Platforms Accelerates development capabilities around next-generation applications Substantial Opportunities for Syne
Slide 6: Stronger Together: Financial Rationale
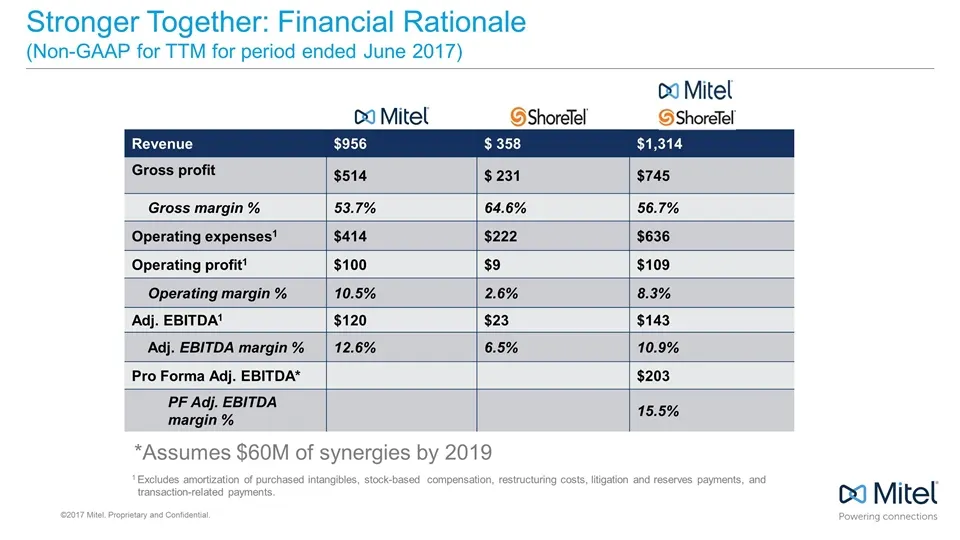
Stronger Together: Financial Rationale (Non-GAAP for TTM for period ended June 2017) Revenue $956 $ 358 $1,314 Gross profit $514 $ 231 $745 Gross margin % 53.7% 64.6% 56.7% Operating expenses1 $414 $222 $636 Operating profit1 $100 $9 $109 Operating margin % 10.5% 2.6% 8.3% Adj. EBITDA1 $120 $23 $143
Slide 7: Transaction Highlights
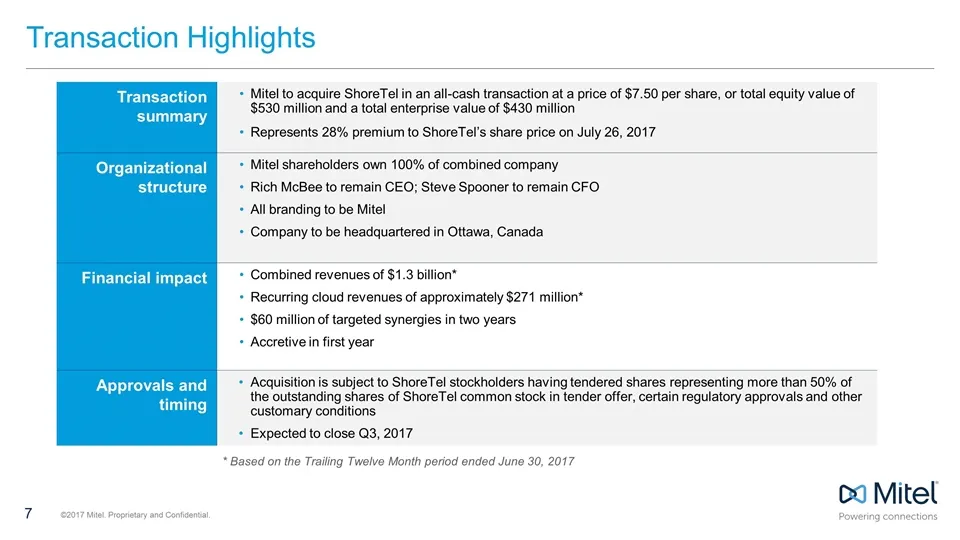
Transaction Highlights Transaction summary Mitel to acquire ShoreTel in an all-cash transaction at a price of $7.50 per share, or total equity value of $530 million and a total enterprise value of $430 million Represents 28% premium to ShoreTel’s share price on July 26, 2017 Organizational structure
Slide 8: Capital Structure Optimized to Maximize Flexibility and Value Creation
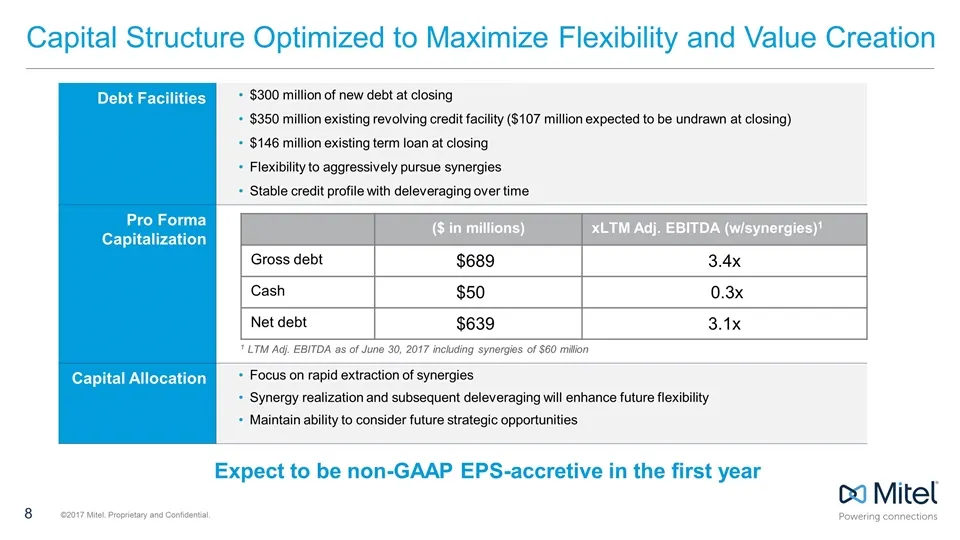
Capital Structure Optimized to Maximize Flexibility and Value Creation Debt Facilities $300 million of new debt at closing $350 million existing revolving credit facility ($107 million expected to be undrawn at closing) $146 million existing term loan at closing Flexibility to aggressively pursue sy
Slide 9: Company Snapshot
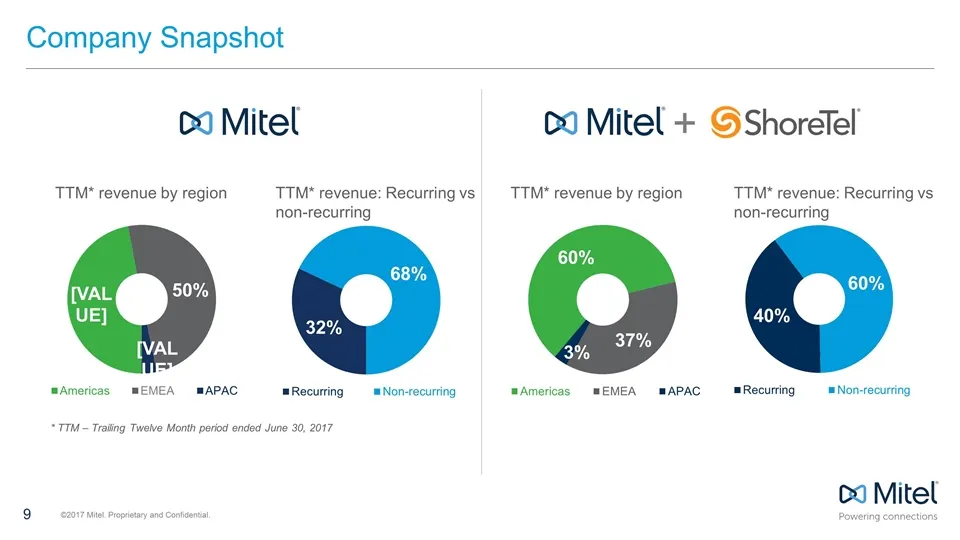
Company Snapshot TTM* revenue by region TTM* revenue: Recurring vs non-recurring TTM* revenue by region TTM* revenue: Recurring vs non-recurring + * TTM – Trailing Twelve Month period ended June 30, 2017
Slide 10: Leading Position in Cloud with Large Installed Base
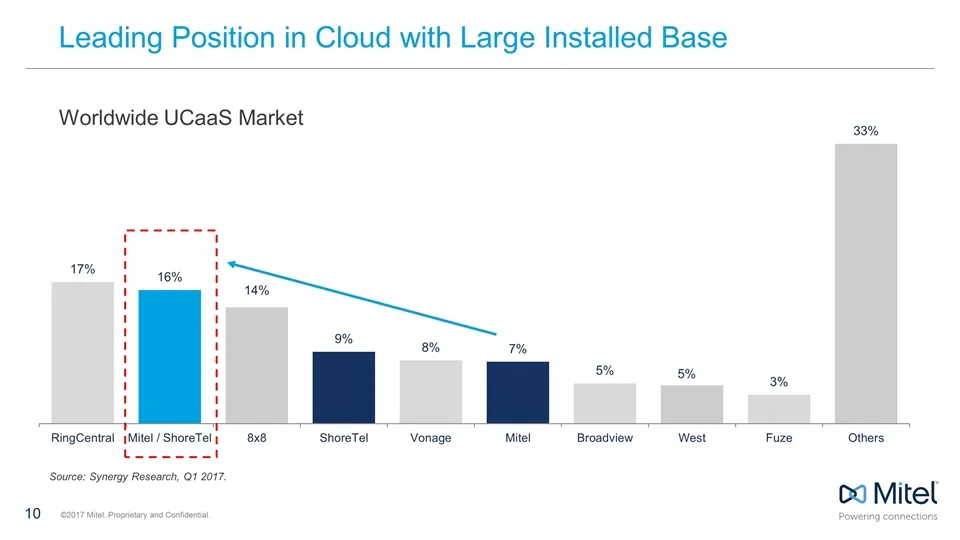
Source: Synergy Research, Q1 2017. Leading Position in Cloud with Large Installed Base Worldwide UCaaS Market
Slide 11: Pre-Merger and Post-Merger Combined Profile
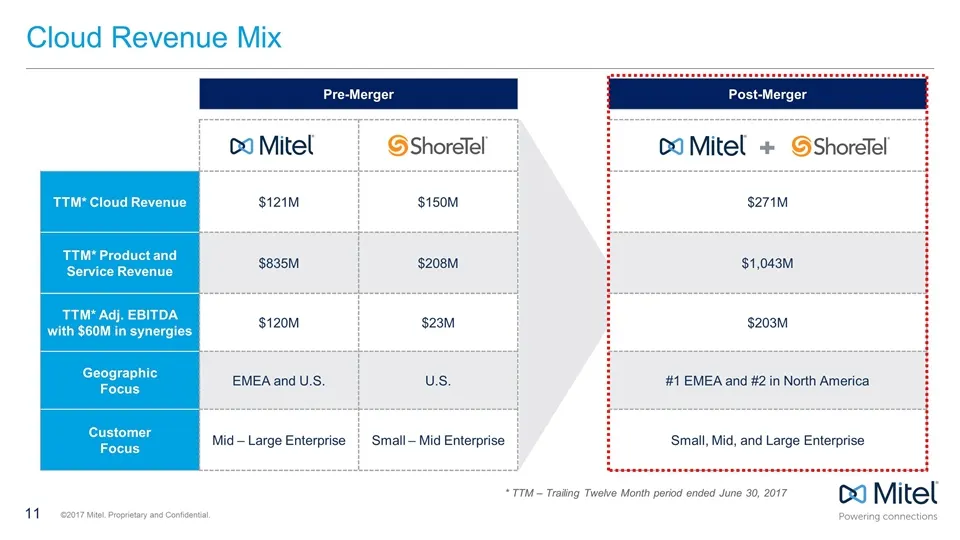
Pre-Merger Post-Merger TTM* Cloud Revenue $121M $150M $271M TTM* Product and Service Revenue $835M $208M $1,043M TTM* Adj. EBITDA with $60M in synergies $120M $23M $203M Geographic Focus EMEA and U.S. U.S. #1 EMEA and #2 in North America Customer Focus Mid – Large Enterprise Small – Mid Enterprise S
Slide 12: Leveraging Strong M&A Track Record & Integration Strategy
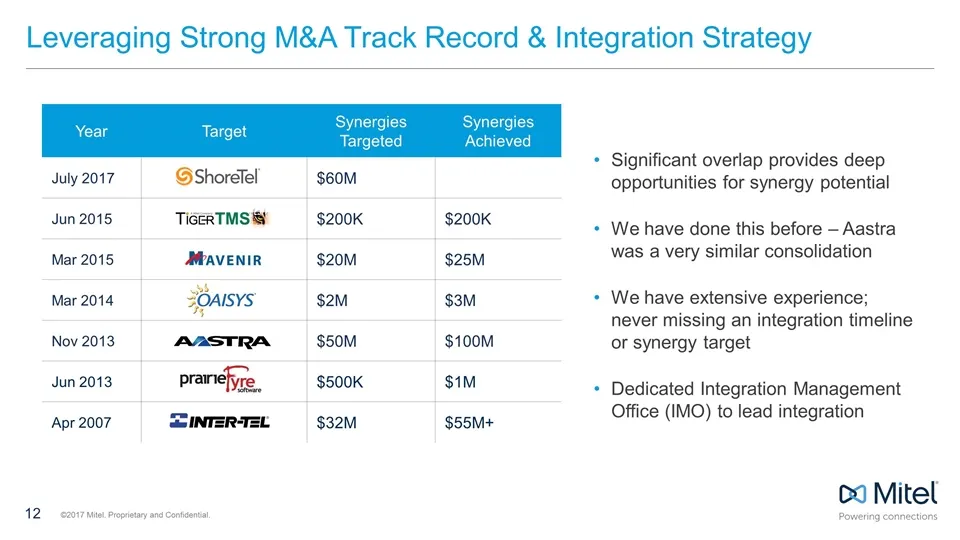
Year Target Synergies Targeted Synergies Achieved July 2017 $60M Jun 2015 $200K $200K Mar 2015 $20M $25M Mar 2014 $2M $3M Nov 2013 $50M $100M Jun 2013 $500K $1M Apr 2007 $32M $55M+ Significant overlap provides deep opportunities for synergy potential We have done this before – Aastra was a very simi
Slide 13: Substantial Opportunities for Synergies
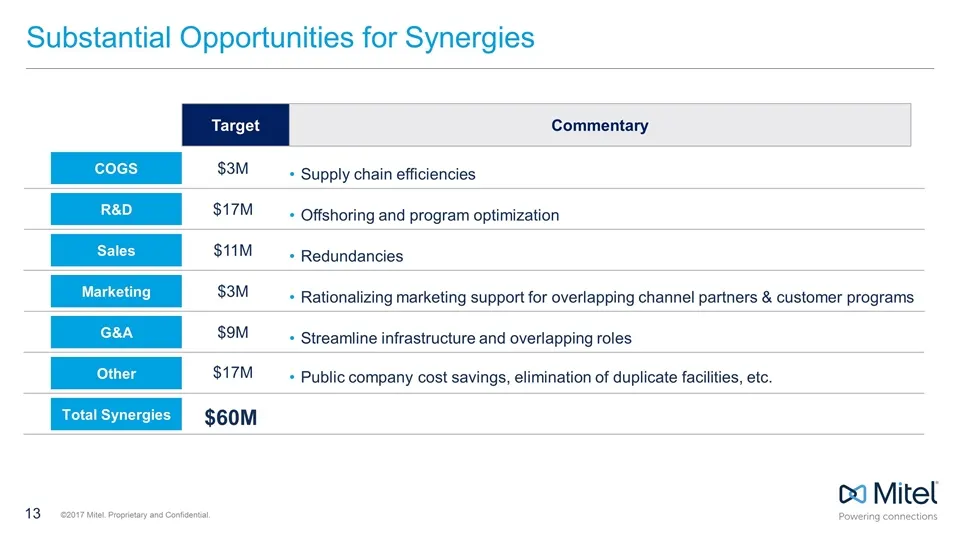
Substantial Opportunities for Synergies Target Commentary G&A Streamline infrastructure and overlapping roles $9M Marketing Rationalizing marketing support for overlapping channel partners & customer programs $3M Sales Redundancies $11M R&D Offshoring and program optimization $17M COGS Supply chain
Slide 14: Benefits to All Stakeholders
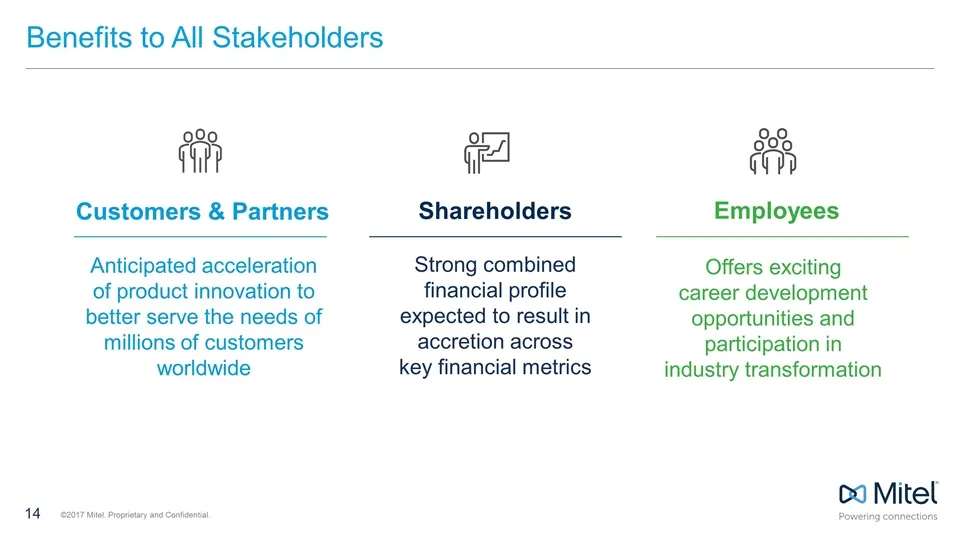
Benefits to All Stakeholders Customers & Partners Anticipated acceleration of product innovation to better serve the needs of millions of customers worldwide Shareholders Strong combined financial profile expected to result in accretion across key financial metrics Employees Offers exciting career d

Slide 15: Mitel Q2 2017 Financial Summary
Mitel Q2 2017 Financial Summary July 27, 2017
Slide 16: Q2 2017 Highlights
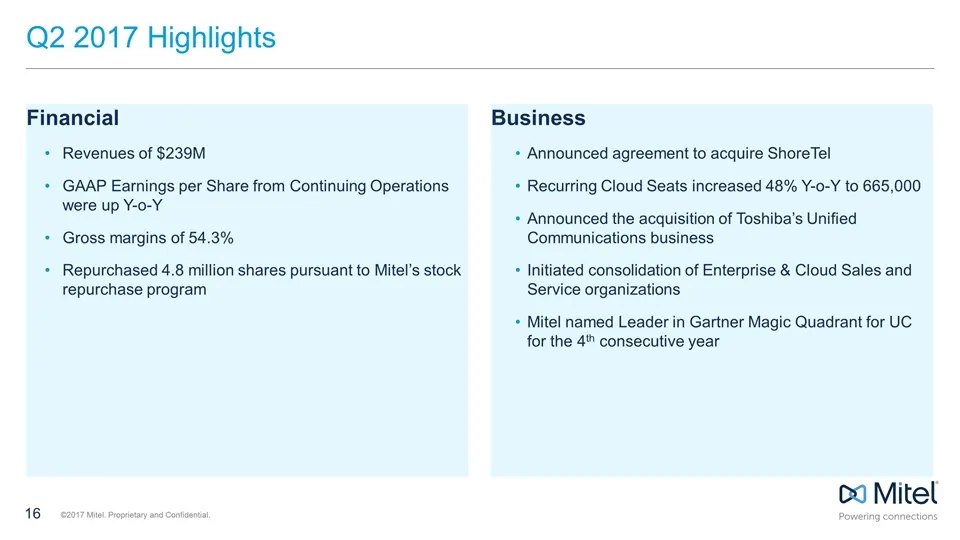
Q2 2017 Highlights Financial Revenues of $239M GAAP Earnings per Share from Continuing Operations were up Y-o-Y Gross margins of 54.3% Repurchased 4.8 million shares pursuant to Mitel’s stock repurchase program Business Announced agreement to acquire ShoreTel Recurring Cloud Seats increased 48% Y-o-
Slide 17: Quarterly Income Statement Information – From Continuing Operations
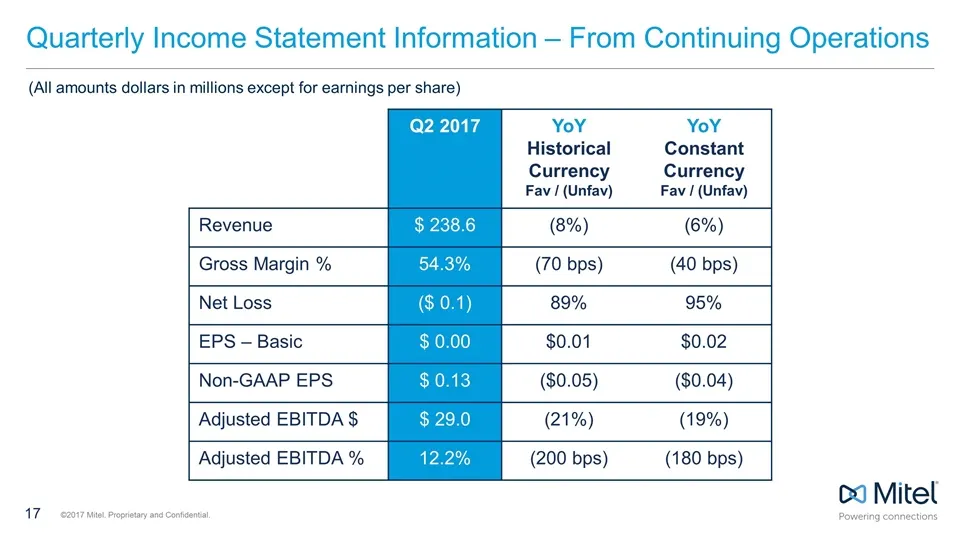
Quarterly Income Statement Information – From Continuing Operations Q2 2017 YoY Historical Currency Fav / (Unfav) YoY Constant Currency Fav / (Unfav) Revenue $ 238.6 (8%) (6%) Gross Margin % 54.3% (70 bps) (40 bps) Net Loss ($ 0.1) 89% 95% EPS – Basic $ 0.00 $0.01 $0.02 Non-GAAP EPS $ 0.13 ($0.05) (
Slide 18: Cloud Metrics
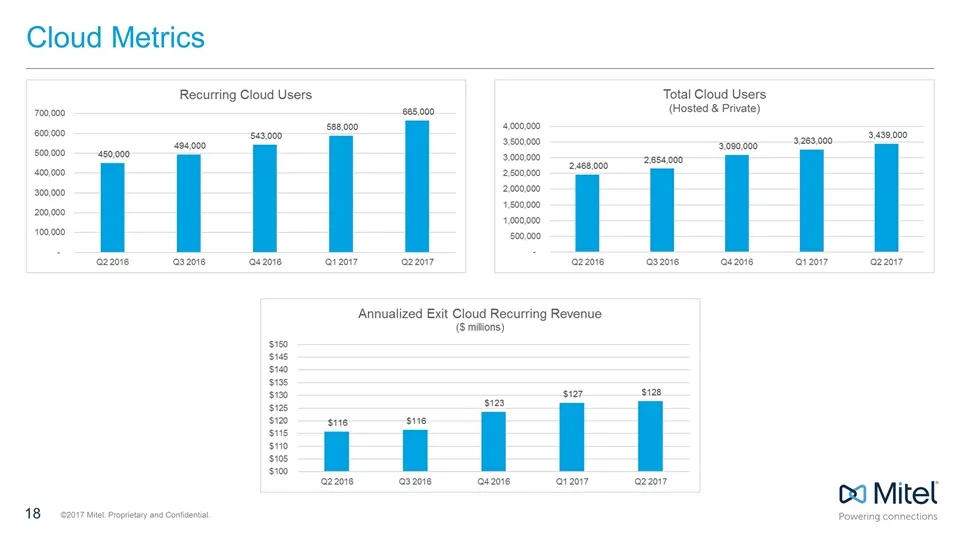
Cloud Metrics Recurring Cloud Users. Total Cloud Users 700000 685,00 (Hosted & Private) 588,000 4000000 200,000 #3000 3a — sen. 3500000 ‘sos0000 3288000 450.000 3000000 5 agg 2884000 400.000 2500000 smeo0 2000000 1.800000 200000 ‘1000000 +00 000 ‘poooo e226 es2016 eres a12017 ‘a22017 cane es2016 uzo
Slide 19: Growing Recurring Revenue Streams
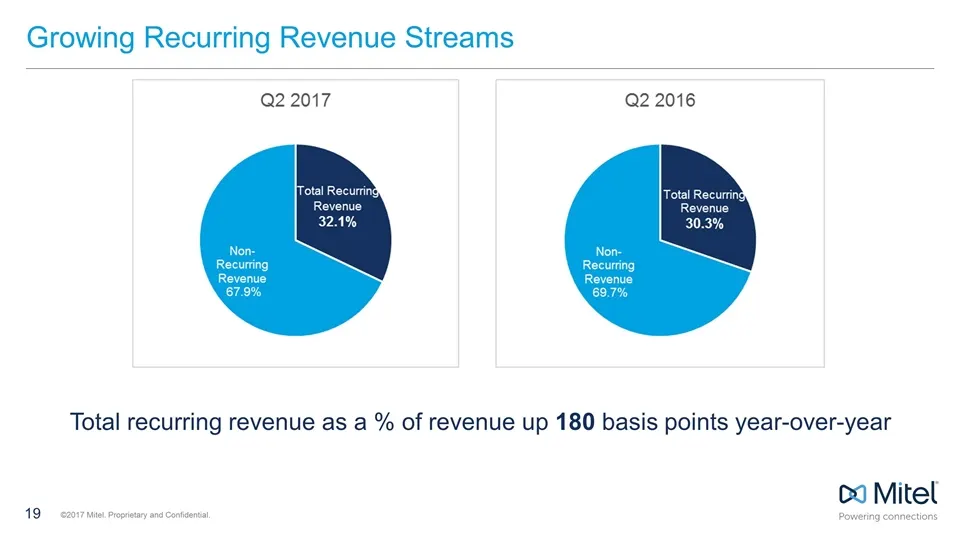
Growing Recurring Revenue Streams Total recurring revenue as a % of revenue up 180 basis points year-over-year
Slide 20: Select Balance Sheet Metrics
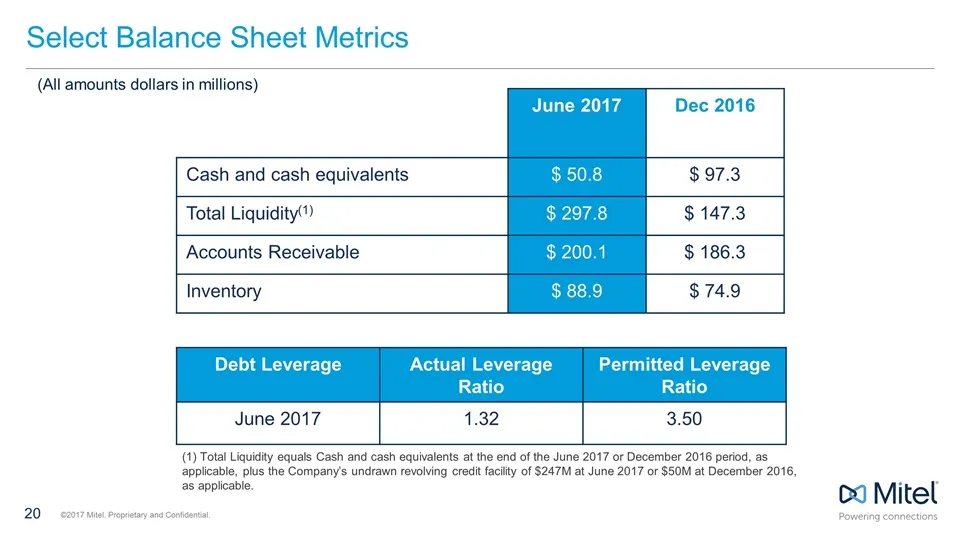
Select Balance Sheet Metrics June 2017 Dec 2016 Cash and cash equivalents $ 50.8 $ 97.3 Total Liquidity(1) $ 297.8 $ 147.3 Accounts Receivable $ 200.1 $ 186.3 Inventory $ 88.9 $ 74.9 (All amounts dollars in millions) Debt Leverage Actual Leverage Ratio Permitted Leverage Ratio June 2017 1.32 3.50 (1
Slide 21: Appendix
Appendix oo Mitel
Slide 22: Historical and Constant Currency Measures – Continuing Operations
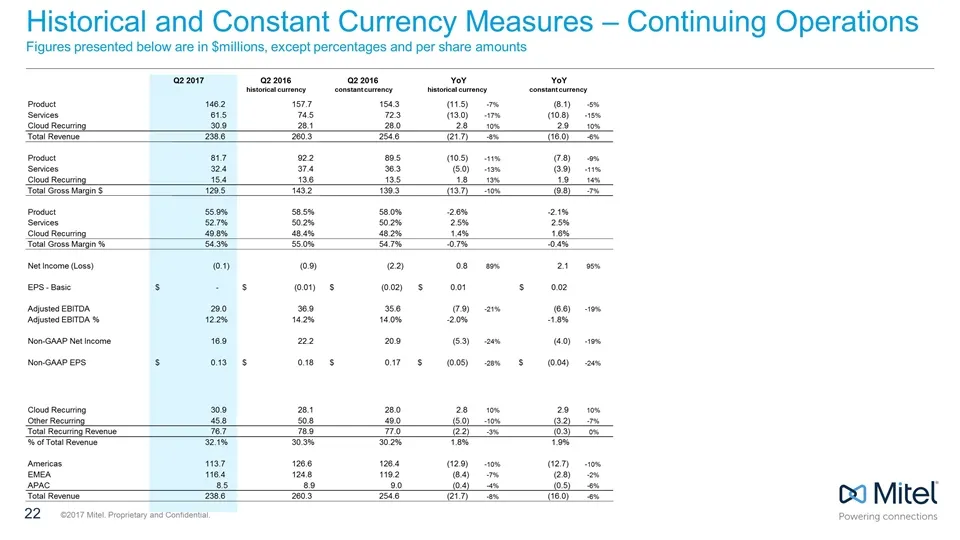
Historical and Constant Currency Measures – Continuing Operations Figures presented below are in $millions, except percentages and per share amounts Q2 2017 Q2 2016 Q2 2016 historical currency constant currency Product 146.2 157.7 154.3 (11.5) -7% (8.1) -5% Services 61.5 74.5 72.3 (13.0) -17% (10.8)
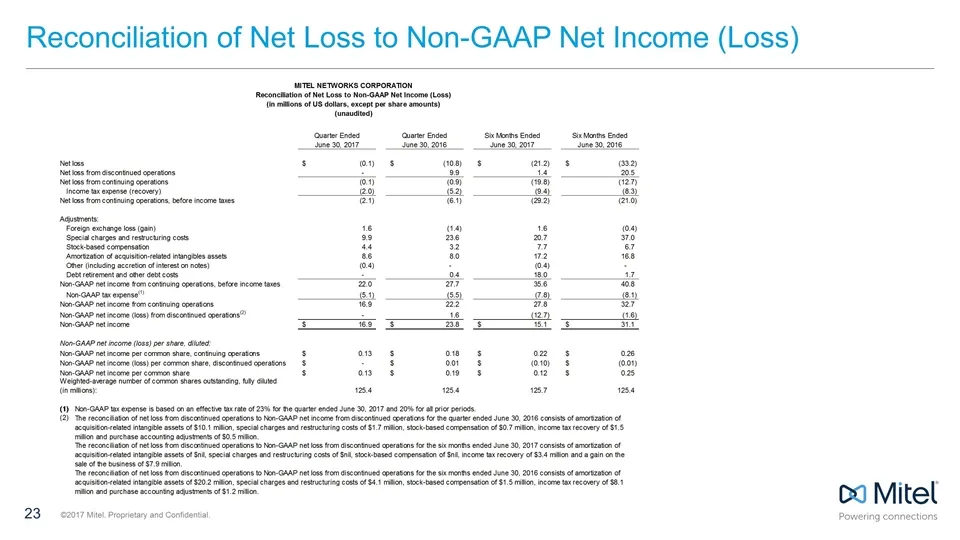
Slide 23: Reconciliation of Net Loss to Non-GAAP Net Income (Loss)
Reconciliation of Net Loss to Non-GAAP Net Income (Loss)
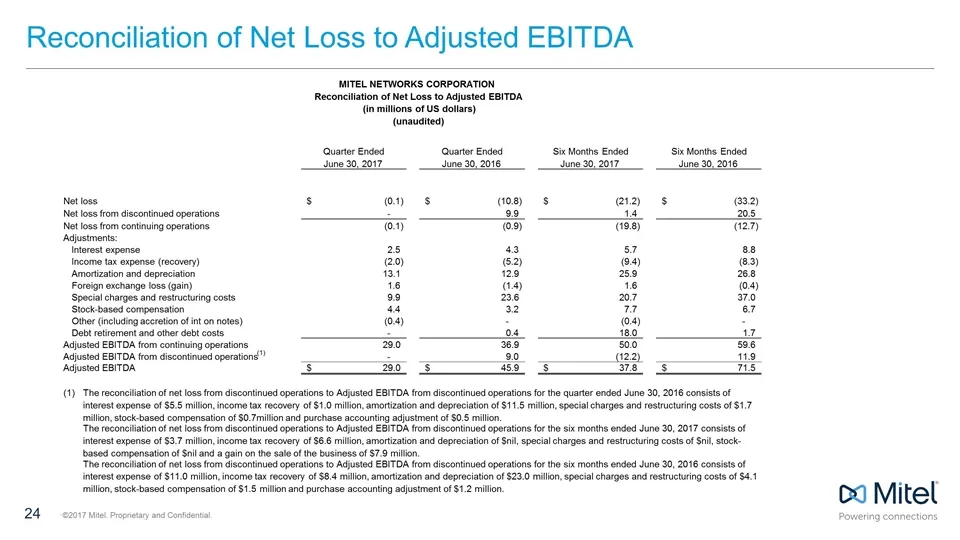
Slide 24: Reconciliation of Net Loss to Adjusted EBITDA
Reconciliation of Net Loss to Adjusted EBITDA Net loss (0.1) $ (10.8) $ (21.2) $ (33.2) $ Net loss from discontinued operations - 9.9 1.4 20.5 Net loss from continuing operations (0.1) (0.9) (19.8) (12.7) Adjustments: Interest expense 2.5 4.3 5.7 8.8 Income tax expense (recovery) (2.0) (5.2) (9.4) (

Slide 25: Stronger Together
Stronger Together
Source: SEC EDGAR · 8-K filed Aug 9, 2017
More decks from Mitel Networks Corp.
 Investor Day (February 2018)140 slides · Feb 27, 2018
 Q4 2017 Earnings Presentation17 slides · Feb 22, 2018
 Q3 2017 Earnings Presentation17 slides · Nov 2, 2017
 Q2 2017 Earnings Presentation30 slides · Jul 27, 2017
 Q1 2017 Earnings Presentation19 slides · May 3, 2017
 Investor Day (March 2017)117 slides · Mar 7, 2017