Comerica — Comerica Inc /New/ — Goldman Sachs Financial Services Conference 2013
18 slides from Comerica's conference presentation, Dec 9, 2013
Slide 1: Goldman Sachs Financial Services Conference
Comerica Incorporated Goldman Sachs Financial Services ConferenceDecember 10 - 11, 2013 Ralph W. Babb, Jr.Chairman and Chief Executive Officer Karen ParkhillVice Chairman and CFO Safe Harbor Statement Any statements in this presentation that are not historical facts are forward-looking statements as
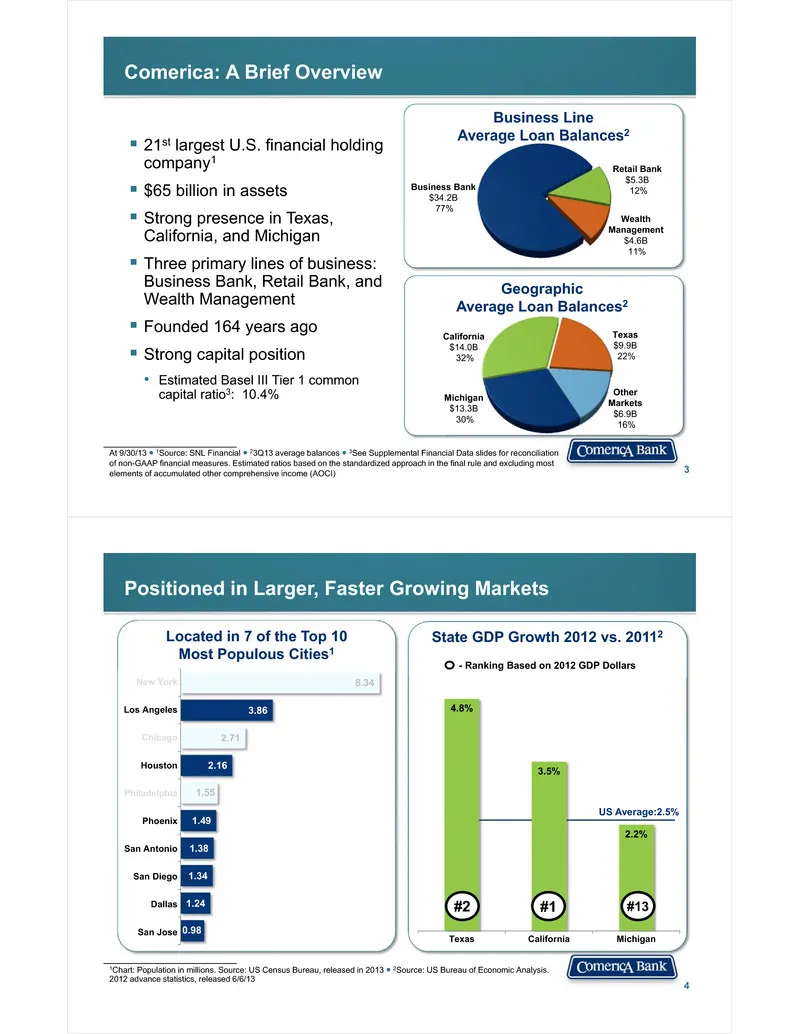
Slide 2: Comerica: A Brief Overview
Comerica: A Brief Overview 21st largest U.S. financial holding company1 $65 billion in assets Strong presence in Texas, California, and Michigan Three primary lines of business: Business Bank, Retail Bank, and Wealth Management Founded 164 years ago Strong capital position• Estimated Bas
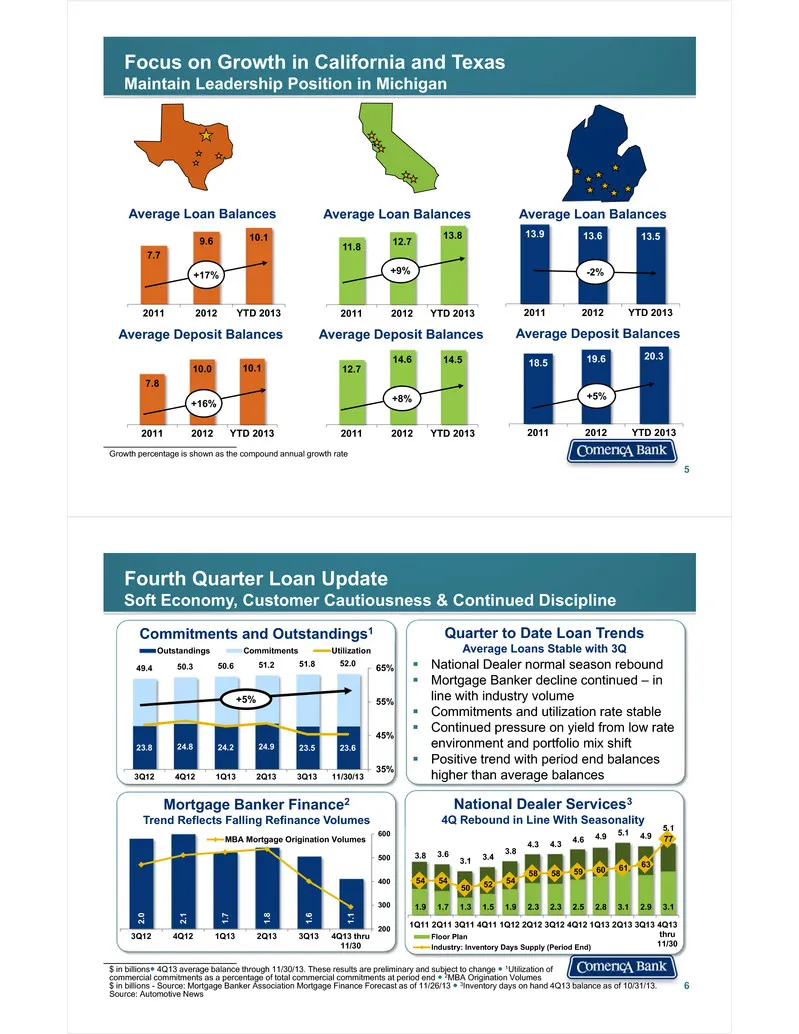
Slide 3: Focus on Growth in California and Texas; Fourth Quarter Loan Update
Focus on Growth in California and TexasMaintain Leadership Position in Michigan 5 7.7 9.6 10.1 2011 2012 YTD 2013 Average Loan Balances 7.8 10.0 10.1 2011 2012 YTD 2013 Average Deposit Balances 11.8 12.7 13.8 2011 2012 YTD 2013 Average Loan Balances 12.7 14.6 14.5 2011 2012 YTD 2013 Average Deposit
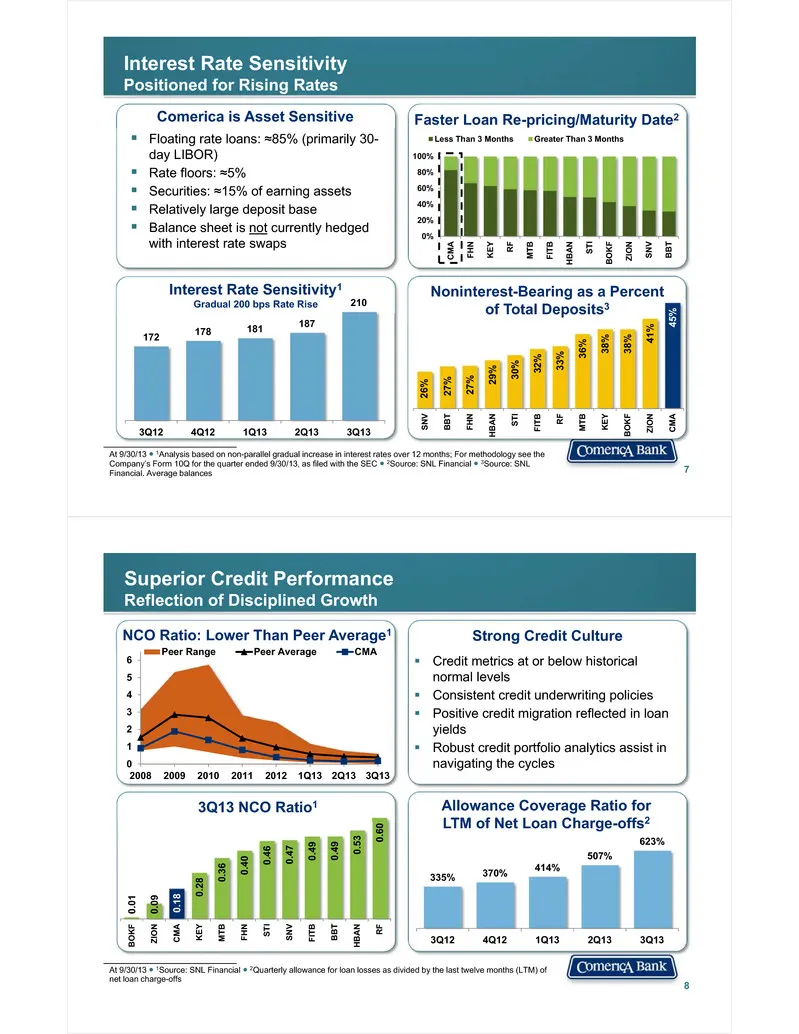
Slide 4: Positioned for Rising Rates
At 9/30/13 ● 1Analysis based on non-parallel gradual increase in interest rates over 12 months; For methodology see the Company’s Form 10Q for the quarter ended 9/30/13, as filed with the SEC ● 2Source: SNL Financial ● 3Source: SNL Financial. Average balances Faster Loan Re-pricing/Maturity Date2 0%
Slide 5: Emphasis on Cross-sell of Products and Services
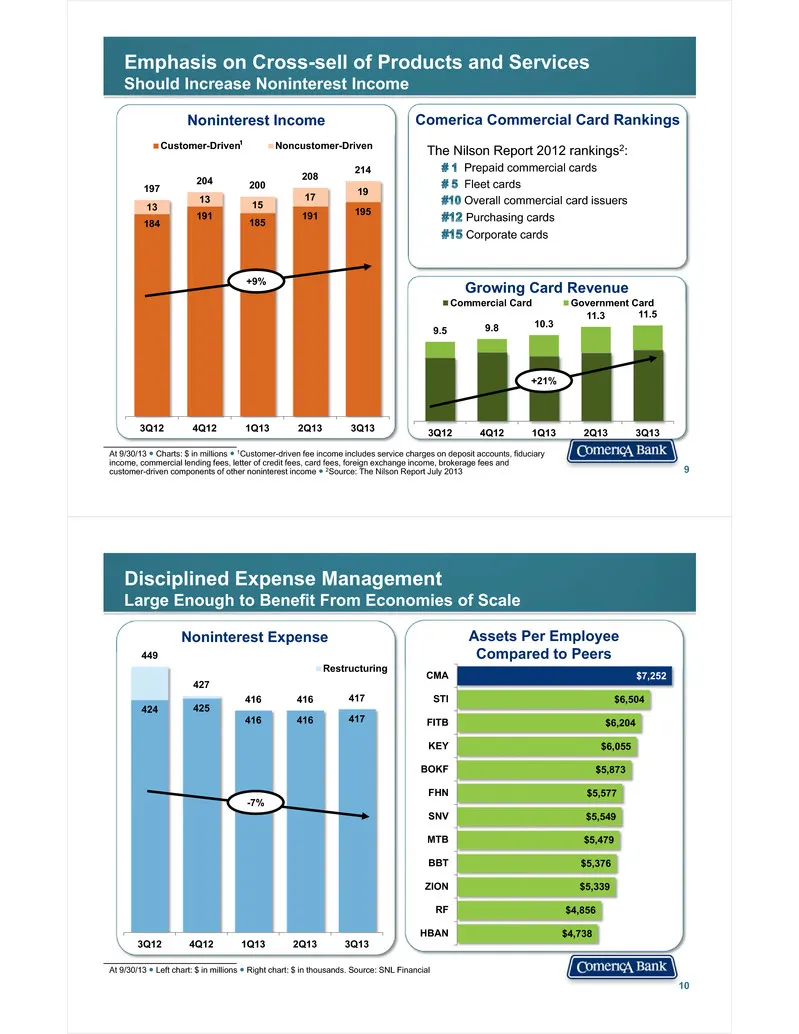
Emphasis on Cross-sell of Products and ServicesShould Increase Noninterest Income 9 Noninterest Income At 9/30/13 ● Charts: $ in millions ● 1Customer-driven fee income includes service charges on deposit accounts, fiduciary income, commercial lending fees, letter of credit fees, card fees, foreign e
Slide 6: Sustainable Reduction in Costs
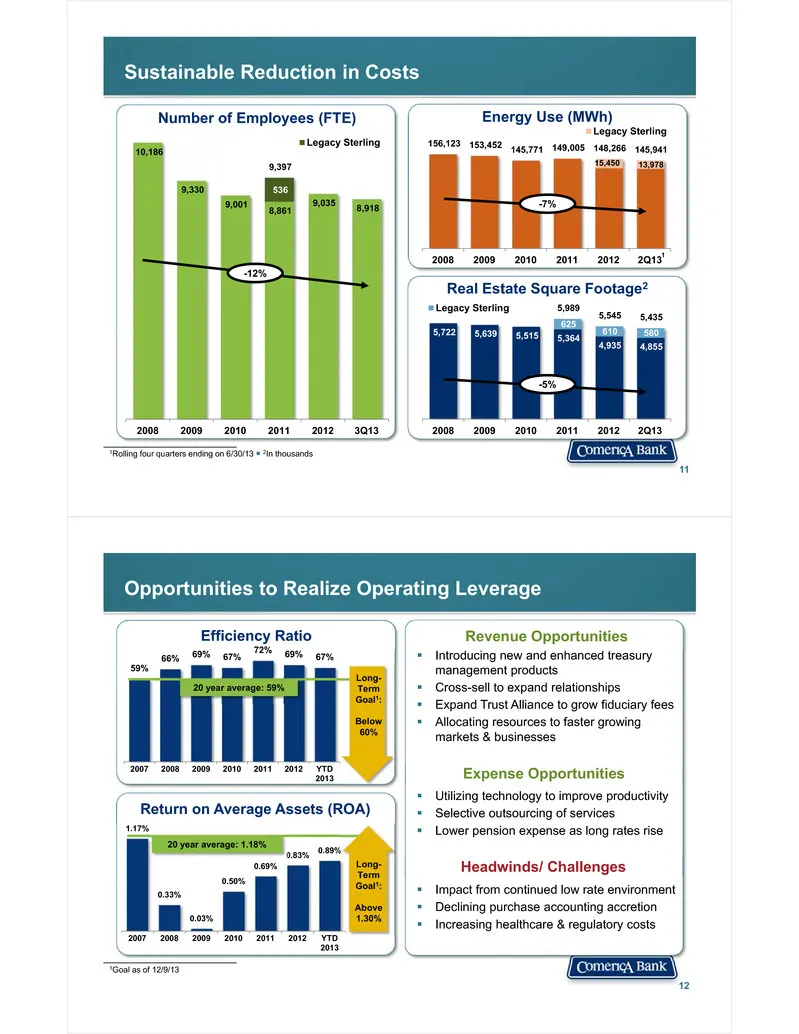
Sustainable Reduction in Costs 11 5,722 5,639 5,515 5,364 4,935 4,855 625 610 580 5,989 5,545 5,435 2008 2009 2010 2011 2012 2Q13 Legacy Sterling 10,186 9,330 9,001 8,861 9,035 8,918 536 9,397 2008 2009 2010 2011 2012 3Q13 Legacy Sterling Number of Employees (FTE) Real Estate Square Footage2 Energy
Slide 7: Proposed Basel III Liquidity Coverage Ratio (LCR)
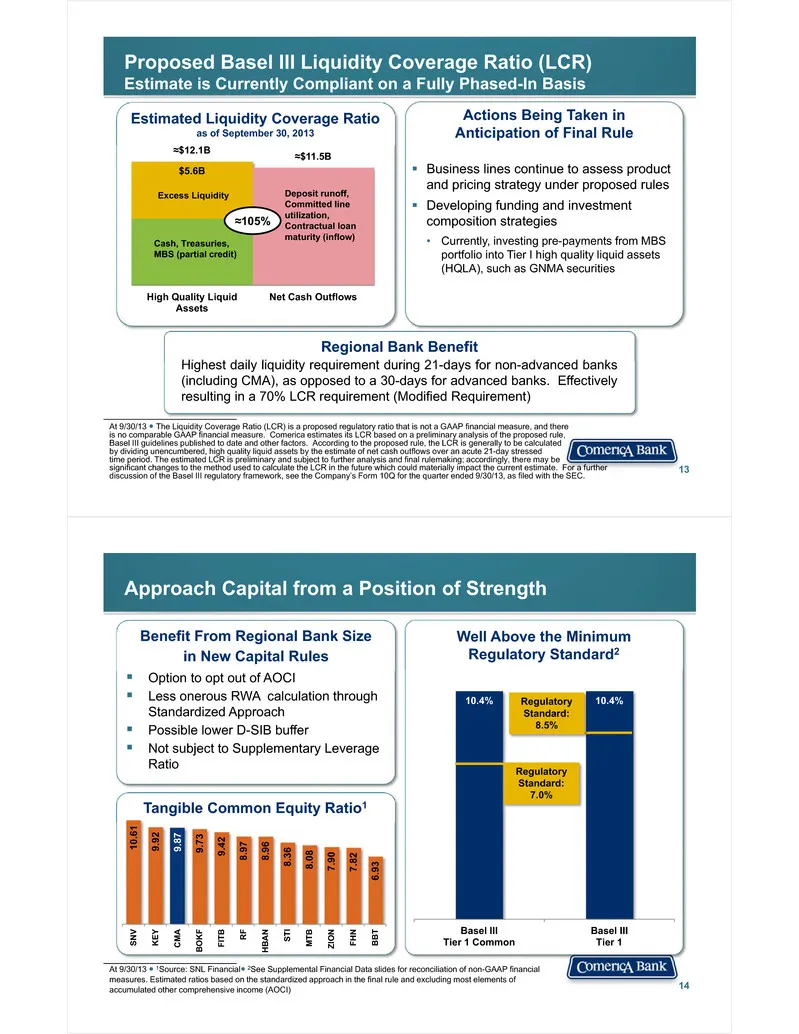
Proposed Basel III Liquidity Coverage Ratio (LCR)Estimate is Currently Compliant on a Fully Phased-In Basis Business lines continue to assess product and pricing strategy under proposed rules Developing funding and investment composition strategies • Currently, investing pre-payments from MBS po
Slide 8: Active Capital Management
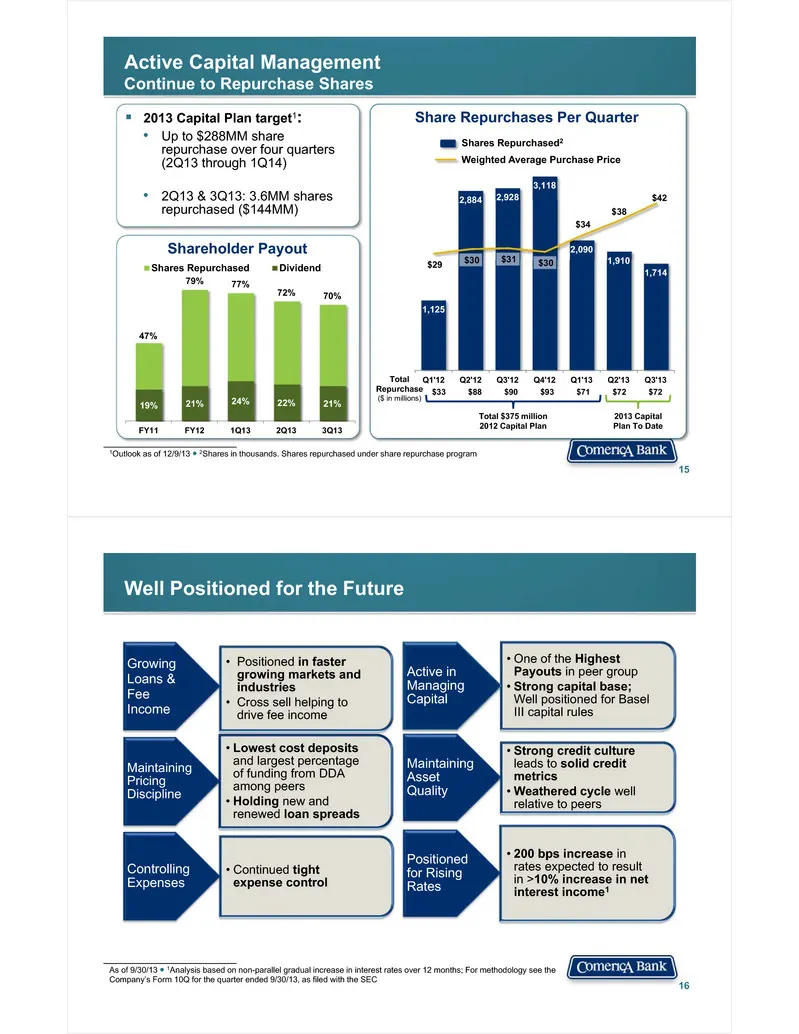
Active Capital ManagementContinue to Repurchase Shares 15 1,125 2,884 2,928 3,118 2,090 1,910 1,714$29 $30 $31 $30 $34 $38 $42 Q1'12 Q2'12 Q3'12 Q4'12 Q1'13 Q2'13 Q3'13 Share Repurchases Per Quarter Shares Repurchased2 Weighted Average Purchase Price $33 $88 $90 $93 $71 $72 $72 Total $375 million201
Slide 9: Appendix: Financial Summary
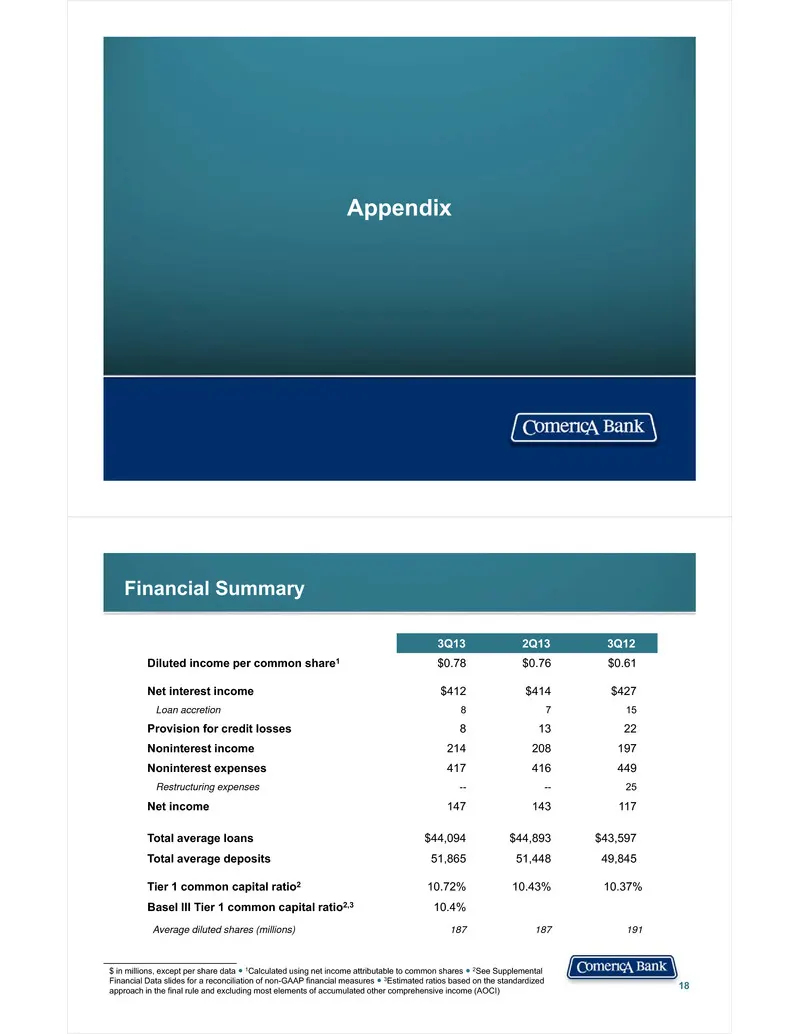
Appendix Financial Summary 18 3Q13 2Q13 3Q12 Diluted income per common share1 $0.78 $0.76 $0.61 Net interest income $412 $414 $427 Loan accretion 8 7 15 Provision for credit losses 8 13 22 Noninterest income 214 208 197 Noninterest expenses 417 416 449 Restructuring expenses -- -- 25 Net income 147
Slide 10: Third Quarter 2013 Results Key Performance Drivers
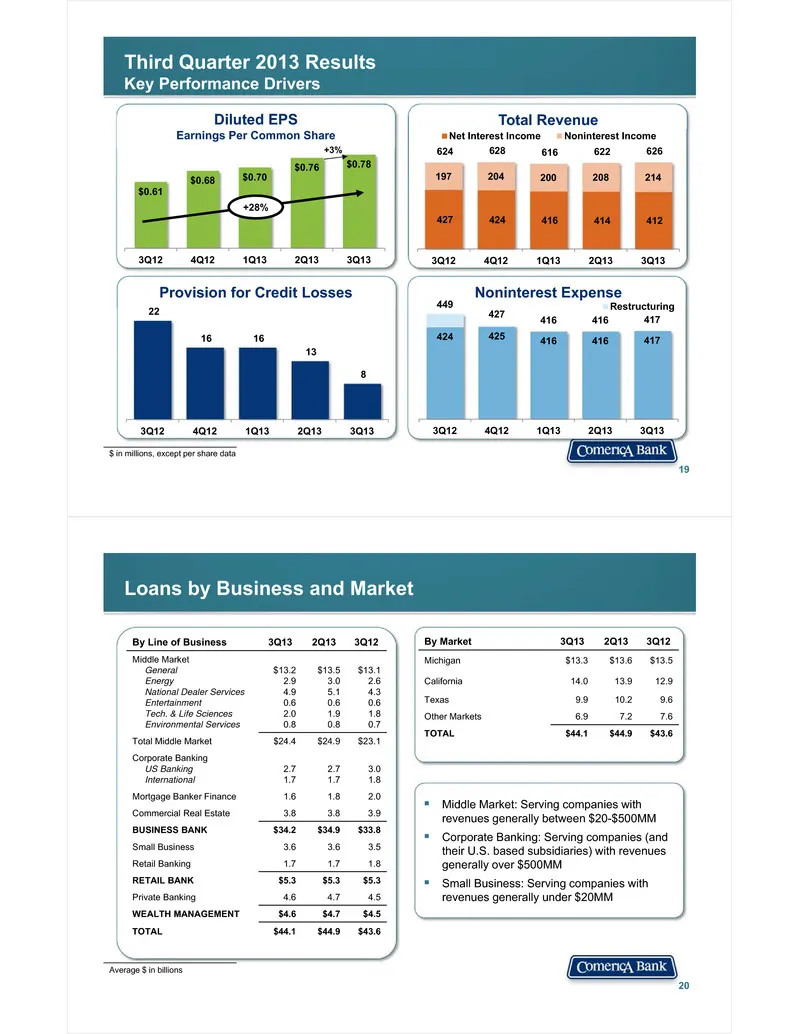
Third Quarter 2013 ResultsKey Performance Drivers 19 $ in millions, except per share data $0.61 $0.68 $0.70 $0.76 $0.78 3Q12 4Q12 1Q13 2Q13 3Q13 Diluted EPSEarnings Per Common Share +28% +3% 22 16 16 13 8 3Q12 4Q12 1Q13 2Q13 3Q13 Provision for Credit Losses 427 424 416 414 412 197 204 200 208 214 62
Slide 11: Deposits by Business and Market
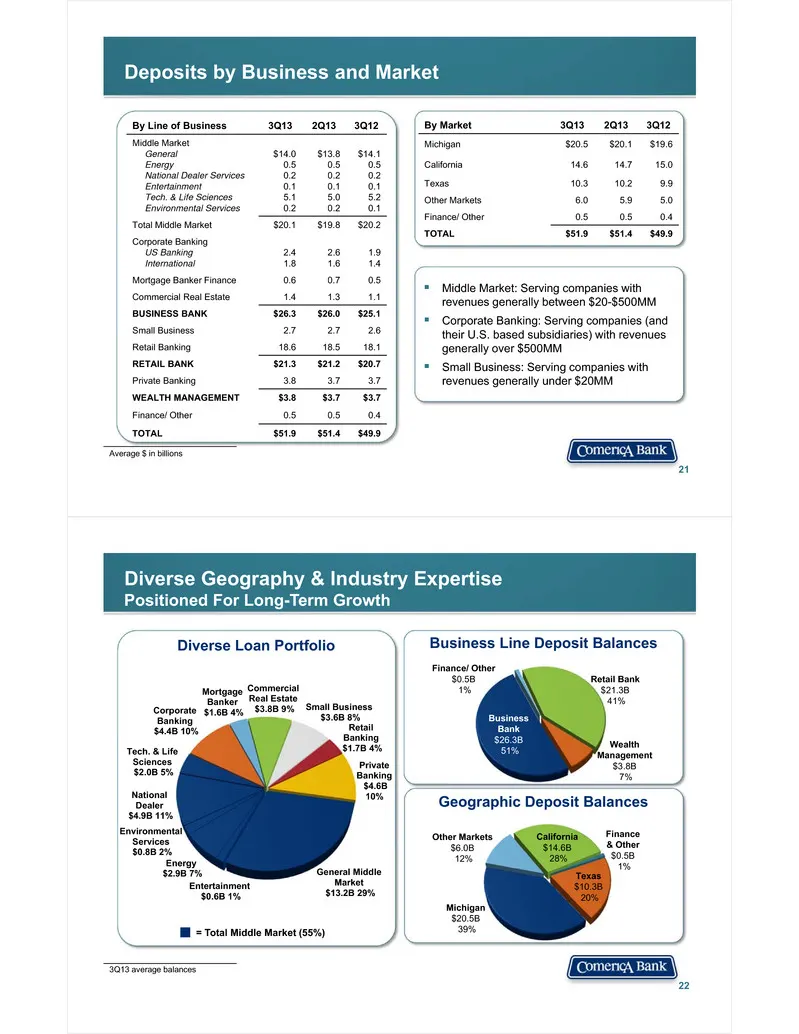
Deposits by Business and Market 21 Middle Market: Serving companies with revenues generally between $20-$500MM Corporate Banking: Serving companies (and their U.S. based subsidiaries) with revenues generally over $500MM Small Business: Serving companies with revenues generally under $20MM Aver
Slide 12: General Middle Market
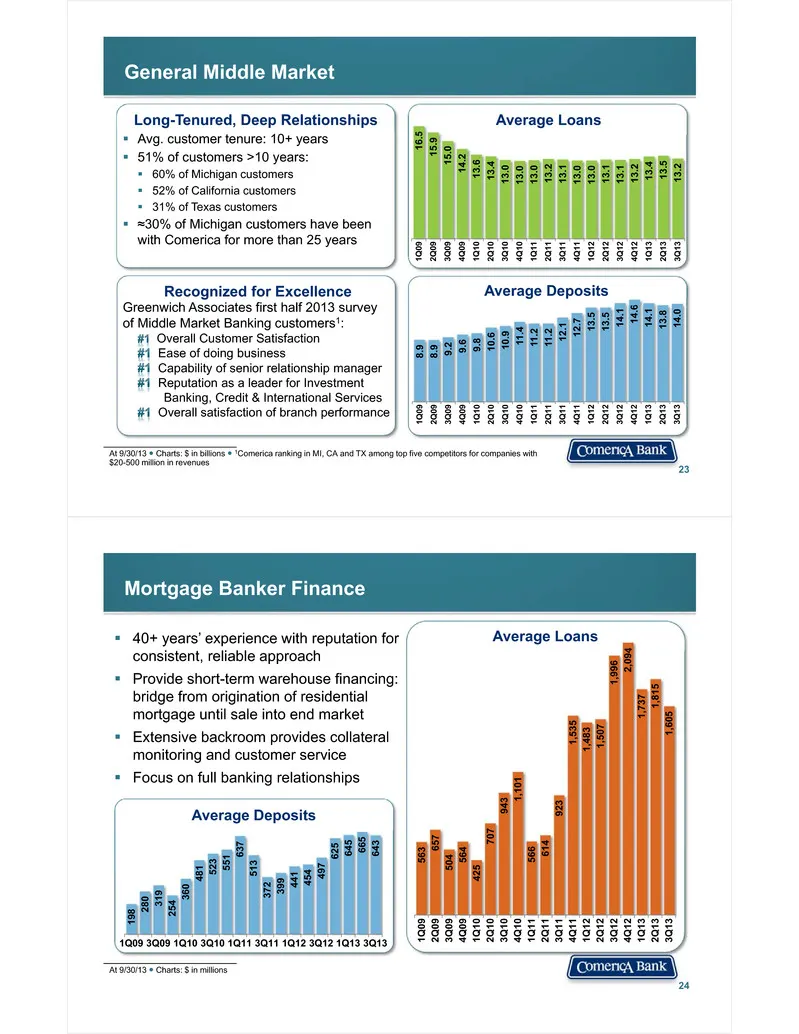
23 General Middle Market At 9/30/13 ● Charts: $ in billions ● 1Comerica ranking in MI, CA and TX among top five competitors for companies with $20-500 million in revenues 8.9 8.9 9.2 9.6 9.8 10 .6 10.9 11. 4 11.2 11.2 12 .1 12.7 13 .5 13.5 14. 1 14.6 14.1 13.8 14.0 1Q0 9 2Q0 9 3Q0 9 4Q0 9 1Q1 0 2Q1
Slide 13: National Dealer Services Line of Business
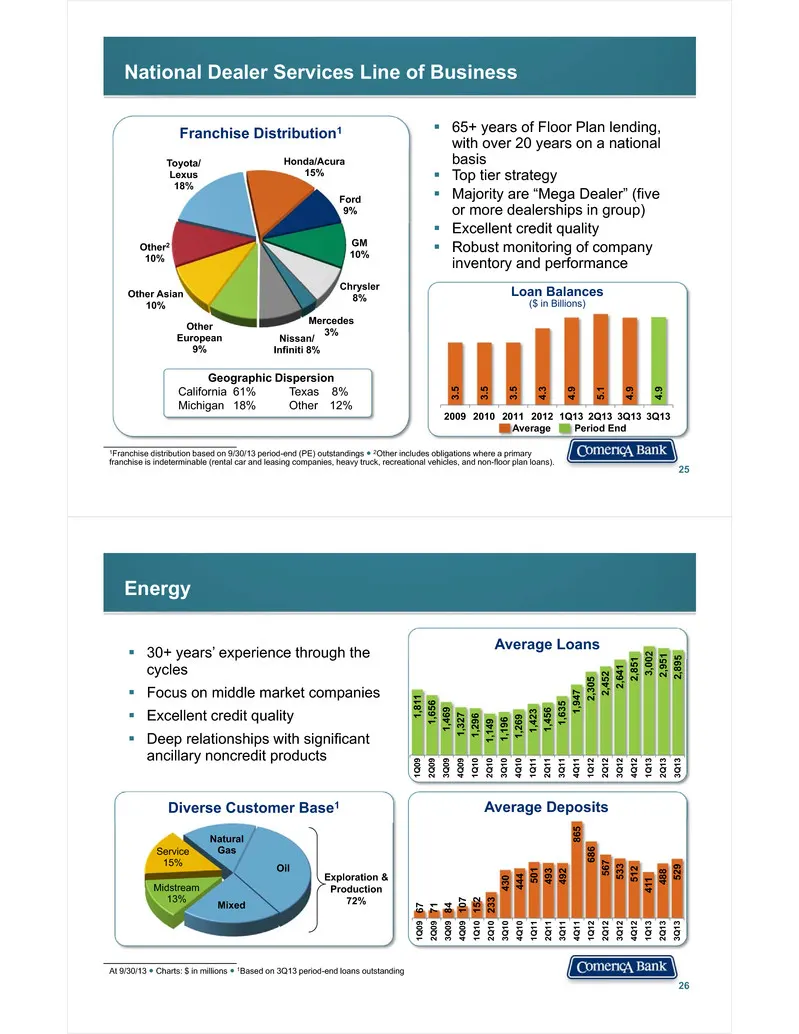
National Dealer Services Line of Business 25 Toyota/Lexus18% Honda/Acura 15% Ford 9% GM 10% Chrysler 8% Mercedes 3%Nissan/ Infiniti 8% Other European 9% Other Asian 10% Other210% 65+ years of Floor Plan lending, with over 20 years on a national basis Top tier strategy Majority are “Mega Dealer
Slide 14: Technology and Life Sciences
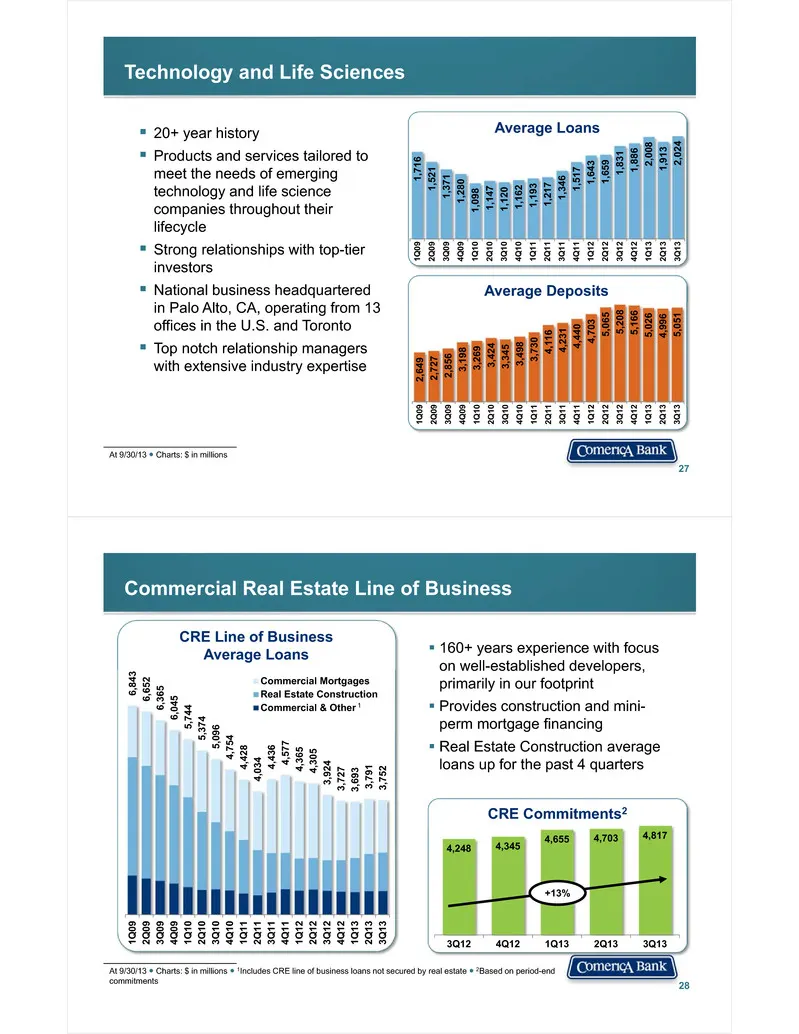
Technology and Life Sciences 20+ year history Products and services tailored to meet the needs of emerging technology and life science companies throughout their lifecycle Strong relationships with top-tier investors National business headquartered in Palo Alto, CA, operating from 13 offices
Slide 15: Shared National Credit Relationships
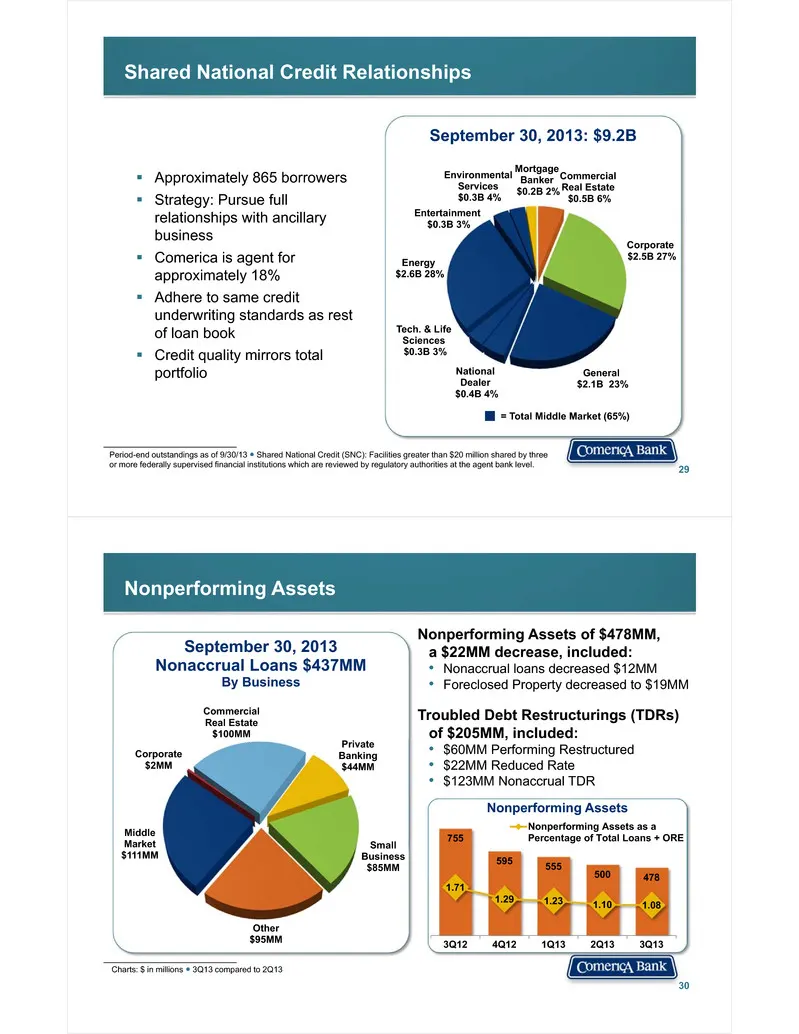
Shared National Credit Relationships 29 Approximately 865 borrowers Strategy: Pursue full relationships with ancillary business Comerica is agent for approximately 18% Adhere to same credit underwriting standards as rest of loan book Credit quality mirrors total portfolio Commercial Real E
Slide 16: Growing Average Noninterest-Bearing Deposits; Government Card Programs
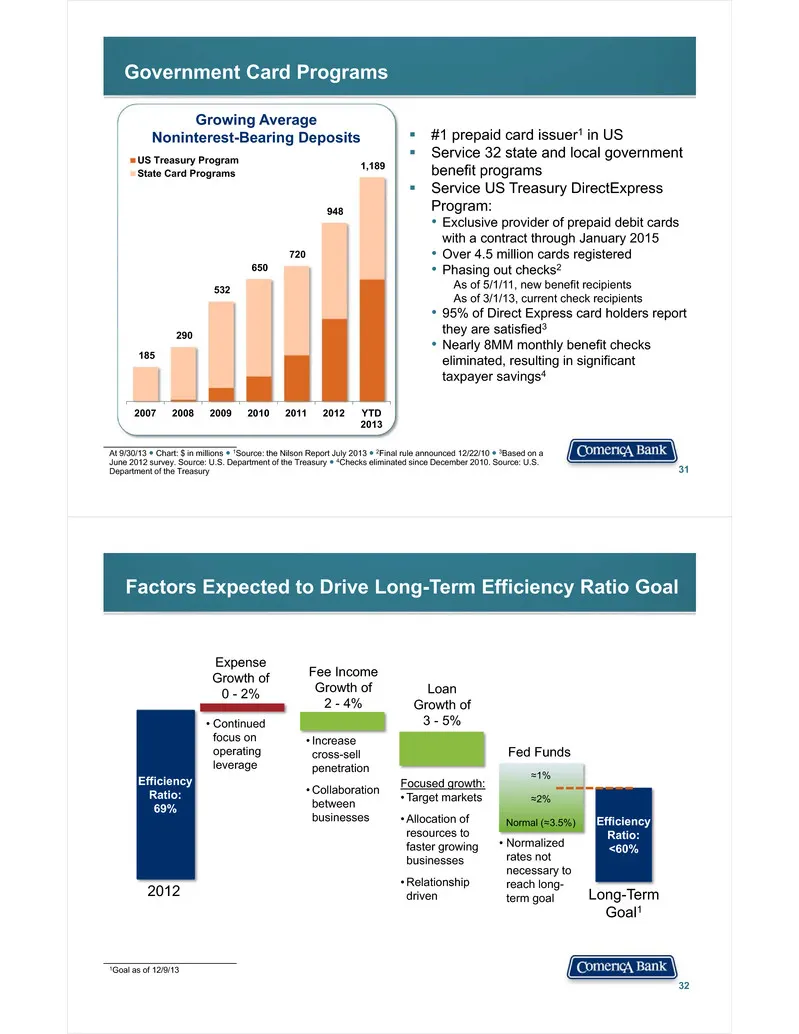
Growing Average Noninterest-Bearing Deposits Government Card Programs 31 #1 prepaid card issuer1 in US Service 32 state and local government benefit programs Service US Treasury DirectExpress Program:• Exclusive provider of prepaid debit cards with a contract through January 2015• Over 4.5 mil
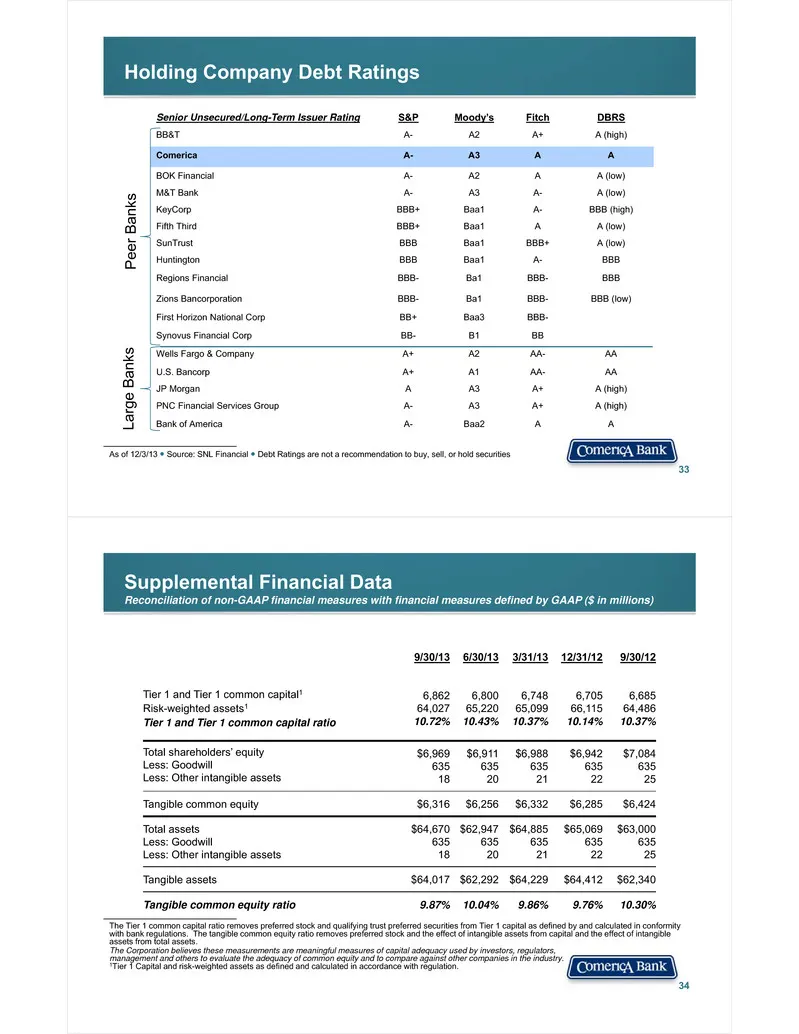
Slide 17: Holding Company Debt Ratings
Senior Unsecured/Long-Term Issuer Rating S&P Moody’s Fitch DBRS BB&T A- A2 A+ A (high) Comerica A- A3 A A BOK Financial A- A2 A A (low) M&T Bank A- A3 A- A (low) KeyCorp BBB+ Baa1 A- BBB (high) Fifth Third BBB+ Baa1 A A (low) SunTrust BBB Baa1 BBB+ A (low) Huntington BBB Baa1 A- BBB Regions Financia
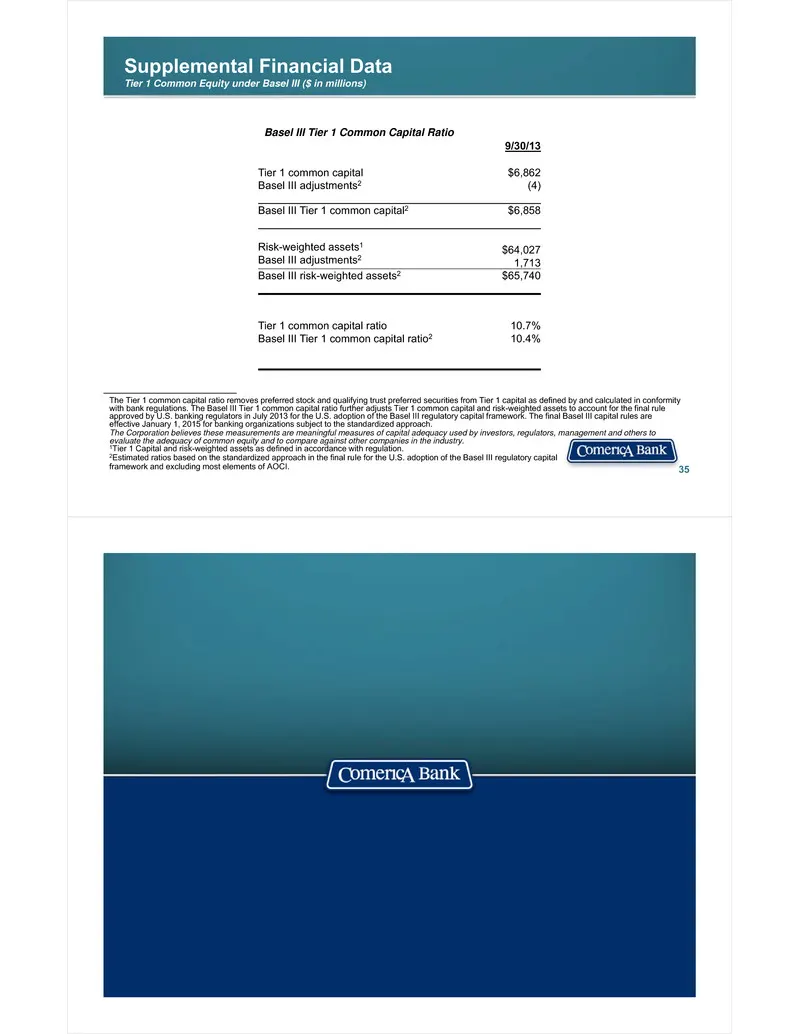
Slide 18: Supplemental Financial Data: Tier 1 Common Equity under Basel III
Supplemental Financial DataTier 1 Common Equity under Basel III ($ in millions) 35 The Tier 1 common capital ratio removes preferred stock and qualifying trust preferred securities from Tier 1 capital as defined by and calculated in conformity with bank regulations. The Basel III Tier 1 common capit
Source: SEC EDGAR · 8-K filed Dec 9, 2013
More decks from Comerica Incorporated
 Goldman Sachs Financial Services Conference 202520 slides · Dec 11, 2025
 Merger or Acquisition (October 2025)18 slides · Oct 6, 2025
 Barclays Global Financial Services Conference 202524 slides · Sep 8, 2025
 Q2 2025 Earnings Presentation24 slides · Jul 18, 2025
 Q1 2025 Earnings Presentation21 slides · Apr 21, 2025
 Q4 2024 Earnings Presentation24 slides · Jan 22, 2025