Endurance Specialty Holdings Ltd
Endurance Specialty — 2010 AIFA Insurance Conference
12 slides from Endurance Specialty's conference presentation, Mar 1, 2010
Slide 1: Strategic and Financial Benefits of ERM
2010 AIFA Insurance Conference Strategic and Financial Benefits of ERM March 1, 2010 Michael E. Angelina, ACAS, MAAA Chief Risk Officer Endurance Specialty Holdings Ltd
Slide 2: Forward looking statements & Regulation G disclaimer
2 Forward looking statements & regulation G disclaimer Safe Harbor for Forward Looking Statements Some of the statements in this presentation include forward-looking statements which reflect our current views with respect to future events and financial performance. Such statements include forward-lo
Slide 3: ERM overview
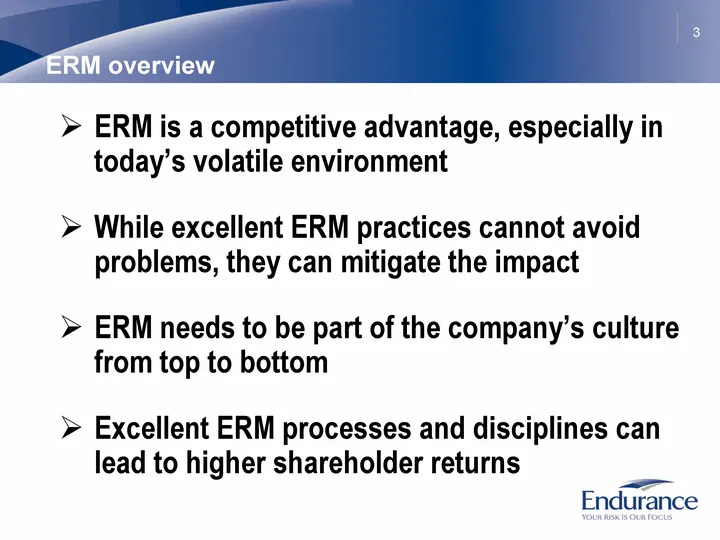
3 ERM overview ERM is a competitive advantage, especially in today's volatile environment While excellent ERM practices cannot avoid problems, they can mitigate the impact ERM needs to be part of the company's culture from top to bottom Excellent ERM processes and disciplines can lead to higher shar
Slide 4: Standard & Poor's ERM evaluations
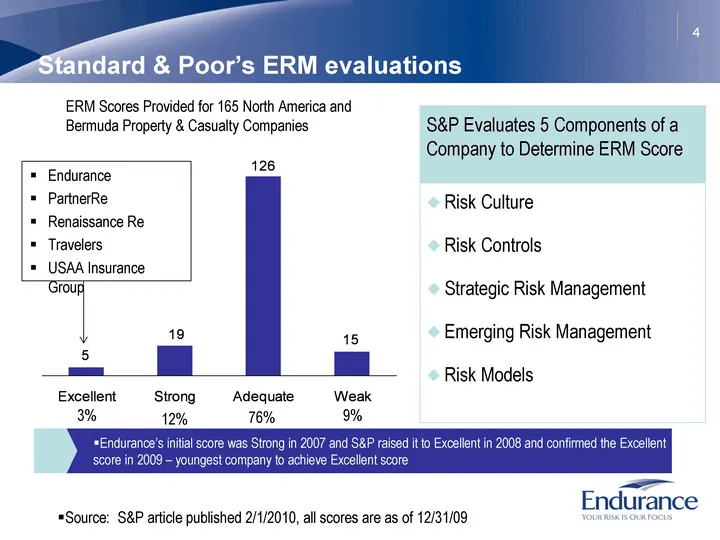
4 Standard & Poor's ERM evaluations Excellent Strong Adequate Weak Property 5 19 126 15 Endurance's initial score was Strong in 2007 and S&P raised it to Excellent in 2008 and confirmed the Excellent score in 2009 - youngest company to achieve Excellent score S&P Evaluates 5 Components of a Company
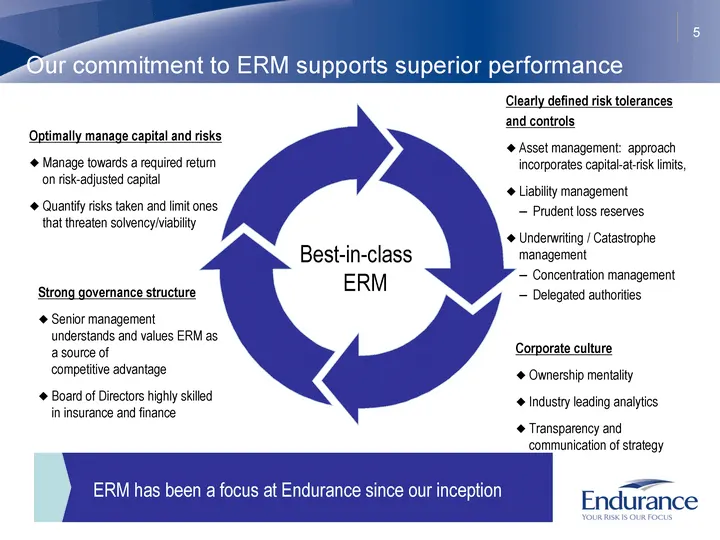
Slide 5: ERM has been a focus at Endurance since our inception
ERM has been a focus at Endurance since our inception 5 Our commitment to ERM supports superior performance Best-in-class ERM Optimally manage capital and risks Manage towards a required return on risk-adjusted capital Quantify risks taken and limit ones that threaten solvency/viability Clearly defi
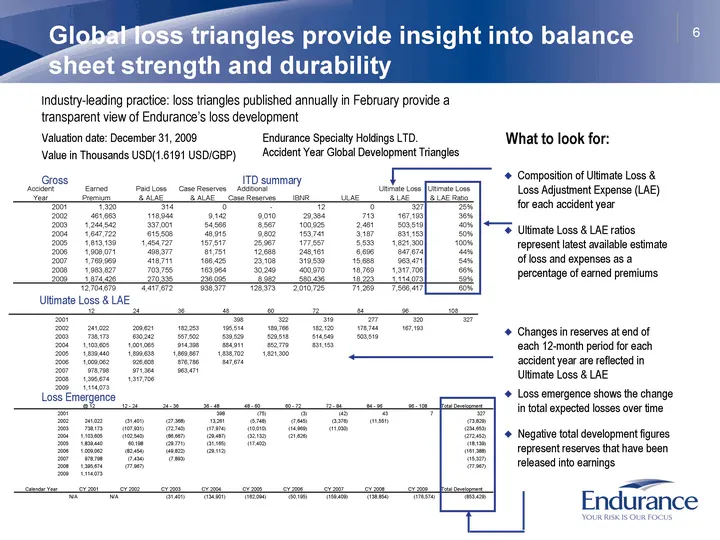
Slide 6: 2001 2 241,022 209,621 182,253 195,514 189,766 182,120 178,744 167,193 2003 738,173 630,242 557,502
12 24 36 48 60 72 84 96 108 2001 398 322 319 277 320 327 2002 241,022 209,621 182,253 195,514 189,766 182,120 178,744 167,193 2003 738,173 630,242 557,502 539,529 529,518 514,549 503,519 2004 1,103,605 1,001,065 914,398 884,911 852,779 831,153 2005 1,839,440 1,899,638 1,869,867 1,838,702 1,821,300 2
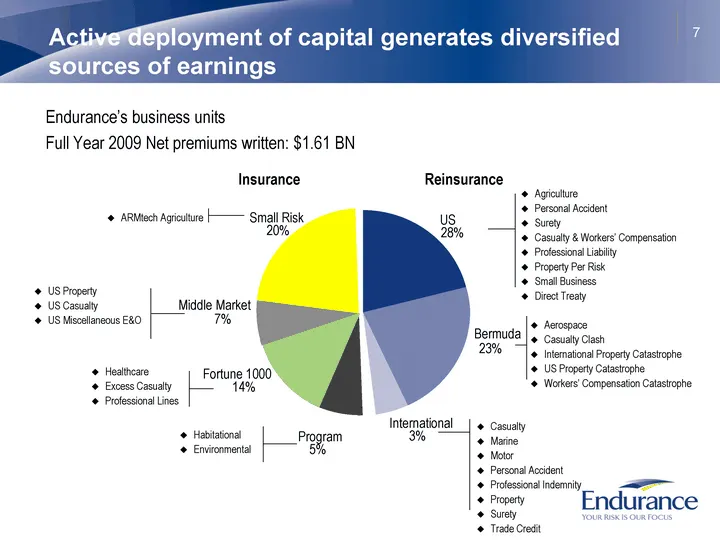
Slide 7: Active deployment of capital generates diversified sources of earnings
7 Active deployment of capital generates diversified sources of earnings Endurance's business units Full Year 2009 Net premiums written: $1.61 BN Reinsurance Insurance Agriculture Personal Accident Surety Casualty & Workers' Compensation Professional Liability Property Per Risk Small Business Direct
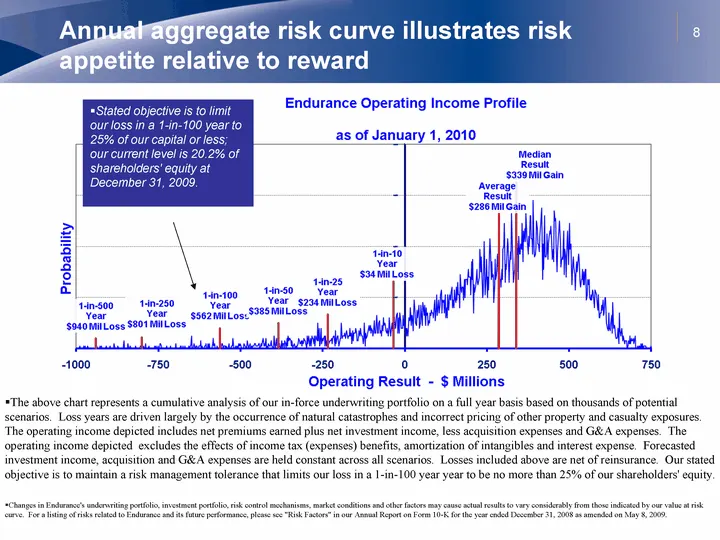
Slide 8: Annual aggregate risk curve illustrates risk appetite relative to reward
8 Annual aggregate risk curve illustrates risk appetite relative to reward Stated objective is to limit our loss in a 1-in-100 year to 25% of our capital or less; our current level is 20.2% of shareholders' equity at December 31, 2009. The above chart represents a cumulative analysis of our in-force
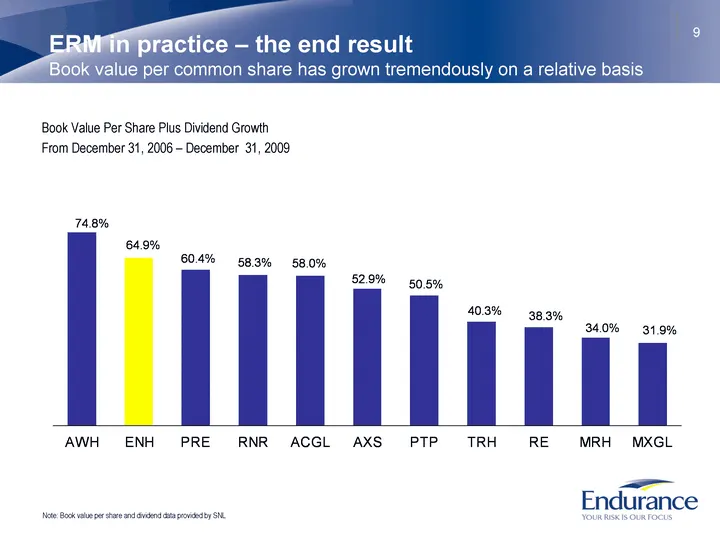
Slide 9: ERM in practice - the end result
9 ERM in practice - the end result Book value per common share has grown tremendously on a relative basis Book Value Per Share Plus Dividend Growth From December 31, 2006 - December 31, 2009 AWH ENH PRE RNR ACGL AXS PTP TRH RE MRH MXGL Book Value 0.748 0.649 0.604 0.583 0.58 0.529 0.505 0.403 0.383
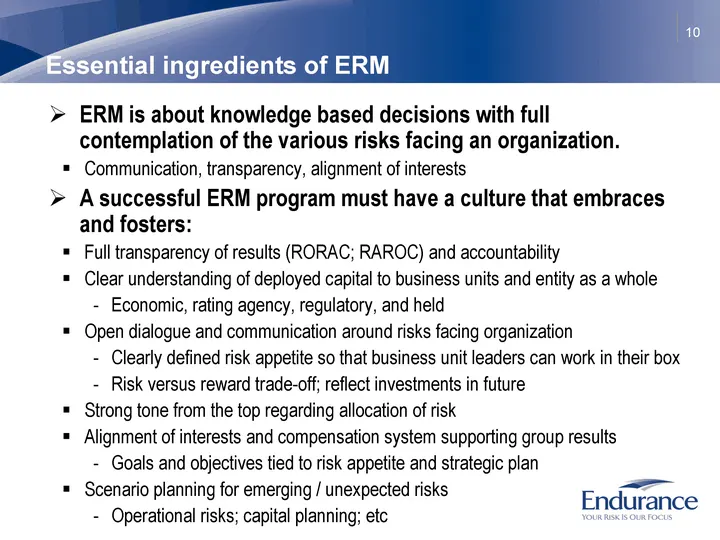
Slide 10: Essential ingredients of ERM
10 Essential ingredients of ERM ERM is about knowledge based decisions with full contemplation of the various risks facing an organization. Communication, transparency, alignment of interests A successful ERM program must have a culture that embraces and fosters: Full transparency of results (RORAC;
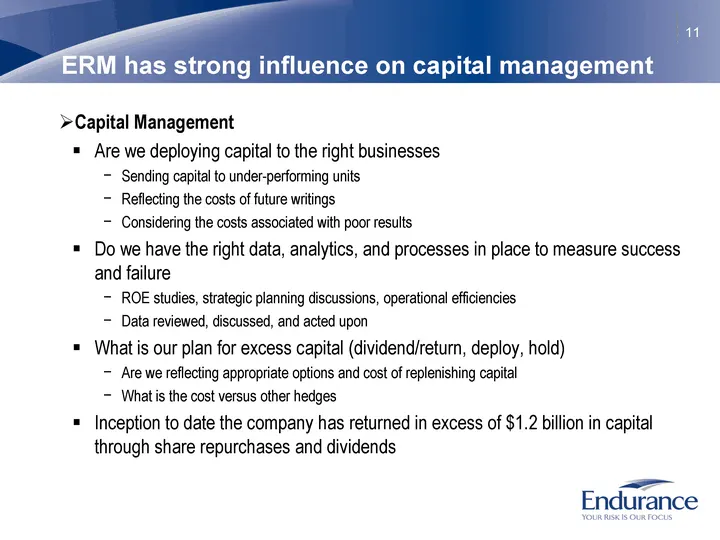
Slide 11: ERM has strong influence on capital management
11 ERM has strong influence on capital management Capital Management Are we deploying capital to the right businesses Sending capital to under-performing units Reflecting the costs of future writings Considering the costs associated with poor results Do we have the right data, analytics, and process
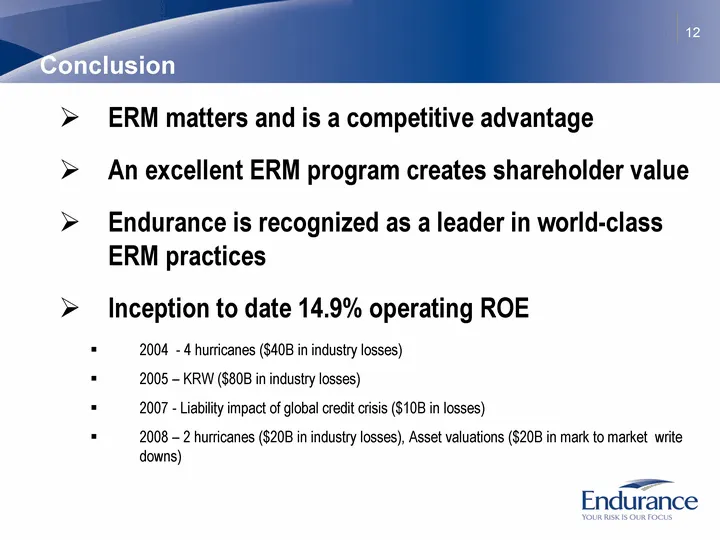
Slide 12: Conclusion
12 Conclusion ERM matters and is a competitive advantage An excellent ERM program creates shareholder value Endurance is recognized as a leader in world-class ERM practices Inception to date 14.9% operating ROE 2004 - 4 hurricanes ($40B in industry losses) 2005 - KRW ($80B in industry losses) 2007 -
Source: SEC EDGAR · 8-K filed Mar 1, 2010
More decks from Endurance Specialty Holdings Ltd
 Merger or Acquisition (October 2016)17 slides · Oct 12, 2016
 Investor Presentation (August 2016)29 slides · Aug 9, 2016
 Investor Presentation (May 2016)28 slides · May 10, 2016
 Investor Presentation (February 2016)29 slides · Feb 9, 2016
 Investor Presentation (February 2015)28 slides · Feb 11, 2015
 Merger or Acquisition (April 2014)22 slides · Apr 14, 2014