Meritor — Wells Fargo 2014 Industrial and Construction Conference
17 slides from Meritor's conference presentation, May 7, 2014

Slide 1: Wells Fargo 2014 Industrial and Construction Conference
1 1 Wells Fargo 2014 Industrial and Construction Conference Kevin Nowlan, Senior Vice President & CFO May 7, 2014
Slide 2: Forward-Looking Statements
2 Forward-Looking Statements This presentation contains statements relating to future results of the company (including certain projections and business trends) that are “forward-looking statements” as defined in the Private Securities Litigation Reform Act of 1995. Forward-looking statements are ty
Slide 3: Second Quarter Ended Mar. 31, 2014 Segment and Adjusted EBITDA
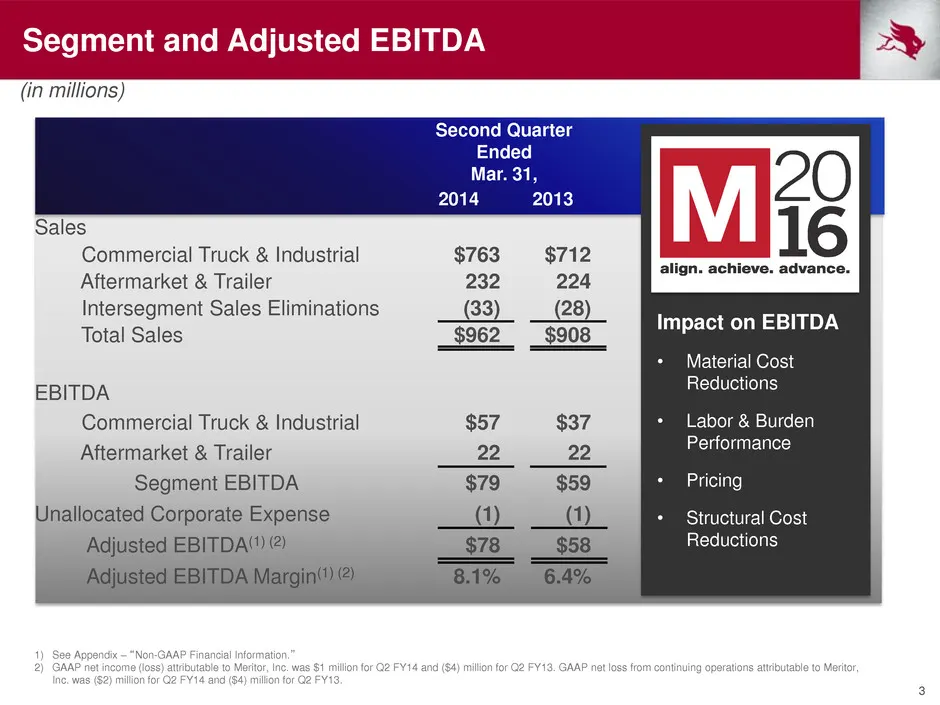
3 Second Quarter Ended Mar. 31, 2014 2013 Sales Commercial Truck & Industrial $763 $712 Aftermarket & Trailer 232 224 Intersegment Sales Eliminations (33) (28) Total Sales $962 $908 EBITDA Commercial Truck & Industrial $57 $37 Aftermarket & Trailer 22 22 Segment EBITDA $79 $59 Unallocated Corporate
Slide 4: FY14 Global Market Outlook
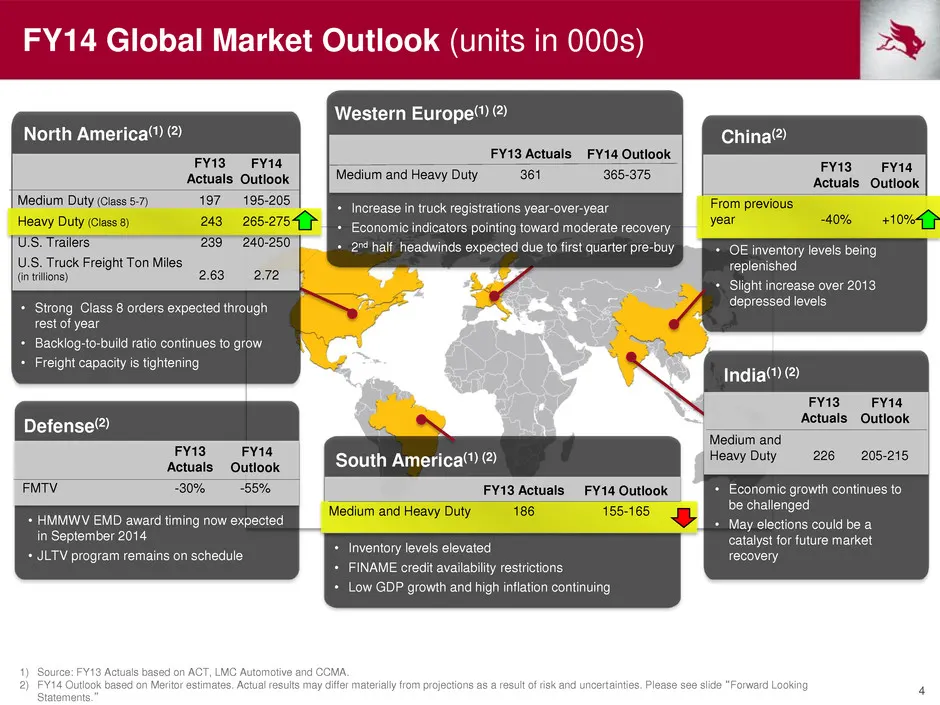
4 FY14 Global Market Outlook (units in 000s) 1) Source: FY13 Actuals based on ACT, LMC Automotive and CCMA. 2) FY14 Outlook based on Meritor estimates. Actual results may differ materially from projections as a result of risk and uncertainties. Please see slide “Forward Looking Statements.” North Am
Slide 5: Achieved Greater Financial Flexibility with Recent Actions
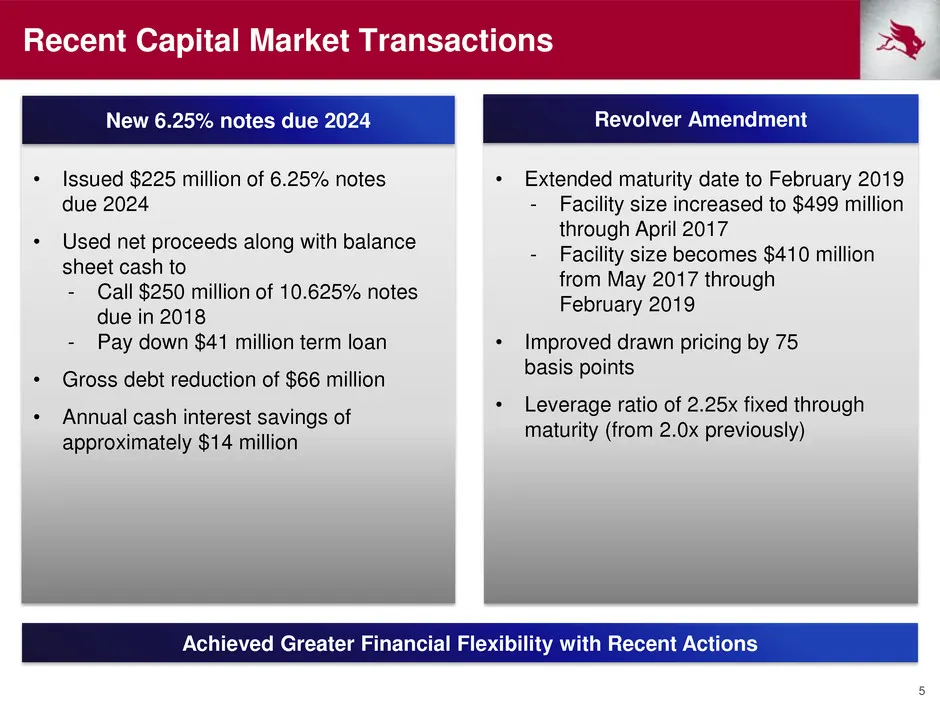
5 Achieved Greater Financial Flexibility with Recent Actions Recent Capital Market Transactions • Issued $225 million of 6.25% notes due 2024 • Used net proceeds along with balance sheet cash to - Call $250 million of 10.625% notes due in 2018 - Pay down $41 million term loan • Gross debt reduction
Slide 6: Debt Maturity Profile
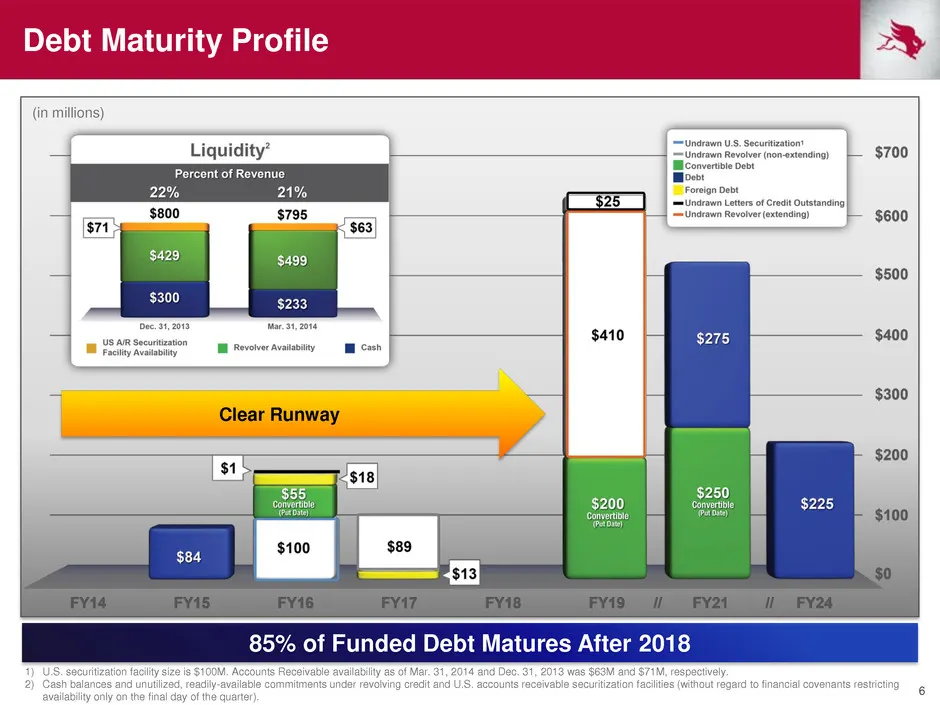
6 Debt Maturity Profile (in millions) 85% of Funded Debt Matures After 2018 Clear Runway 1) U.S. securitization facility size is $100M. Accounts Receivable availability as of Mar. 31, 2014 and Dec. 31, 2013 was $63M and $71M, respectively. 2) Cash balances and unutilized, readily-available commitmen
Slide 7: Liquidity Usage 2015 – 2017
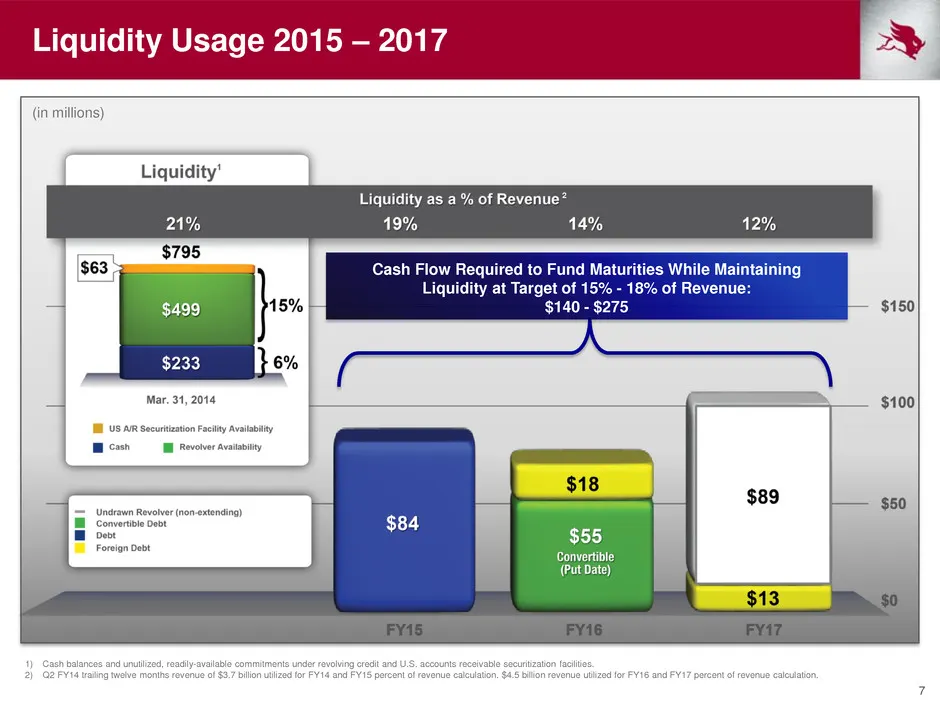
7 Liquidity Usage 2015 – 2017 (in millions) Cash Flow Required to Fund Maturities While Maintaining Liquidity at Target of 15% - 18% of Revenue: $140 - $275 1) Cash balances and unutilized, readily-available commitments under revolving credit and U.S. accounts receivable securitization facilities. 2
Slide 8: Fiscal Year 2014 Outlook
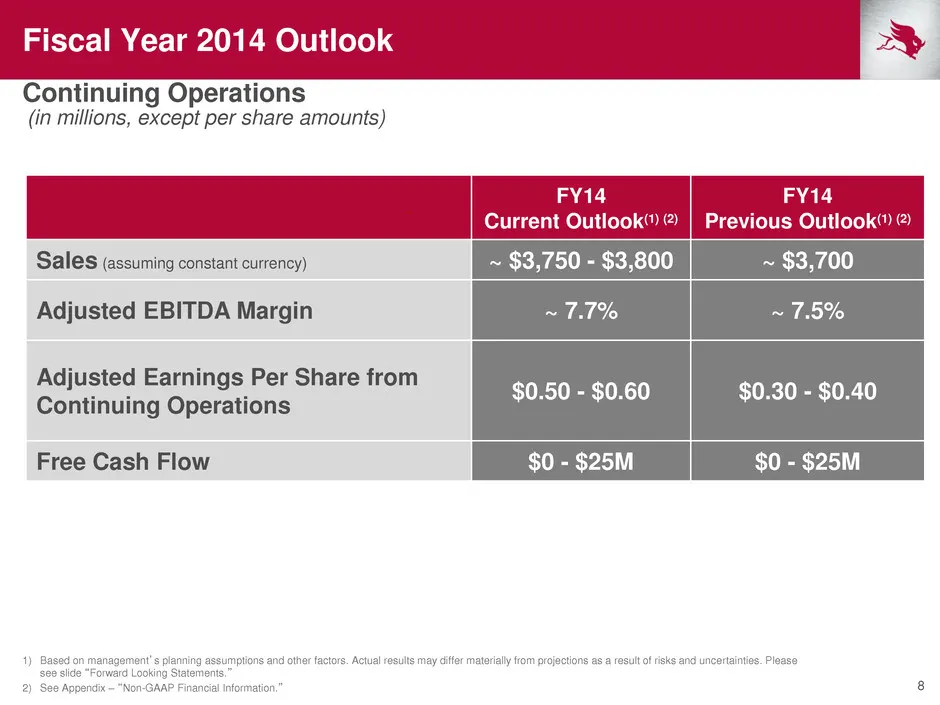
8 Fiscal Year 2014 Outlook Continuing Operations 1) Based on management’s planning assumptions and other factors. Actual results may differ materially from projections as a result of risks and uncertainties. Please see slide “Forward Looking Statements.” 2) See Appendix – “Non-GAAP Financial Informa
Slide 9: M2016 – Path to Adjusted EBITDA Margin
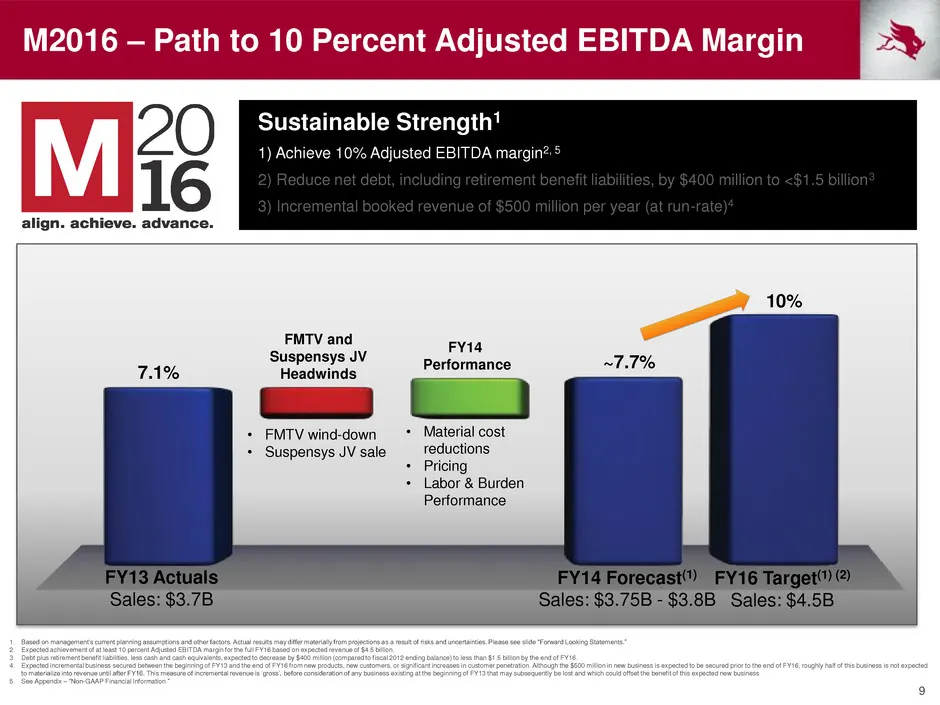
9 M2016 – Path to 10 Percent Adjusted EBITDA Margin Sustainable Strength1 1) Achieve 10% Adjusted EBITDA margin2, 5 2) Reduce net debt, including retirement benefit liabilities, by $400 million to <$1.5 billion3 3) Incremental booked revenue of $500 million per year (at run-rate)4 FY14 Forecast(1) S
Slide 10: M2016 – Net Debt Scorecard
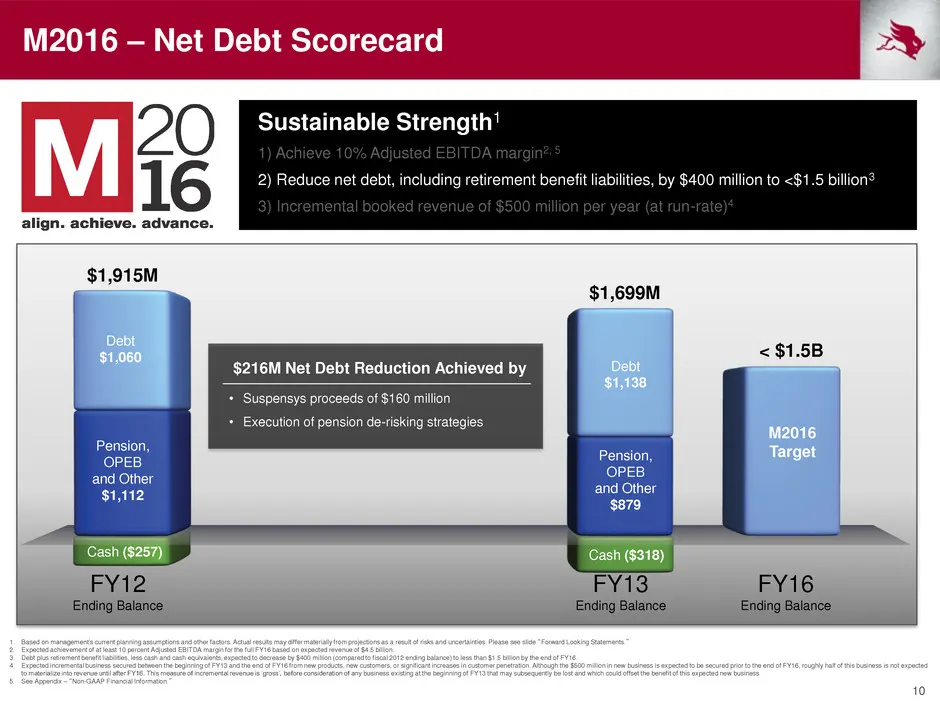
10 M2016 – Net Debt Scorecard Title FY12 Ending Balance FY13 Ending Balance FY16 Ending Balance $1,915M M2016 Target < $1.5B Sustainable Strength1 1) Achieve 10% Adjusted EBITDA margin2, 5 2) Reduce net debt, including retirement benefit liabilities, by $400 million to <$1.5 billion3 3) Incremental
Slide 11: M2016 - Retirement Benefit Liabilities
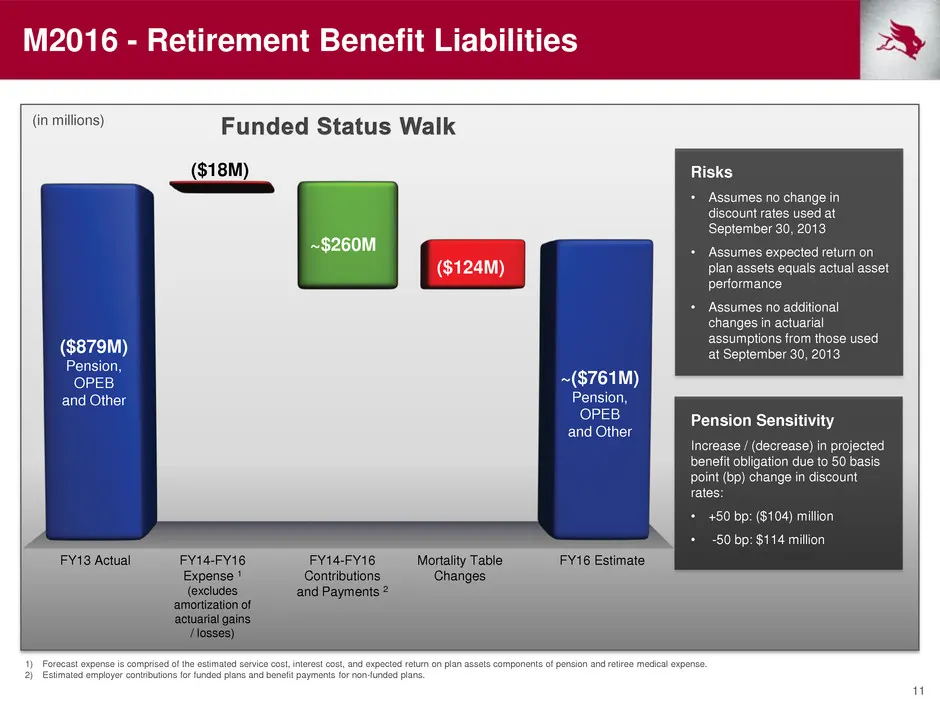
11 FY13 Actual FY14-FY16 Expense 1 (excludes amortization of actuarial gains / losses) FY14-FY16 Contributions and Payments 2 FY16 Estimate ($879M) Pension, OPEB and Other ~$260M ~($761M) Pension, OPEB and Other ($18M) (in millions) M2016 - Retirement Benefit Liabilities Risks • Assumes no change in
Slide 12: M2016 – Revenue Scorecard
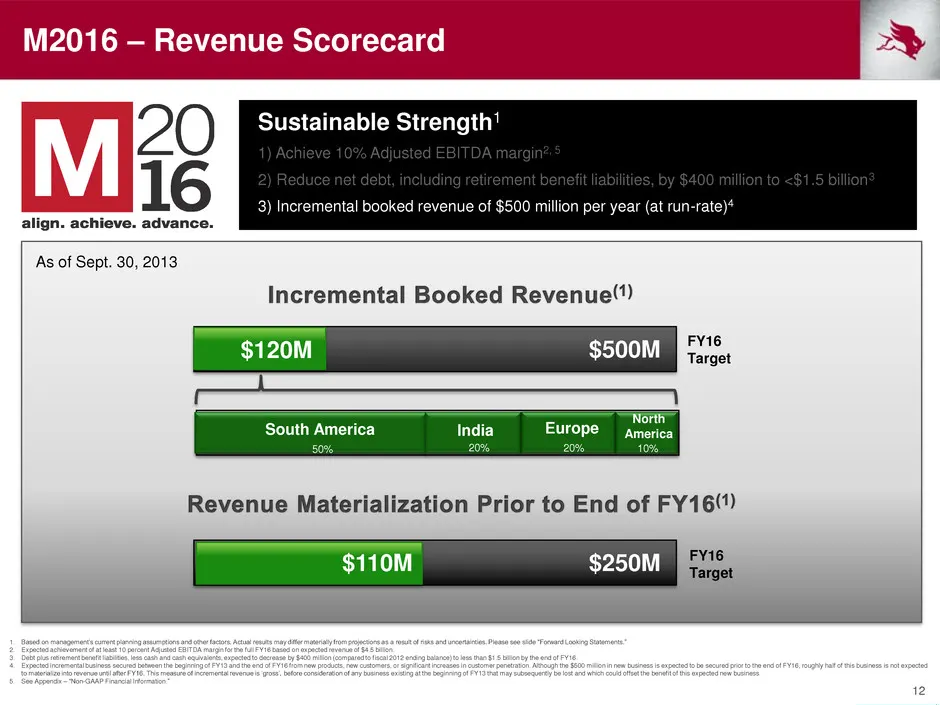
12 M2016 – Revenue Scorecard FY16 Target Sustainable Strength1 1) Achieve 10% Adjusted EBITDA margin2, 5 2) Reduce net debt, including retirement benefit liabilities, by $400 million to <$1.5 billion3 3) Incremental booked revenue of $500 million per year (at run-rate)4 1. Based on management’s curr
Slide 13: Meritor
~y MERITOR
Slide 14: Appendix
Appendix 2S) MERITOR
Slide 15: Use of Non-GAAP Financial Information
15 Use of Non-GAAP Financial Information In addition to the results reported in accordance with accounting principles generally accepted in the United States (“GAAP”) included throughout this presentation, the company has provided information regarding Adjusted income or loss from continuing operati
Slide 16: Non-GAAP Financial Information
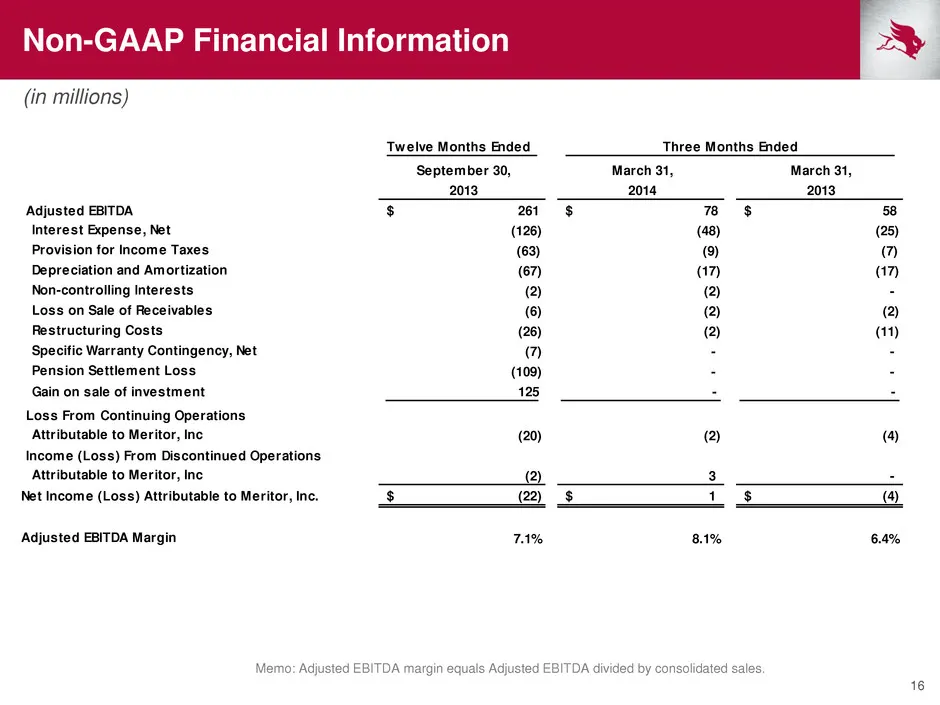
16 Non-GAAP Financial Information Memo: Adjusted EBITDA margin equals Adjusted EBITDA divided by consolidated sales. (in millions) Twelve Months Ended September 30, March 31, March 31, 2013 2014 2013 Adjusted EBITDA $ 261 $ 78 $ 58 Interest Expense, Net (126) (48) (25) Provision for Income Taxes (63
Slide 17: Meritor
~y MERITOR
Source: SEC EDGAR · 8-K filed May 7, 2014
More decks from Meritor Inc
 Merger or Acquisition (March 2022)12 slides · Mar 7, 2022
 Merger or Acquisition (February 2022)8 slides · Feb 22, 2022
 Investor Day (December 2021)66 slides · Dec 7, 2021
 Merger or Acquisition (May 2019)14 slides · May 8, 2019
 Investor Day (December 2018)66 slides · Dec 6, 2018
 Investor Day (December 2017)70 slides · Dec 7, 2017