VWR — Barclays 2015 Global Healthcare Conference
30 slides from VWR's conference presentation, Mar 11, 2015

Slide 1: Barclays 2015 Global Healthcare Conference
Barclays 2015 Global Healthcare Conference March 11, 2015 VWR Corporation Exhibit 99.1

Slide 2: Safe Harbor
Safe Harbor Forward-Looking Statement Non-GAAP Measures and Other Definitions To evaluate our performance, we monitor a number of key indicators at the consolidated level and, in certain cases, at the segment level. As appropriate, we supplement our results of operations determined in accordance wit
Slide 3: VWR: Outperforming the Industry
VWR: Outperforming the Industry Positioned in large, growing global market Independent solutions provider Revenue growth vs. industry Annual Adjusted EPS growth next 3-5 years $49B #1 EMEA-APAC #2 The Americas Targeting ~2X faster Targeting Double- digit
Slide 4: Agenda
AGENDA VWR: Outperforming the Industry 1 2 3 4 Targeting Adjusted EPS growth next 3-5 years: Double-digit 5 Global player with solid performance record Positioned in attractive markets Unique value proposition Resilient business model Targeting Adjusted EPS growth next 3-5 years: Double-digit Powerf
Slide 5: VWR at a Glance
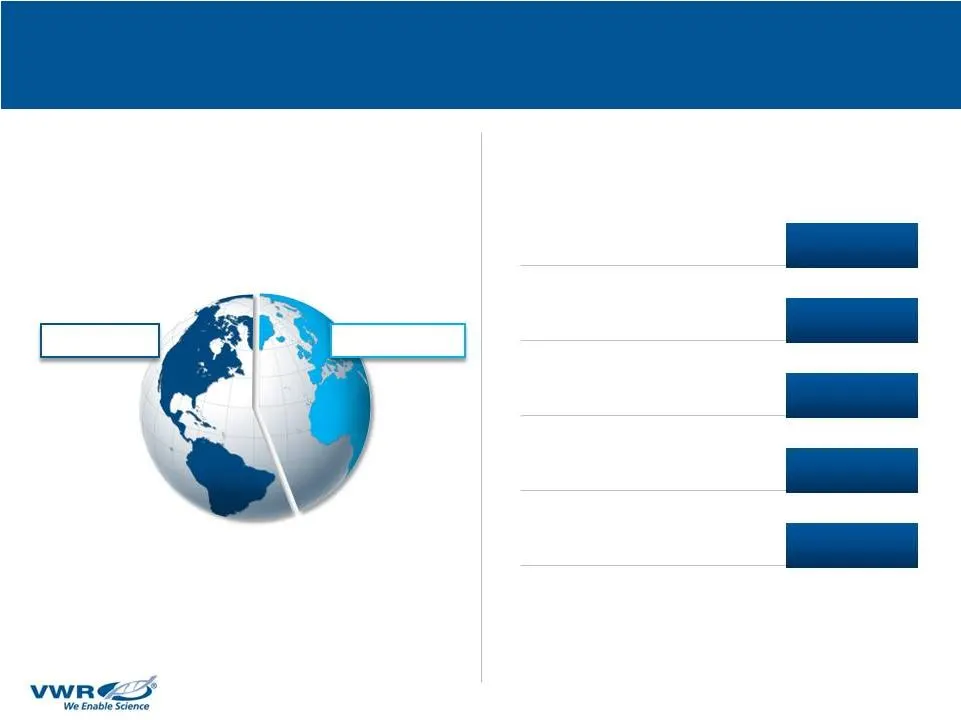
VWR AT A GLANCE Leading Global Provider of Laboratory Products and Services $4.4B $3.3B Oct. 2014 37 8,500+ Americas EMEA-APAC 44% 56% 2014 Segment Revenue Breakdown 2014 Revenues Market cap IPO Acquisitions since 2007 Employees worldwide
Slide 6: VWR: A Profile of Leadership
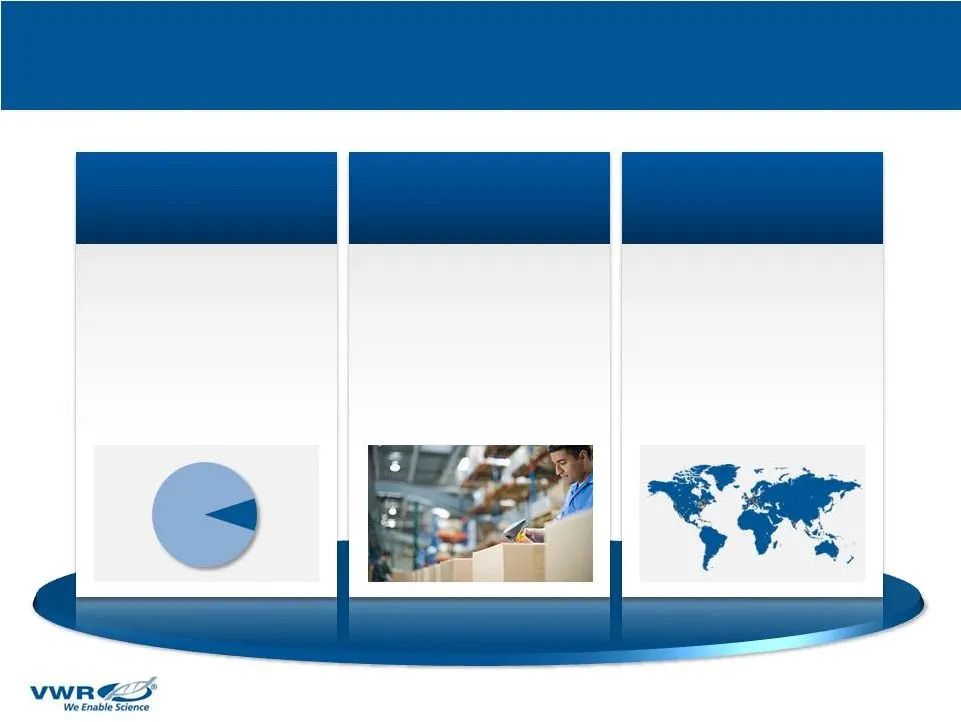
VWR: A Profile of Leadership Global Scale Market Leader Broad Product Range • ~9% share of $49B global market • #1 in Europe • #2 in The Americas • Over 1M SKUs • ~4,500 laboratory suppliers • 17,000 orders per day • Over 160 facilities • 34 countries • ~120,000 customers 9%
Slide 7: Consistent Record of Growth and Margin Expansion
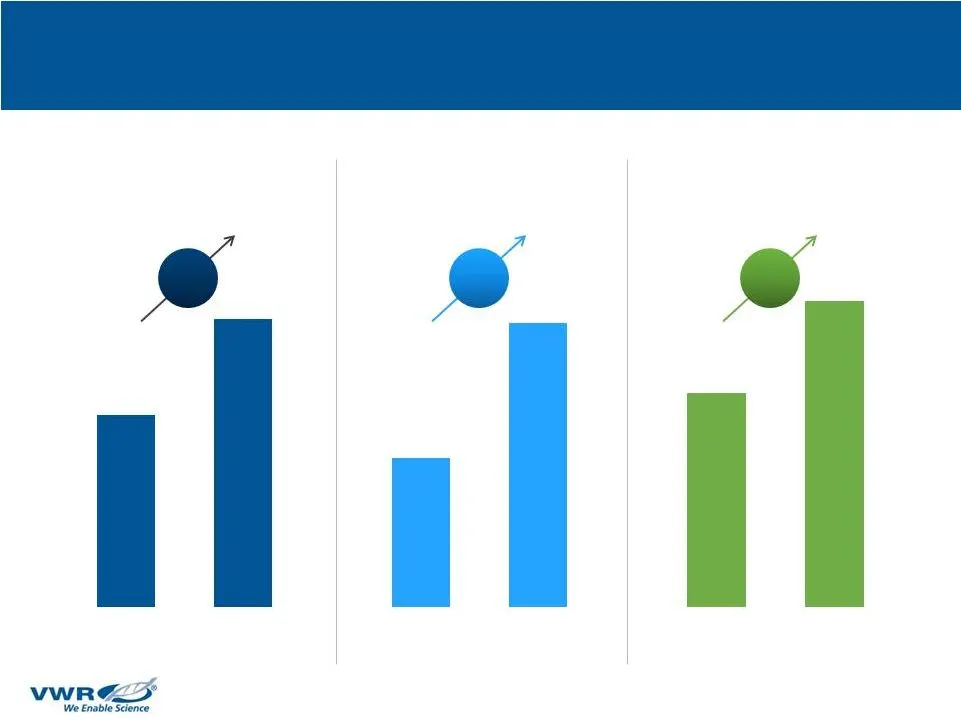
Consistent Record of Growth and Margin Expansion 4% CAGR 8% CAGR +310 bps Revenues Adjusted EBITDA Adjusted EBITDA Margin $3.3B $4.4B $235M $449M 7.2% 10.3%
Slide 8: EMEA-APAC Segment: A Key Growth Driver
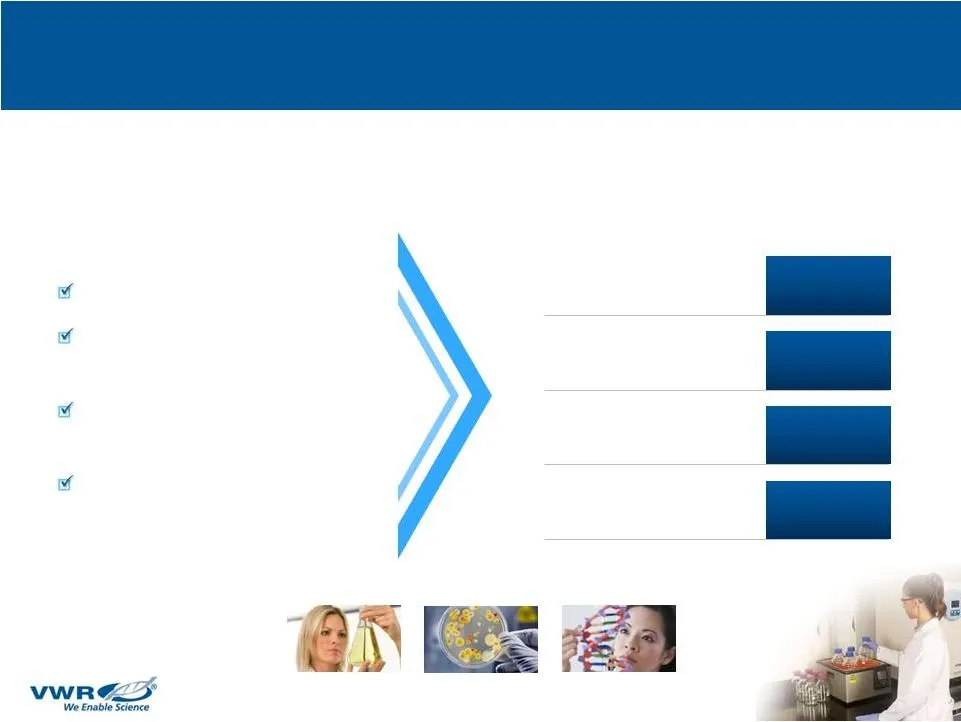
EMEA-APAC Segment: A Key Growth Driver 7% CAGR 14% CAGR 11.8% 460 bps Leading market position Integrated IT platform and distribution network Record of seamless tuck-in acquisitions Long-standing customer relationships Strengths Performance Highlights 2006 to 2014 Revenue growth Adj. EBITDA growth A
Slide 9: Americas Segment: Replicating Success of EMEA-APAC
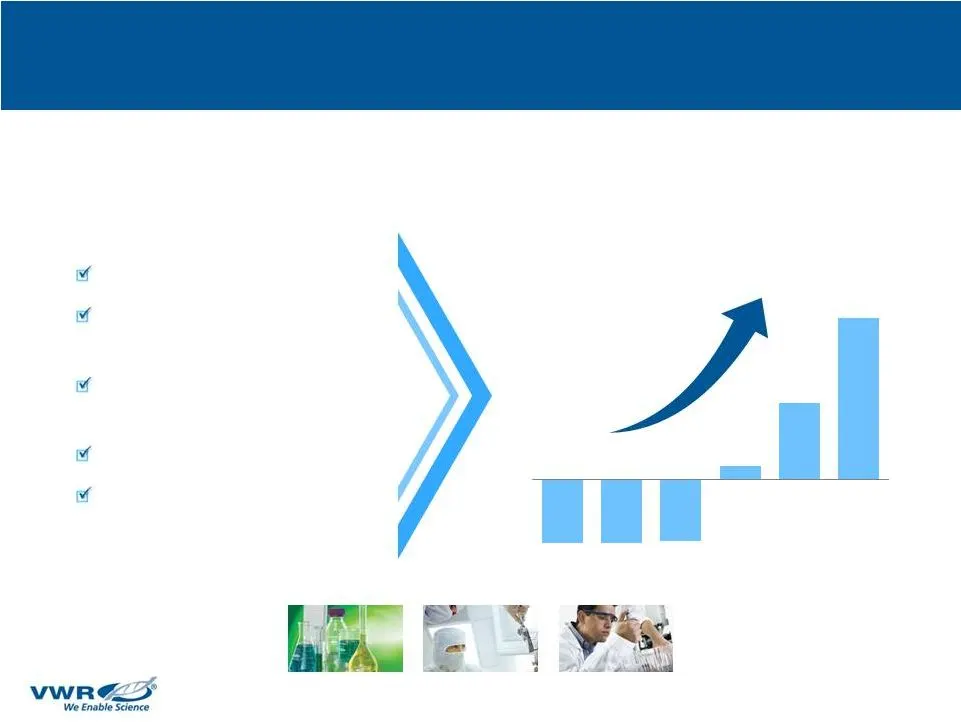
Americas Segment: Replicating Success of EMEA-APAC, Driving Improved Results Clear Evidence Performance is Improving Upgraded IT infrastructure Shifted go-to-market strategy New state of the art distribution facility Upgraded e-commerce Strengthened management team Initiatives/ Investments Q/Q Organ
Slide 10: Agenda
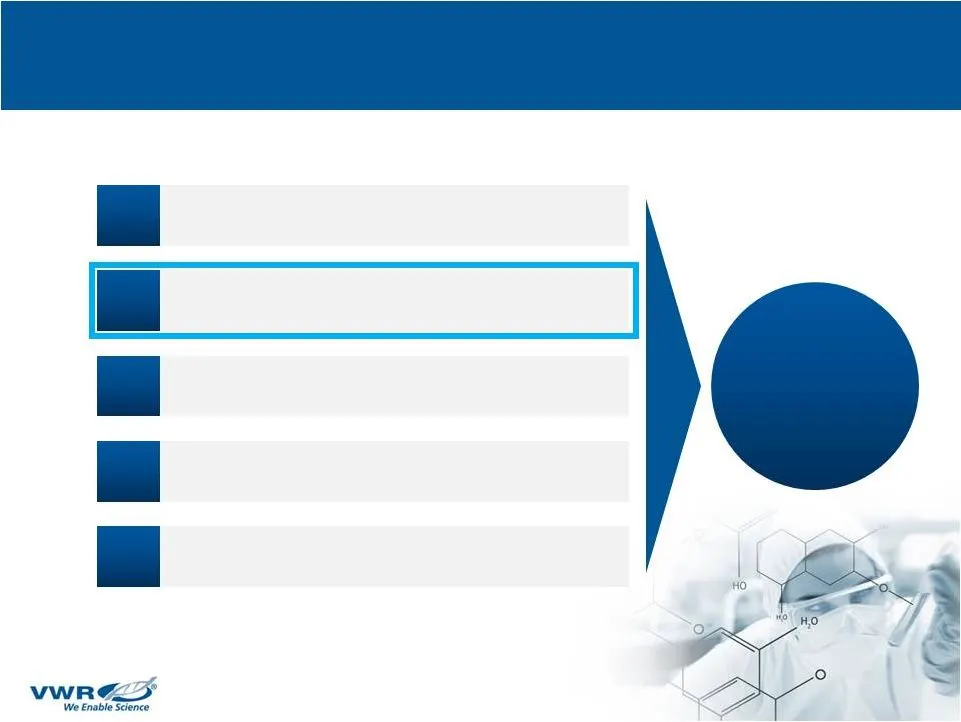
AGENDA VWR: Outperforming the Industry 1 2 3 4 5 Targeting Adjusted EPS growth next 3-5 years: Double-digit Global player with solid performance record Positioned in attractive markets Unique value proposition Resilient business model Powerful growth drivers
Slide 11: Positioned in Large, Growing Market
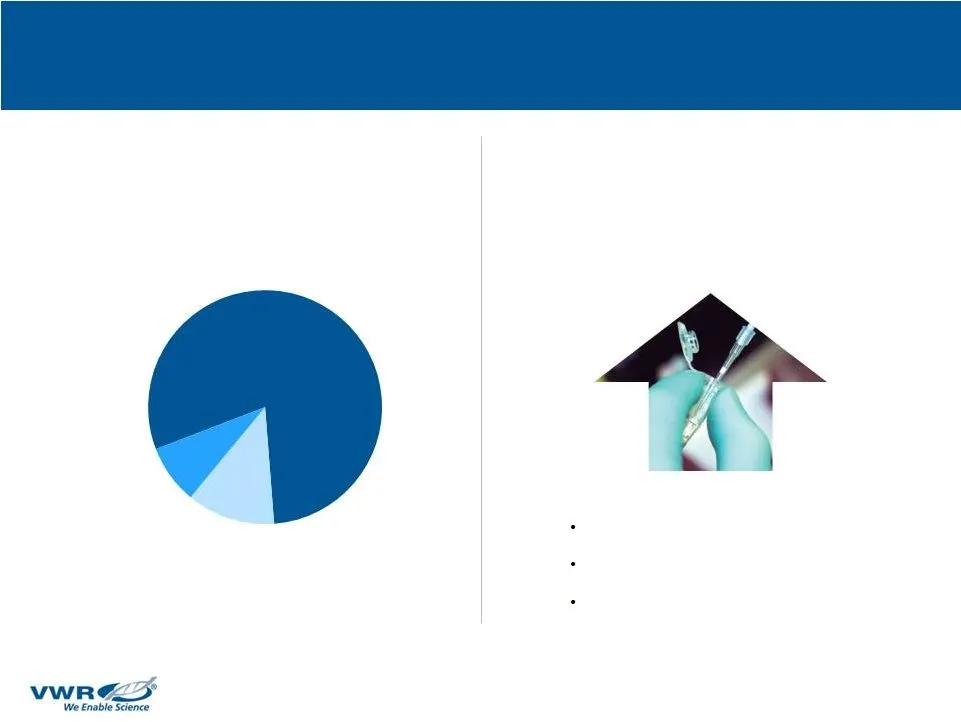
Positioned in Large, Growing Market $39B $4B $49B VWR Addressable Market* Steadily Growing Lab services Bioprocess chemicals and consumables ~2% annually $6B Lab products *Source: Frost & Sullivan’s 2014 Annual Report: Forecast and Analysis of the Global Market f or Laboratory Products (published Oc
Slide 12: Competitive Landscape: Uniquely Positioned in Fragmented Lab Products Market
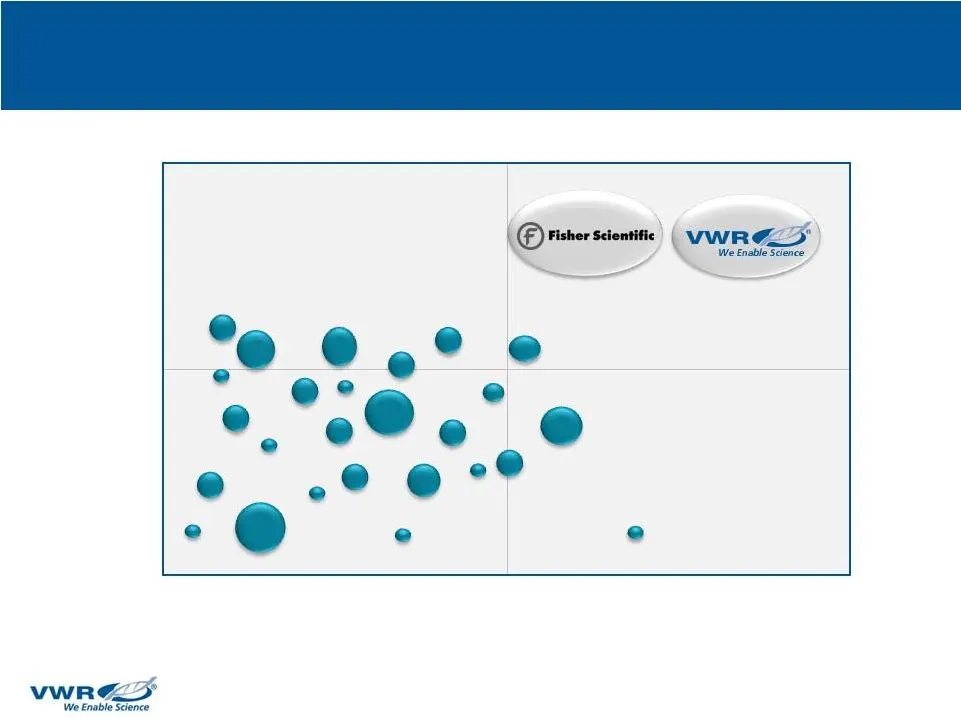
Competitive Landscape: VWR is Uniquely Positioned in Highly Fragmented Lab Products Market Fragmented market with many smaller niche companies Regional Global Footprint Narrow Broad Product Range
Slide 13: Successful Acquisition Record – Since 2007
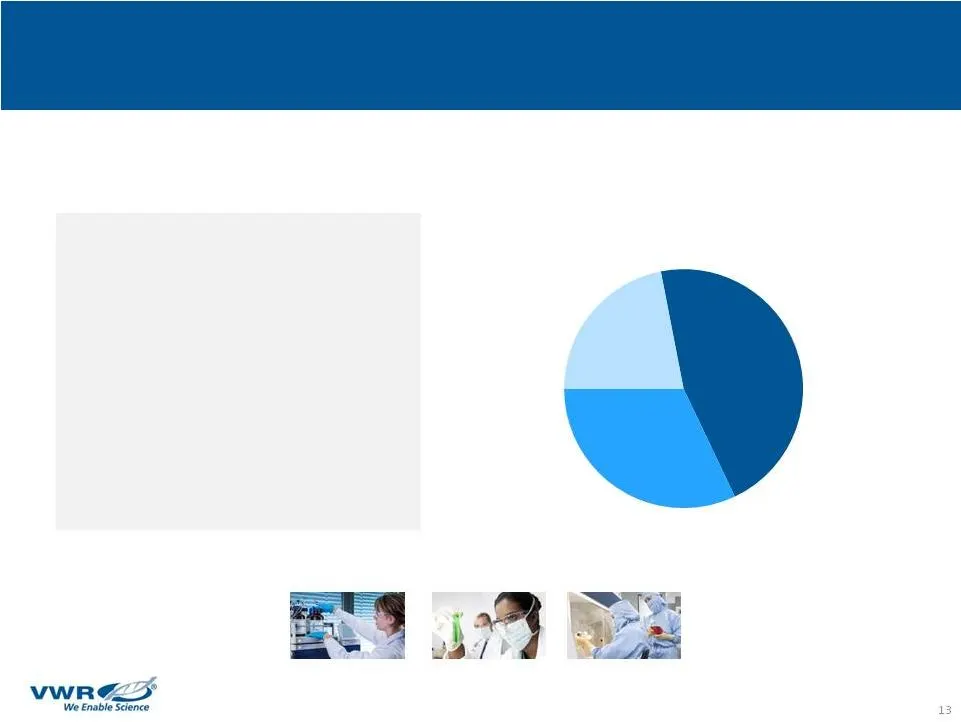
Successful Acquisition Record – 37 Since 2007 32% 46% Focus of Acquisitions to Date Product growth (Self-Manufacturing Capacity) Tuck-ins Geographic expansion 22% • Disciplined approach – hurdle rate of 15% • Invested $550M on acquisitions since 2007 • Adds >1% to revenue growth per annum
Slide 14: Agenda
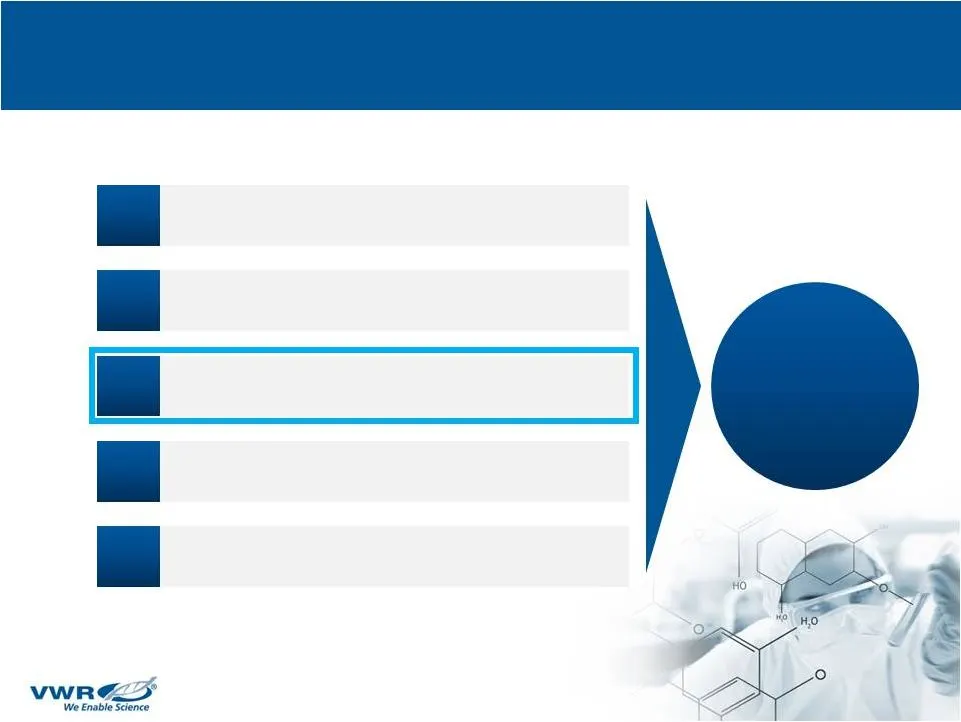
AGENDA VWR: Outperforming the Industry Targeting Adjusted EPS growth next 3-5 years: Double-digit 1 2 3 4 5 Global player with solid performance record Positioned in attractive markets Unique value proposition Resilient business model Powerful growth drivers
Slide 15: Leading Independent Global Provider of Laboratory Products, Services and Solutions
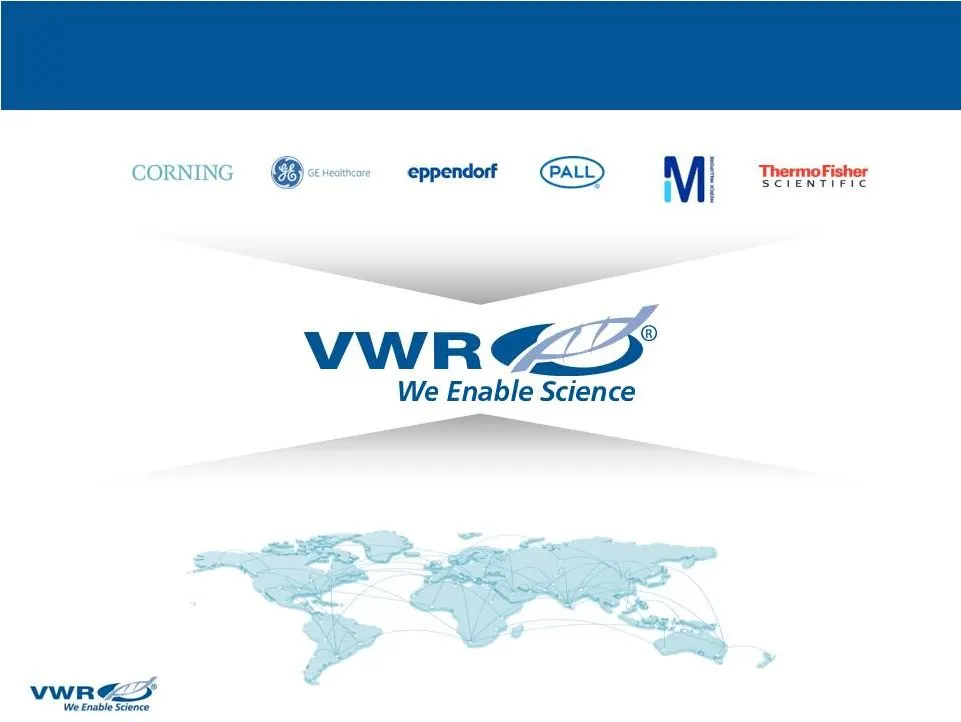
Leading Independent Global Provider of Laboratory Products, Services and Solutions to the Lab Market ~4,500 lab suppliers Branded and private label products and services ~120,000 customers Highly diversified - No single customer >4% of sales
Slide 16: Our Unique Value Proposition
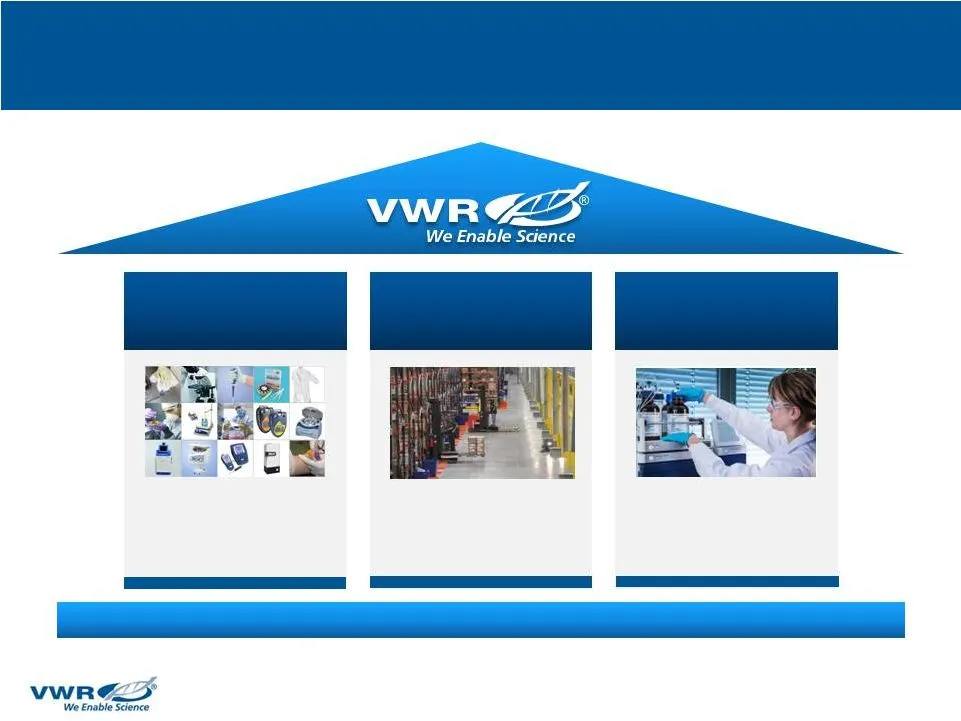
Our Unique Value Proposition Superior Product Choice Operational Excellence Differentiated Services • Unbiased • Broadest range • Logistical expertise • Supply chain partner • Customized solutions • People and technology
Slide 17: Customized and Differentiated Strategy
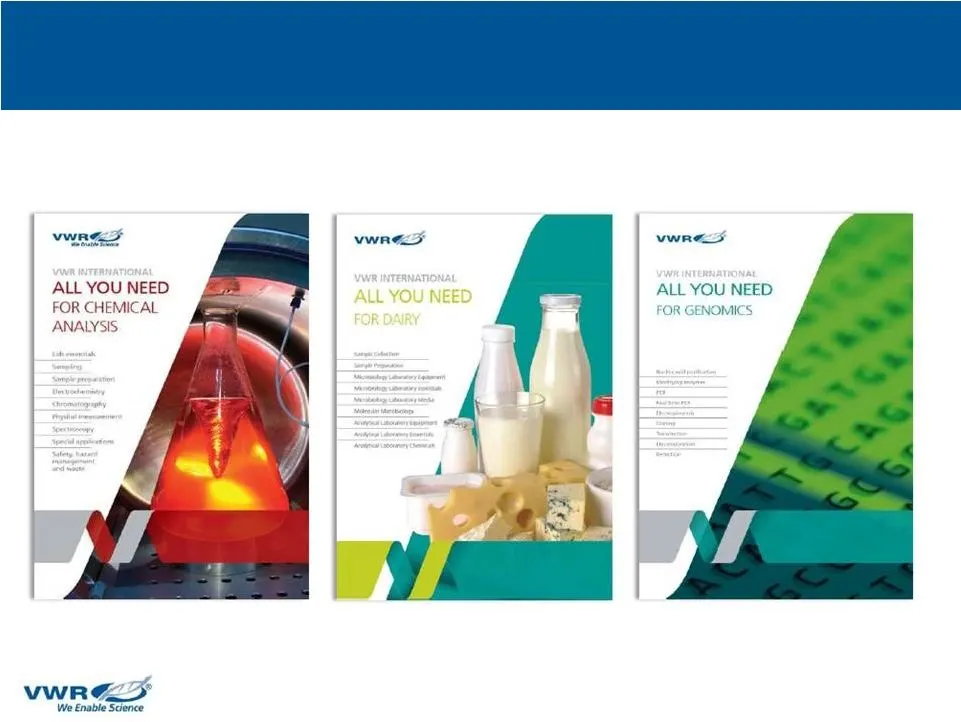
Customized and Differentiated Strategy Examples
Slide 18: Key Offerings that Further Differentiate VWR
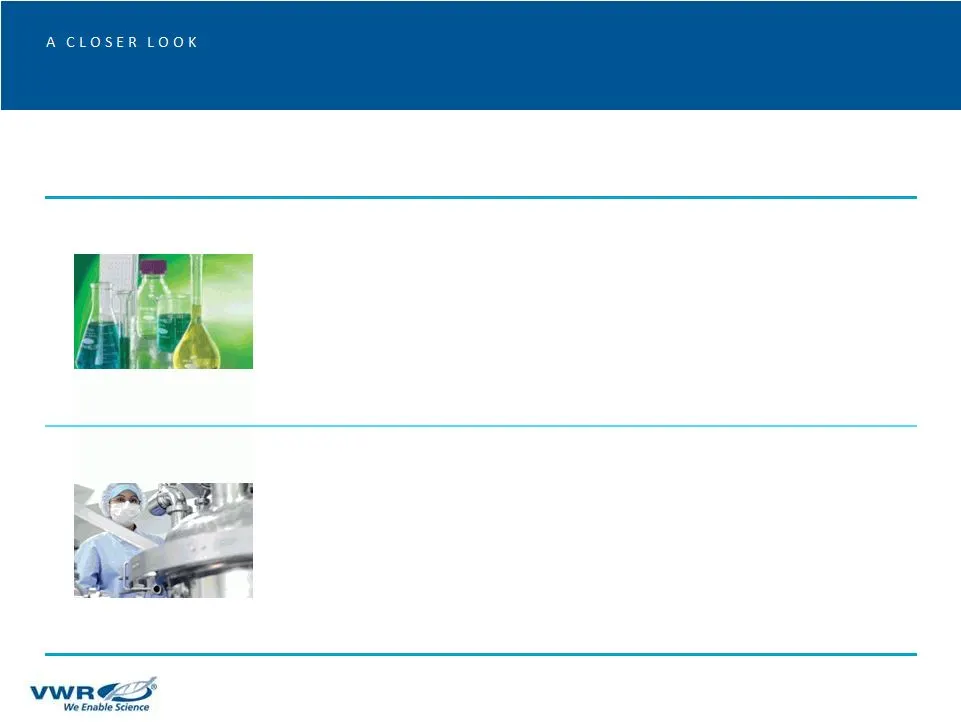
Key Offerings that Further Differentiate VWR Offering Customer Advantages Impact on VWR Private Label Products ~15% of revenues • Greater choice at lower price points • Complement branded suppliers • 8-10% Revenue growth • Attractive margin profile Chemical Manufacturing ~5% of revenues • Customized
Slide 19: Key Offerings that Further Differentiate VWR
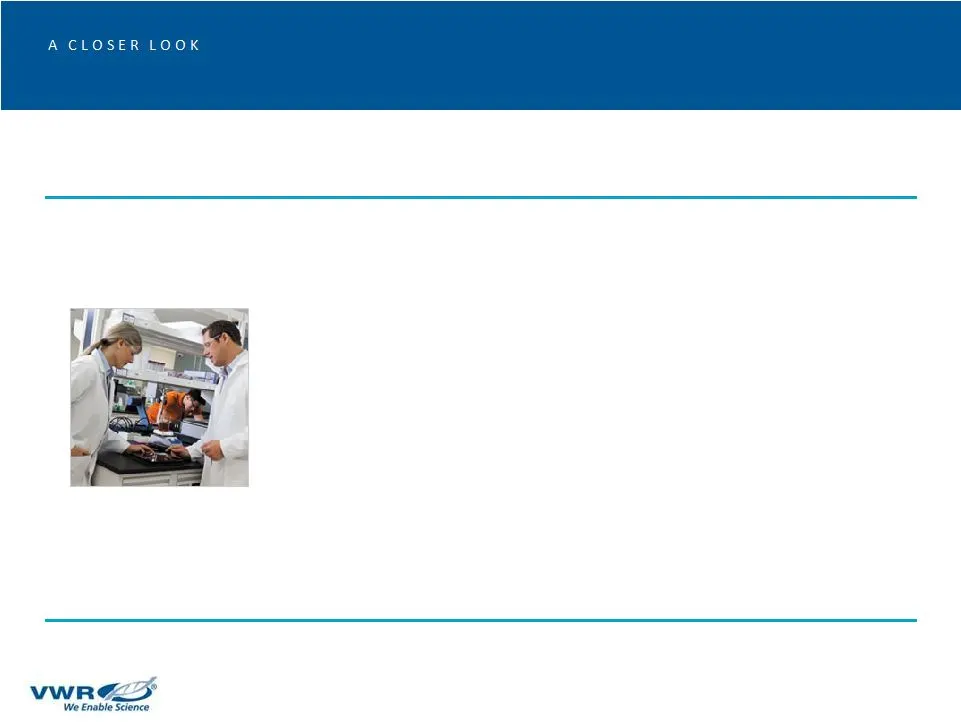
Key Offerings that Further Differentiate VWR VWR Lab Services Offering Customer Advantages Impact on VWR 3% of revenues, but affects customers representing ~25% of revenues • Allows labs to outsource services such as – facility and inventory management – lab maintenance processes • An "Onsite CRO" c
Slide 20: Agenda
VWR: Outperforming the Industry 1 2 3 4 5 Targeting Adjusted EPS growth next 3-5 years: Double-digit Global player with solid performance record Positioned in attractive markets Unique value proposition Resilient business model Powerful growth drivers
Slide 21: Resilient and Attractive Business Model
Resilient and Attractive Business Model High recurring, stable revenues ~80% Expanding Adjusted EBITDA margins Growing cash flow Double-digit Adjusted EPS growth – for deleveraging and acquisitions
Slide 22: Powerful Cash Flow Engine
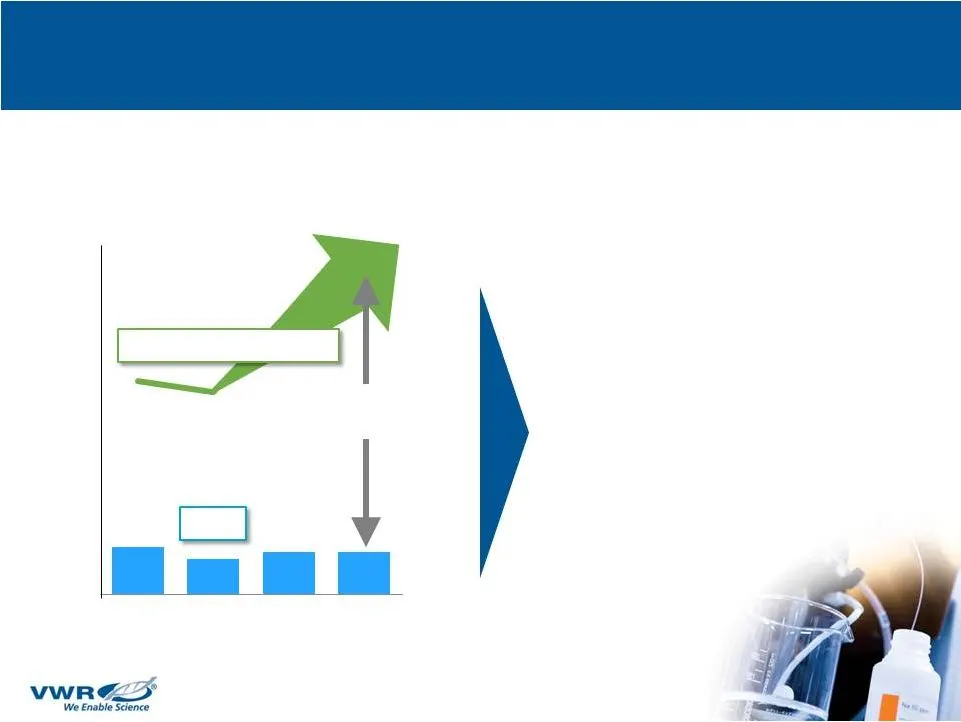
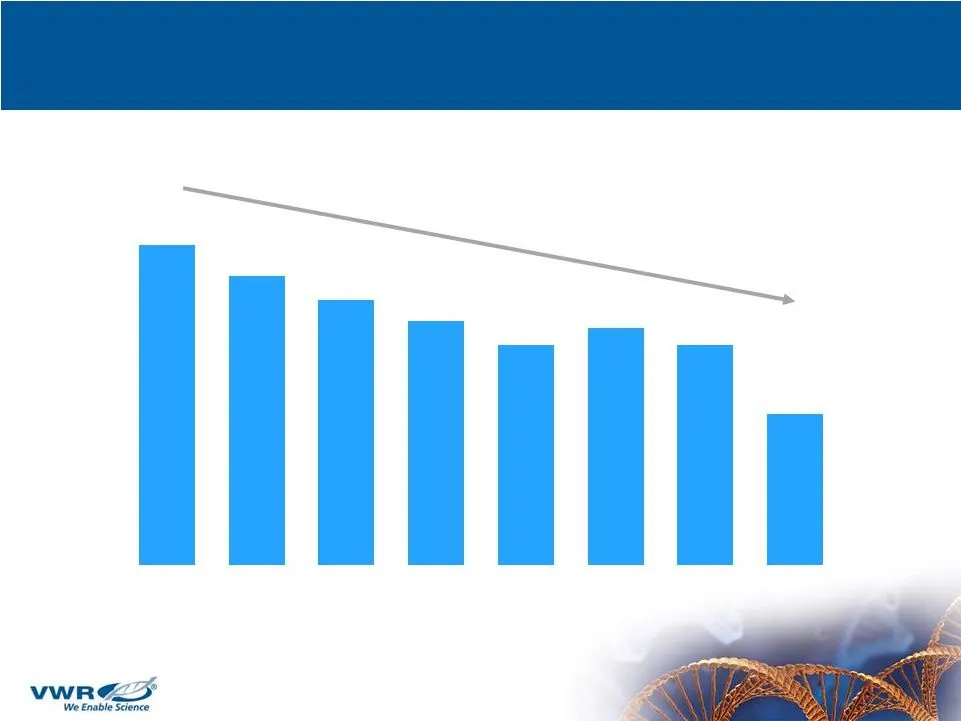
Powerful Cash Flow Engine Growing Free Cash Flow… Fueling Growth in Earnings CapEx • Deleveraging balance sheet – Debt to Adjusted EBITDA down from 6.4x a year ago to 4.4x at year end 2014 • Accelerating growth with acquisitions – $50-$75M annually Cash flow from operations Growing free cash flow
Slide 23: Agenda
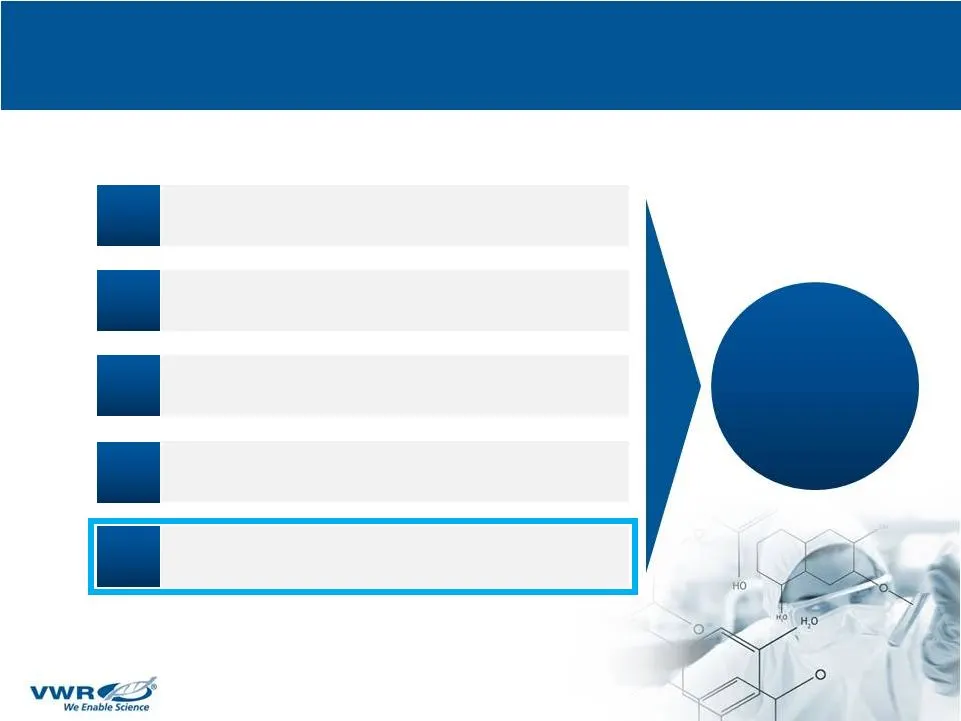
A G E N D A VWR: The Industry Growth Leader 1 2 3 4 5 Targeting Adjusted EPS growth next 3-5 years: Double-digit Global player with solid performance record Positioned in attractive markets Unique value proposition Resilient business model Powerful growth drivers
Slide 24: Multiple Factors Driving Sustained Growth
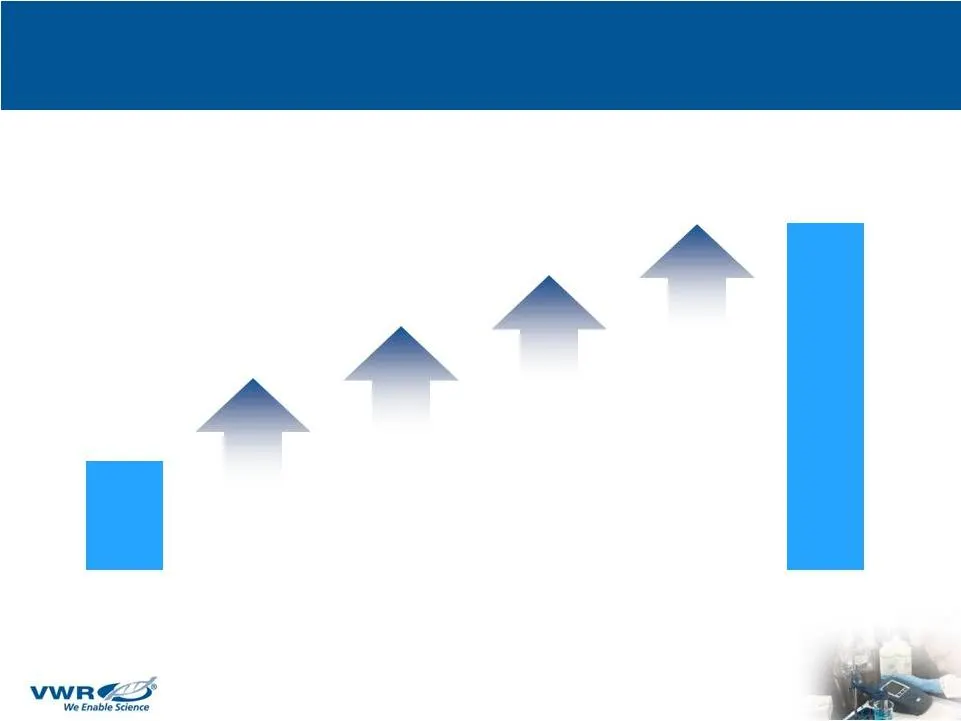
Multiple Factors Driving Sustained Growth Market Growth ~2% Double-digit Adjusted EPS Growth VWR Earnings Growth Faster organic growth Acquisitions OI Margin expansion Deleveraging • Private label • Custom manuf. • VWR • Average $50M-$75M annually • Lower interest costs • Globalize Best Practices CA
Slide 25: Long Term Financial Targets
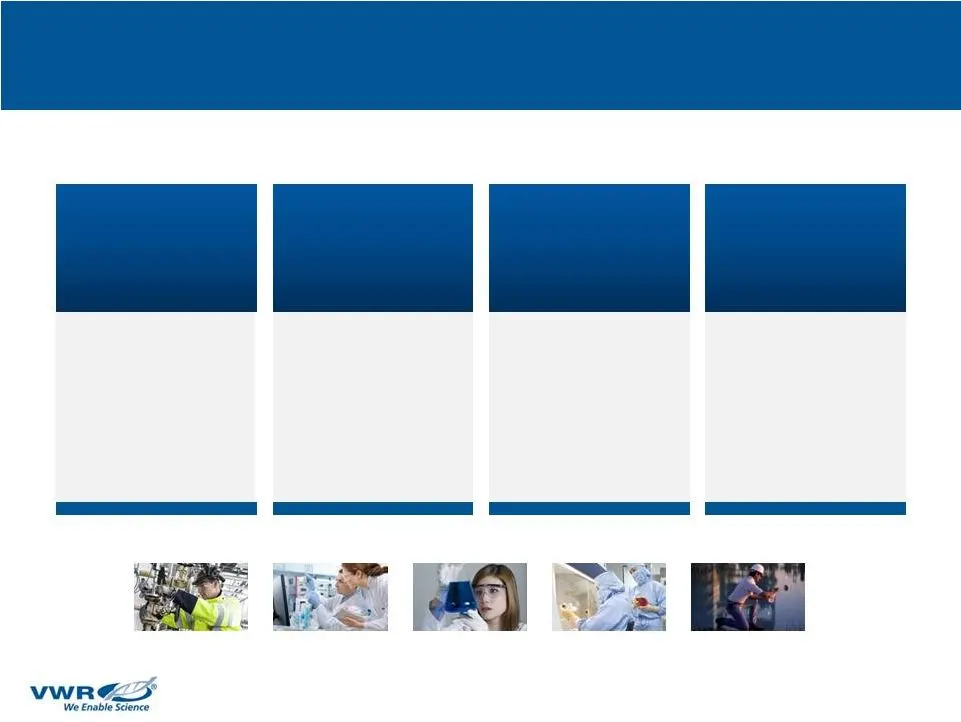
Long Term Financial Targets Revenue Growth vs. Industry Operating Income Margin Adjusted EPS Growth Growing Free Cash Flow Double- digit growth Naturally delevering ~2X faster ~40+ bps Per year expansion next 2-3 years
Slide 26: Deleveraging Continues
Deleveraging Continues…. Net Debt / Adjusted EBITDA 9.3x 8.4x 7.7x 7.1x 6.4x 6.9x 6.4x 4.4x Dec-07 Dec-08 Dec-09 Dec-10 Dec-11 Dec-12 Dec-13 Dec-14
Slide 27: Full Year 2014 – Performance Highlights
Full Year 2014 – Performance Highlights EMEA-APAC continues to outperform the market Americas: Turnaround confirmed and organic earnings growth established Expanded Adjusted EBITDA Margin 30 bps to 10.3% Delevered & executed on our acquisition strategy Adjusted EPS of $1.21 increased 29% YoY A succe

Slide 28: 4Q14 – Performance Highlights
4Q14 – Performance Highlights +4% +16% • Organic revenue growth of 5.9% • Americas organic growth 7.2% and EMEA-APAC organic growth 4.4% • Solid cash flow quarter, operating cash flow of $104M • Adjusted EBITDA $119.5M, up 1% YoY Revenue ($M) Adjusted EPS $1,059 $1,102 4Q13 4Q14 $0.37 $0.43 4Q13 4Q1
Slide 29: FY15 Guidance
FY15 Guidance 2014 Actual SBC Adj. 2014 Adj. 2015 Guidance Range Low High Revenue $4,375 $4,375 $4,244 $4,310 Adjusted EBITDA $449 – $449 $456 $463 Adjusted EPS $1.21 $(0.01) $1.20 $1.42 $1.50 Note: 2015 Adj. EPS guidance includes share-based compensation estimated at $5 to $6 million (pretax). 2015
Slide 30: VWR: The Industry Growth Leader
VWR: The Industry Growth Leader 1 2 3 4 5 Targeting Adjusted EPS growth next 3-5 years: Double-digit Global player with solid performance record Positioned in attractive markets Unique value proposition Resilient business model Powerful growth drivers
Source: SEC EDGAR · 8-K filed Mar 11, 2015