Approach Resources — Wells Fargo Securities 9th Annual Pipeline, MLP and E&P, Services & Utility Symposium 2010
33 slides from Approach Resources's conference presentation, Dec 7, 2010

Slide 1: Wells Fargo Securities 9th Annual Pipeline, MLP and E&P, Services & Utility Symposium
Wells Fargo Securities 9th Annual Pipeline, MLP and E&P, Services & Utility Symposium December 7-8, 2010
Slide 2: Forward-looking statements
Slide 2 Forward-looking statements This presentation contains forward-looking statements within the meaning of Section 27A of the Securities Act of 1933 and Section 21E of the Securities Exchange Act of 1934. All statements, other than statements of historical facts, included in this presentation th
Slide 3: Company overview
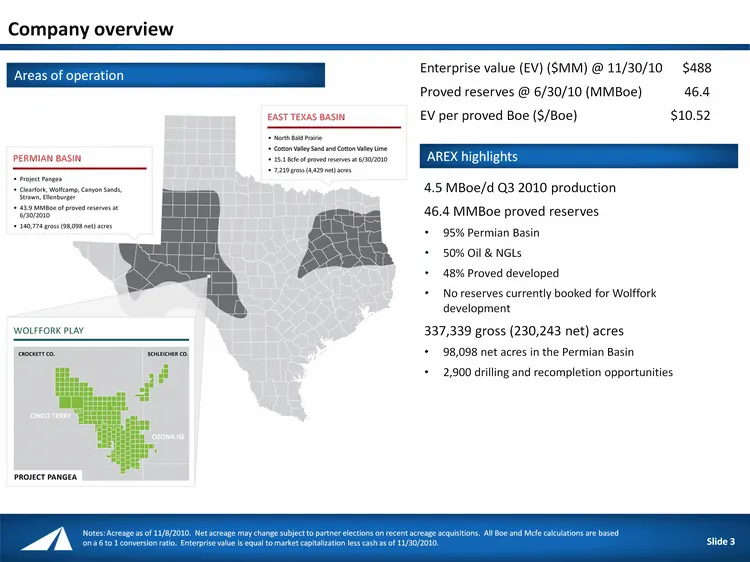
Company overview Notes: Acreage as of 11/8/2010. Net acreage may change subject to partner elections on recent acreage acquisitions. All Boe and Mcfe calculations are based on a 6 to 1 conversion ratio. Enterprise value is equal to market capitalization less cash as of 11/30/2010. Enterprise value (
Slide 4: Key investor highlights
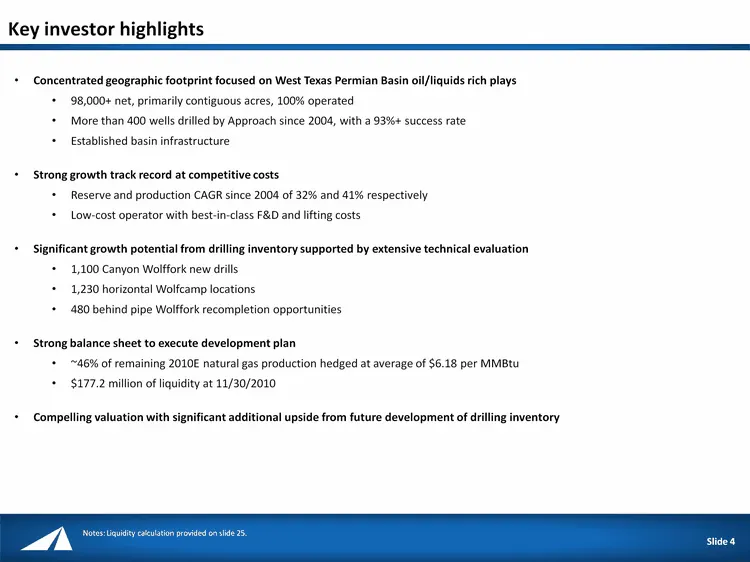
Key investor highlights Concentrated geographic footprint focused on West Texas Permian Basin oil/liquids rich plays 98,000+ net, primarily contiguous acres, 100% operated More than 400 wells drilled by Approach since 2004, with a 93%+ success rate Established basin infrastructure Strong growth trac
Slide 5: Strong track record of reserve and production growth
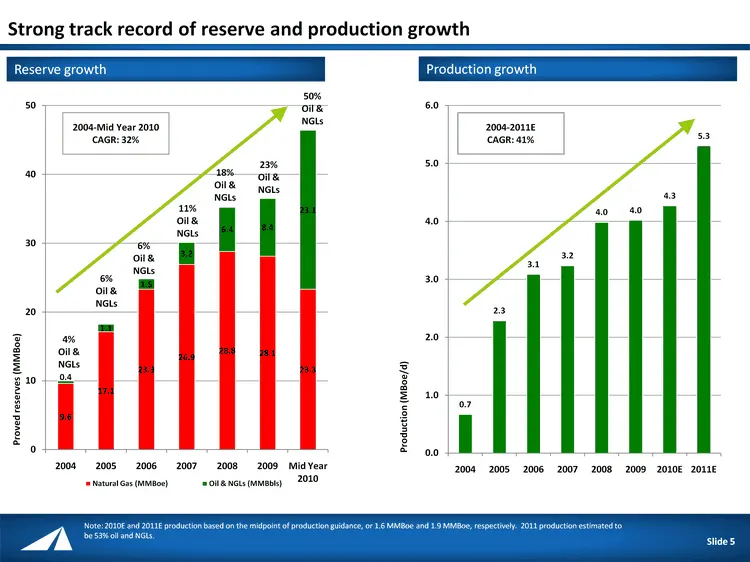
(CHART) (CHART) Strong track record of reserve and production growth October 12, 2010 Slide 5 Note: 2010E and 2011E production based on the midpoint of production guidance, or 1.6 MMBoe and 1.9 MMBoe, respectively. 2011 production estimated to be 53% oil and NGLs. 4% Oil & NGLs 6% Oil & NGLs 6% Oil
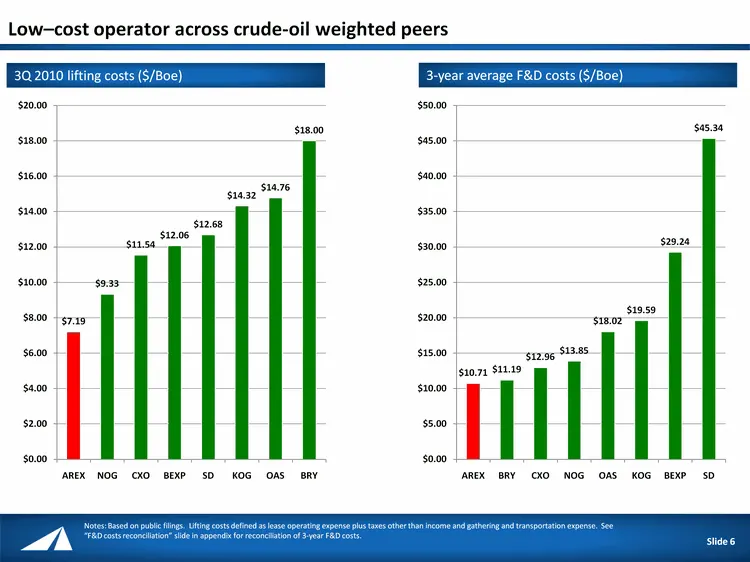
Slide 6: Low-cost operator across crude-oil weighted peers
Low-cost operator across crude-oil weighted peers October 12, 2010 Slide 6 Notes: Based on public filings. Lifting costs defined as lease operating expense plus taxes other than income and gathering and transportation expense. See "F&D costs reconciliation" slide in appendix for reconciliation of 3-
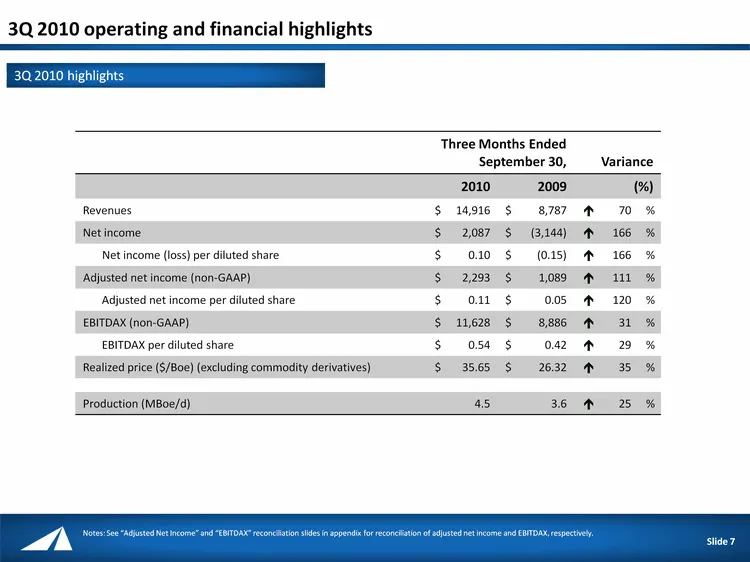
Slide 7: 3Q 2010 operating and financial highlights
3Q 2010 operating and financial highlights October 12, 2010 Slide 7 3Q 2010 highlights Three Months Ended September 30, Three Months Ended September 30, Three Months Ended September 30, Three Months Ended September 30, Variance Variance Variance 2010 2010 2009 2009 (%) (%) (%) Revenues $ 14,916 $ 8,
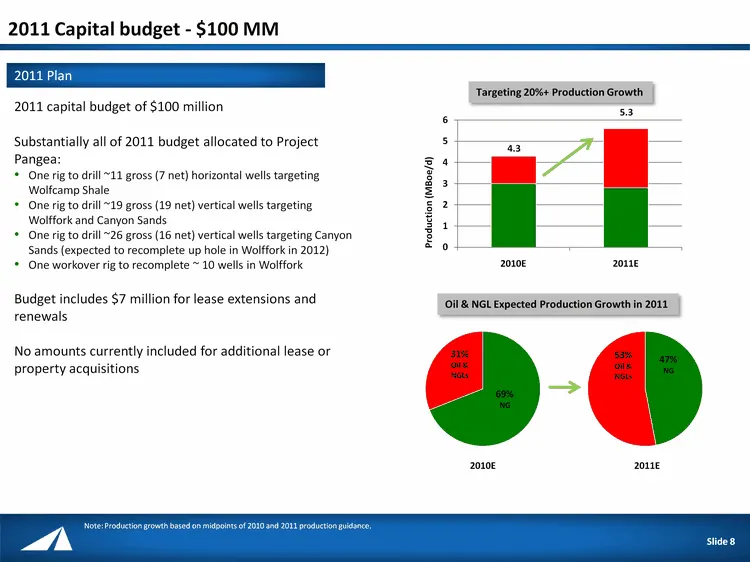
Slide 8: 2011 Capital budget - $100 MM
2011 Capital budget - $100 MM October 12, 2010 Slide 8 2011 Plan 2011 capital budget of $100 million Substantially all of 2011 budget allocated to Project Pangea: One rig to drill ~11 gross (7 net) horizontal wells targeting Wolfcamp Shale One rig to drill ~19 gross (19 net) vertical wells targeting
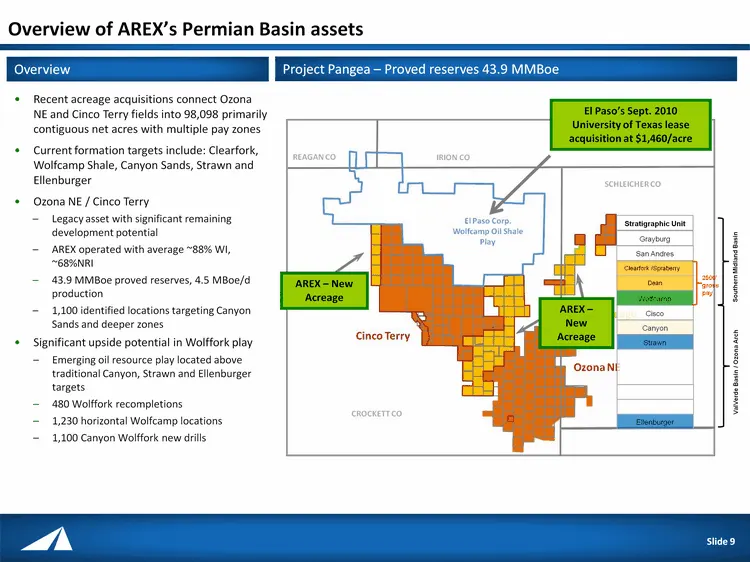
Slide 9: Overview of AREX's Permian Basin assets
Overview of AREX's Permian Basin assets Recent acreage acquisitions connect Ozona NE and Cinco Terry fields into 98,098 primarily contiguous net acres with multiple pay zones Current formation targets include: Clearfork, Wolfcamp Shale, Canyon Sands, Strawn and Ellenburger Ozona NE / Cinco Terry Leg
Slide 10: AREX acreage is favorably located in Southern Midland Basin
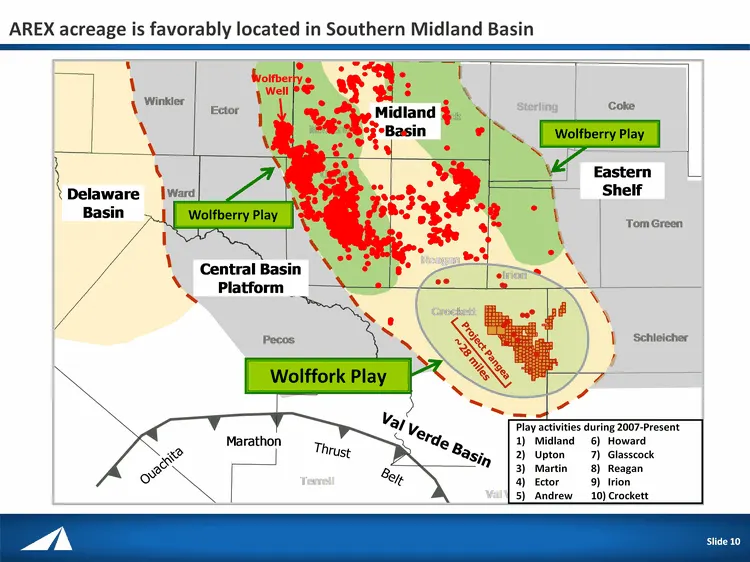
Slide 10 AREX acreage is favorably located in Southern Midland Basin Wolfberry Well ~28 miles Project Pangea Play activities during 2007-Present Midland 6) Howard Upton 7) Glasscock Martin 8) Reagan Ector 9) Irion Andrew 10) Crockett Wolffork Play Wolfberry Play Wolfberry Play Slide 10
Slide 11: Industry activity in Southern Midland Basin
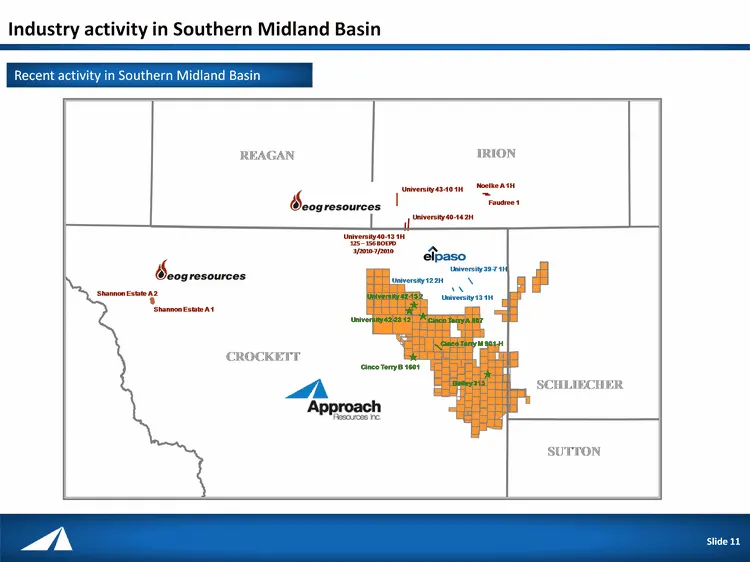
Industry activity in Southern Midland Basin Slide 11 Recent activity in Southern Midland Basin Slide 11
Slide 12: Wolffork play recognition
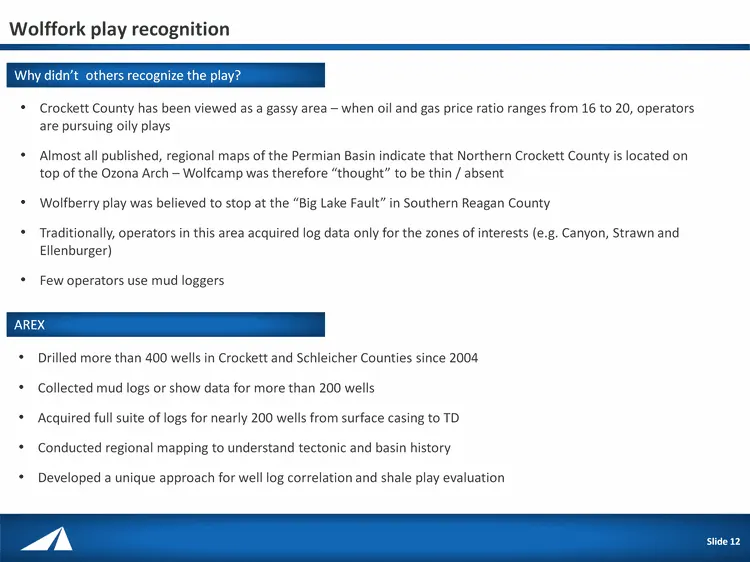
Wolffork play recognition Slide 12 Crockett County has been viewed as a gassy area - when oil and gas price ratio ranges from 16 to 20, operators are pursuing oily plays Almost all published, regional maps of the Permian Basin indicate that Northern Crockett County is located on top of the Ozona Arc
Slide 13: AREX Wolfcamp producers and shows
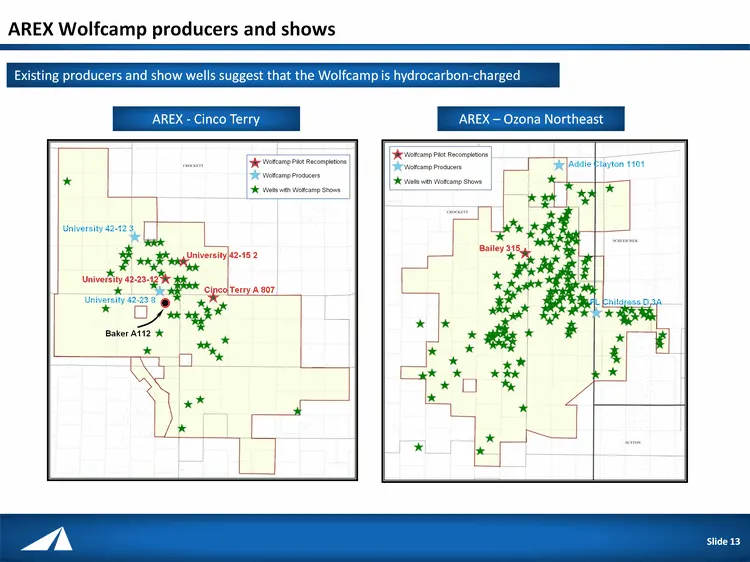
AREX Wolfcamp producers and shows Slide 13 University 42-23-12 University 42-23 8 Cinco Terry A 807 University 42-15 2 University 42-12 3 Addie Clayton 1101 PL Childress D 3A Bailey 315 Existing producers and show wells suggest that the Wolfcamp is hydrocarbon-charged AREX - Cinco Terry AREX - Ozona
Slide 14: AREX shale play evaluation process
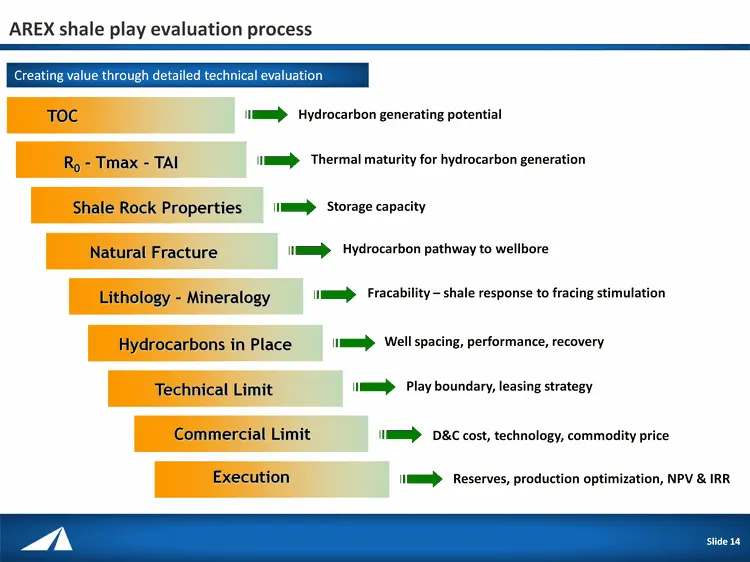
AREX shale play evaluation process Slide 14 Hydrocarbon generating potential TOC R0 - Tmax - TAI Shale Rock Properties Lithology - Mineralogy Hydrocarbons in Place Technical Limit Commercial Limit Thermal maturity for hydrocarbon generation Storage capacity Fracability - shale response to fracing st
Slide 15: Creating value through detailed technical evaluation of Wolfcamp shale
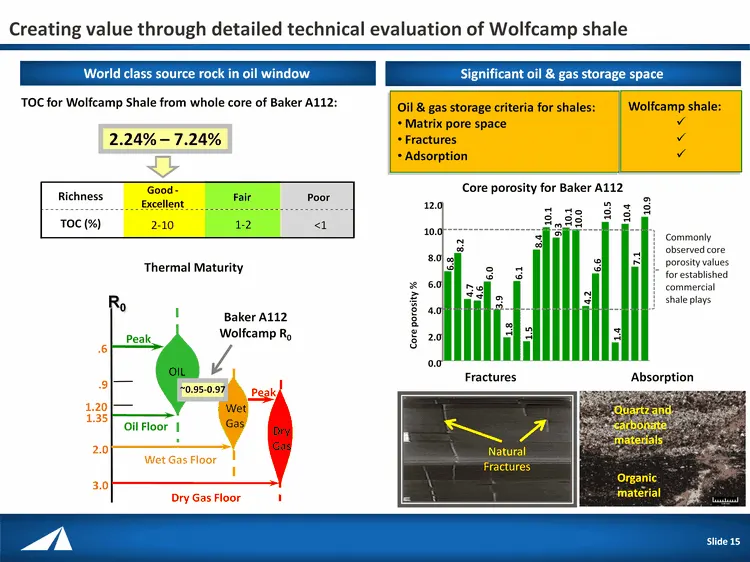
Creating value through detailed technical evaluation of Wolfcamp shale Slide 15 TOC for Wolfcamp Shale from whole core of Baker A112: World class source rock in oil window Thermal Maturity OIL ..6 ..9 1.20 1.35 2.0 3.0 Peak Wet Gas Dry Gas Peak Oil Floor Wet Gas Floor Dry Gas Floor R0 Baker A112 Wol
Slide 16: Creating value through detailed technical evaluation of Wolfcamp shale (cont'd)
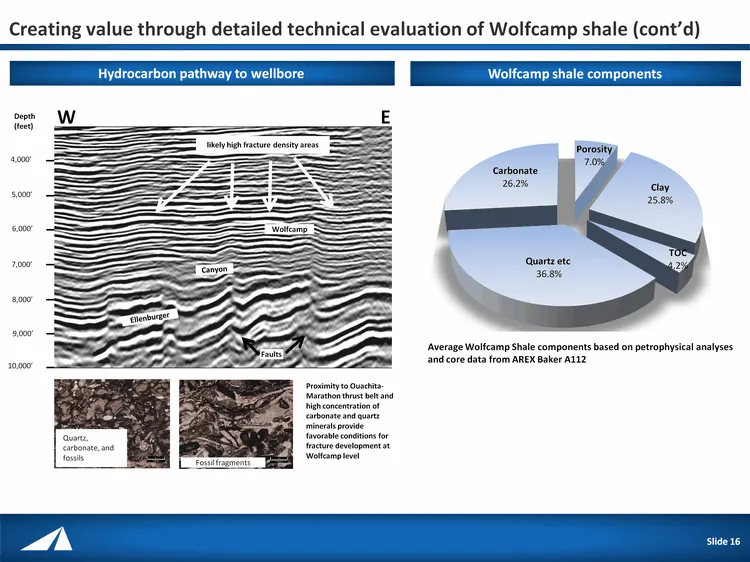
Creating value through detailed technical evaluation of Wolfcamp shale (cont'd) Slide 16 Hydrocarbon pathway to wellbore Wolfcamp shale components W E Ellenburger Canyon Wolfcamp Proximity to Ouachita- Marathon thrust belt and high concentration of carbonate and quartz minerals provide favorable con
Slide 17: Regional correlation
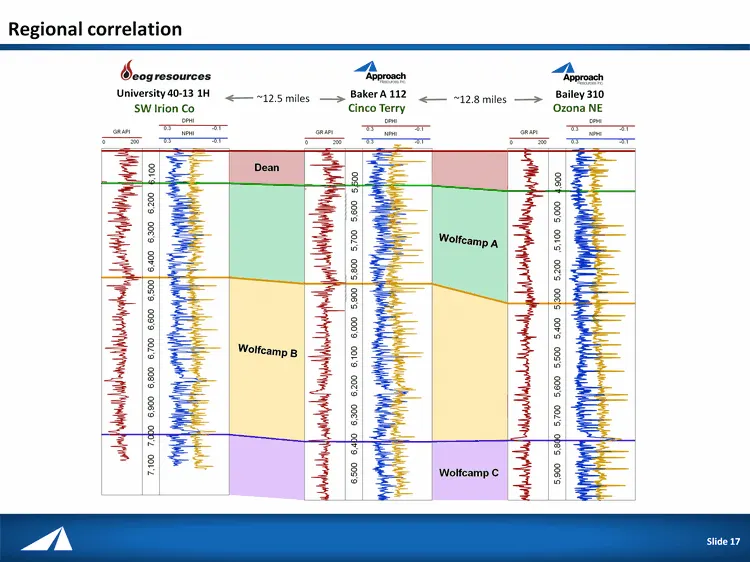
Regional correlation Slide 17 University 40-13 1H Baker A 112 Bailey 310 ~12.5 miles ~12.8 miles SW Irion Co Cinco Terry Ozona NE Dean 6,100 6,200 6,300 6,400 6,500 6,600 6,700 6,800 6,900 7,000 7,100 5,500 5,600 5,700 5,800 5,900 6,000 6,100 6,200 6,300 6,400 6,500 4,900 5,000 ,5,100 5,200 5,300 5,
Slide 18: Over 2,500 feet of gross pay in the Wolffork
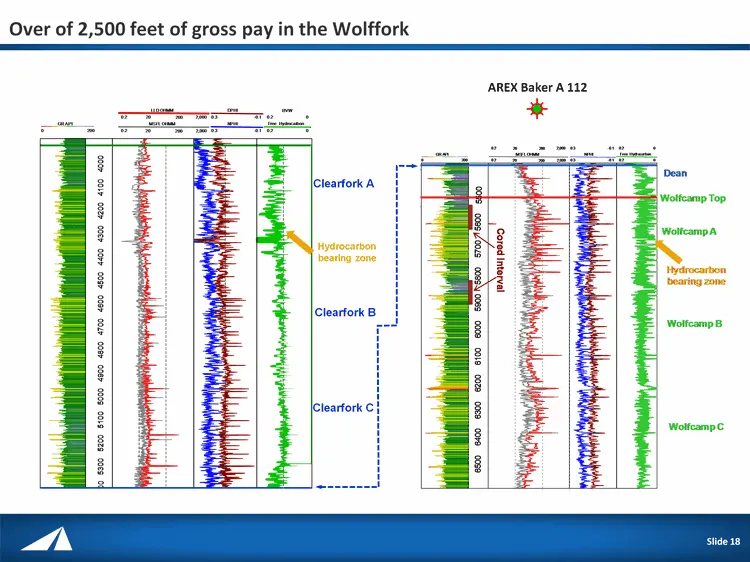
Over of 2,500 feet of gross pay in the Wolffork Slide 18 AREX Baker A 112 Clearfork A Clearfork B Clearfork C Hydrocarbon bearing zone Slide 18
Slide 19: Technical analysis is supported by early drilling and recompletion results
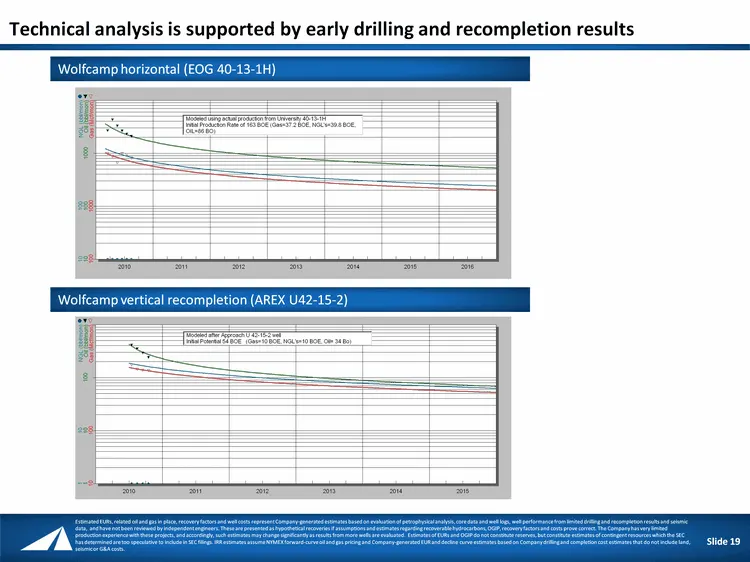
Wolfcamp horizontal (EOG 40-13-1H) Technical analysis is supported by early drilling and recompletion results Wolfcamp vertical recompletion (AREX U42-15-2) Estimated EURs, related oil and gas in place, recovery factors and well costs represent Company-generated estimates based on evaluation of petr
Slide 20: Wolffork economics summary (estimated)
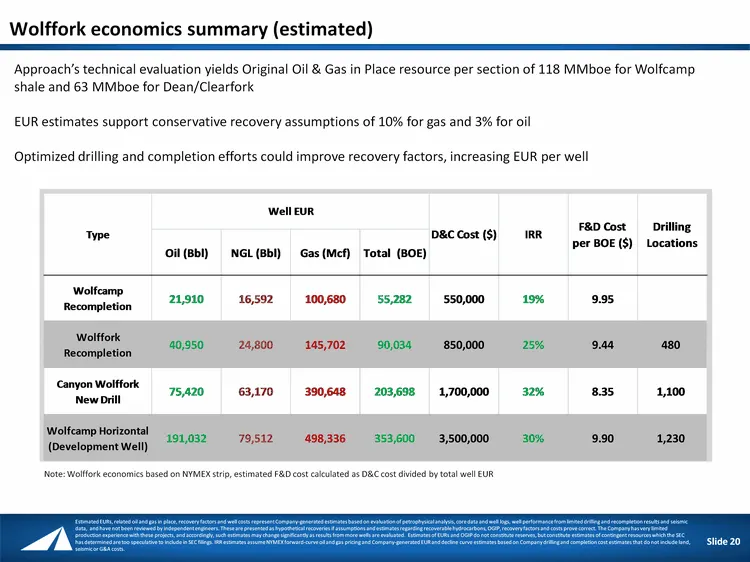
Note: Wolffork economics based on NYMEX strip, estimated F&D cost calculated as D&C cost divided by total well EUR Wolffork economics summary (estimated) Approach's technical evaluation yields Original Oil & Gas in Place resource per section of 118 MMboe for Wolfcamp shale and 63 MMboe for Dean/Clea
Slide 21: Wolffork economics (estimated)
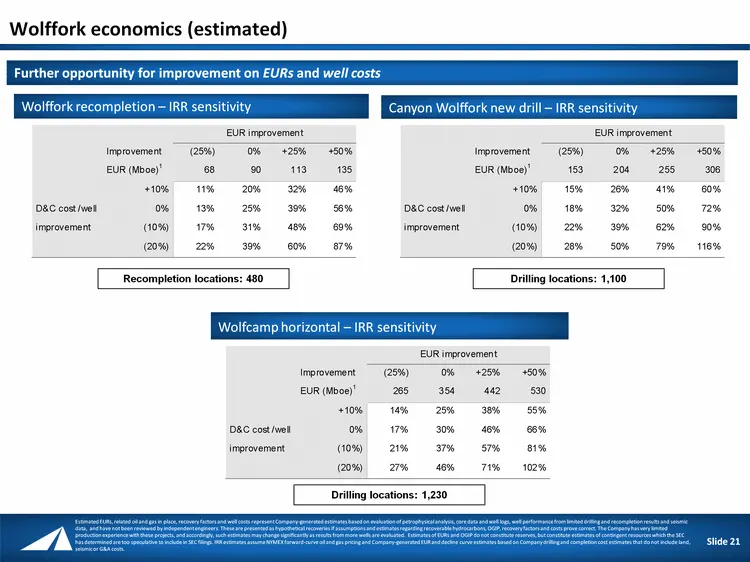
Wolffork recompletion - IRR sensitivity Canyon Wolffork new drill - IRR sensitivity Wolfcamp horizontal - IRR sensitivity Further opportunity for improvement on EURs and well costs Wolffork economics (estimated) Drilling locations: 1,230 Recompletion locations: 480 Drilling locations: 1,100 Estimate
Slide 22: Oil shale play comparison
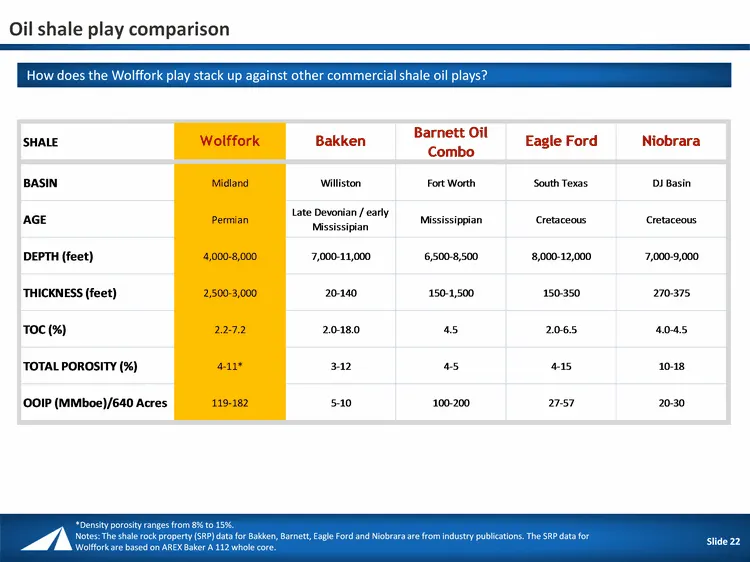
Oil shale play comparison Slide 22 How does the Wolffork play stack up against other commercial shale oil plays? *Density porosity ranges from 8% to 15%. Notes: The shale rock property (SRP) data for Bakken, Barnett, Eagle Ford and Niobrara are from industry publications. The SRP data for Wolffork a
Slide 23: Technical evaluation derisks Wolffork play concept
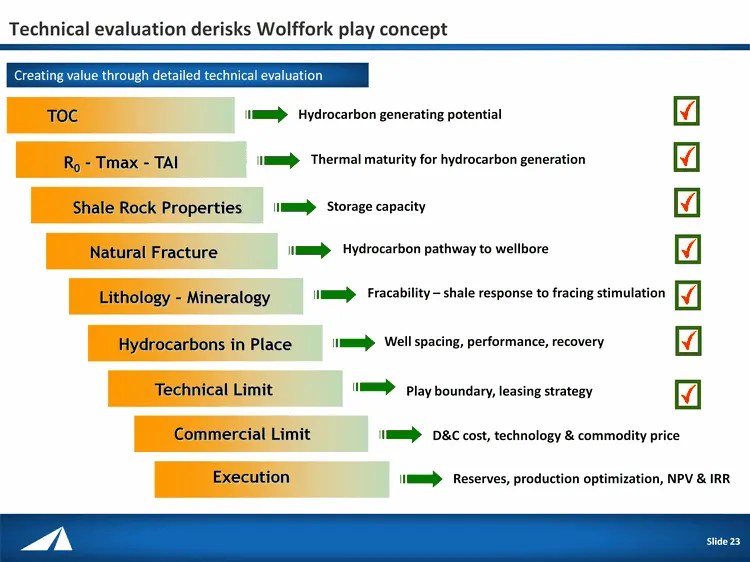
Technical evaluation derisks Wolffork play concept Slide 23 Hydrocarbon generating potential TOC R0 - Tmax - TAI Shale Rock Properties Lithology - Mineralogy Hydrocarbons in Place Technical Limit Commercial Limit Thermal maturity for hydrocarbon generation Storage capacity Fracability - shale respon
Slide 24: Key takeaways
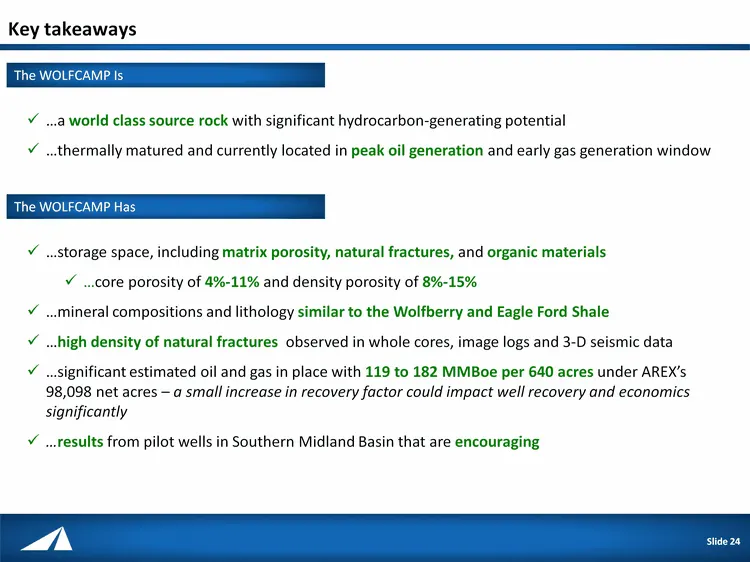
Key takeaways ....a world class source rock with significant hydrocarbon-generating potential ....thermally matured and currently located in peak oil generation and early gas generation window The WOLFCAMP Is ....storage space, including matrix porosity, natural fractures, and organic materials ....
Slide 25: Liquidity
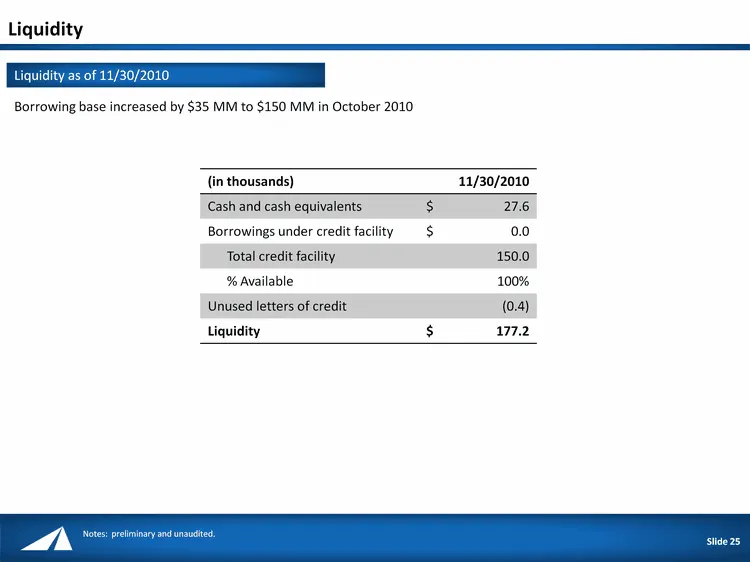
Liquidity (in thousands) 11/30/2010 11/30/2010 Cash and cash equivalents $ 27.6 Borrowings under credit facility $ 0.0 Total credit facility 150.0 % Available 100% Unused letters of credit (0.4) Liquidity $ 177.2 Liquidity as of 11/30/2010 Borrowing base increased by $35 MM to $150 MM in October 201

Slide 26: Approach
Approach Pesos FC
Slide 27: Structural cross-section across Big Lake Fault
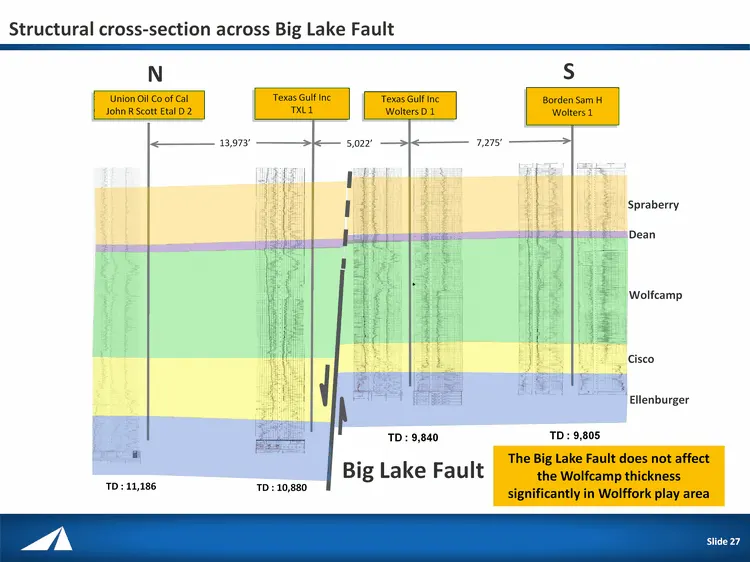
Structural cross-section across Big Lake Fault Slide 27 The Big Lake Fault does not affect the Wolfcamp thickness significantly in Wolffork play area Union Oil Co of Cal John R Scott Etal D 2 Texas Gulf Inc TXL 1 Texas Gulf Inc Wolters D 1 Borden Sam H Wolters 1 13,973' 5,022' 7,275' TD : 11,186 TD
Slide 28: Hydrocarbons in place estimate & potential vertical well recovery
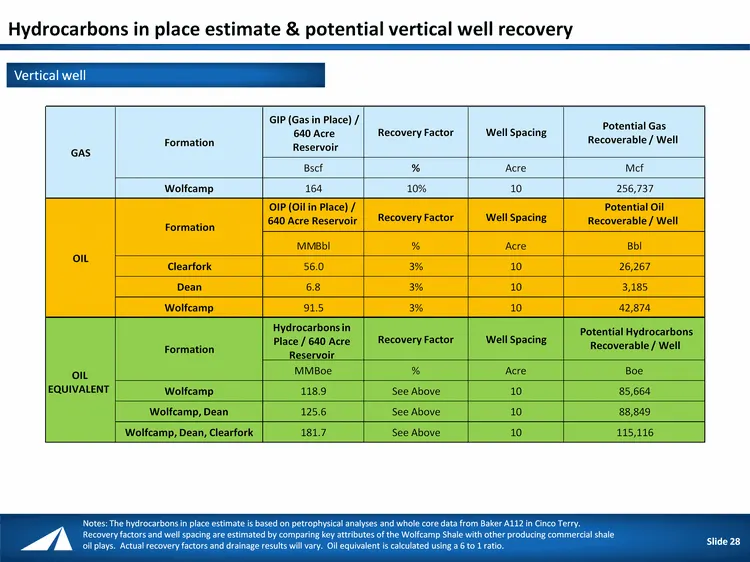
28 Hydrocarbons in place estimate & potential vertical well recovery Slide 28 GIP (Gas in Place) / 640 Acre Reservoir Recovery Factor Well Spacing Potential Gas Recoverable / Well B scf % Acre Mcf Wolfcamp 164 10% 10 256,737 Recovery Factor Well Spacing MM Bbl % Acre Bbl Clearfork 56.0 3% 10 26,267
Slide 29: Hydrocarbons in place estimate & potential horizontal well recovery
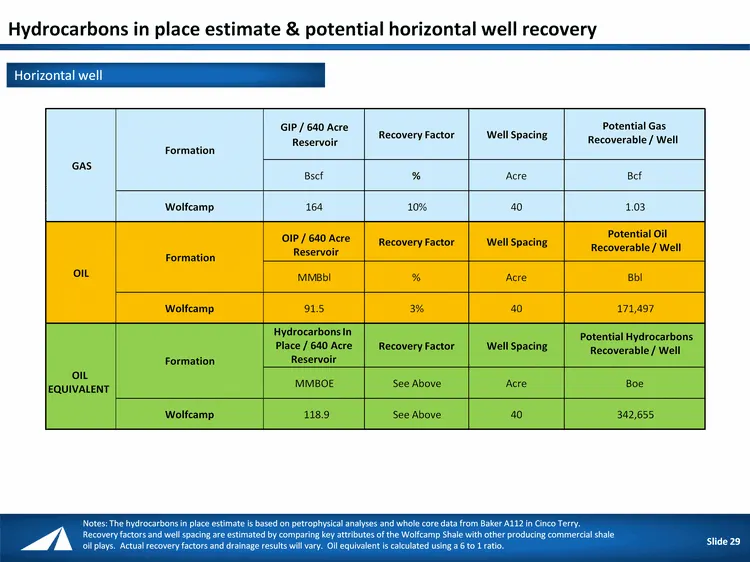
29 Slide 29 Horizontal well GIP / 640 Acre Reservoir Recovery Factor Well Spacing B scf % Acre Bcf Wolfcamp 164 10% 40 1.03 OIP / 640 Acre Reservoir Recovery Factor Well Spacing MM Bbl % Acre Bbl Wolfcamp 91.5 3% 40 171,497 Hydrocarbons In Place / 640 Acre Reservoir Recovery Factor Well Spacing MMBO
Slide 30: 2011 Guidance
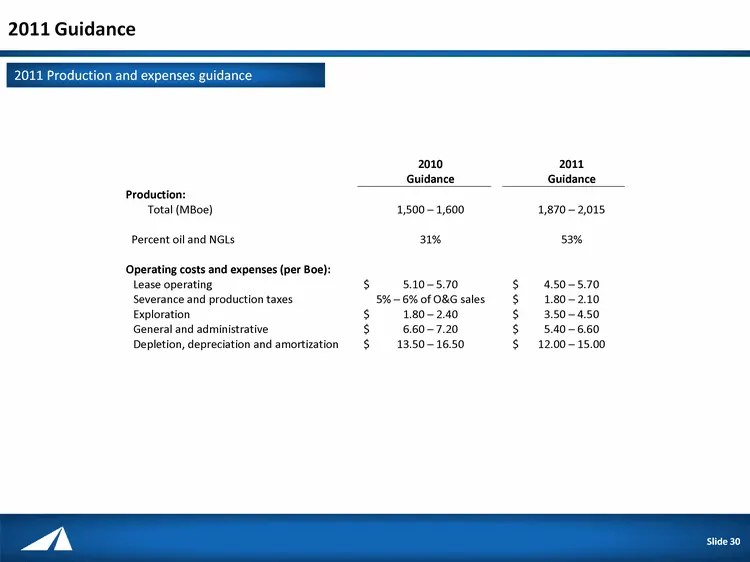
2011 Guidance 2011 Production and expenses guidance Slide 30
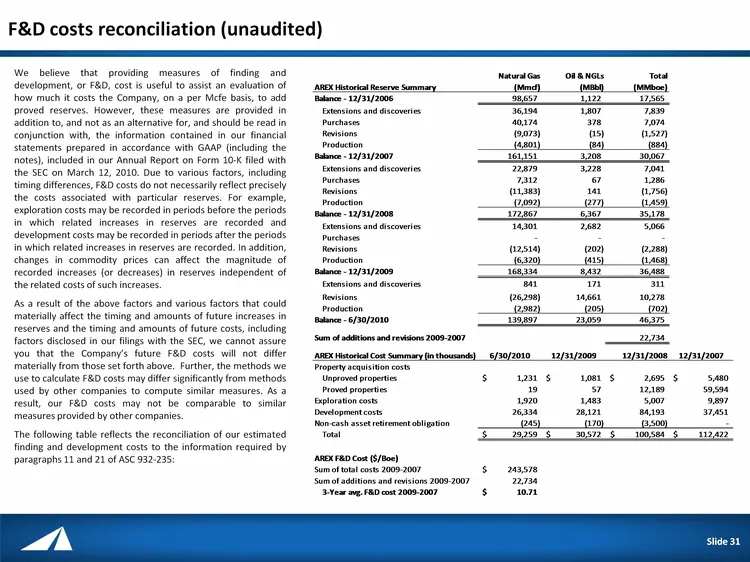
Slide 31: F&D costs reconciliation (unaudited)
F&D costs reconciliation (unaudited) We believe that providing measures of finding and development, or F&D, cost is useful to assist an evaluation of how much it costs the Company, on a per Mcfe basis, to add proved reserves. However, these measures are provided in addition to, and not as an alterna
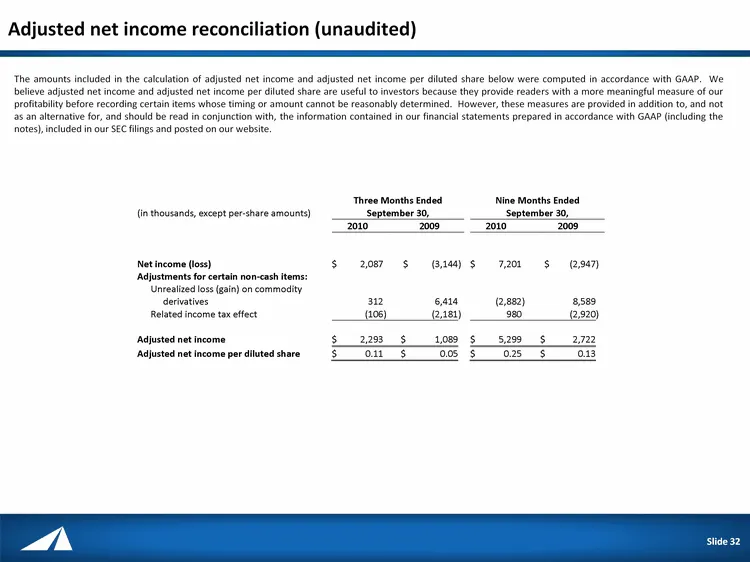
Slide 32: Adjusted net income reconciliation (unaudited)
Adjusted net income reconciliation (unaudited) The amounts included in the calculation of adjusted net income and adjusted net income per diluted share below were computed in accordance with GAAP. We believe adjusted net income and adjusted net income per diluted share are useful to investors becaus
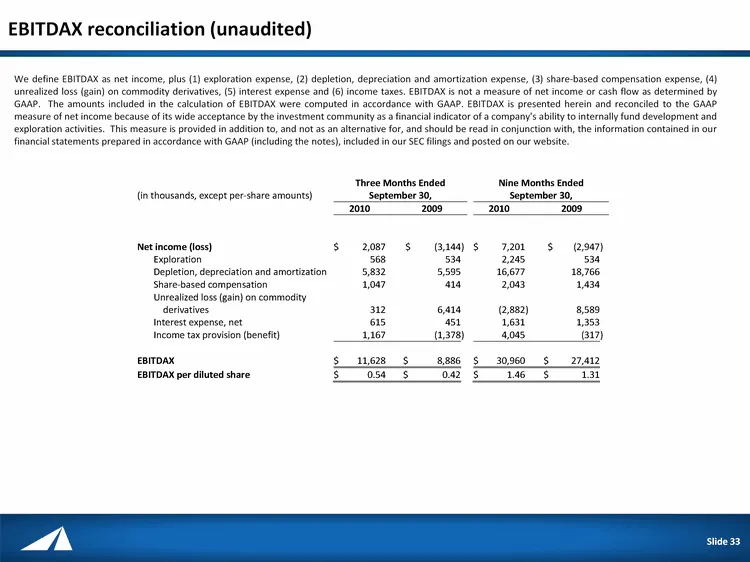
Slide 33: EBITDAX reconciliation (unaudited)
EBITDAX reconciliation (unaudited) We define EBITDAX as net income, plus (1) exploration expense, (2) depletion, depreciation and amortization expense, (3) share-based compensation expense, (4) unrealized loss (gain) on commodity derivatives, (5) interest expense and (6) income taxes. EBITDAX is not
Source: SEC EDGAR · 8-K filed Dec 7, 2010
More decks from Approach Resources Inc
 Investor Presentation (January 2017)46 slides · Jan 9, 2017
 Proxy Contest (January 2017)47 slides · Jan 5, 2017
 Investor Presentation (December 2016)45 slides · Dec 20, 2016
 Q3 2016 Earnings Presentation33 slides · Nov 3, 2016
 Q3 2015 Earnings Presentation19 slides · Nov 5, 2015
 Q2 2015 Earnings Presentation21 slides · Aug 6, 2015