BNC Bancorp — KBW Community Bank Investor Conference 2013
24 slides from BNC Bancorp's conference presentation, Jul 31, 2013
Slide 1: KBW Community Bank Investor Conference
KBW Community Bank Investor Conference July 31, 2013
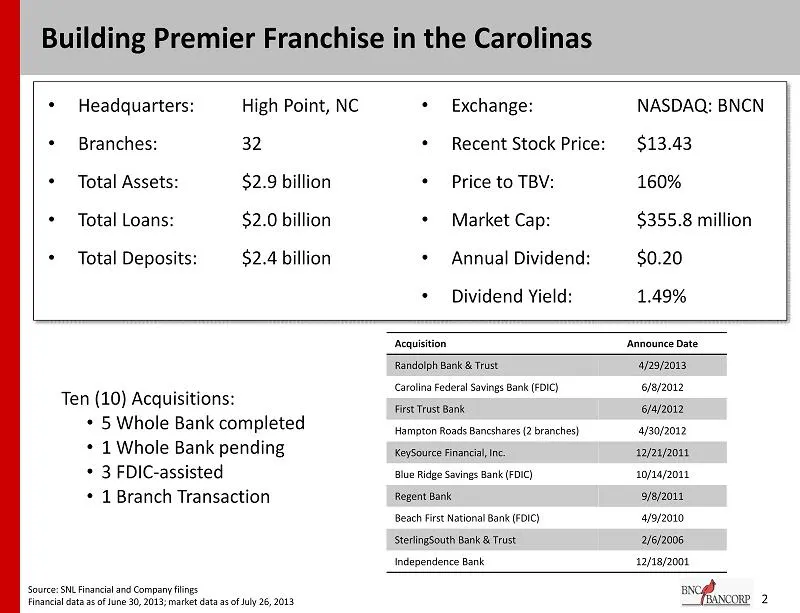
Slide 2: Building Premier Franchise in the Carolinas
• Headquarters: • Branches: • Total Assets: • Total Loans: • Total Deposits: High Point, NC 32 $2.9 billion $2.0 billion $2.4 billion Building Premier Franchise in the Carolinas 2 • Exchange: • Recent Stock Price: • Price to TBV: • Market Cap: • Annual Dividend: • Dividend Yield: NASDAQ: BNCN $13.43
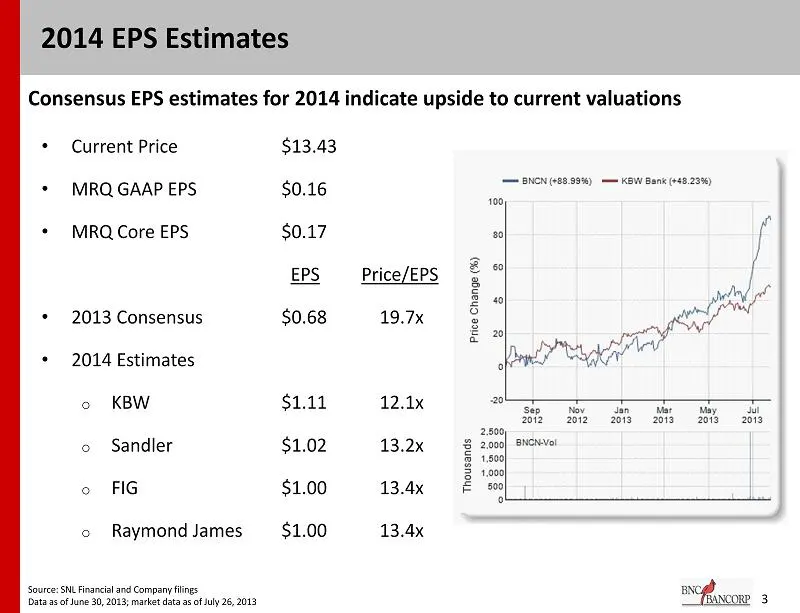
Slide 3: 2014 EPS Estimates
3 2014 EPS Estimates • Current Price $13.43 • MRQ GAAP EPS $0.16 • MRQ Core EPS $0.17 EPS Price/EPS • 2013 Consensus $0.68 19.7x • 2014 Estimates o KBW $1.11 12.1x o Sandler $1.02 13.2x o FIG $1.00 13.4x o Raymond James $1.00 13.4x Consensus EPS estimates for 2014 indicate upside to current valuatio
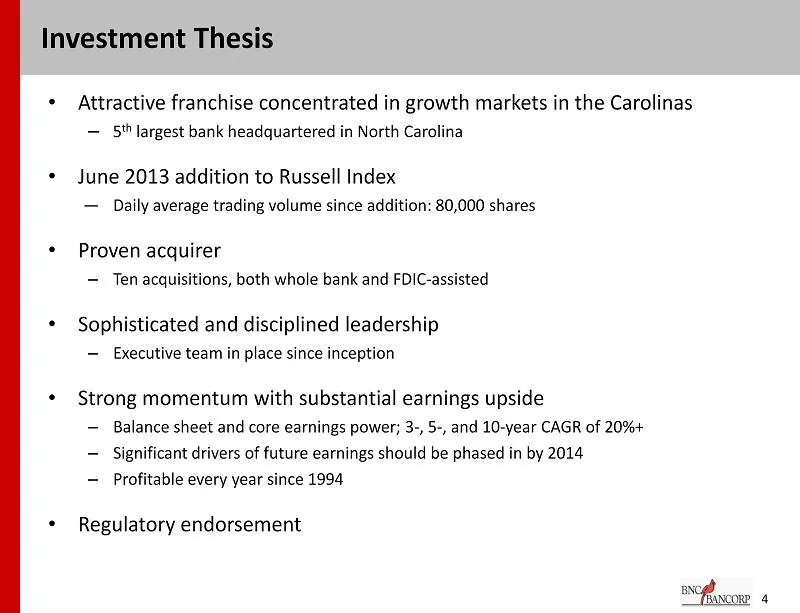
Slide 4: Investment Thesis
• Attractive franchise concentrated in growth markets in the Carolinas – 5 th largest bank headquartered in North Carolina • June 2013 addition to Russell Index ― Daily average trading volume since addition: 80,000 shares • Proven acquirer – Ten acquisitions, both whole bank and FDIC - assisted • So
Slide 5: Franchise Built Along Major Interstate Corridors
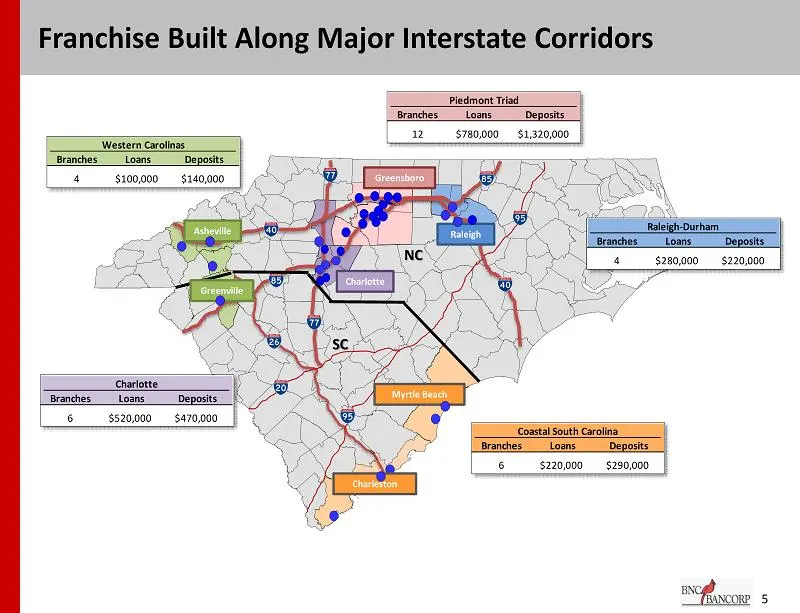
Piedmont Triad Branches Loans Deposits 12 $780,000 $1,320,000 Charlotte Branches Loans Deposits 6 $520,000 $470,000 Franchise Built Along Major Interstate Corridors 5 5 Source: SNL Financial and MapInfo Loan data as of 3/31/20123 per Company management (loan and deposit data in thousands) NC SC Char
Slide 6: Attractive Markets
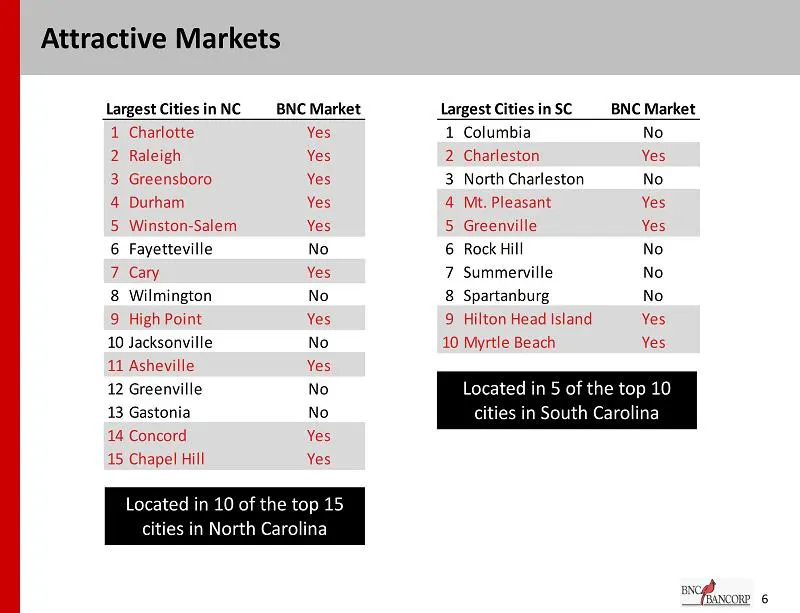
6 Attractive Markets Largest Cities in NC BNC Market Largest Cities in SC BNC Market 1 Charlotte Yes 1 Columbia No 2 Raleigh Yes 2 Charleston Yes 3 Greensboro Yes 3 North Charleston No 4 Durham Yes 4 Mt. Pleasant Yes 5 Winston-Salem Yes 5 Greenville Yes 6 Fayetteville No 6 Rock Hill No 7 Cary Yes 7
Slide 7: Efficient Branch Network
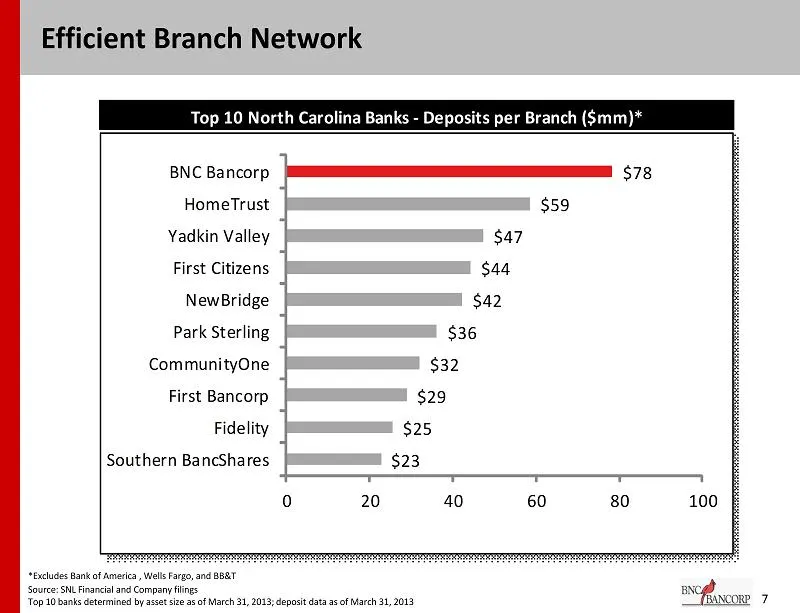
Efficient Branch Network 7 Source: SNL Financial and Company filings Top 10 banks determined by asset size as of March 31, 2013; deposit data as of March 31, 2013 *Excludes Bank of America , Wells Fargo, and BB&T Top 10 North Carolina Banks - Deposits per Branch ($mm)* $23 $25 $29 $32 $36 $42 $44 $4
Slide 8: Recent Acquisition of Randolph Bank & Trust
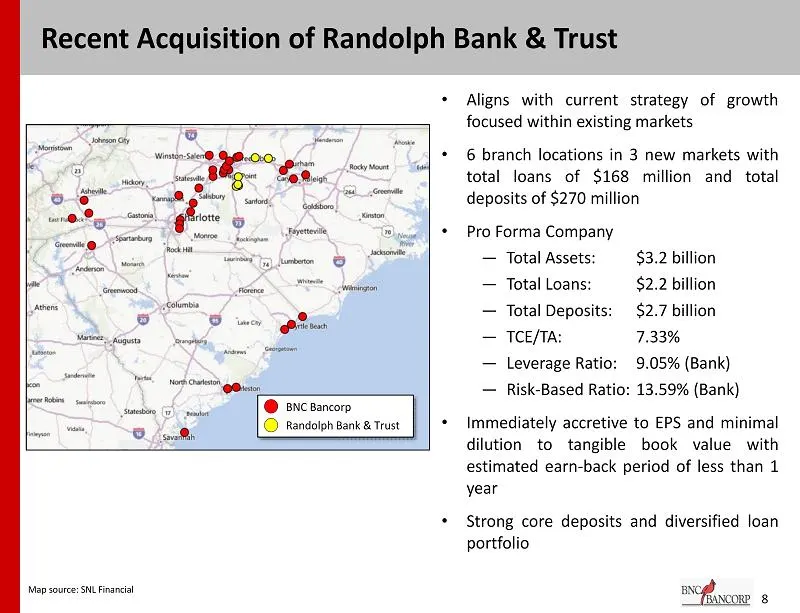
Recent Acquisition of Randolph Bank & Trust 8 • Aligns with current strategy of growth focused within existing markets • 6 branch locations in 3 new markets with total loans of $ 168 million and total deposits of $ 270 million • Pro Forma Company ― Total Assets : $ 3 . 2 billion ― Total Loans : $ 2
Slide 9: Recent Transactions
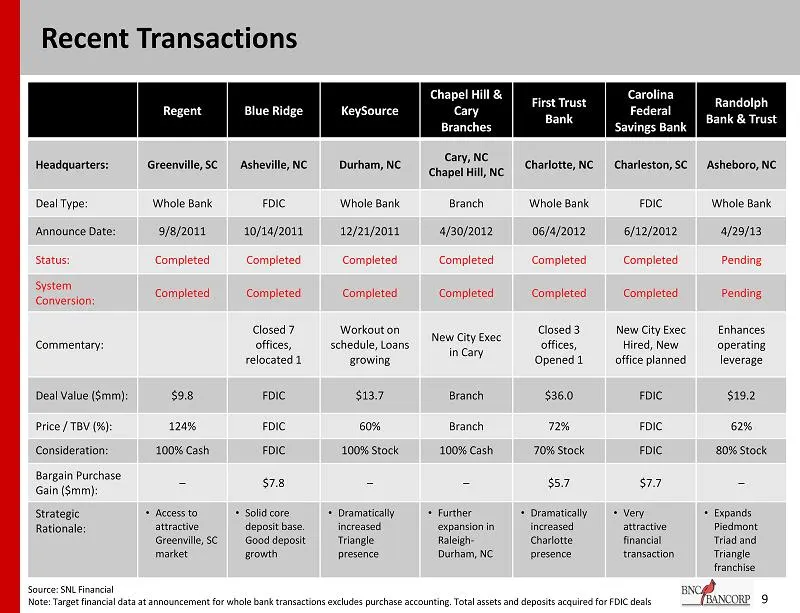
9 Recent Transactions Regent Blue Ridge KeySource Chapel Hill & Cary Branches First Trust Bank Carolina Federal Savings Bank Randolph Bank & Trust Headquarters: Greenville, SC Asheville, NC Durham, NC Cary, NC Chapel Hill, NC Charlotte, NC Charleston, SC Asheboro, NC Deal Type: Whole Bank FDIC Whole
Slide 10: Driving Growth: Recent M&A
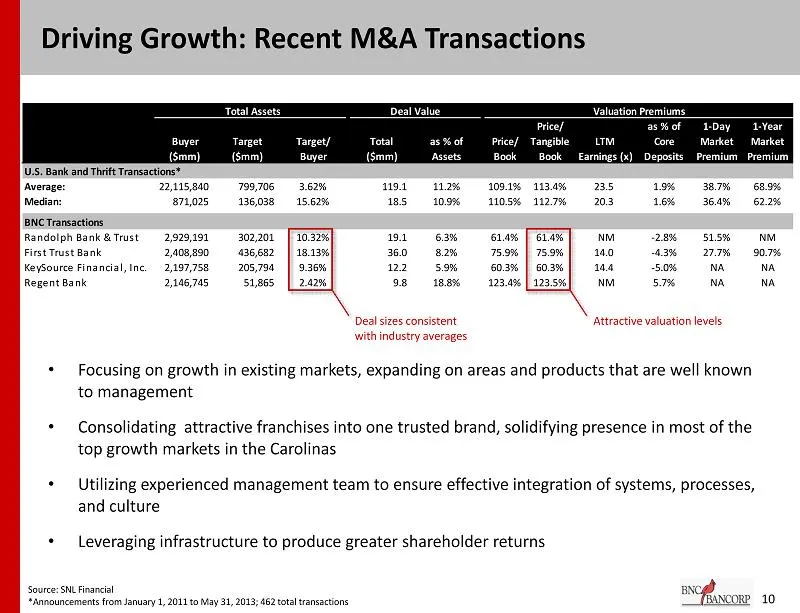
Total Assets Deal Value Valuation Premiums Price/ as % of 1-Day 1-Year Buyer Target Target/ Total as % of Price/ Tangible LTM Core Market Market ($mm) ($mm) Buyer ($mm) Assets Book Book Earnings (x) Deposits Premium Premium U.S. Bank and Thrift Transactions* Average: 22,115,840 799,706 3.62% 119.1 1
Slide 11: Investment in Talent to Support Growth
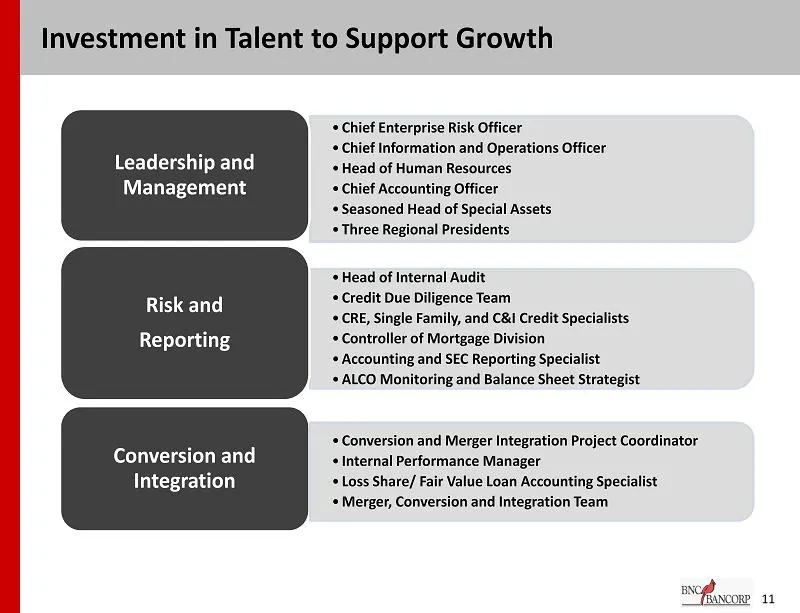
11 Investment in Talent to Support Growth • Chief Enterprise Risk Officer • Chief Information and Operations Officer • Head of Human Resources • Chief Accounting Officer • Seasoned Head of Special Assets • Three Regional Presidents Conversion and Integration • Head of Internal Audit • Credit Due Dil
Slide 12: Driving Non Interest Income
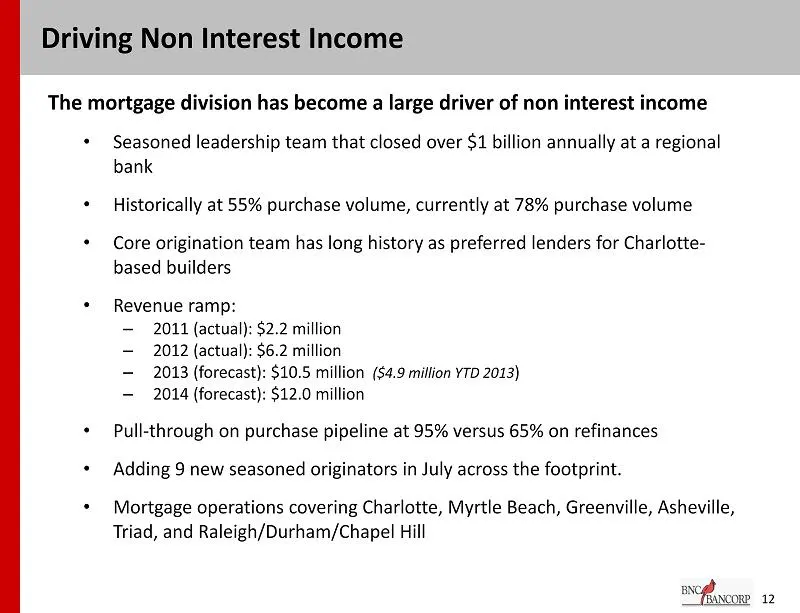
The mortgage division has become a large driver of non interest income • Seasoned leadership team that closed over $1 billion annually at a regional bank • Historically at 55% purchase volume, currently at 78% purchase volume • Core origination team has long history as preferred lenders for Charlott
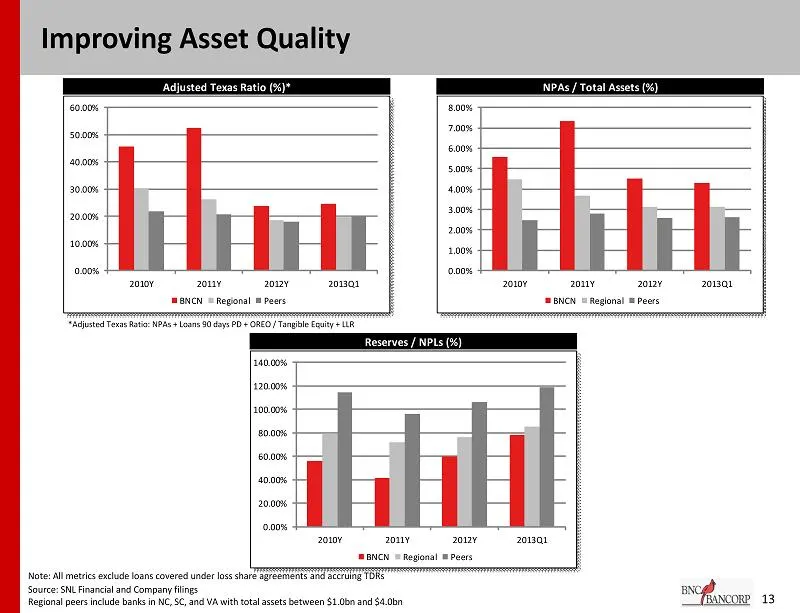
Slide 13: Improving Asset Quality
Improving Asset Quality 13 Source: SNL Financial and Company filings Regional peers include banks in NC, SC, and VA with total assets between $1.0bn and $4.0bn *Adjusted Texas Ratio: NPAs + Loans 90 days PD + OREO / Tangible Equity + LLR Note: All metrics exclude loans covered under loss share agree
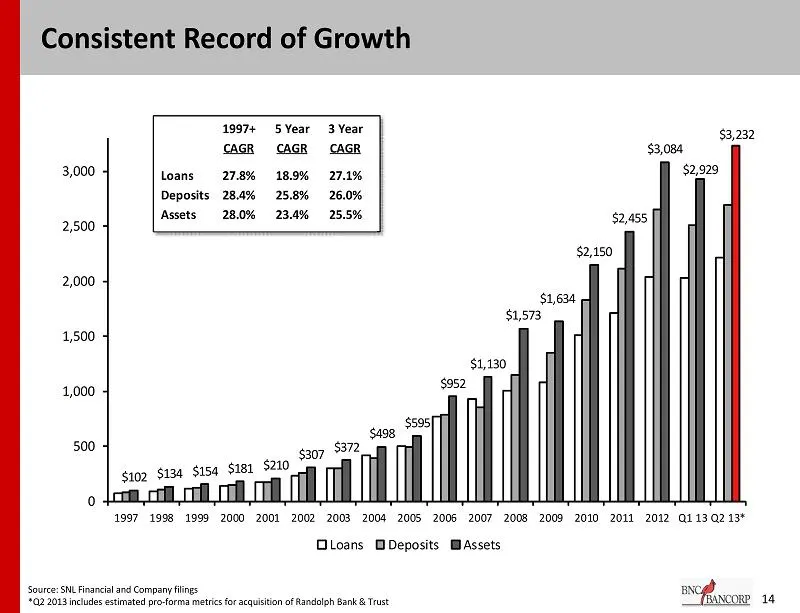
Slide 14: Consistent Record of Growth
$102 $134 $154 $181 $210 $307 $372 $498 $595 $952 $1,130 $1,573 $1,634 $2,150 $2,455 $3,084 $2,929 $3,232 0 500 1,000 1,500 2,000 2,500 3,000 1997 1998 1999 2000 2001 2002 2003 2004 2005 2006 2007 2008 2009 2010 2011 2012 Q1 13 Q2 13* Loans Deposits Assets 14 1997+ 5 Year 3 Year CAGR CAGR CAGR Loans
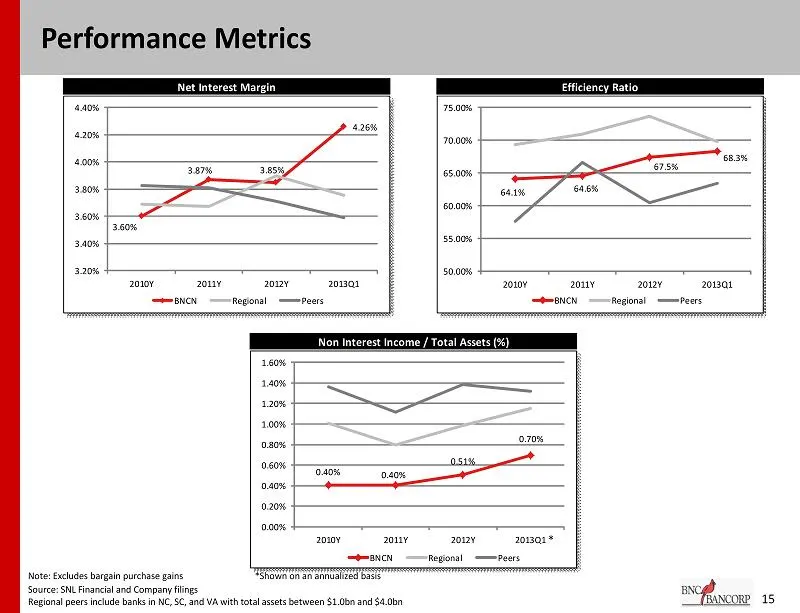
Slide 15: Performance Metrics
Net Interest Margin Efficiency Ratio Non Interest Income / Total Assets (%) 3.60% 3.87% 3.85% 4.26% 3.20% 3.40% 3.60% 3.80% 4.00% 4.20% 4.40% 2010Y 2011Y 2012Y 2013Q1 BNCN Regional Peers 64.1% 64.6% 67.5% 68.3% 50.00% 55.00% 60.00% 65.00% 70.00% 75.00% 2010Y 2011Y 2012Y 2013Q1 BNCN Regional Peers 0.
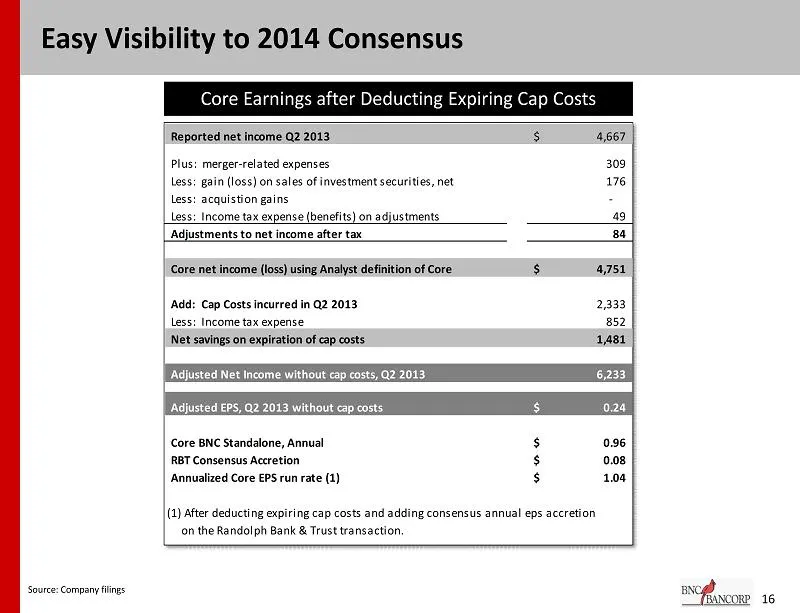
Slide 16: Easy Visibility to 2014 Consensus Core Earnings
16 Easy Visibility to 2014 Consensus Core Earnings after Deducting Expiring Cap Costs Reported net income Q2 2013 4,667$ Plus: merger-related expenses 309 Less: gain (loss) on sales of investment securities, net 176 Less: acquistion gains - Less: Income tax expense (benefits) on adjustments 49 Adjus
Slide 17: Visibility into Normalized Core EPS
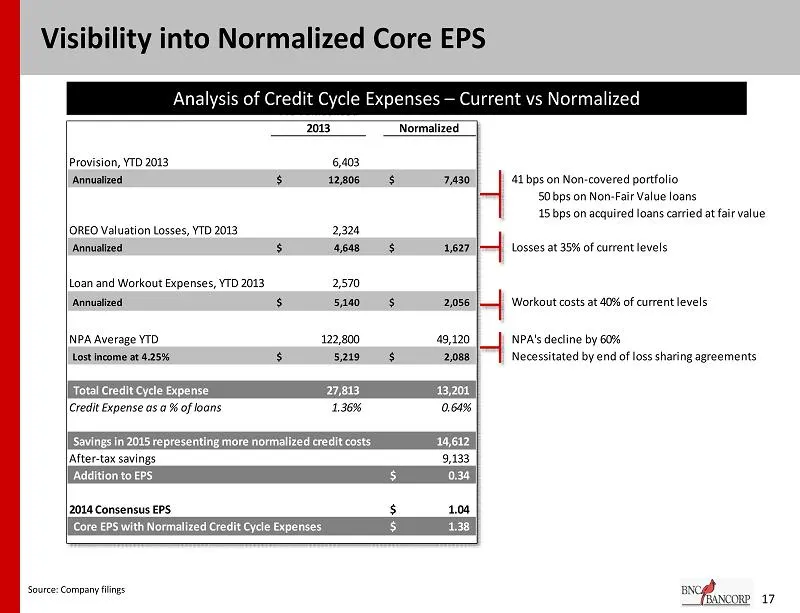
YTD Annualized 2013 Normalized Provision, YTD 2013 6,403 Annualized 12,806$ 7,430$ 41 bps on Non-covered portfolio 50 bps on Non-Fair Value loans 15 bps on acquired loans carried at fair value OREO Valuation Losses, YTD 2013 2,324 Annualized 4,648$ 1,627$ Losses at 35% of current levels Loan and Wor
Slide 18: Current Market Value Exposure
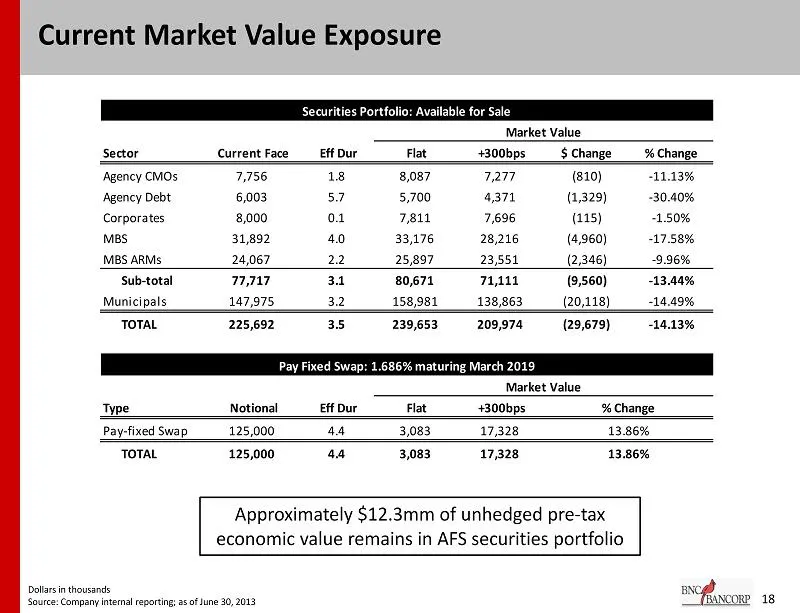
Current Market Value Exposure 18 Securities Portfolio: Available for Sale Market Value Sector Current Face Eff Dur Flat +300bps $ Change % Change Agency CMOs 7,756 1.8 8,087 7,277 (810) -11.13% Agency Debt 6,003 5.7 5,700 4,371 (1,329) -30.40% Corporates 8,000 0.1 7,811 7,696 (115) -1.50% MBS 31,892
Slide 19: Detailed Loan Composition
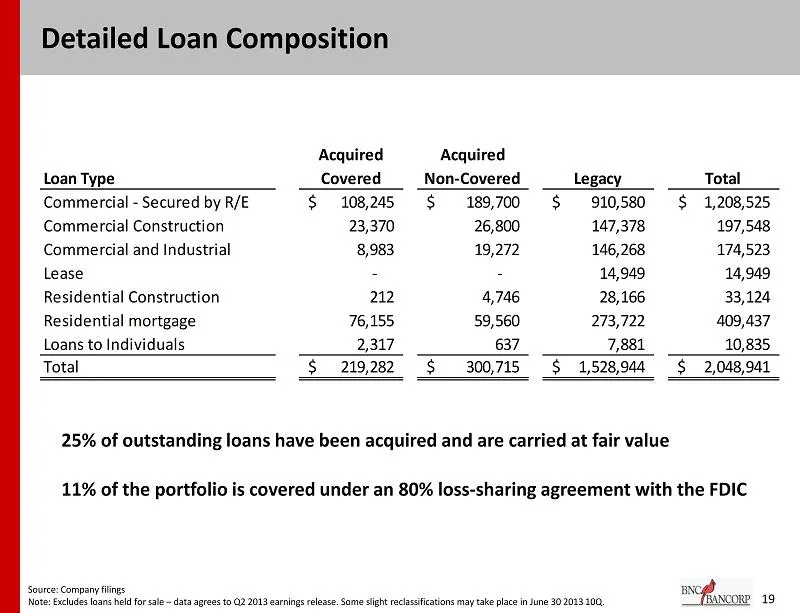
19 Detailed Loan Composition Acquired Covered Acquired Non-Covered Legacy Total Commercial - Secured by R/E 108,245$ 189,700$ 910,580$ 1,208,525$ Commercial Construction 23,370 26,800 147,378 197,548 Commercial and Industrial 8,983 19,272 146,268 174,523 Lease - - 14,949 14,949 Residential Construct
Slide 20: Diversified Non-Owner Occupied CRE Portfolio
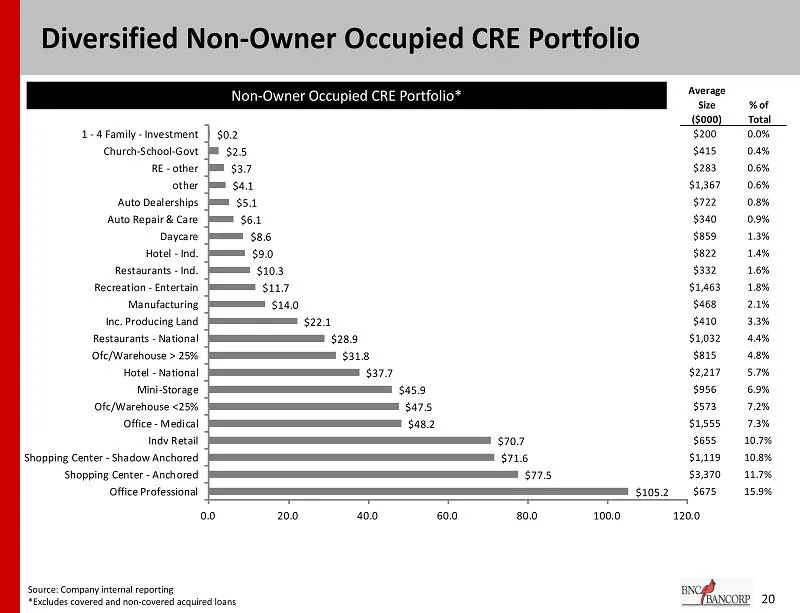
20 Diversified Non - Owner Occupied CRE Portfolio $105.2 $77.5 $71.6 $70.7 $48.2 $47.5 $45.9 $37.7 $31.8 $28.9 $22.1 $14.0 $11.7 $10.3 $9.0 $8.6 $6.1 $5.1 $4.1 $3.7 $2.5 $0.2 0.0 20.0 40.0 60.0 80.0 100.0 120.0 Office Professional Shopping Center - Anchored Shopping Center - Shadow Anchored Indv Ret
Slide 21: Loan Portfolio
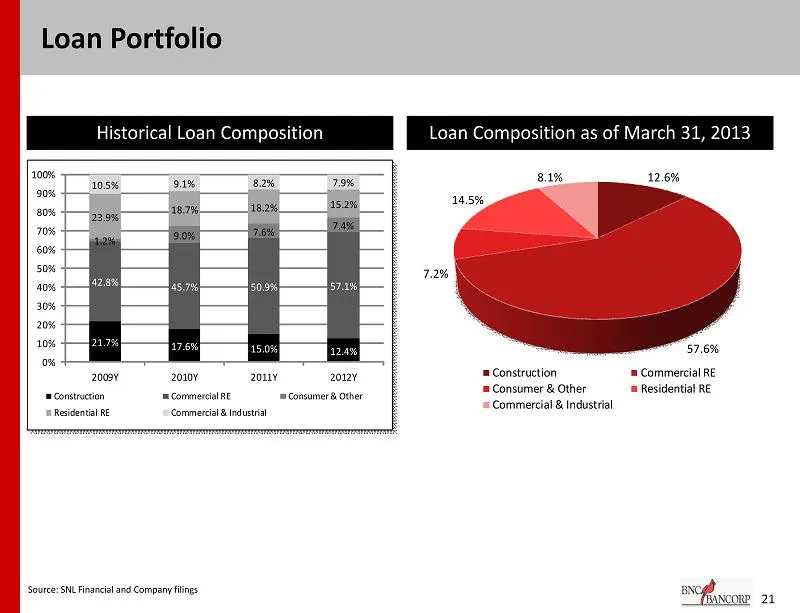
21 Loan Portfolio 21.7% 17.6% 15.0% 12.4% 42.8% 45.7% 50.9% 57.1% 1.2% 9.0% 7.6% 7.4% 23.9% 18.7% 18.2% 15.2% 10.5% 9.1% 8.2% 7.9% 0% 10% 20% 30% 40% 50% 60% 70% 80% 90% 100% 2009Y 2010Y 2011Y 2012Y Construction Commercial RE Consumer & Other Residential RE Commercial & Industrial 12.6% 57.6% 7.2% 1
Slide 22: Deposit Portfolio
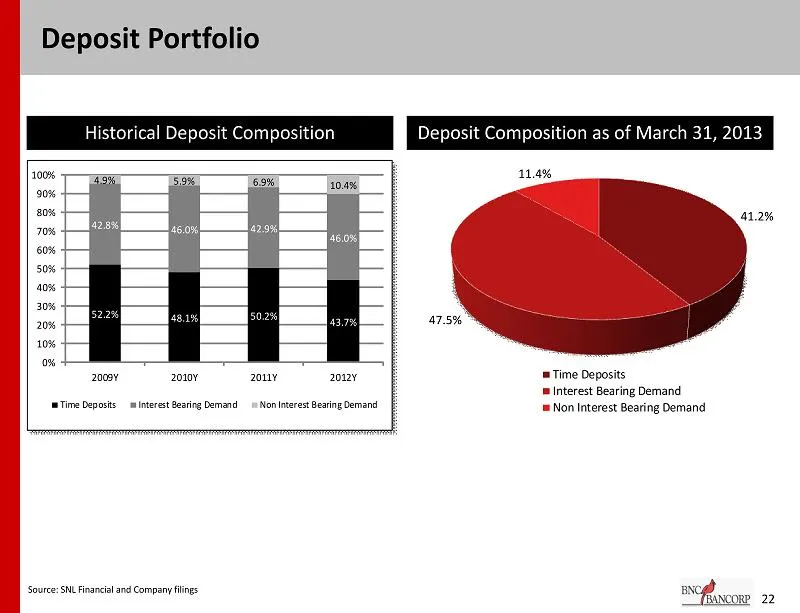
22 Deposit Portfolio 52.2% 48.1% 50.2% 43.7% 42.8% 46.0% 42.9% 46.0% 4.9% 5.9% 6.9% 10.4% 0% 10% 20% 30% 40% 50% 60% 70% 80% 90% 100% 2009Y 2010Y 2011Y 2012Y Time Deposits Interest Bearing Demand Non Interest Bearing Demand Deposit Composition as of March 31, 2013 Historical Deposit Composition 41.2
Slide 23: Securities Portfolio
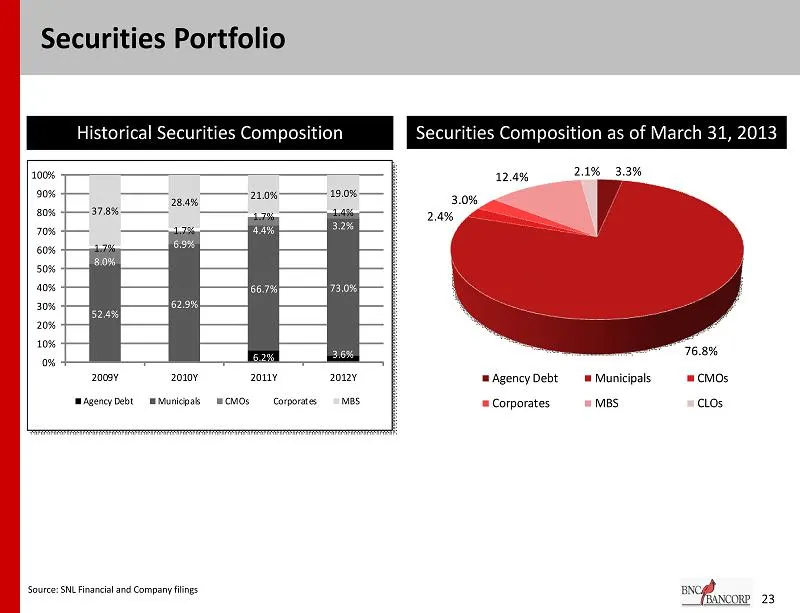
3.3% 76.8% 2.4% 3.0% 12.4% 2.1% Agency Debt Municipals CMOs Corporates MBS CLOs 23 Securities Portfolio Securities Composition as of March 31, 2013 Historical Securities Composition Source: SNL Financial and Company filings 6.2% 3.6% 52.4% 62.9% 66.7% 73.0% 8.0% 6.9% 4.4% 3.2% 37.8% 28.4% 21.0% 19.0
Slide 24: Forward-Looking Statements
24 This presentation contains forward - looking statements relating to the financial condition, results of operations and business of BNC Bancorp and its subsidiary Bank of North Carolina . These forward - looking statements involve risks and uncertainties and are based on the beliefs and assumption
Source: SEC EDGAR · 8-K filed Jul 31, 2013
More decks from BNC Bancorp
 Merger or Acquisition (January 2017)37 slides · Jan 23, 2017
 Stephens Inc. Carolinas Roadshow - Charlotte November 201637 slides · Nov 8, 2016
 IPO Roadshow (July 2016)28 slides · Jul 20, 2016
 2016 Gulf South Bank Conference37 slides · May 2, 2016
 Merger or Acquisition (November 2015)32 slides · Nov 16, 2015
 Merger or Acquisition (August 2015)24 slides · Aug 14, 2015