Middlefield Banc — Investor Presentation (June 2019)
19 slides from Middlefield Banc's investor presentation, Jun 17, 2019
Slide 1: Middlefield Banc Corp. 2019 First Quarter Investor Presentation
Middlefield Banc Corp. 2019 First Quarter Investor Presentation (Nasdaq: MBCN) Exhibit 99.1
Slide 2: Forward Looking Statements
Forward Looking Statements This presentation contains forward-looking statements within the meaning of the Securities Exchange Act of 1934 and the Private Securities Litigation Reform Act of 1995 concerning Middlefield Banc Corp.’s plans, strategies, objectives, expectations, intentions, financial c
Slide 3: Middlefield's Investment Overview
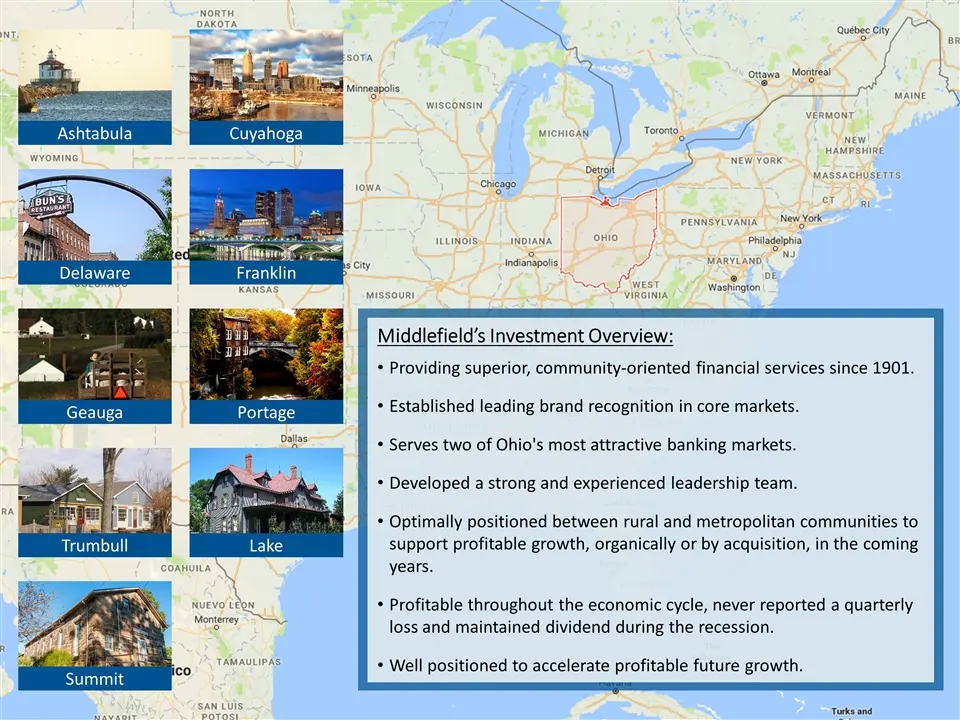
Ashtabula Cuyahoga Delaware Franklin Geauga Portage Trumbull Lake Summit Middlefield’s Investment Overview: Providing superior, community-oriented financial services since 1901. Established leading brand recognition in core markets. Serves two of Ohio's most attractive banking markets. Developed a s
Slide 4: Middlefield: A community bank that is safe, strong and committed
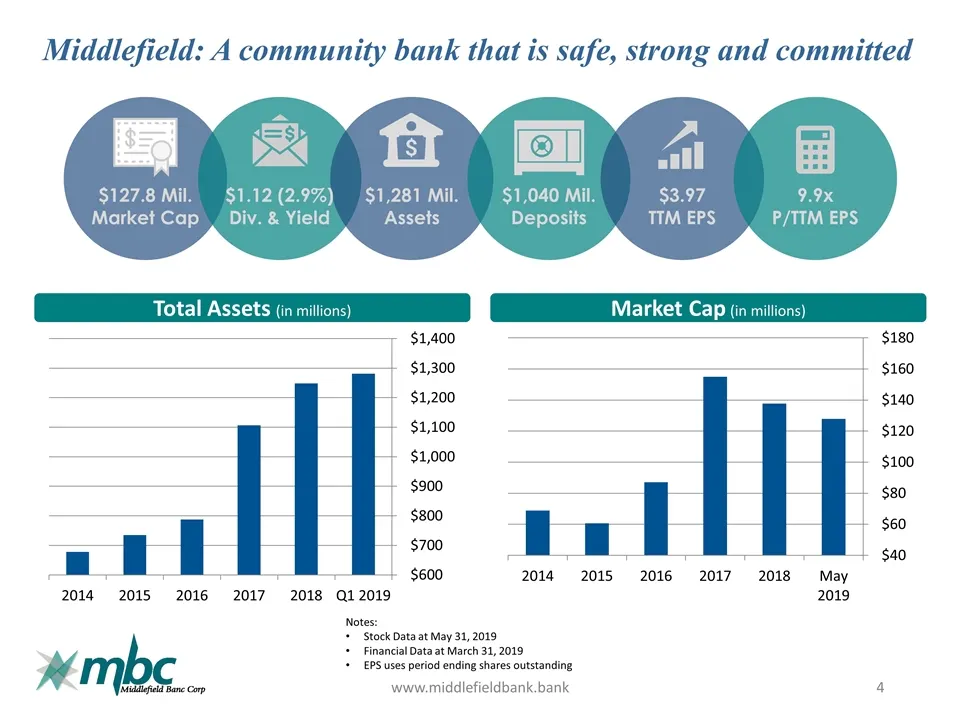
Middlefield: A community bank that is safe, strong and committed www.middlefieldbank.bank $127.8 Mil. Market Cap $1.12 (2.9%) Div. & Yield $1,281 Mil. Assets $1,040 Mil. Deposits $3.97 TTM EPS 9.9x P/TTM EPS Notes: Stock Data at May 31, 2019 Financial Data at March 31, 2019 EPS uses period ending sh
Slide 5: Well Positioned in a Competitive Environment
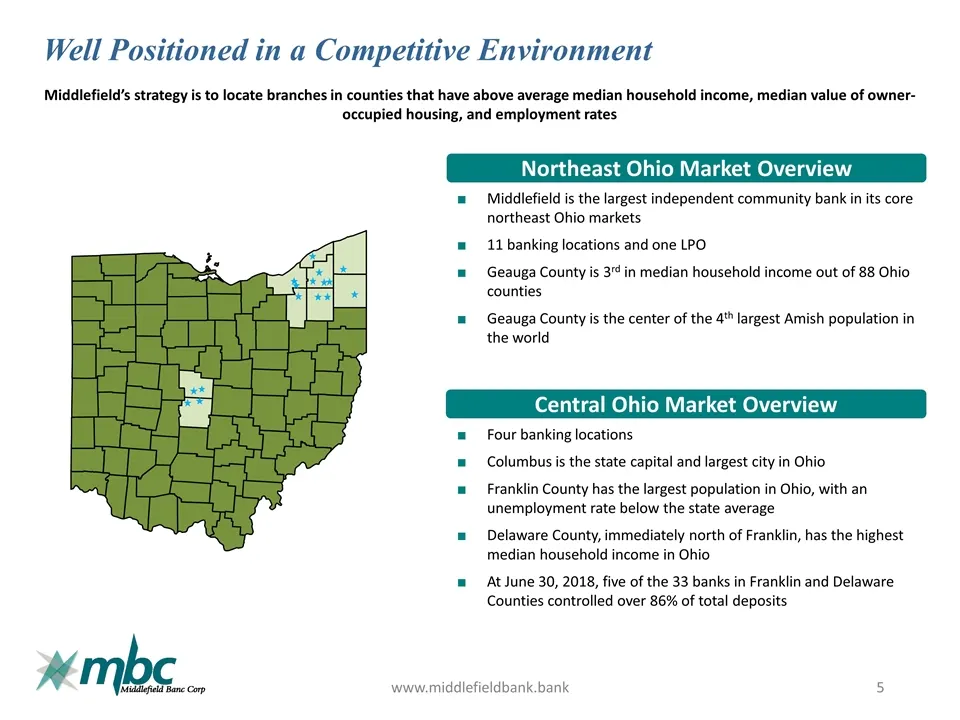
Well Positioned in a Competitive Environment www.middlefieldbank.bank Northeast Ohio Market Overview Central Ohio Market Overview Four banking locations Columbus is the state capital and largest city in Ohio Franklin County has the largest population in Ohio, with an unemployment rate below the stat
Slide 6: Economic Highlights
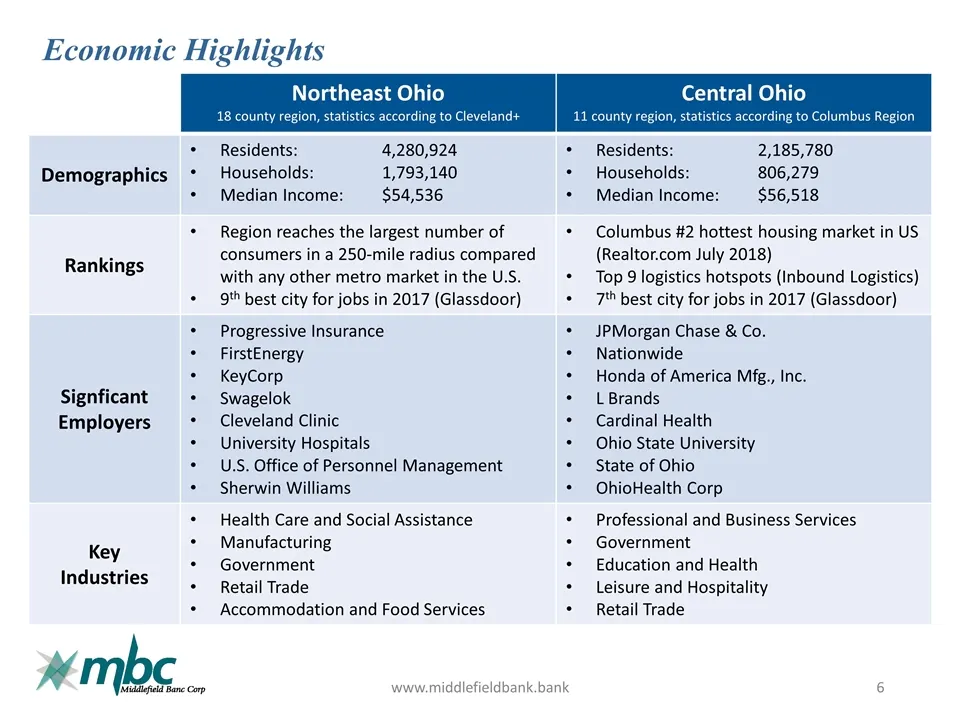
Economic Highlights www.middlefieldbank.bank Northeast Ohio 18 county region, statistics according to Cleveland+ Central Ohio 11 county region, statistics according to Columbus Region Demographics Residents:4,280,924 Households: 1,793,140 Median Income:$54,536 Residents:2,185,780 Households: 806,279
Slide 7: Compelling Central Ohio Growth and Development
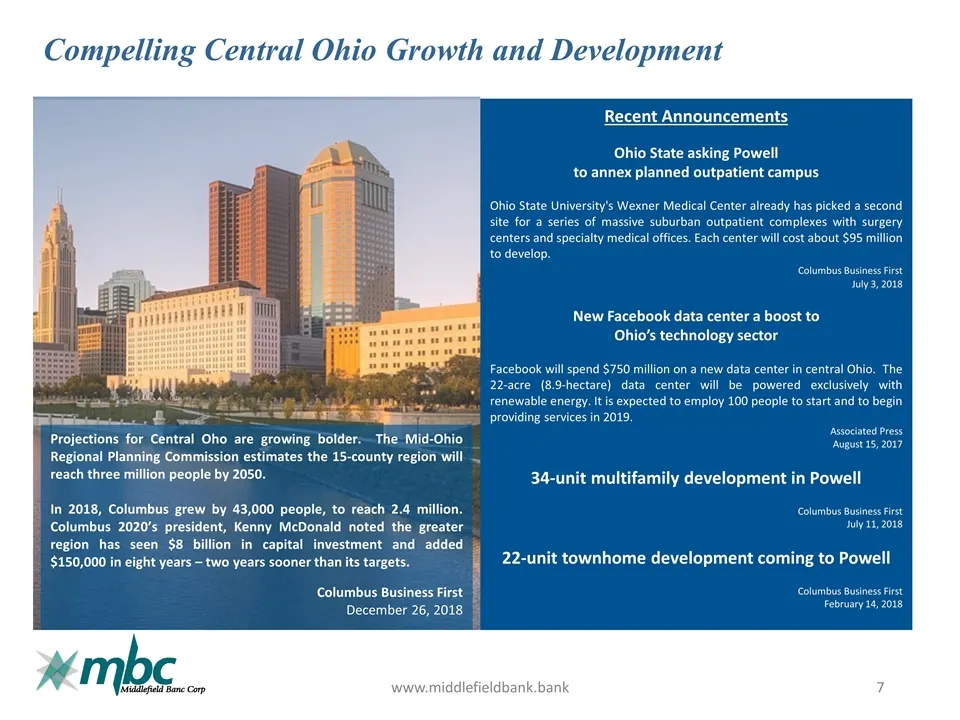
Compelling Central Ohio Growth and Development www.middlefieldbank.bank Projections for Central Oho are growing bolder. The Mid-Ohio Regional Planning Commission estimates the 15-county region will reach three million people by 2050. In 2018, Columbus grew by 43,000 people, to reach 2.4 million. Col
Slide 8: Community Oriented Banking Services
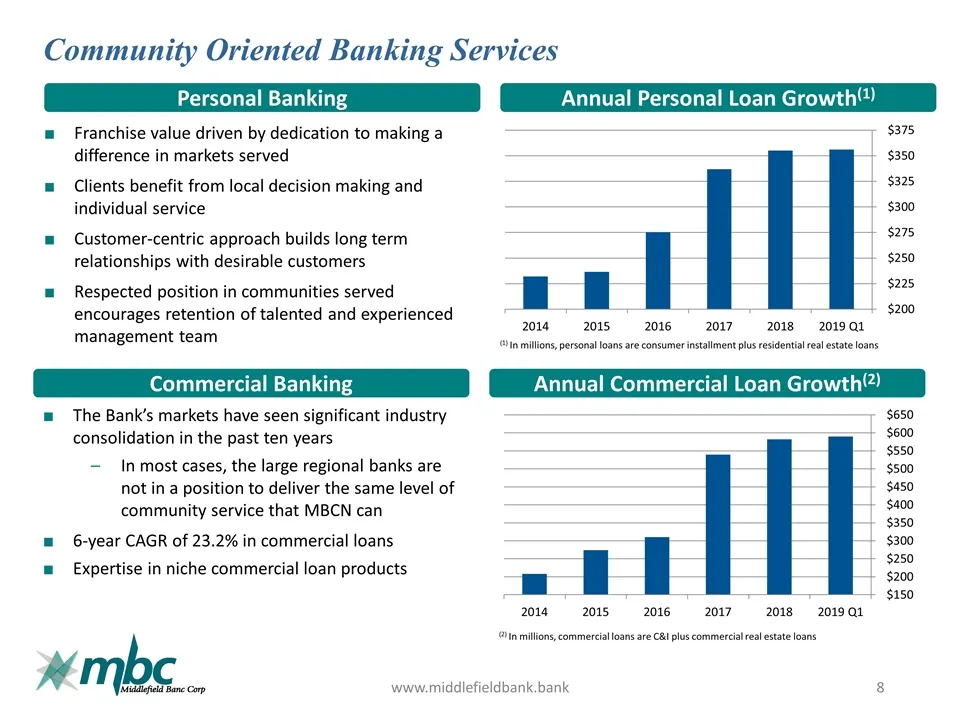
Community Oriented Banking Services www.middlefieldbank.bank Personal Banking Annual Personal Loan Growth(1) Commercial Banking Annual Commercial Loan Growth(2) Franchise value driven by dedication to making a difference in markets served Clients benefit from local decision making and individual ser
Slide 9: Middlefield's Market Share
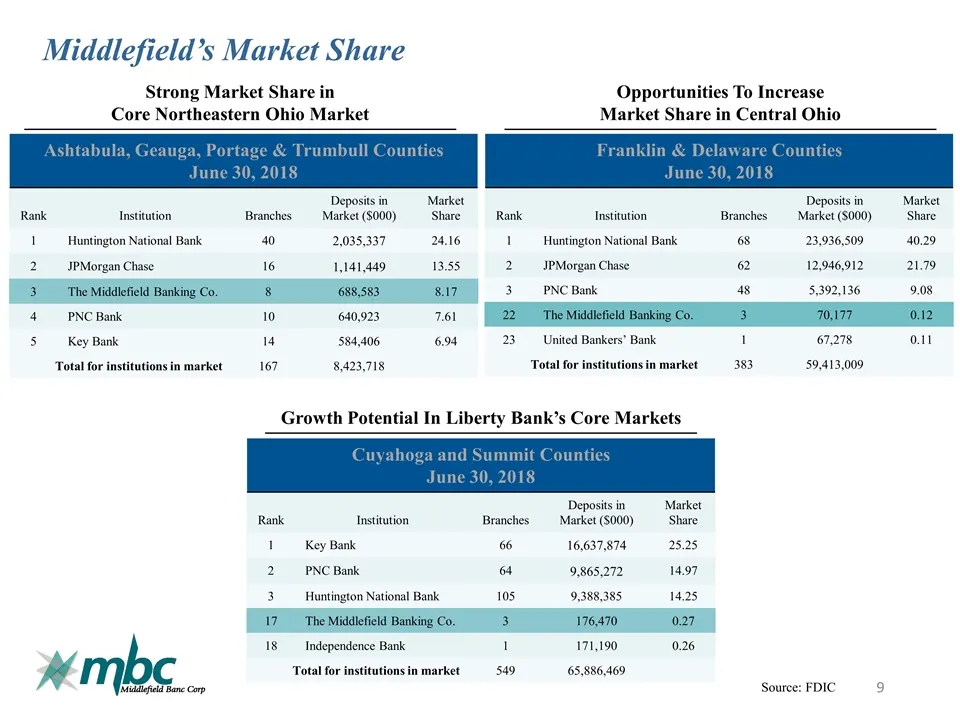
Middlefield’s Market Share Source: FDIC Ashtabula, Geauga, Portage & Trumbull Counties June 30, 2018 Rank Institution Branches Deposits in Market ($000) Market Share 1 Huntington National Bank 40 2,035,337 24.16 2 JPMorgan Chase 16 1,141,449 13.55 3 The Middlefield Banking Co. 8 688,583 8.17 4 PNC B
Slide 10: Customer testimonials
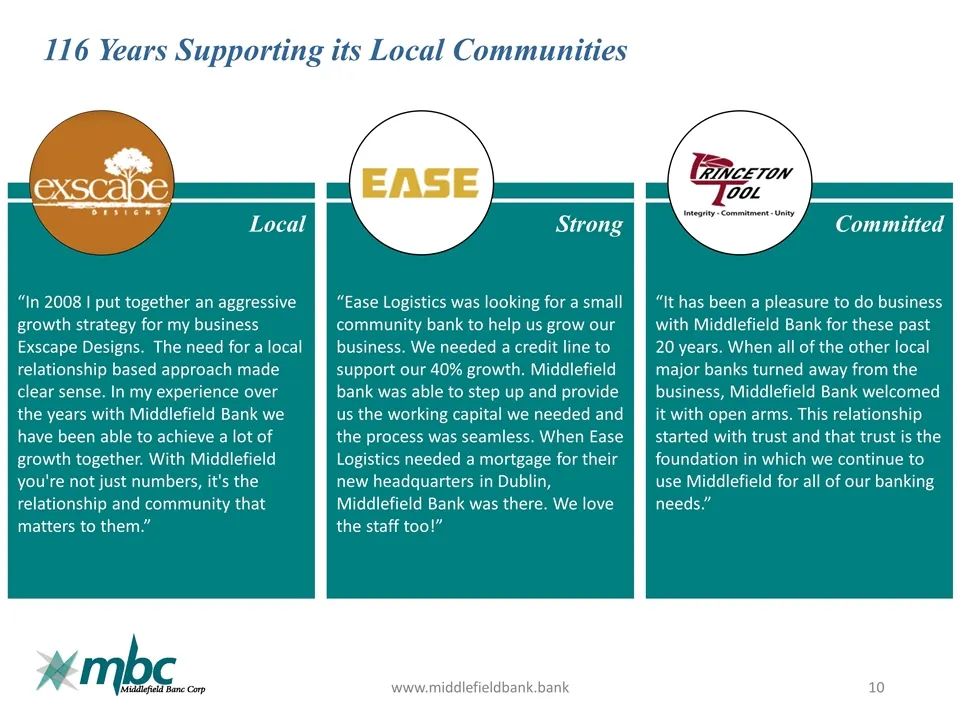
www.middlefieldbank.bank “In 2008 I put together an aggressive growth strategy for my business Exscape Designs. The need for a local relationship based approach made clear sense. In my experience over the years with Middlefield Bank we have been able to achieve a lot of growth together. With Middlef
Slide 11: Growth Platform
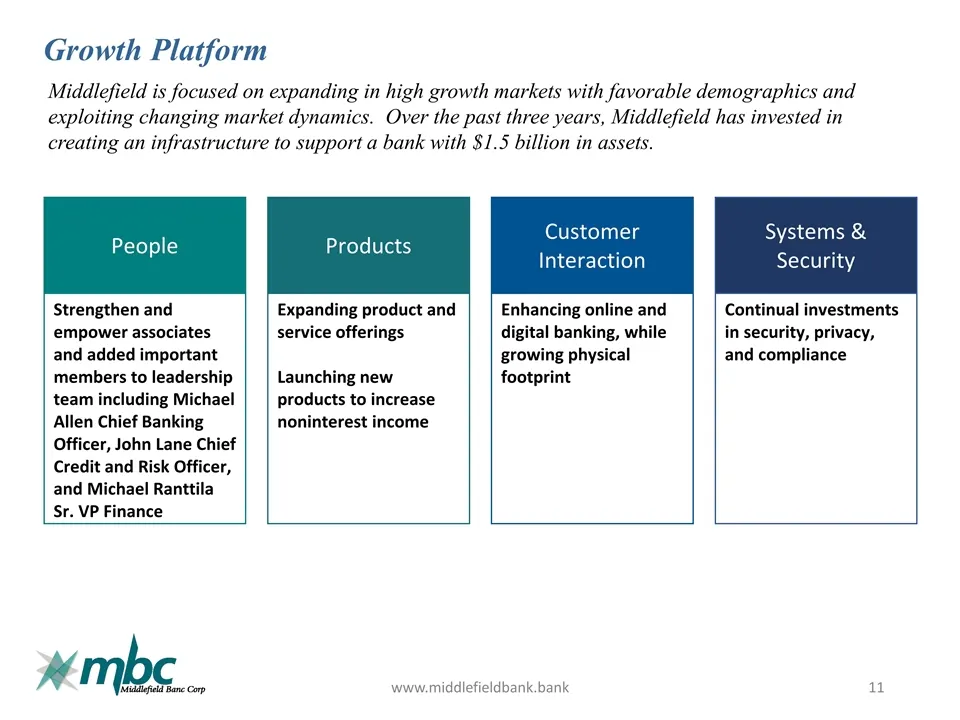
Growth Platform www.middlefieldbank.bank Middlefield is focused on expanding in high growth markets with favorable demographics and exploiting changing market dynamics. Over the past three years, Middlefield has invested in creating an infrastructure to support a bank with $1.5 billion in assets. Pe
Slide 12: History of Strong Financial Results
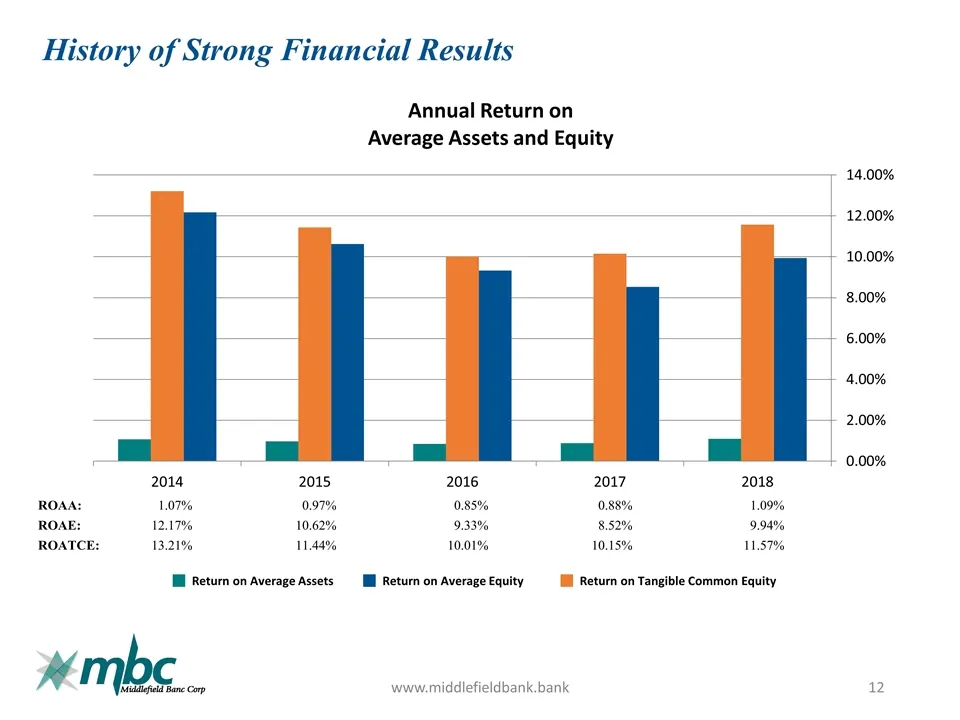
History of Strong Financial Results www.middlefieldbank.bank Annual Return on Average Assets and Equity Return on Average Assets Return on Average Equity Return on Tangible Common Equity ROAA: 1.07% 0.97% 0.85% 0.88% 1.09% ROAE: 12.17% 10.62% 9.33% 8.52% 9.94% ROATCE: 13.21% 11.44% 10.01% 10.15% 11.
Slide 13: Strong and Growing Deposit Base
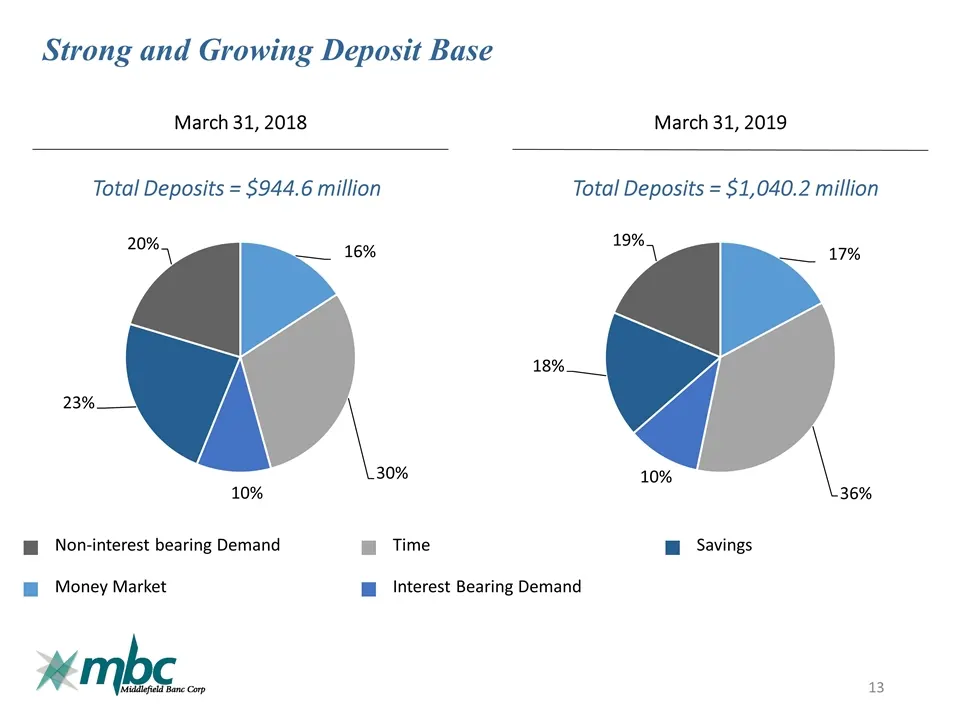
Strong and Growing Deposit Base March 31, 2019 March 31, 2018 Money Market Time Interest Bearing Demand Savings Total Deposits = $1,040.2 million Total Deposits = $944.6 million Non-interest bearing Demand
Slide 14: Continued Growth in Profitability
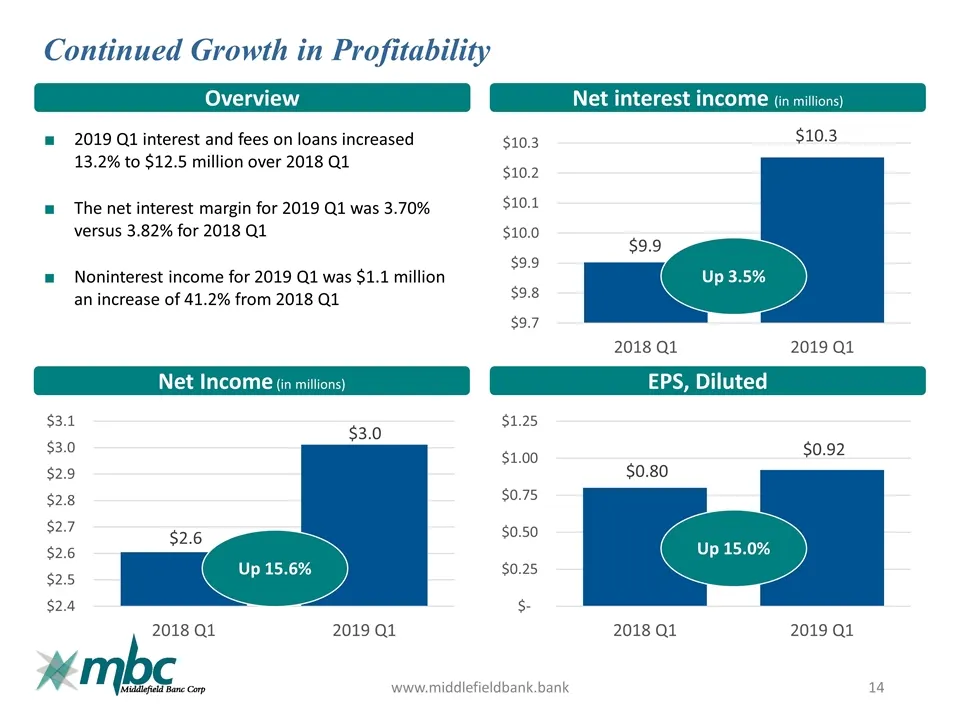
Continued Growth in Profitability www.middlefieldbank.bank Overview Net interest income (in millions) Net Income (in millions) EPS, Diluted Up 3.5% Up 15.6% 2019 Q1 interest and fees on loans increased 13.2% to $12.5 million over 2018 Q1 The net interest margin for 2019 Q1 was 3.70% versus 3.82% for
Slide 15: Strong Loan Growth
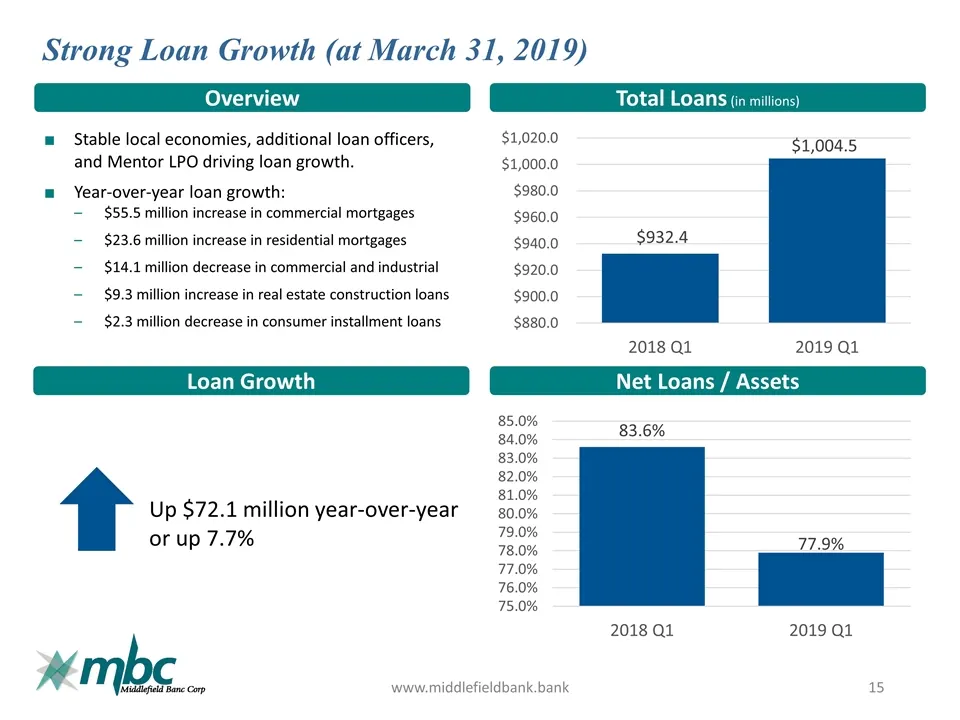
Strong Loan Growth (at March 31, 2019) www.middlefieldbank.bank Overview Total Loans (in millions) Loan Growth Net Loans / Assets Stable local economies, additional loan officers, and Mentor LPO driving loan growth. Year-over-year loan growth: $55.5 million increase in commercial mortgages $23.6 mil
Slide 16: Stable Asset Quality
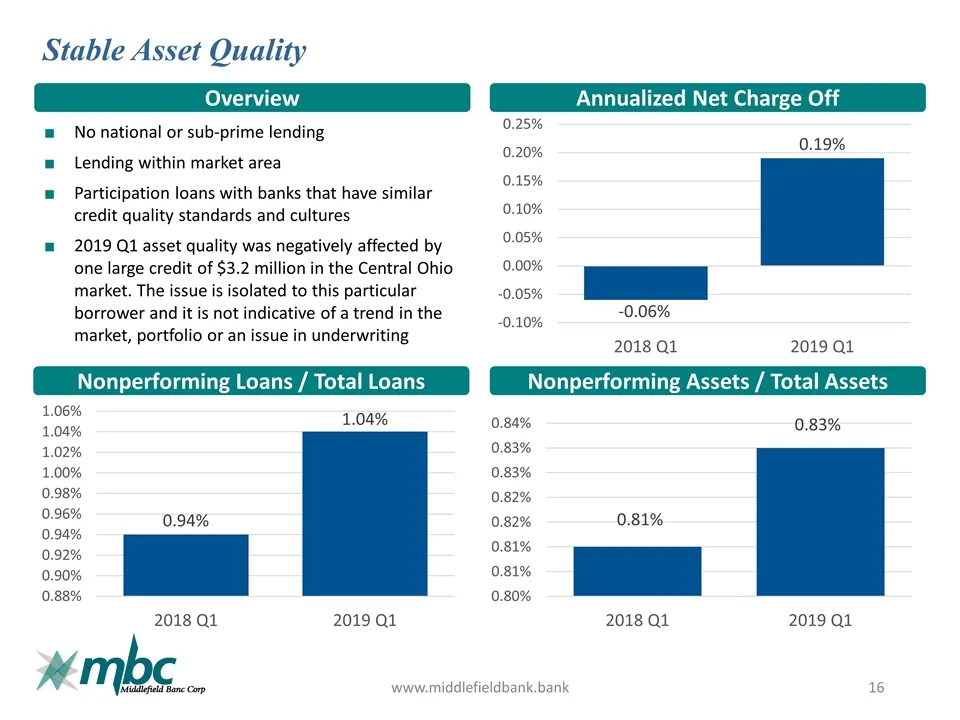
Stable Asset Quality www.middlefieldbank.bank Overview Annualized Net Charge Off Nonperforming Loans / Total Loans Nonperforming Assets / Total Assets No national or sub-prime lending Lending within market area Participation loans with banks that have similar credit quality standards and cultures 20
Slide 17: Annual Supplemental Data
Annual Supplemental Data (Nasdaq: MBCN)
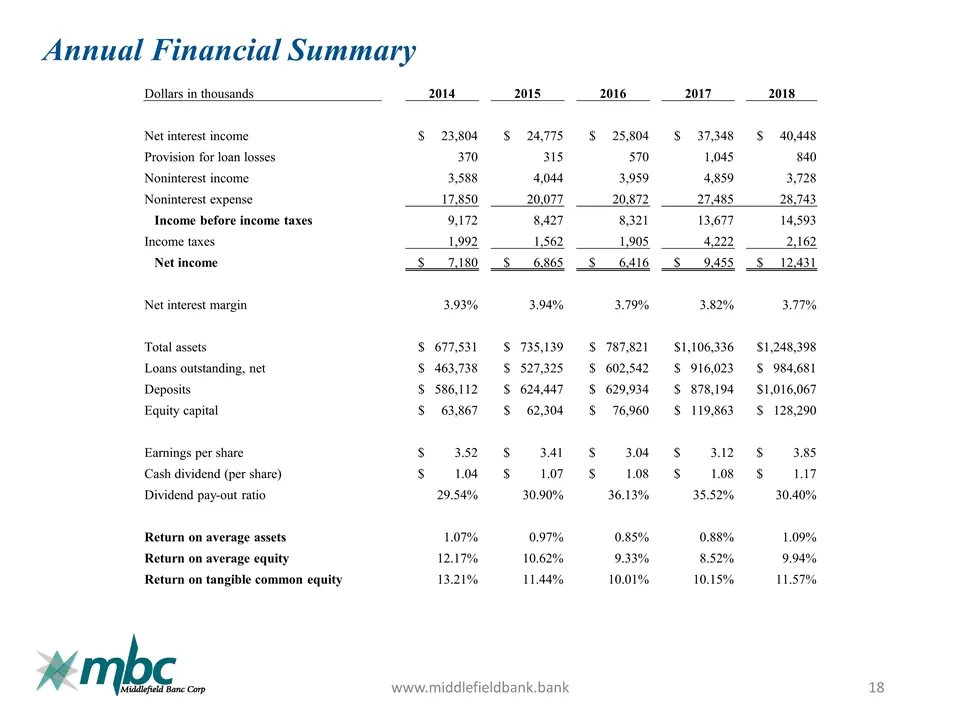
Slide 18: Annual Financial Summary
Annual Financial Summary www.middlefieldbank.bank Dollars in thousands 2014 2015 2016 2017 2018 Net interest income $ 23,804 $ 24,775 $ 25,804 $ 37,348 $ 40,448 Provision for loan losses 370 315 570 1,045 840 Noninterest income 3,588 4,044 3,959 4,859 3,728 Noninterest expense 17,850 20,077 20,872 2
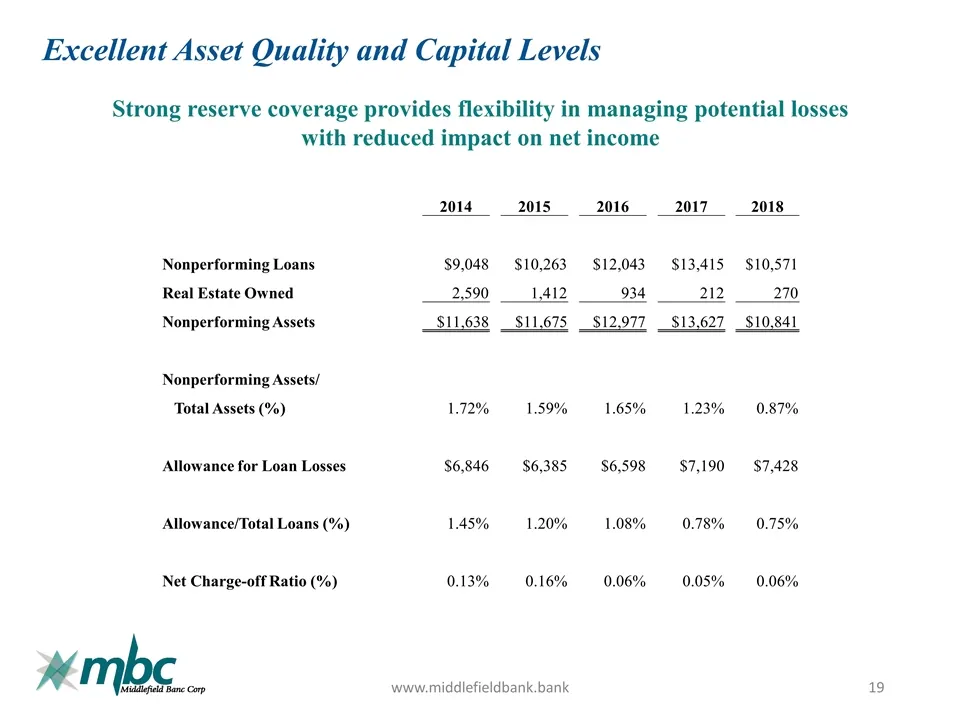
Slide 19: Excellent Asset Quality and Capital Levels
Excellent Asset Quality and Capital Levels www.middlefieldbank.bank Strong reserve coverage provides flexibility in managing potential losses with reduced impact on net income 2014 2015 2016 2017 2018 Nonperforming Loans $9,048 $10,263 $12,043 $13,415 $10,571 Real Estate Owned 2,590 1,412 934 212 27
Source: SEC EDGAR · 8-K filed Jun 17, 2019
More decks from Middlefield Banc
 Merger or Acquisition (October 2025)27 slides · Oct 22, 2025
 Q2 2025 Earnings Presentation24 slides · Jul 28, 2025
 Investor Presentation (June 2025)23 slides · Jun 2, 2025
 Q4 2024 Earnings Presentation24 slides · Jan 27, 2025
 Investor Presentation (November 2024)25 slides · Nov 22, 2024
 Investor Presentation (July 2024)25 slides · Jul 29, 2024