HCC Insurance — Investor Presentation (December 2008)
40 slides from HCC Insurance's investor presentation, Dec 9, 2008

Slide 1
Slide 2: About Forward-Looking Statements
ABOUT FORWARD-LOOKING STATEMENTS: This presentation contains certain "forward-looking statements" within the meaning of Section 27A of the Securities Act of 1933, and Section 21E of the Securities Exchange Act of 1934, which are intended to be covered by the safe harbors created by those laws. These

Slide 3: Overview
OVERVIEW HCC 3 (r)
Slide 4: Corporate Profile
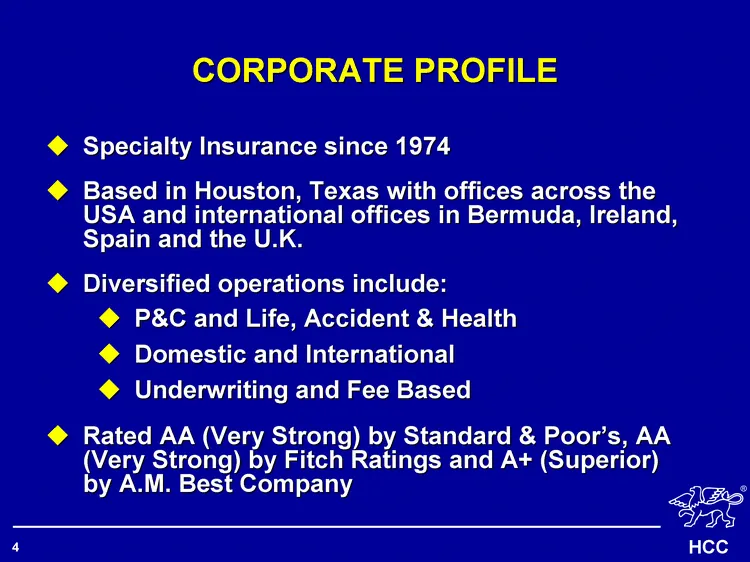
CORPORATE PROFILE Specialty Insurance since 1974 Based in Houston, Texas with offices across the USA and international offices in Bermuda, Ireland, Spain and the U.K. Diversified operations include: P&C and Life, Accident & Health Domestic and International Underwriting and Fee Based Rated AA (Very
Slide 5: Corporate Philosophy
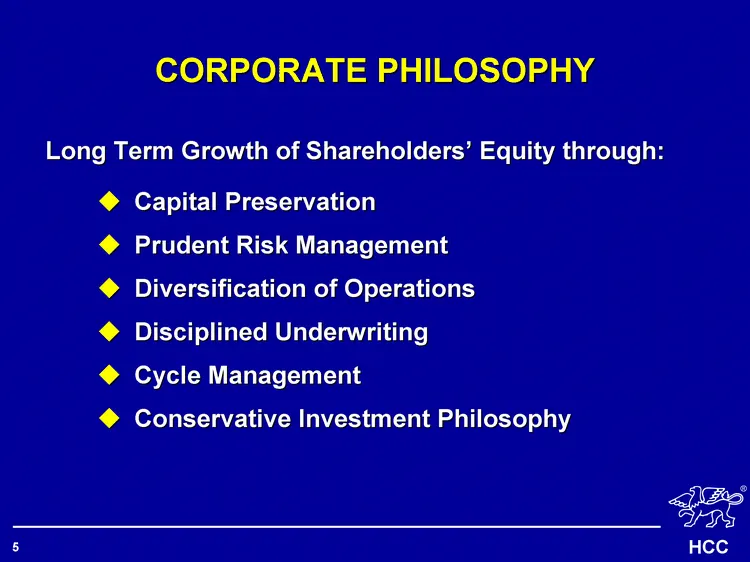
CORPORATE PHILOSOPHY Long Term Growth of Shareholders' Equity through: Capital Preservation Prudent Risk Management Diversification of Operations Disciplined Underwriting Cycle Management Conservative Investment Philosophy
Slide 6: Shareholders' Equity
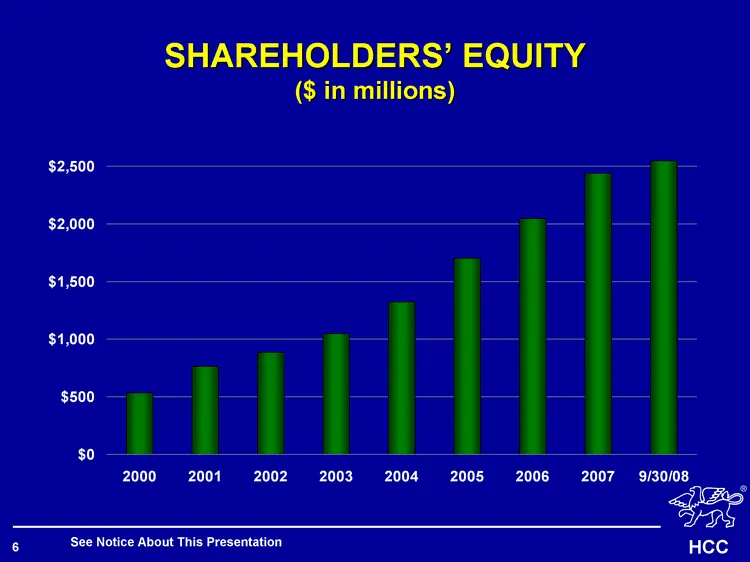
SHAREHOLDERS' EQUITY ($ in millions) See Notice About This Presentation 1998 1999 2000 2001 2002 2003 2004 2005 2006 2007 9/30/2008 S/E 440430000 458439000 530930000 763453000 882907000 1047000000 1323665000 1700000000 2043000000 2440000000 2547457000
Slide 7: Growth in Book Value
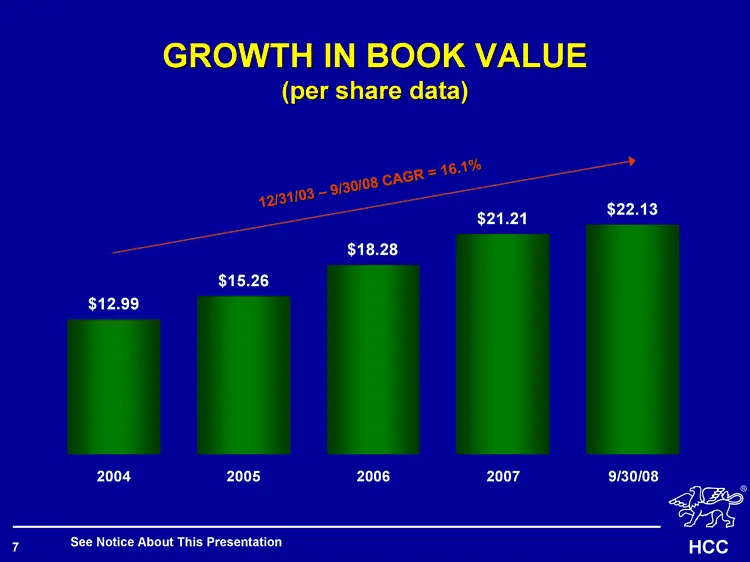
GROWTH IN BOOK VALUE (per share data) See Notice About This Presentation 2003 2004 2005 2006 2007 9/30/2008 BV 10.91 12.99 15.26 18.28 21.21 22.13 12/31/03 - 9/30/08 CAGR = 16.1%
Slide 8: Operations
OPERATIONS HCC 8 (r)
Slide 9: Lines of Business
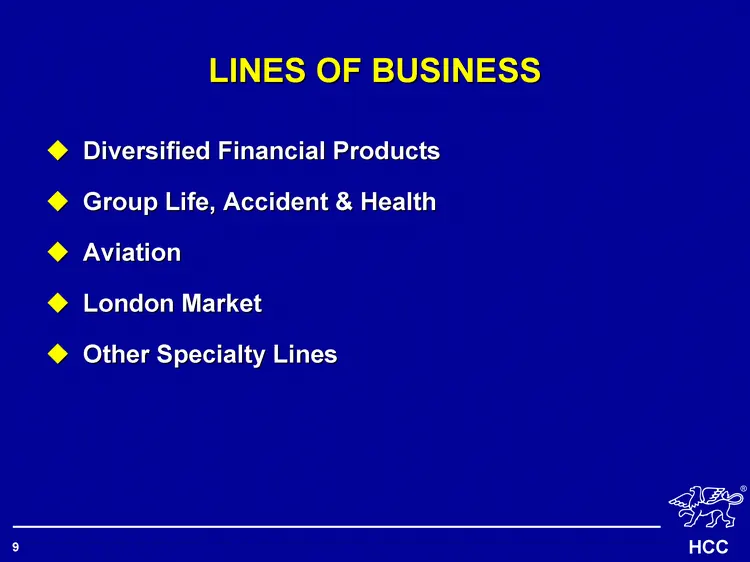
LINES OF BUSINESS Diversified Financial Products Group Life, Accident & Health Aviation London Market Other Specialty Lines
Slide 10: Diversified Financial Products
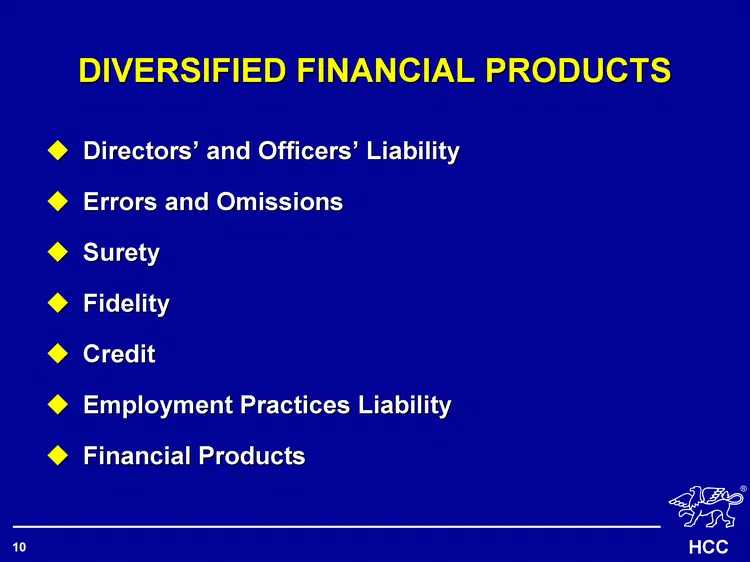
DIVERSIFIED FINANCIAL PRODUCTS Directors' and Officers' Liability Errors and Omissions Surety Fidelity Credit Employment Practices Liability Financial Products
Slide 11: Group Life, Accident & Health
GROUP LIFE, ACCIDENT & HEALTH Medical Stop-Loss Specialty Disability Group Life Insurance Medical Excess Insurance Alternative Workers Comp / Occupational Accident Insurance Short Term Medical
Slide 12: Aviation
AVIATION Pleasure and Business Aircraft Owners and Pilots Rotor Wing Aircraft Foreign Commuter Airlines Cargo Operations Military and Law Enforcement Antique and Vintage Aircraft Do not write Major Airlines, Product Manufacturers and Satellites
Slide 13: London Market Account
LONDON MARKET ACCOUNT Energy, Onshore and Offshore Marine Property Accident and Health
Slide 14: Other Specialty Lines
OTHER SPECIALTY LINES Event and Contingency Brown Water Marine U.K. Liability Public Entity DIC
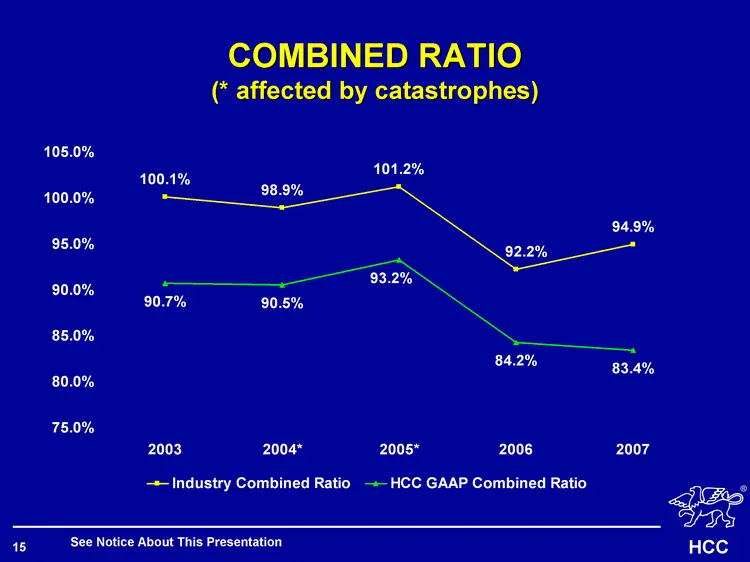
Slide 15: Combined Ratio
2003 2004* 2005* 2006 2007 Peer Group Average** 0.959 0.934 0.91 0.844 0.841 Industry Combined Ratio 1.001 0.989 1.012 0.922000000232828 0.949 HCC GAAP Combined Ratio 0.907 0.905 0.932 0.842 0.834 COMBINED RATIO (* affected by catastrophes) See Notice About This Presentation
Slide 16: Financials
FINANCIALS HCC 16 (r)
Slide 17: Strong Balance Sheet
STRONG BALANCE SHEET HCC 17 (r)
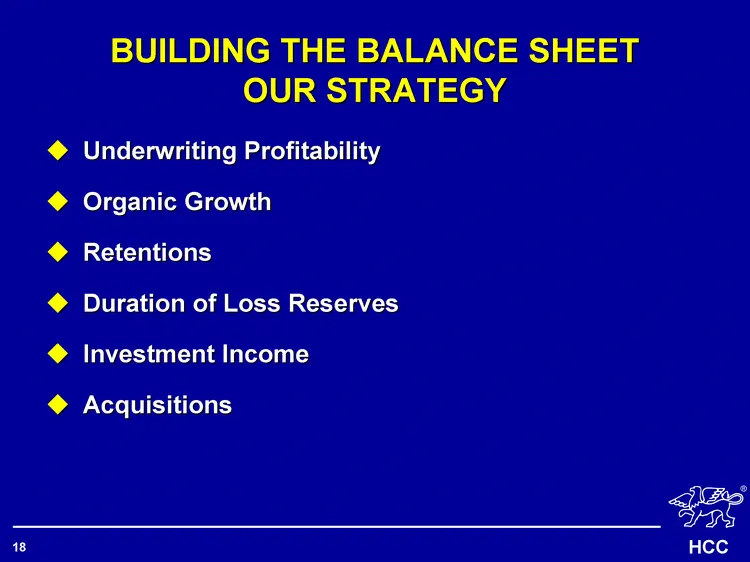
Slide 18: Building the Balance Sheet: Our Strategy
BUILDING THE BALANCE SHEET OUR STRATEGY Underwriting Profitability Organic Growth Retentions Duration of Loss Reserves Investment Income Acquisitions
Slide 19: Balance Sheet Strengths
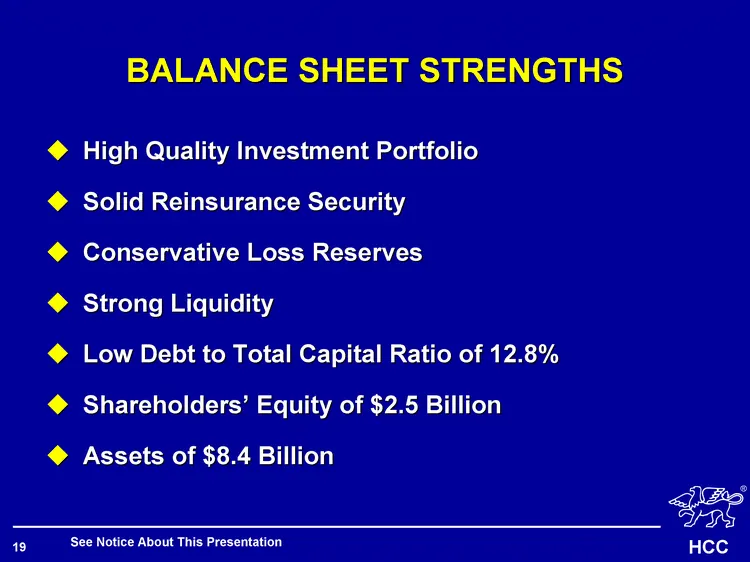
BALANCE SHEET STRENGTHS High Quality Investment Portfolio Solid Reinsurance Security Conservative Loss Reserves Strong Liquidity Low Debt to Total Capital Ratio of 12.8% Shareholders' Equity of $2.5 Billion Assets of $8.4 Billion See Notice About This Presentation
Slide 20: Net Loss Reserves
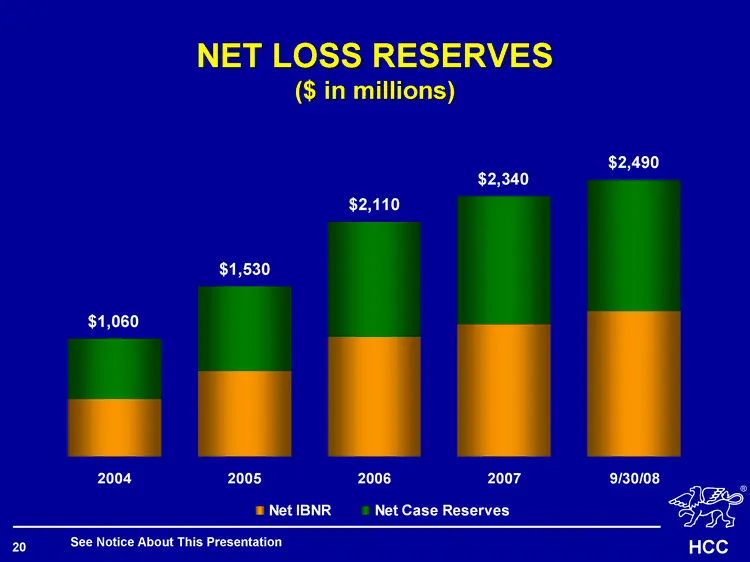
NET LOSS RESERVES ($ in millions) See Notice About This Presentation 2003 2004 2005 2006 2007 9/30/2008 Net IBNR 516 768 1073 1187 1304 Net Loss Reserves 710 1060 1530 2110 2340 2490 Net Case Reserves 544 762 1037 1153 1186 $1,060 $1,530 $2,110 $2,340 $2,490
Slide 21: Operating Cash Flow
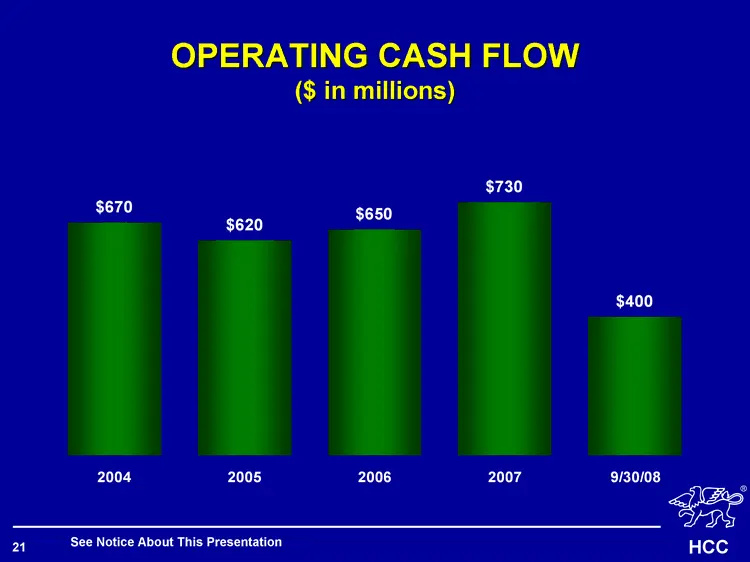
OPERATING CASH FLOW ($ in millions) See Notice About This Presentation 2003 2004 2005 2006 2007 9/30/2008 Cash Flow 570 670 620 650 730 400
Slide 22: Investment Assets
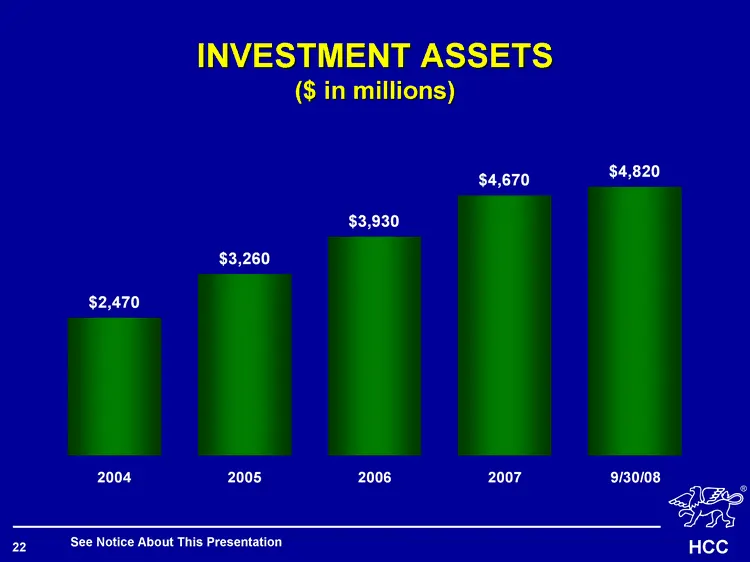
INVESTMENT ASSETS ($ in millions) See Notice About This Presentation 2003 2004 2005 2006 2007 9/30/2008 Investment Assets 1710 2470 3260 3930 4670 4820
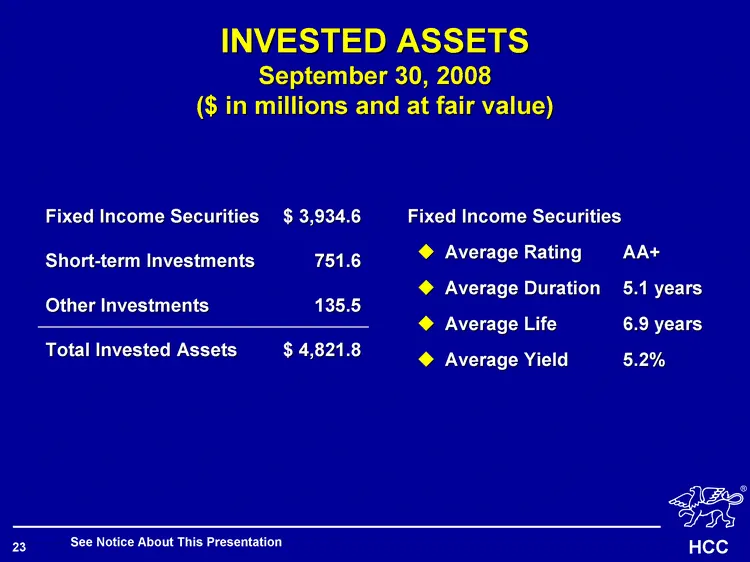
Slide 23: Invested Assets, September 30, 2008
Fixed Income Securities Average Rating AA+ Average Duration 5.1 years Average Life 6.9 years Average Yield 5.2% Fixed Income Securities $ 3,934.6 Short-term Investments 751.6 Other Investments 135.5 Total Invested Assets $ 4,821.8 See Notice About This Presentation INVESTED ASSETS September 30, 2008
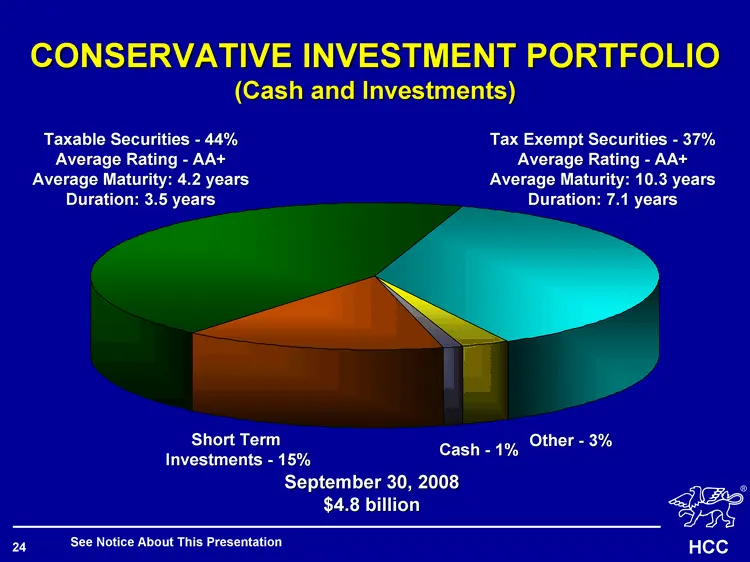
Slide 24: Conservative Investment Portfolio
Taxable Securities Tax Exempt Securities Other Cash Short Term Investments 6/30/2007 44 37 3 1 15 CONSERVATIVE INVESTMENT PORTFOLIO (Cash and Investments) See Notice About This Presentation September 30, 2008 $4.8 billion Short Term Investments - 15% Tax Exempt Securities - 37% Average Rating - AA+
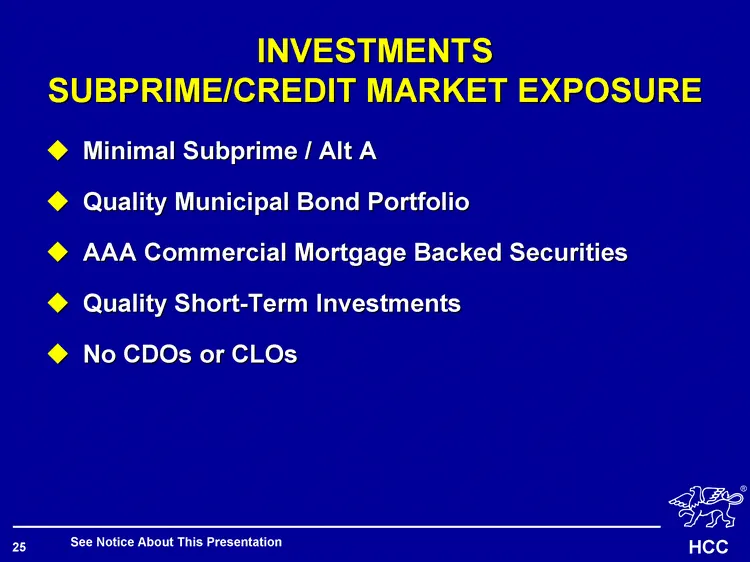
Slide 25: Investments: Subprime/Credit Market Exposure
INVESTMENTS SUBPRIME/CREDIT MARKET EXPOSURE Minimal Subprime / Alt A Quality Municipal Bond Portfolio AAA Commercial Mortgage Backed Securities Quality Short-Term Investments No CDOs or CLOs See Notice About This Presentation
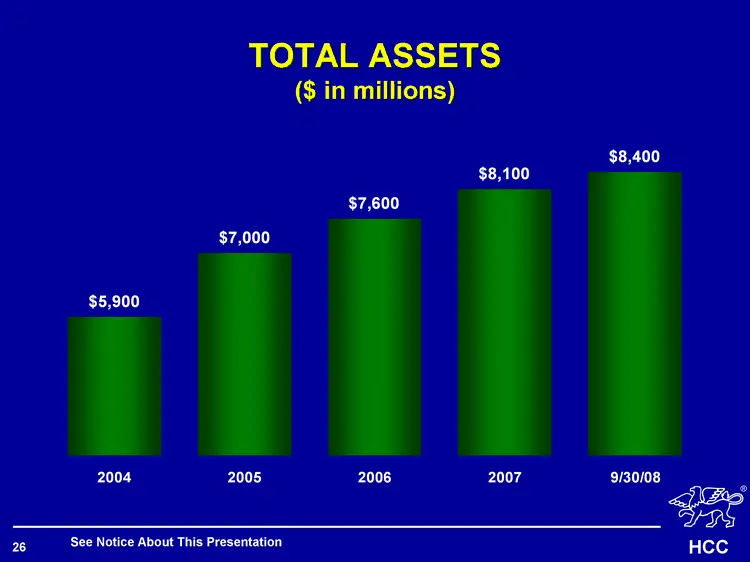
Slide 26: Total Assets
TOTAL ASSETS ($ in millions) See Notice About This Presentation 2003 2004 2005 2006 2007 9/30/2008 Total Assets 4900 5900 7000 7600 8100 8400
Slide 27: Shareholders' Equity
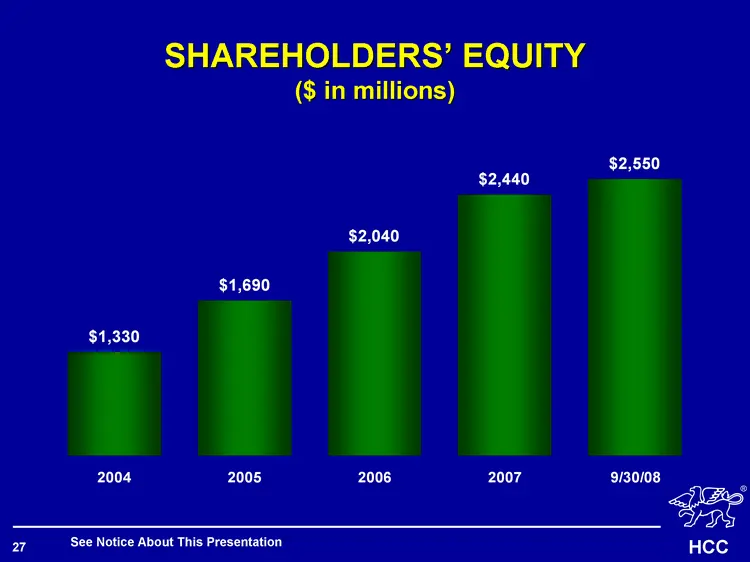
SHAREHOLDERS' EQUITY ($ in millions) See Notice About This Presentation 2003 2004 2005 2006 2007 9/30/2008 SE 1050 1330 1690 2040 2440 2550
Slide 28: Income Statement
INCOME STATEMENT HCC 28 (r)
Slide 29: Written Premium
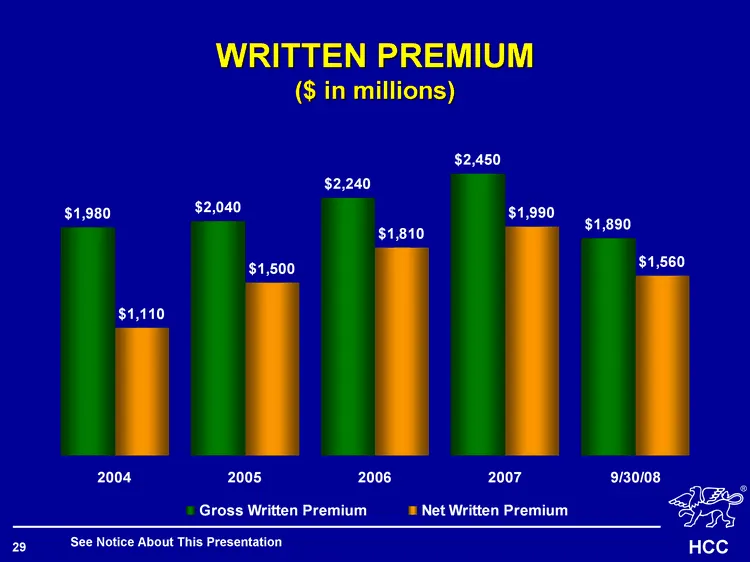
WRITTEN PREMIUM ($ in millions) 2003 2004 2005 2006 2007 9/30/2008 Gross Written Premium 1620 1980 2040 2240 2450 1890 Net Written Premium 870 1110 1500 1810 1990 1560 See Notice About This Presentation
Slide 30: Net Earned Premium
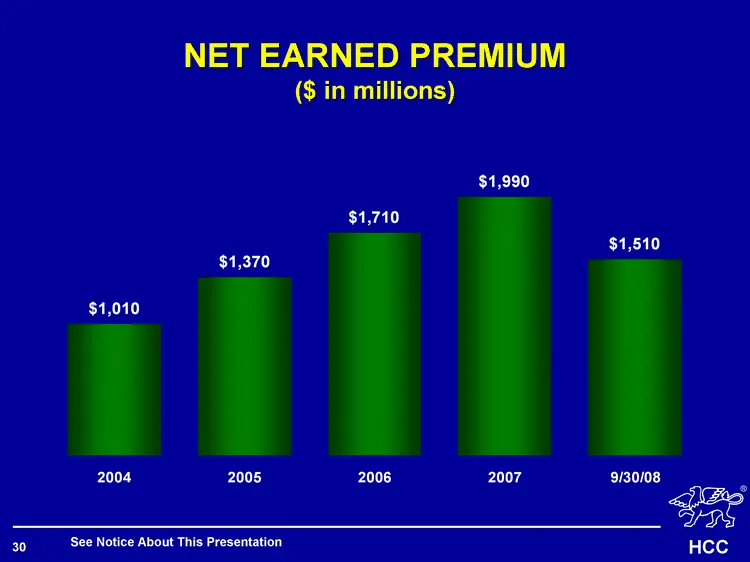
NET EARNED PREMIUM ($ in millions) 2003 2004 2005 2006 2007 9/30/2008 NEP 738 1010 1370 1710 1990 1510 See Notice About This Presentation
Slide 31: Fee & Commission Income
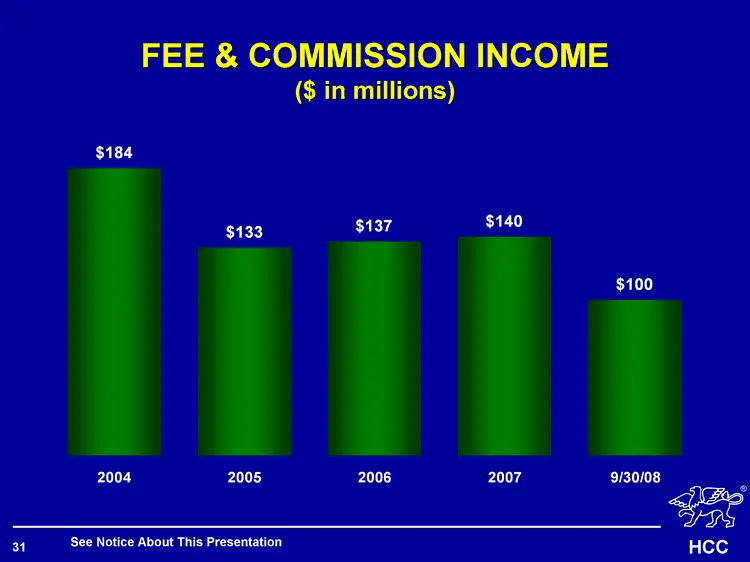
FEE & COMMISSION INCOME ($ in millions) 2003 2004 2005 2006 2007 9/30/2008 F&C 143 184 133 137 140 100 See Notice About This Presentation
Slide 32: Investment Income
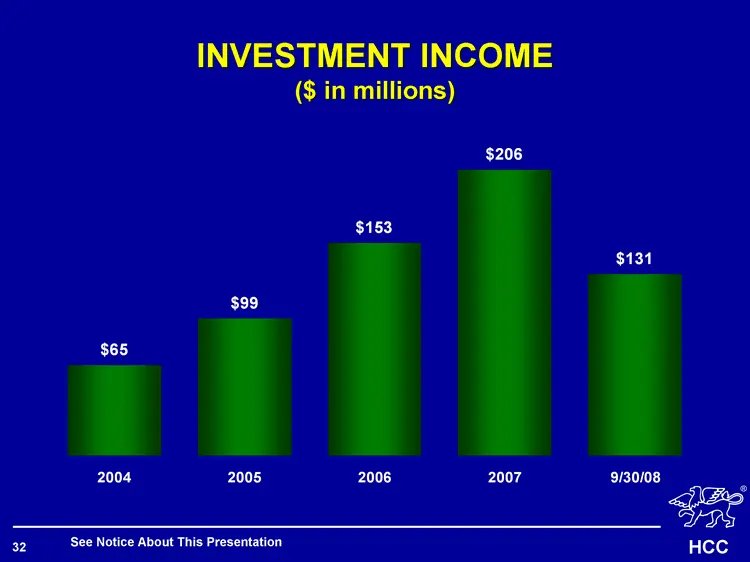
INVESTMENT INCOME ($ in millions) 2003 2004 2005 2006 2007 9/30/2008 Investment Income 47 65 99 153 206 131 See Notice About This Presentation
Slide 33: Total Revenue
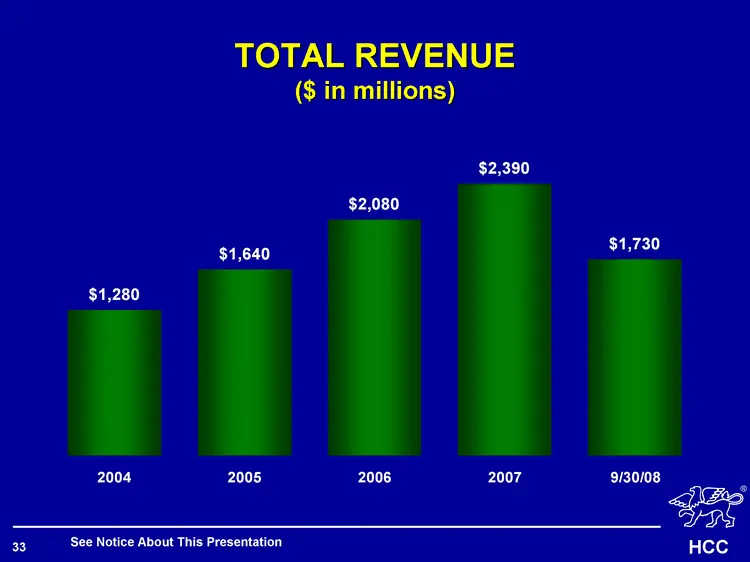
TOTAL REVENUE ($ in millions) 2003 2004 2005 2006 2007 9/30/2008 Total Revenur 940 1280 1640 2080 2390 1730 See Notice About This Presentation
Slide 34: Net Earnings
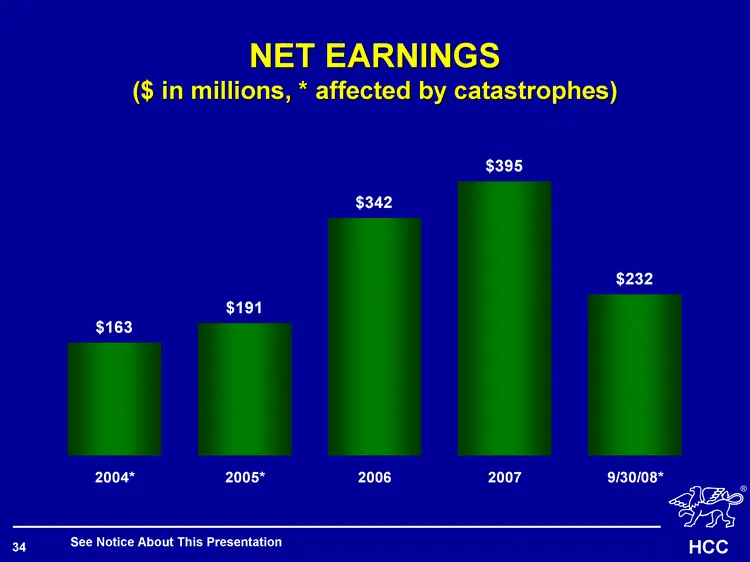
NET EARNINGS ($ in millions, * affected by catastrophes) 2003 2004* 2005* 2006 2007 9/30/08* Net Earnings 142 163 191 342 395 232 See Notice About This Presentation
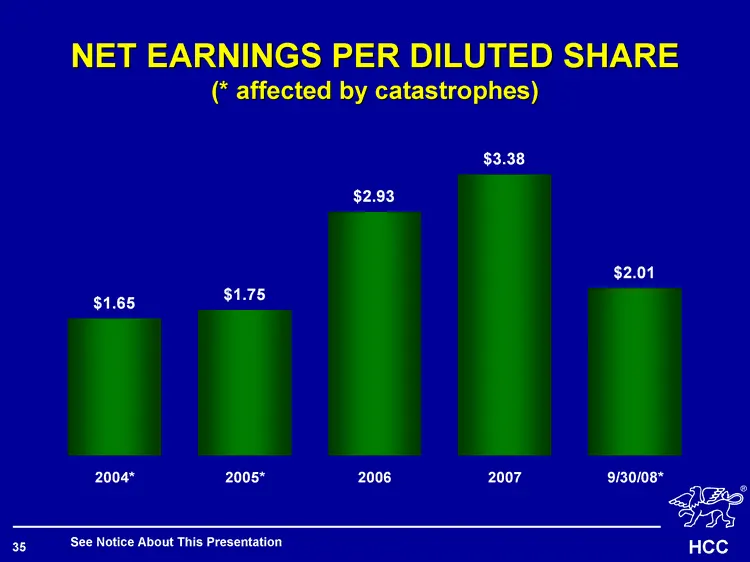
Slide 35: Net Earnings per Diluted Share
NET EARNINGS PER DILUTED SHARE (* affected by catastrophes) 2003 2004* 2005* 2006 2007 9/30/08* Net Earnings per diluted share 1.47 1.65 1.75 2.93 3.38 2.01 See Notice About This Presentation
Slide 36: Summary
SUMMARY HCC 36 (r)
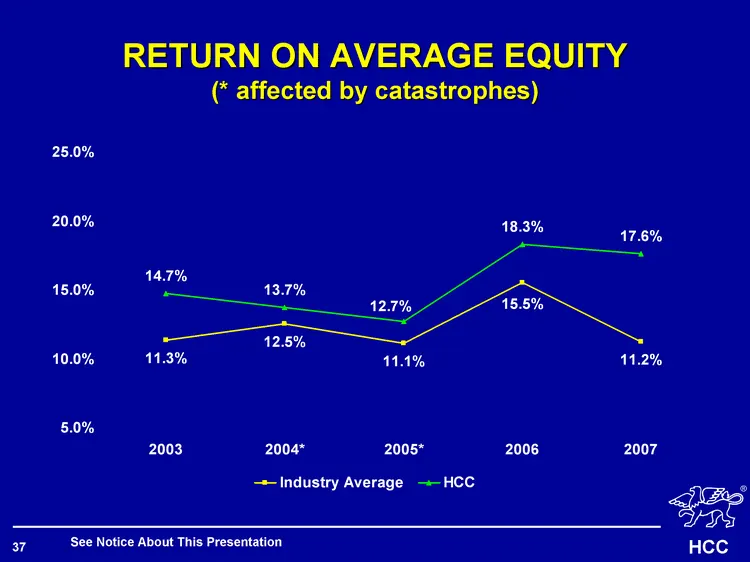
Slide 37: Return on Average Equity
2003 2004* 2005* 2006 2007 Industry Average 0.113 0.125 0.111 0.155 0.112 HCC Average 0.171 0.171 0.171 0.171 0.171 HCC 0.147 0.137 0.127 0.183 0.176 See Notice About This Presentation RETURN ON AVERAGE EQUITY (* affected by catastrophes)
Slide 38: HCC Key Strengths
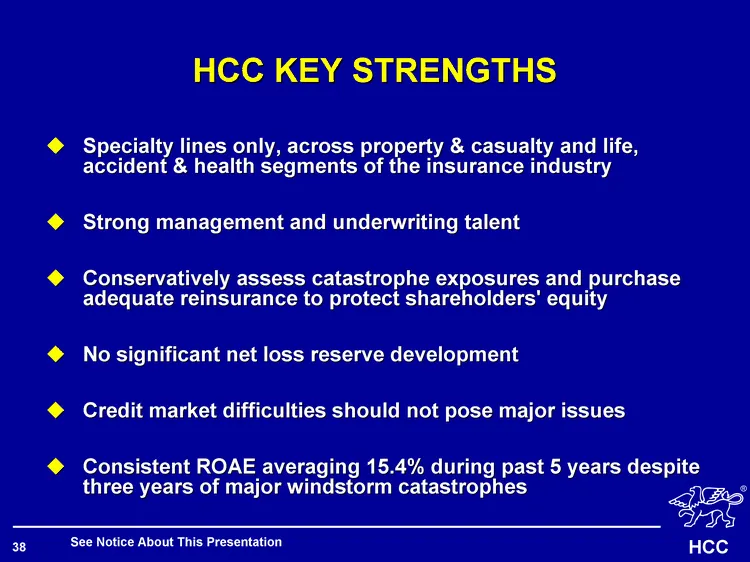
HCC KEY STRENGTHS Specialty lines only, across property & casualty and life, accident & health segments of the insurance industry Strong management and underwriting talent Conservatively assess catastrophe exposures and purchase adequate reinsurance to protect shareholders' equity No significant net
Slide 39: About Forward-Looking Statements
ABOUT FORWARD-LOOKING STATEMENTS: This presentation contains certain "forward-looking statements" within the meaning of Section 27A of the Securities Act of 1933, and Section 21E of the Securities Exchange Act of 1934, which are intended to be covered by the safe harbors created by those laws. These

Slide 40
Source: SEC EDGAR · 8-K filed Dec 9, 2008
More decks from HCC Insurance Holdings Inc
 Q2 2015 Earnings Presentation31 slides · Aug 14, 2015
 Merger or Acquisition (June 2015)22 slides · Jun 23, 2015
 Merger or Acquisition (June 2015)10 slides · Jun 10, 2015
 Merger or Acquisition (June 2015)30 slides · Jun 10, 2015
 Q1 2015 Earnings Presentation35 slides · May 21, 2015
 36th Annual Raymond James Institutional Investors Conference (February 2015)36 slides · Feb 27, 2015