DPL — Lehman Brothers CEO Energy/Power Conference 2006
28 slides from DPL's conference presentation, Sep 7, 2006
Slide 1: Lehman Brothers CEO Energy/Power Conference
September 5 – 7, 2006 Lehman Brothers CEO Energy/Power Conference Exhibit 99.2
Slide 2: Notice Regarding Forward Looking Statements
Notice Regarding Forward Looking Statements Certain statements contained in this discussion are “forward-looking statements” within the meaning of the Private Securities Litigation Reform Act of 1995. Matters discussed in this report which relate to events or developments that are expected to occur
Slide 3: Company Overview
Company Overview
Slide 4: Stable and Strong Retail Market
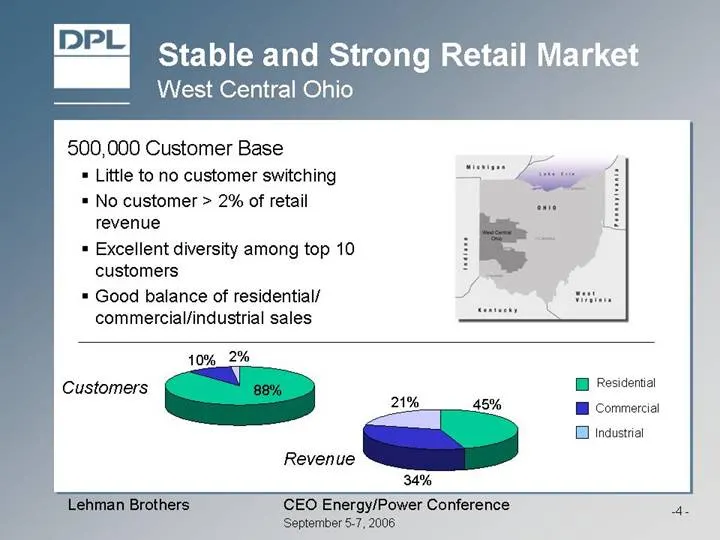
Stable and Strong Retail Market West Central Ohio 500,000 Customer Base Little to no customer switching No customer > 2% of retail revenue Excellent diversity among top 10 customers Good balance of residential/ commercial/industrial sales Customers 88% 10% 2% Revenue 45% 34% 21% Residential Commerci
Slide 5: Strong T&D Operations
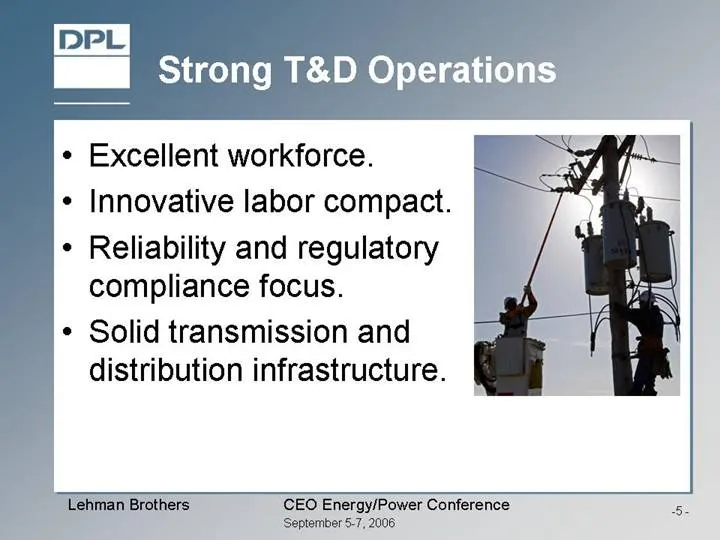
Strong T&D Operations Excellent workforce. Innovative labor compact. Reliability and regulatory compliance focus. Solid transmission and distribution infrastructure.
Slide 6: DPL Generation
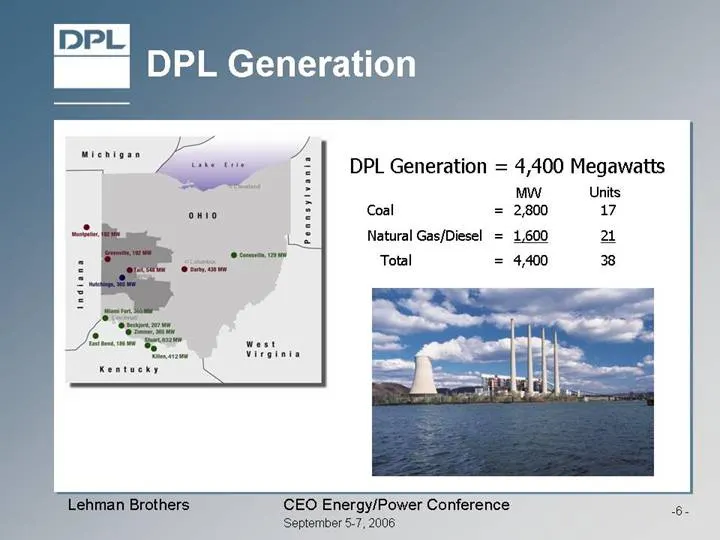
DPL Generation Coal = 2,800 17 Natural Gas/Diesel = 1,600 21 Total = 4,400 38 DPL Generation = 4,400 Megawatts MW Units
Slide 7: Ohio Regulatory Environment
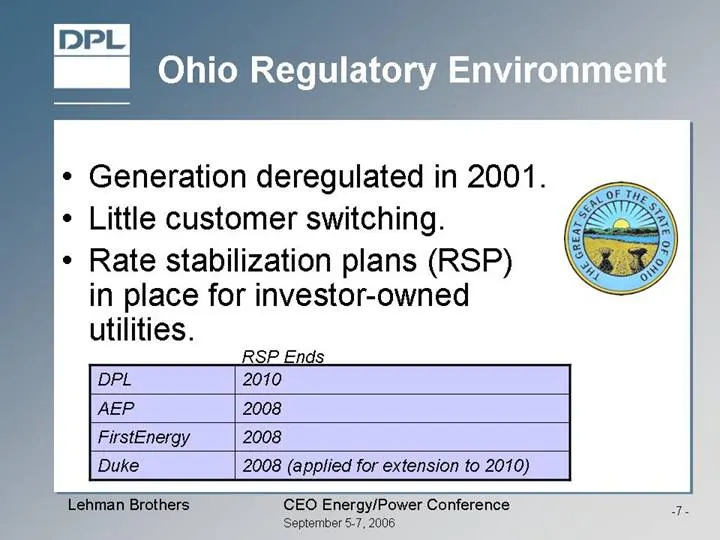
Ohio Regulatory Environment Generation deregulated in 2001. Little customer switching. Rate stabilization plans (RSP) in place for investor-owned utilities. 2008 (applied for extension to 2010) Duke 2008 FirstEnergy 2008 AEP 2010 DPL RSP Ends
Slide 8: DPL - Recent Regulatory Actions
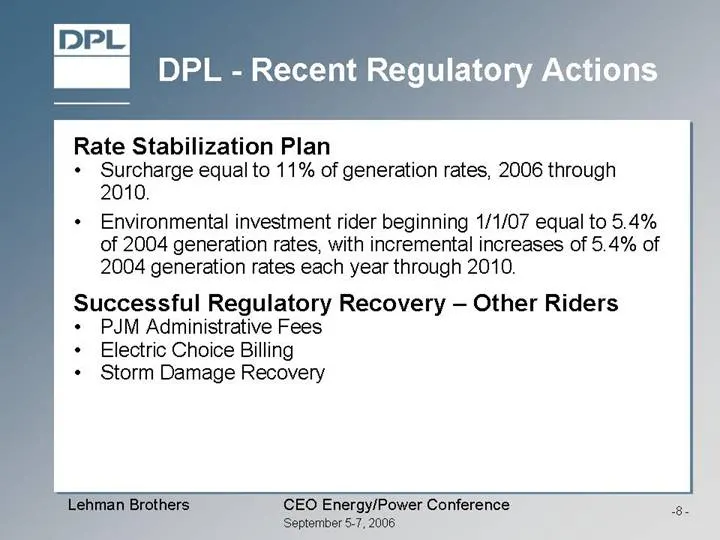
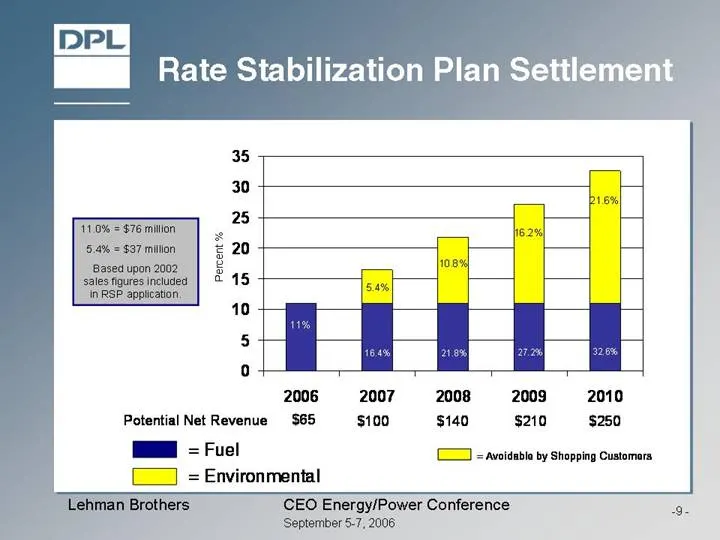
DPL - Recent Regulatory Actions Rate Stabilization Plan Surcharge equal to 11% of generation rates, 2006 through 2010. Environmental investment rider beginning 1/1/07 equal to 5.4% of 2004 generation rates, with incremental increases of 5.4% of 2004 generation rates each year through 2010. Successfu
Slide 9: Rate Stabilization Plan Settlement
Rate Stabilization Plan Settlement 11% 16.4% 21.8% 27.2% 32.6% Rate Stabilization Plan Settlement 0 5 10 15 20 25 30 35 2006 2007 2008 2009 2010 11% 5.4% 16.4% 21.8% 27.2% 32.6% 11.0% = $76 million 5.4% = $37 million Based upon 2002 sales figures included in RSP application. 10.8% 16.2% Percent % Po
Slide 10: Financial & Operational Overview
Financial & Operational Overview
Slide 11: Earnings Per Share
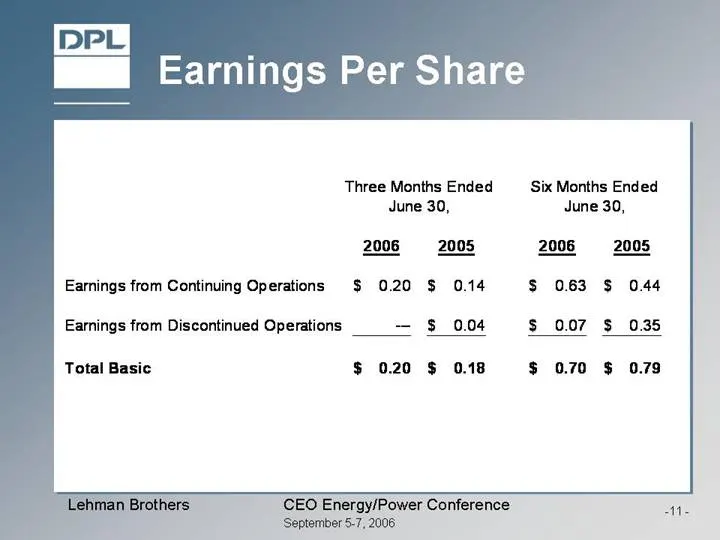
Earnings Per Share 2006 2005 2006 2005 Earnings from Continuing Operations 0.20 $ 0.14 $ 0.63 $ 0.44 $ Earnings from Discontinued Operations --- 0.04 $ 0.07 $ 0.35 $ Total Basic 0.20 $ 0.18 $ 0.70 $ 0.79 $ Three Months Ended June 30, Six Months Ended June 30,
Slide 12: Earnings Drivers: Positives and Challenges
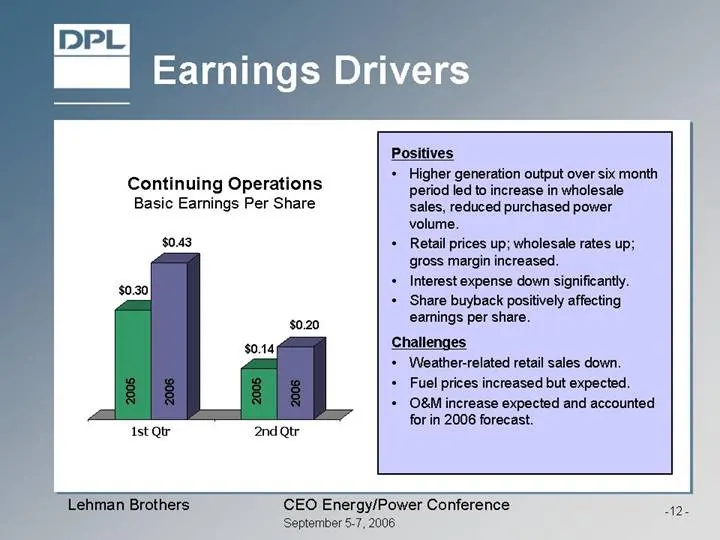
Positives Higher generation output over six month period led to increase in wholesale sales, reduced purchased power volume. Retail prices up; wholesale rates up; gross margin increased. Interest expense down significantly. Share buyback positively affecting earnings per share. Challenges Weather-re
Slide 13: Liquidity & Cash Flow
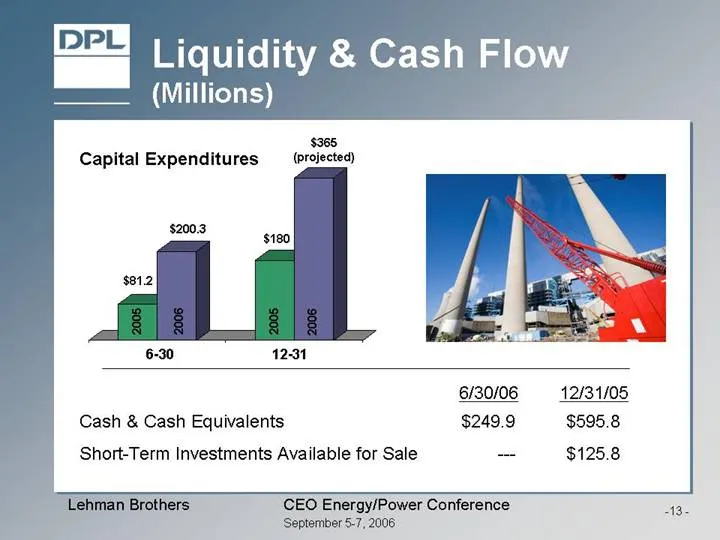
Liquidity & Cash Flow (Millions) Cash & Cash Equivalents $249.9 $595.8 Short-Term Investments Available for Sale --- $125.8 6/30/06 12/31/05 $81.2 $200.3 $180 $365 (projected) 2005 2006 2005 2006 6-30 12-31 Capital Expenditures
Slide 14: Capital Expenditures
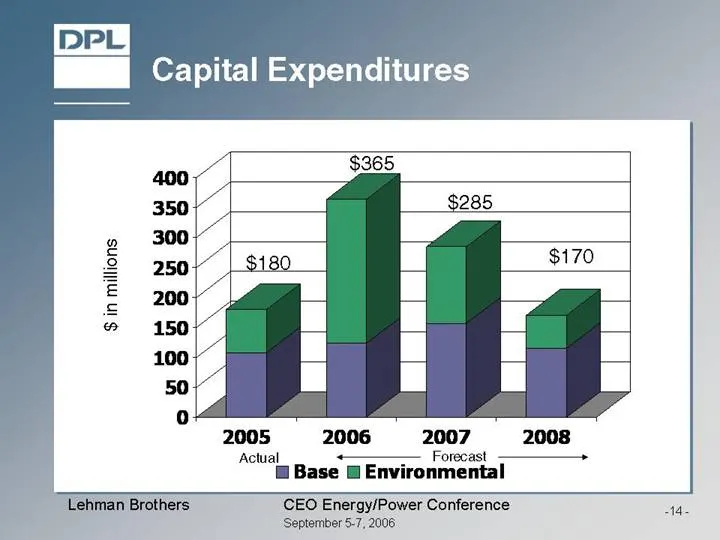
$ in millions $365 $285 $170 Capital Expenditures $180 Actual Forecast 0 50 100 150 200 250 300 350 400 2005 2006 2007 2008 Base Environmental
Slide 15: Operational Update
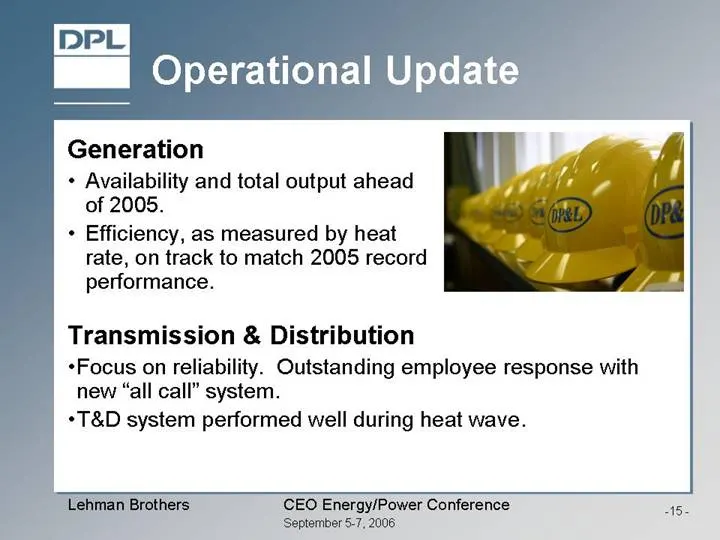
Generation Availability and total output ahead of 2005. Efficiency, as measured by heat rate, on track to match 2005 record performance. Operational Update Transmission & Distribution Focus on reliability. Outstanding employee response with new “all call” system. T&D system performed well during hea
Slide 16: Fuel Update
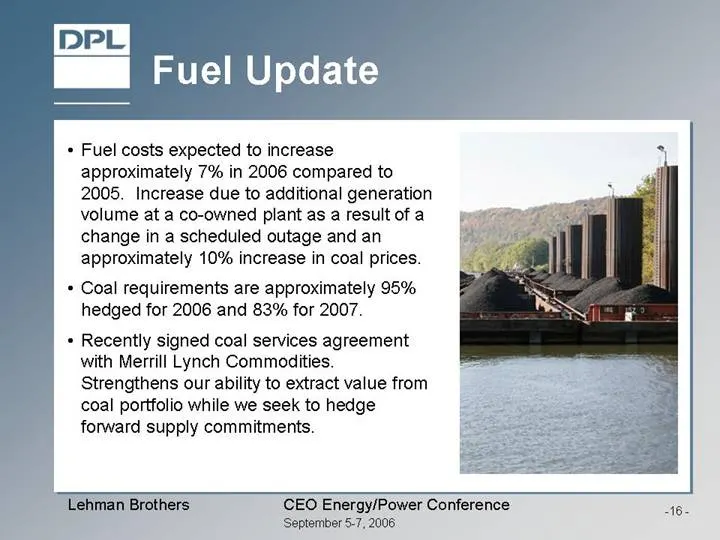
Fuel Update Fuel costs expected to increase approximately 7% in 2006 compared to 2005. Increase due to additional generation volume at a co-owned plant as a result of a change in a scheduled outage and an approximately 10% increase in coal prices. Coal requirements are approximately 95% hedged for 2
Slide 17: Scrubber (FGD) Update
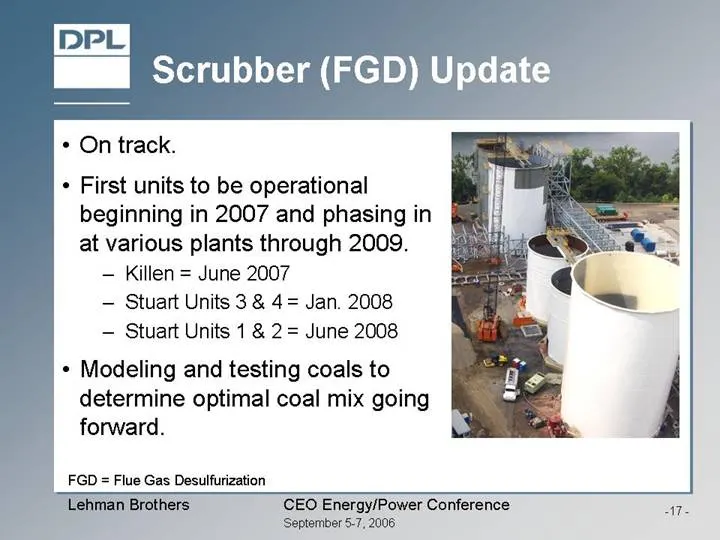
On track. First units to be operational beginning in 2007 and phasing in at various plants through 2009. Killen = June 2007 Stuart Units 3 & 4 = Jan. 2008 Stuart Units 1 & 2 = June 2008 Modeling and testing coals to determine optimal coal mix going forward. Scrubber (FGD) Update FGD = Flue Gas Desul
Slide 18: Peaker Update
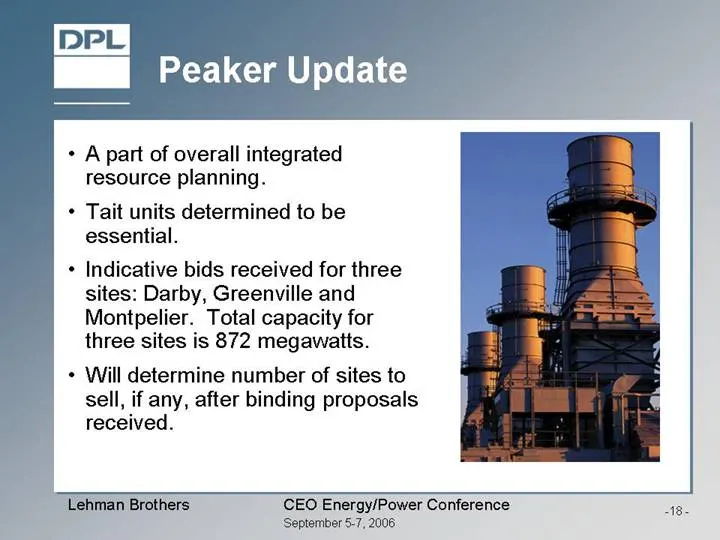
A part of overall integrated resource planning. Tait units determined to be essential. Indicative bids received for three sites: Darby, Greenville and Montpelier. Total capacity for three sites is 872 megawatts. Will determine number of sites to sell, if any, after binding proposals received. Peaker
Slide 19: Other Issues
Litigation with Former Executives Trial date scheduled for April 2007. Seams Elimination Charge Adjustment (SECA) Entered into a number of bilateral settlement agreements. Several claims outstanding. Appropriate reserves have been established. State of Ohio Tax Assessment Tax years 2002 – 2004 Filed
Slide 20: Recent Notable Events
Recent Notable Events Regulatory Gained approval in July from Public Utilities Commission of Ohio to recover $8.6 million in storm restoration costs. Will recover over a two year period beginning August 2006. Debt Ratings Upgrade Moody’s upgraded DPL to investment grade. Standard and Poor’s upgraded
Slide 21: Going Forward
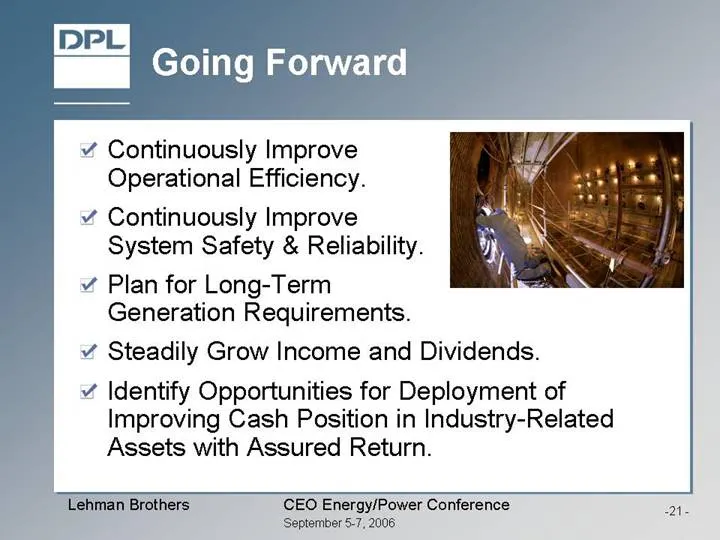
Going Forward Continuously Improve Operational Efficiency. Continuously Improve System Safety & Reliability. Plan for Long-Term Generation Requirements. Steadily Grow Income and Dividends. Identify Opportunities for Deployment of Improving Cash Position in Industry-Related Assets with Assured Return
Slide 22: Appendix
Appendix CEO Energy/Power Conference “September 5-7, 2006
Slide 23: Quarterly Variance Summary Q2 '06 to Q2 '05
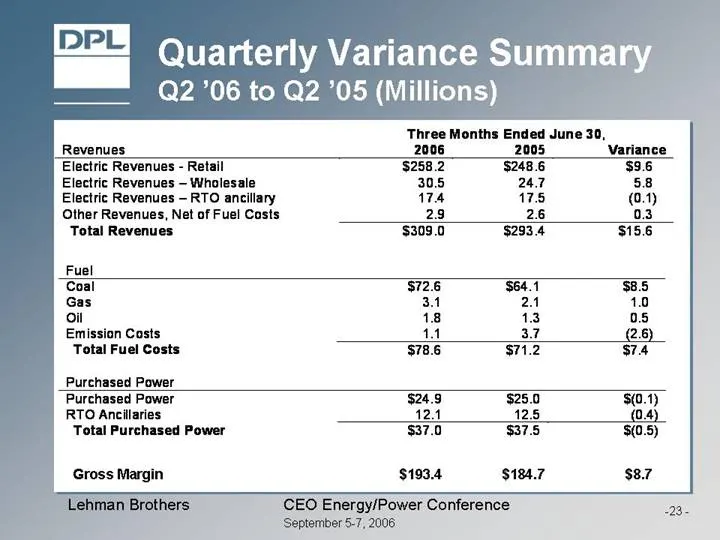
Quarterly Variance Summary Q2 ’06 to Q2 ’05 (Millions) Gross Margin $193.4 $184.7 $8.7 Three Months Ended June 30 , Revenues 2006 2005 Variance Electric R evenues - Retail $258.2 $248.6 $ 9.6 Electric R evenues – Wholesale 30.5 24.7 5.8 Electric Revenues – RTO ancillary 17.4 17. 5 (0.1) Other Revenu
Slide 24: Quarterly Variance Summary: O&M, Interest
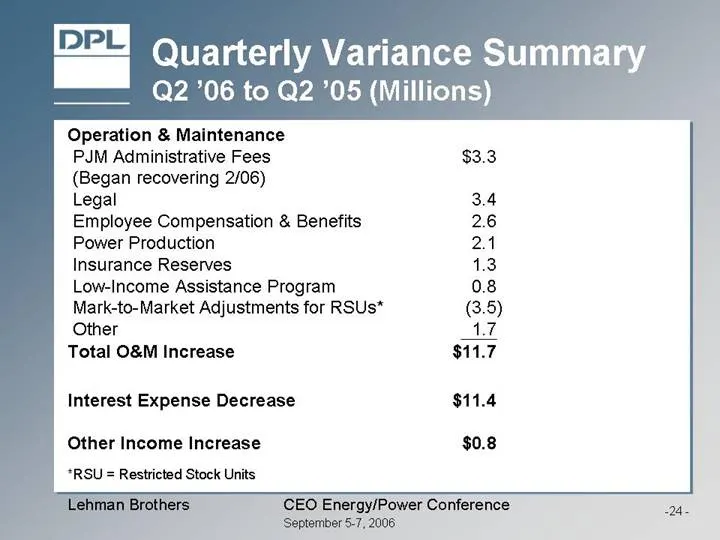
Operation & Maintenance PJM Administrative Fees $3.3 (Began recovering 2/06) Legal 3.4 Employee Compensation & Benefits 2.6 Power Production 2.1 Insurance Reserves 1.3 Low-Income Assistance Program 0.8 Mark-to-Market Adjustments for RSUs* (3.5) Other 1.7 Total O&M Increase $11.7 Interest Expense Dec
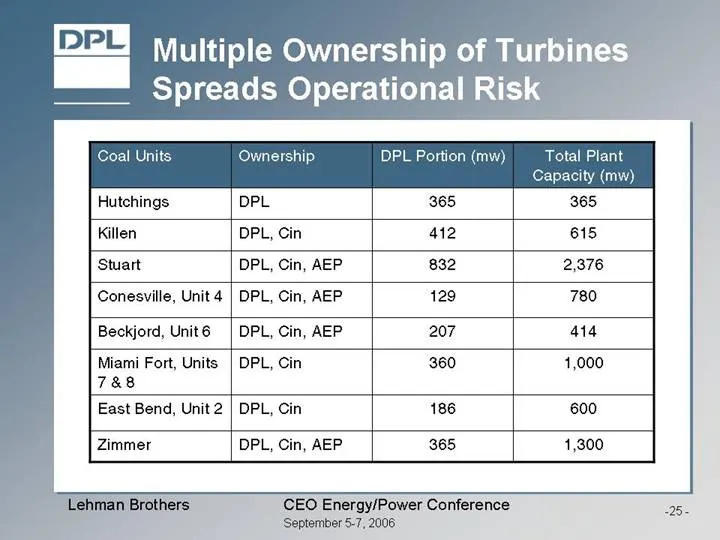
Slide 25: Multiple Ownership of Turbines Spreads Operational Risk
Multiple Ownership of Turbines Spreads Operational Risk 1,300 365 DPL, Cin, AEP Zimmer 600 186 DPL, Cin East Bend, Unit 2 1,000 360 DPL, Cin Miami Fort, Units 7 & 8 414 207 DPL, Cin, AEP Beckjord, Unit 6 780 129 DPL, Cin, AEP Conesville, Unit 4 2,376 832 DPL, Cin, AEP Stuart 615 412 DPL, Cin Killen
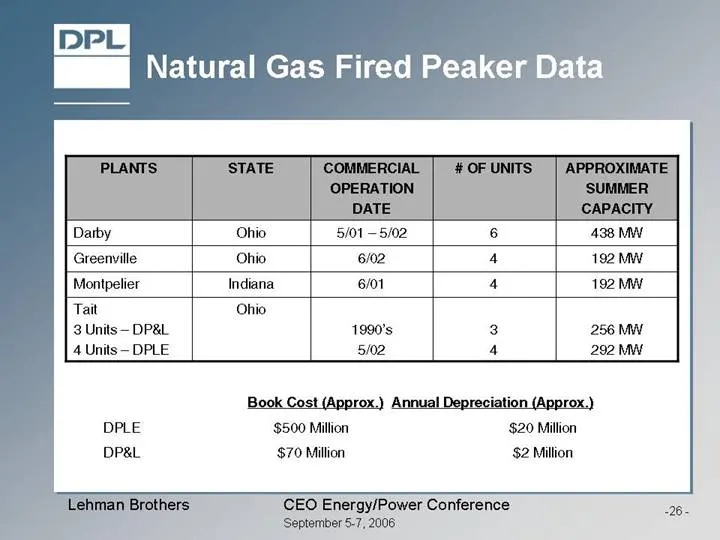
Slide 26: Natural Gas Fired Peaker Data
Natural Gas Fired Peaker Data 256 MW 292 MW 3 4 1990’s 5/02 Ohio Tait 3 Units – DP&L 4 Units – DPLE 192 MW 4 6/01 Indiana Montpelier 192 MW 4 6/02 Ohio Greenville 438 MW 6 5/01 – 5/02 Ohio Darby APPROXIMATE SUMMER CAPACITY # OF UNITS COMMERCIAL OPERATION DATE STATE PLANTS Book Cost (Approx.)Annual D
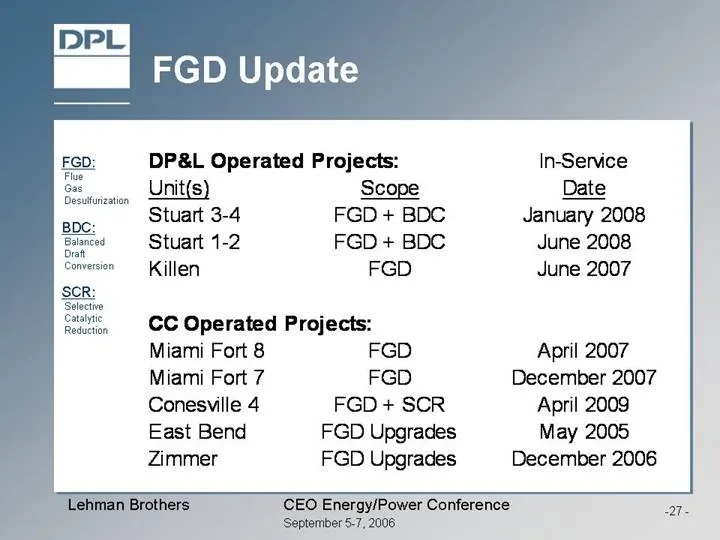
Slide 27: FGD Update
FGD Update FGD: Flue Gas Desulfurization BDC: Balanced Draft Conversion SCR: Selective Catalytic Reduction DP&L Operated Projects: In-Service Unit(s) Scope Date Stuart 3-4 FGD + BDC January 2008 Stuart 1-2 FGD + BDC June 2008 Killen FGD June 2007 CC Operated Projects: Miami Fort 8 FGD April 2007 Mia
Slide 28: Lehman Brothers CEO Energy/Power Conference
September 5 – 7, 2006 Lehman Brothers CEO Energy/Power Conference
Source: SEC EDGAR · 8-K filed Sep 7, 2006
More decks from DPL Inc
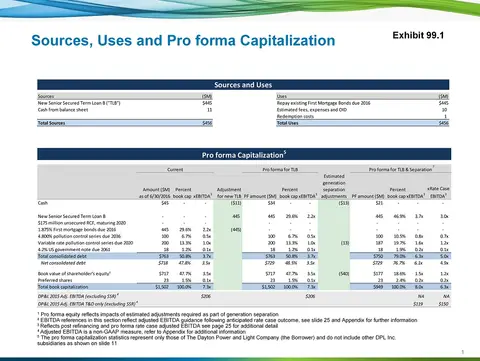 Debt Investor Presentation (August 2016)12 slides · Aug 8, 2016
 Q1 2011 Earnings Presentation28 slides · Apr 29, 2011
 FY2010 Earnings Presentation15 slides · Feb 17, 2011
 Non-Deal Roadshow (December 2010)24 slides · Dec 10, 2010
 Q3 2010 Earnings Presentation18 slides · Oct 29, 2010
 Non-Deal Roadshow (September 2010)24 slides · Sep 14, 2010