Skystar Bio-Pharmaceutical Company
Skystar Bio-Pharmaceutical — Investor Presentation (September 2009)
43 slides from Skystar Bio-Pharmaceutical's investor presentation, Sep 9, 2009
Slide 1: band
Exhibit 99.1 band ve SKYSTAR ped Bio-PHARMACEUTICAL CO.,LTD. ‘SKYSTAR Weibing Lu, Chairman and CEO R. Scott Cramer, Director Bennet P. Tchaikovsky, CFO
Slide 2: Safe Harbor Statement
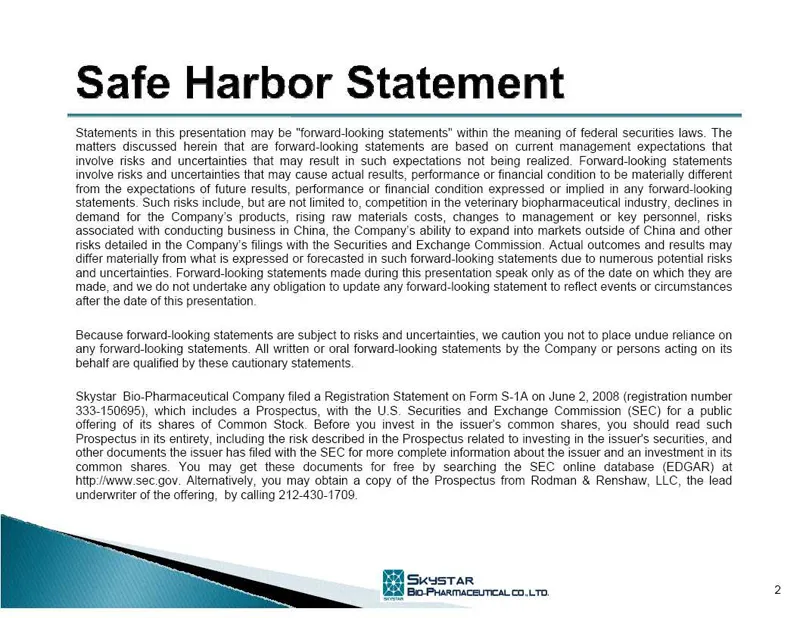
Safe Harbor Statement ‘Statements in this presentation may be “forward-looking statements" within the meaning of federal securities laws. The matters discussed herein that are forward-looking statements are based on current management expectations that involve risks and uncertainties that may result
Slide 3: Company Overview
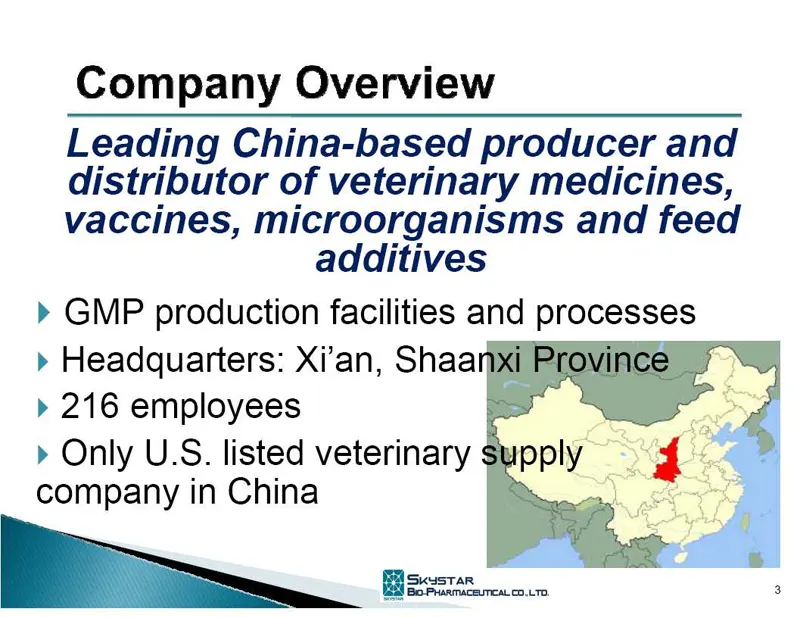
Company Overview Leading China-based producer and distributor of veterinary medicines, vaccines, microorganisms and feed additives » GMP production facilities and processes » Headquarters: Xi'an, Shaa i » 216 employees >» Only U.S. listed veterinary company in China — a are Seo reuoun 3
Slide 4: 2009 Recent Events
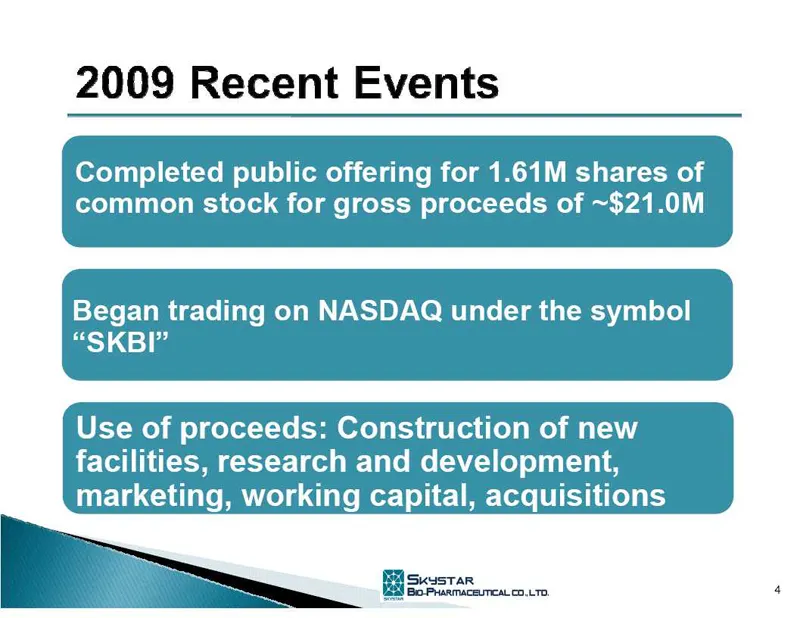
2009 Recent Events Completed public offering for 1.61M shares of common stock for gross proceeds of ~$21.0M Began trading on NASDAQ under the symbol “SKBI” Use of proceeds: Construction of new facilities, research and development, marketing, working capital, acquisitions
Slide 5: 2009 Recent Events
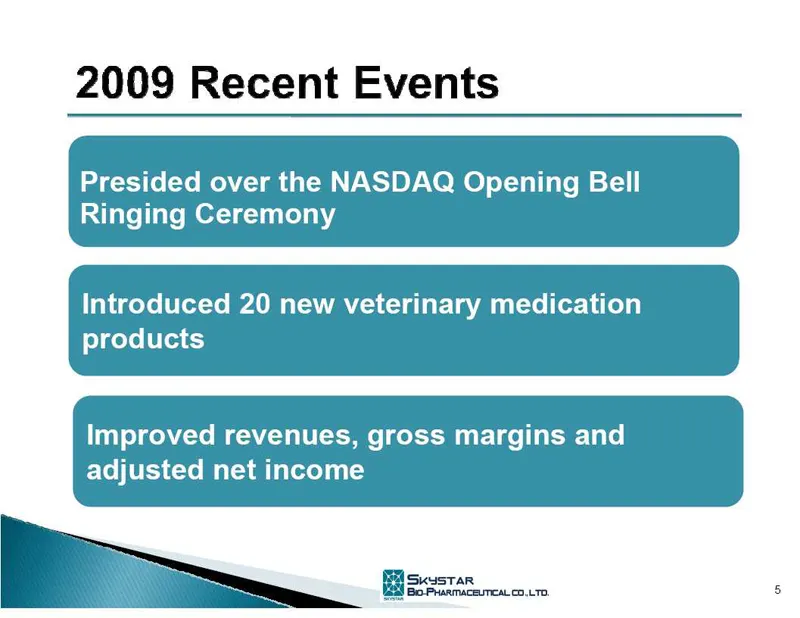
2009 Recent Events Presided over the NASDAQ Opening Bell Ringing Ceremony Introduced 20 new veterinary medication products Improved revenues, gross margins and adjusted net income
Slide 6: Skystar Snapshot
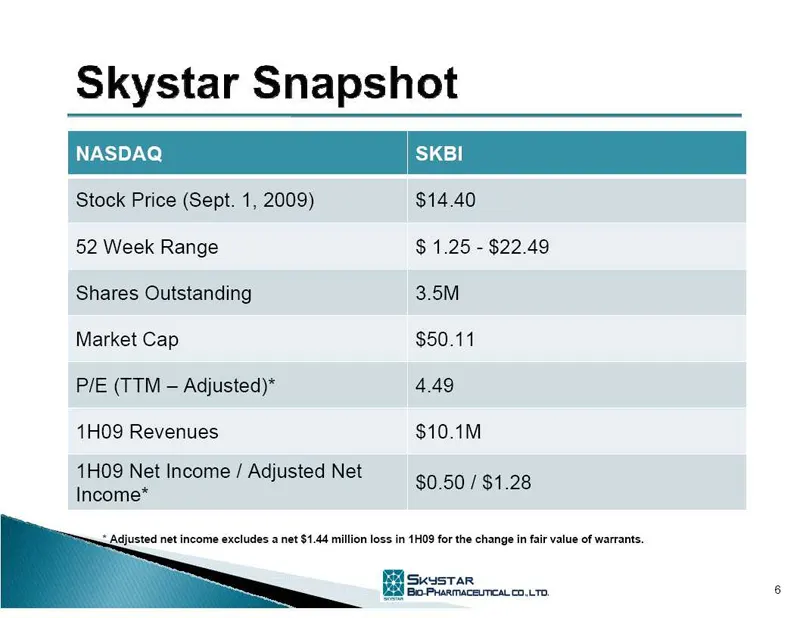
Skystar Snapshot pase Stock Price (Sept. 1, 2009) $14.40 52 Week Range $ 1.25 - $22.49 Shares Outstanding 3.5M Market Cap $50.11 P/E (TTM — Adjusted)* 4.49 1HO9 Revenues $10.1M on Income / Adjusted Net $0.50 / $1.28 = Adjusted net income excludes a net $1.44 million loss in 1H08 for the change
Slide 7: Why Invest in Skystar
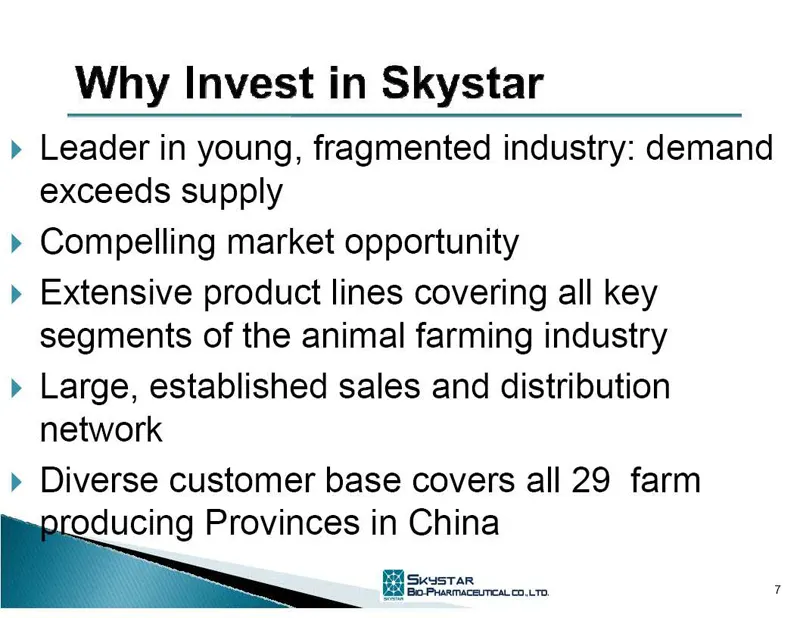
Why Invest in Skystar » Leader in young, fragmented industry: demand exceeds supply » Compelling market opportunity » Extensive product lines covering all key segments of the animal farming industry » Large, established sales and distribution network » Diverse customer base covers all 29 farm oducin
Slide 8: Why Invest in Skystar
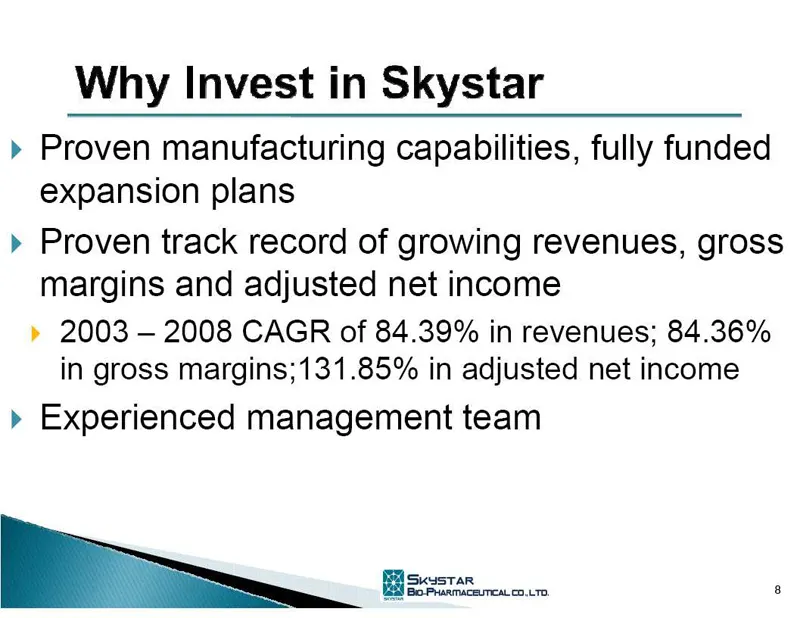
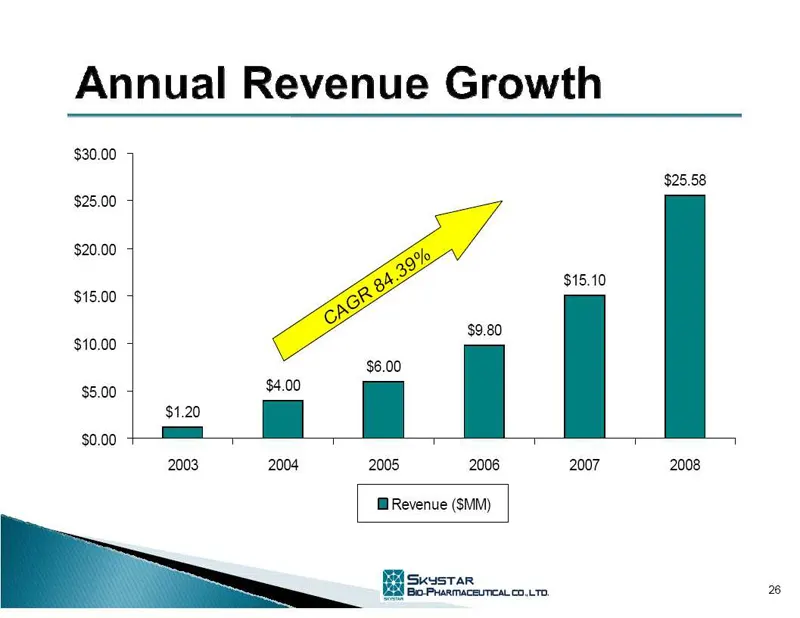
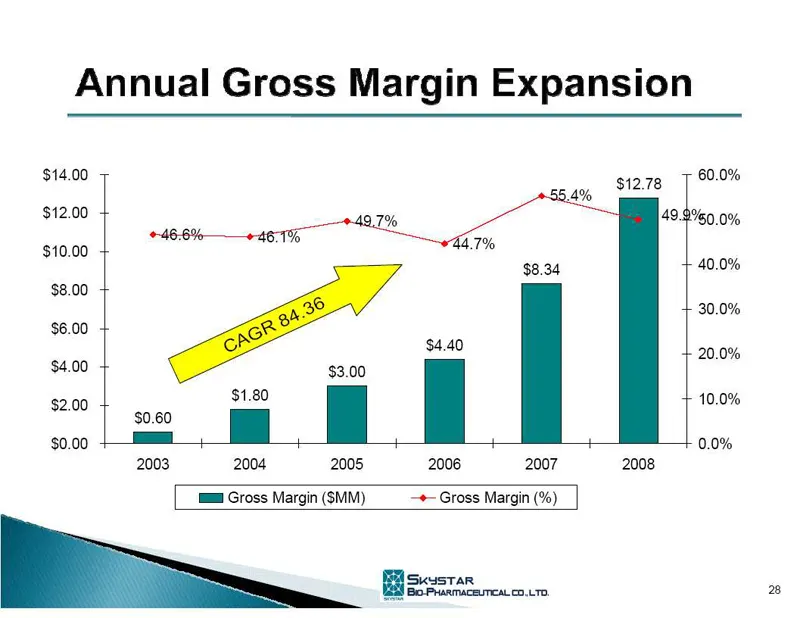
Why Invest in Skystar » Proven manufacturing capabilities, fully funded expansion plans » Proven track record of growing revenues, gross margins and adjusted net income » 2003 — 2008 CAGR of 84.39% in revenues; 84.36% in gross margins;131.85% in adjusted net income » Experienced management team
Slide 9: Growing Industry
Growing Industry Consolidation of family owned/operated farms and improved technology are driving demand and growth in the veterinary industry
Slide 10: Growing Industry
Growing Industry » China is the world’s largest producer of poultry and livestock » Government supports rapid development of modernization » Disease prevention, vaccines and veterinary medicine was a $7B industry in 2005 and has been growing at 15% a year since 2002 *USDA — Economic Research Service
Slide 11: Growing Industry
Growing Industry >» GMP certification required by PRC government for all veterinary pharmaceutical and vaccine manufacturers » Higher living standards spur demand for animal-based food sources » Industry evolving to large-scale meat processing plants » Growing pet ownership = esc: ;
Slide 12: Products Lines Address Major Industry Segments
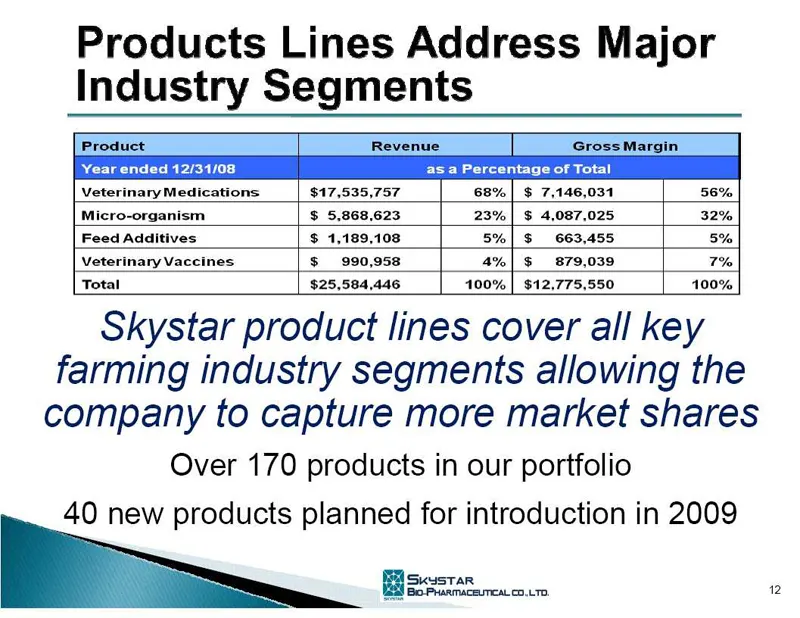
Products Lines Address Major Industry Segments [ Product i “Revenue | [ “Gross Margin Year ended 12/31/08 Veterinary Medications $17,535,757 68% | $ 7,146,031 56% Micro-organism $ 5,868,623 23% | $ 4,087,025 32% Feed Additives $ 1,189,108 5%| $ 663,455 5% Veterinary Vaccines. $990,958 4%| $879,039 T
Slide 13: Veterinary Medications
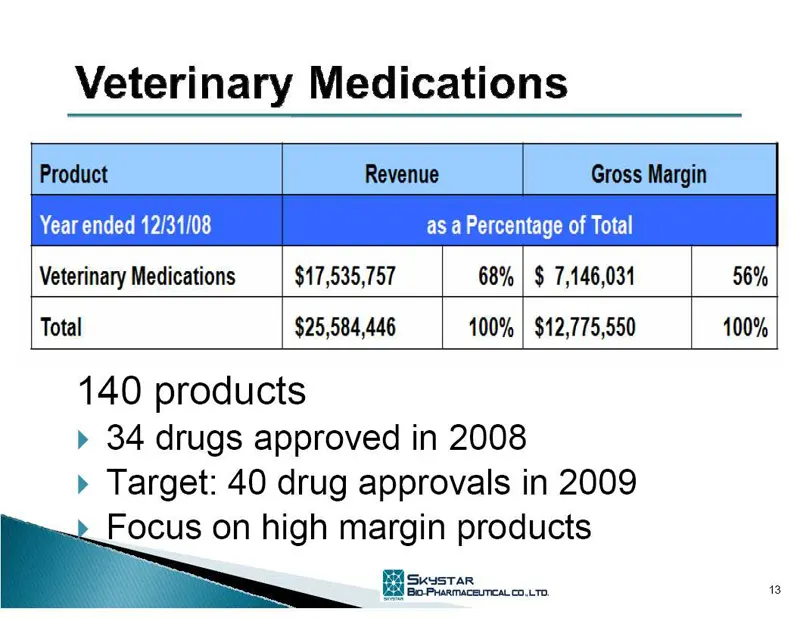
Veterinary Medications Product Revenue Gross Margin Year ended 12/31/08 as a Percentage of Total Veterinary Medications $17,535,757 68% | $ 7,146,034 Total $25,584,446 100% | $12,775,550 100% 140 products » 34 drugs approved in 2008 » Target: 40 drug approvals in 2009 Focus on high margin products F
Slide 14: Micro-organism
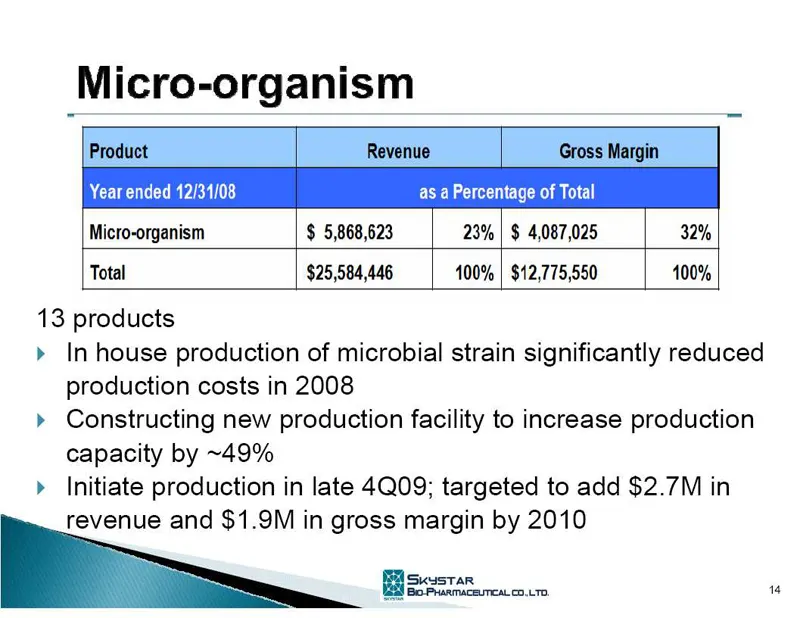
Micro-organism Year ended 12/34/08 as a Percentage of Total Micro-organism $ 5,868,623 23% | $ 4,087,025 32% Total $25,584,446 100% | $12,775,550 100% 13 products » In house production of microbial strain significantly reduced production costs in 2008 » Constructing new production facility to increa
Slide 15: Feed Additives
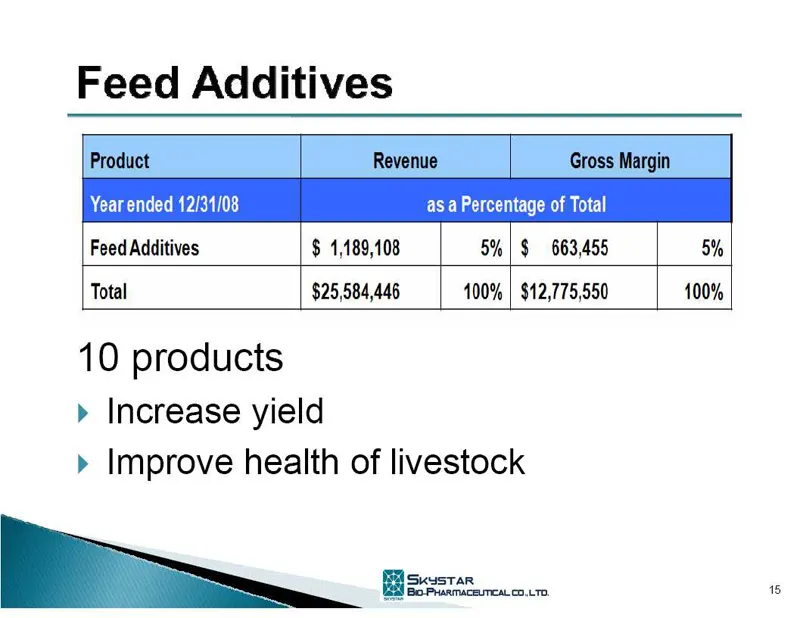
Feed Additives Year ended 12/31/08 as a Percentage of Total Feed Additives $ 1,189,108 5% | $ 663,455 5% Total $25,584,446 100% | $12,775,550 100% 10 products » Increase yield » Improve health of livestock 6
Slide 16: Veterinary Vaccines
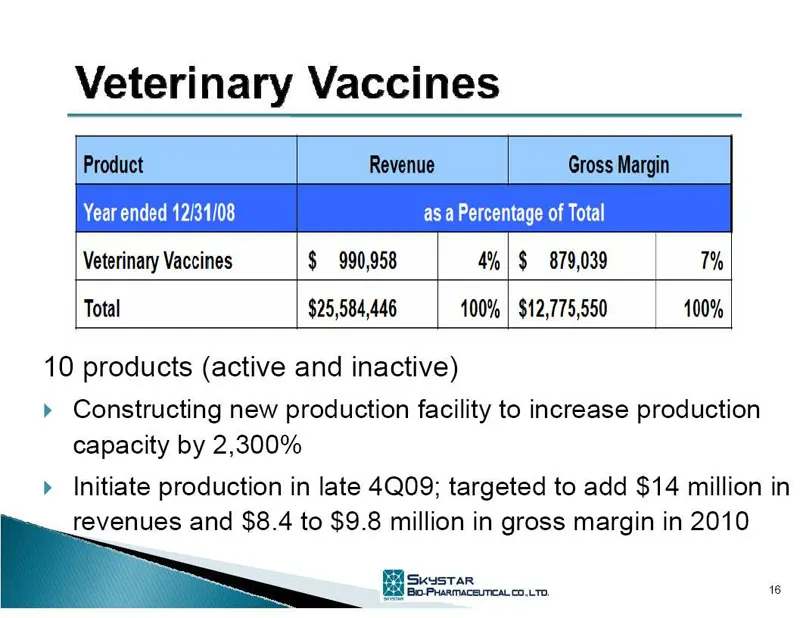
Veterinary Vaccines Year ended 12/34/08 as a Percentage of Total Veterinary Vaccines $ 990,958 4%|$ 879,039 TM% Total $25,584,446 100% | $12,775,550 100% 10 products (active and inactive) » Constructing new production facility to increase production capacity by 2,300% » Initiate production in late 4
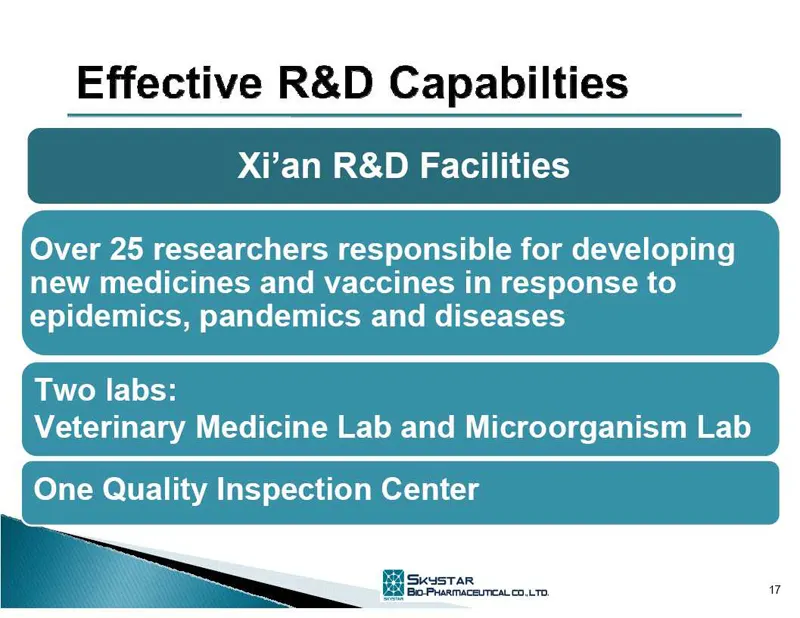
Slide 17: Effective R&D Capabilties
Effective R&D Capabilties Xi’an R&D Facilities Over 25 researchers responsible for developing new medicines and vaccines in response to epidemics, pandemics and diseases Two labs: Veterinary Medicine Lab and Microorganism Lab One Quality Inspection Center a
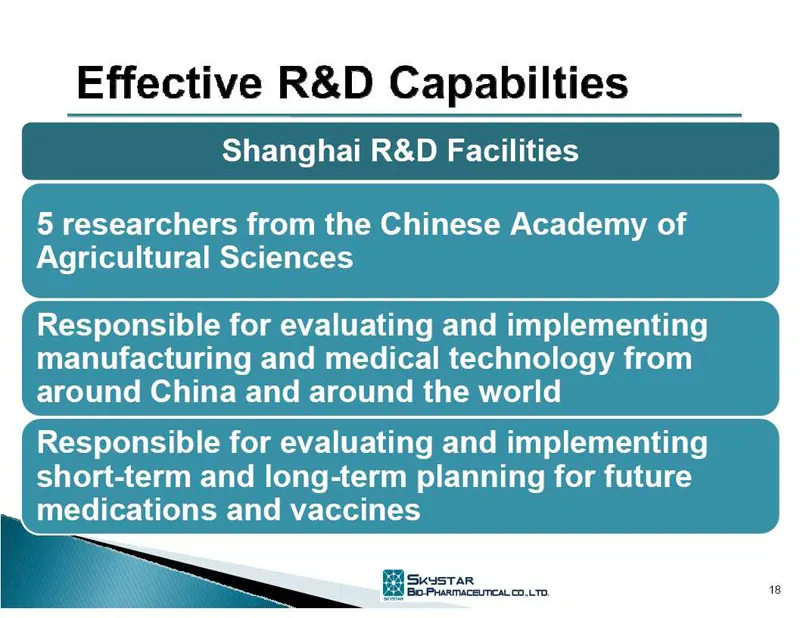
Slide 18: Effective R&D Capabilties
Effective R&D Capabilties Shanghai R&D Facilities 5 researchers from the Chinese Academy of Agricultural Sciences Responsible for evaluating and implementing manufacturing and medical technology from around China and around the world Responsible for evaluating and implementing short-term and long-te
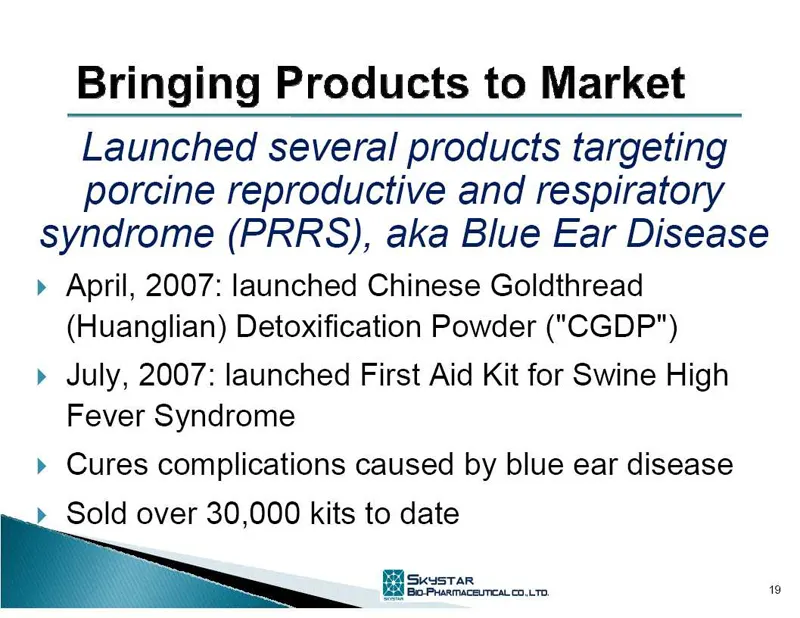
Slide 19: Bringing Products to Market
Bringing Products to Market Launched several products targeting porcine reproductive and respiratory syndrome (PRRS), aka Blue Ear Disease > April, 2007: launched Chinese Goldthread (Huanglian) Detoxification Powder ("CGDP") » July, 2007: launched First Aid Kit for Swine High Fever Syndrome » Cures
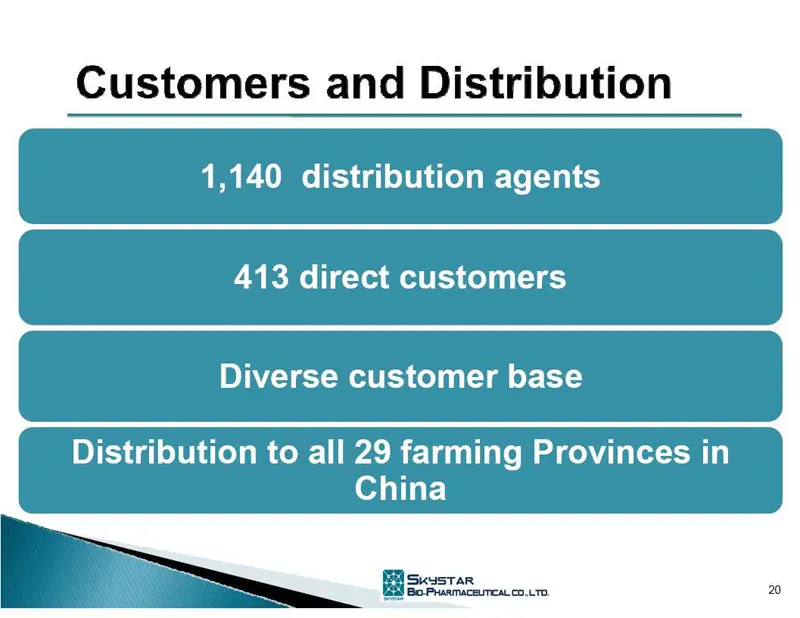
Slide 20: Customers and Distribution
Customers and Distribution 1,140 distribution agents 413 direct customers Diverse customer base Distribution to all 29 farming Provinces in China
Slide 21: Skystar's Competitive Advantages
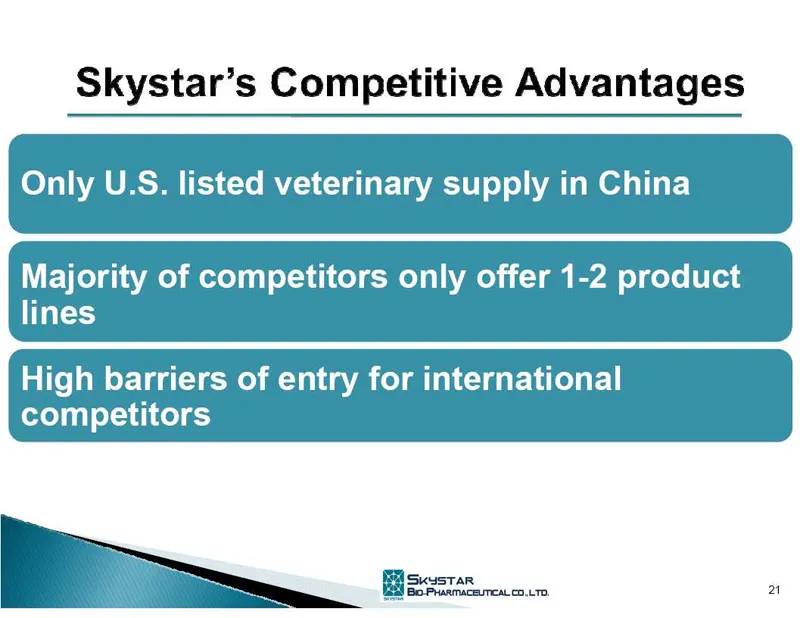
Skystar’s Competitive Advantages Only U.S. listed veterinary supply in China Majority of competitors only offer 1-2 product lines High barriers of entry for international competitors
Slide 22: Skystar's Competitive Advantages
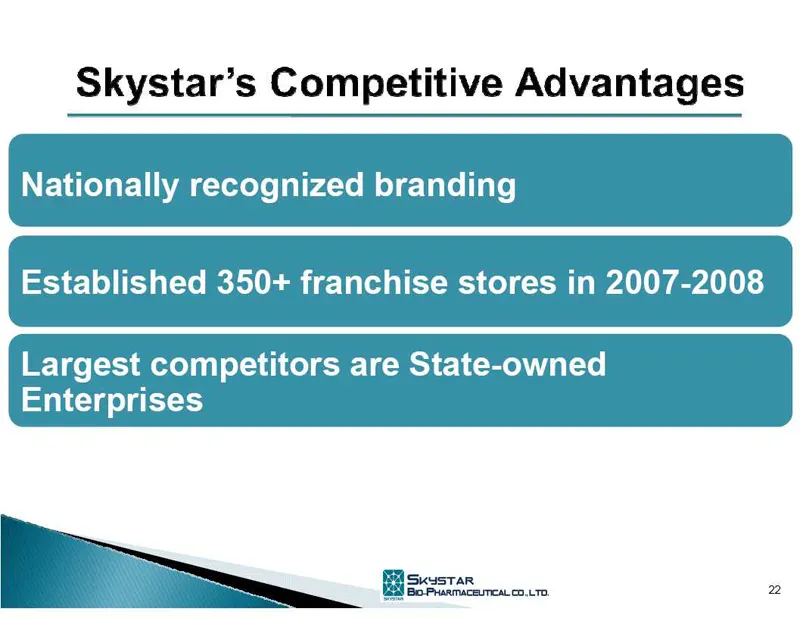
Skystar’s Competitive Advantages Nationally recognized branding Established 350+ franchise stores in 2007-2008 Largest competitors are State-owned Enterprises = Betton 2
Slide 23: Growth Strategy
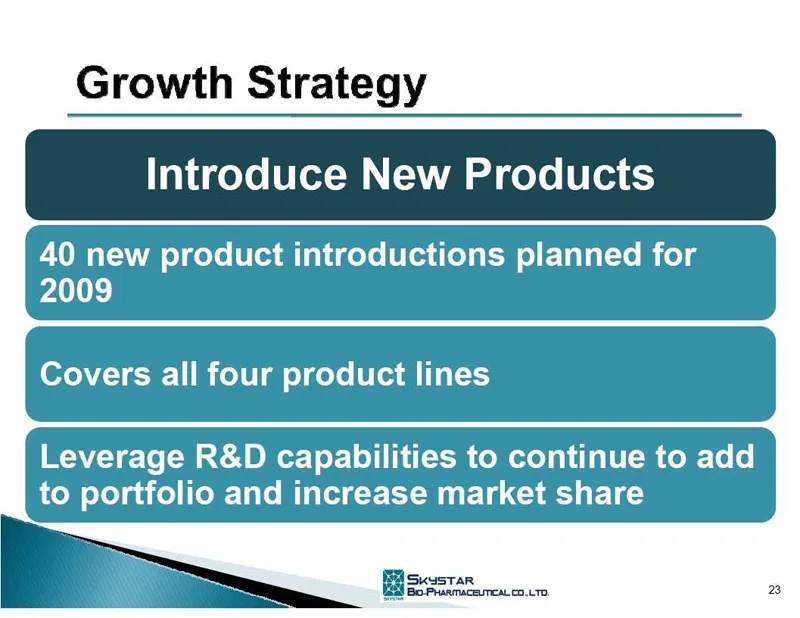
Growth Strategy
Slide 24: Growth Strategy
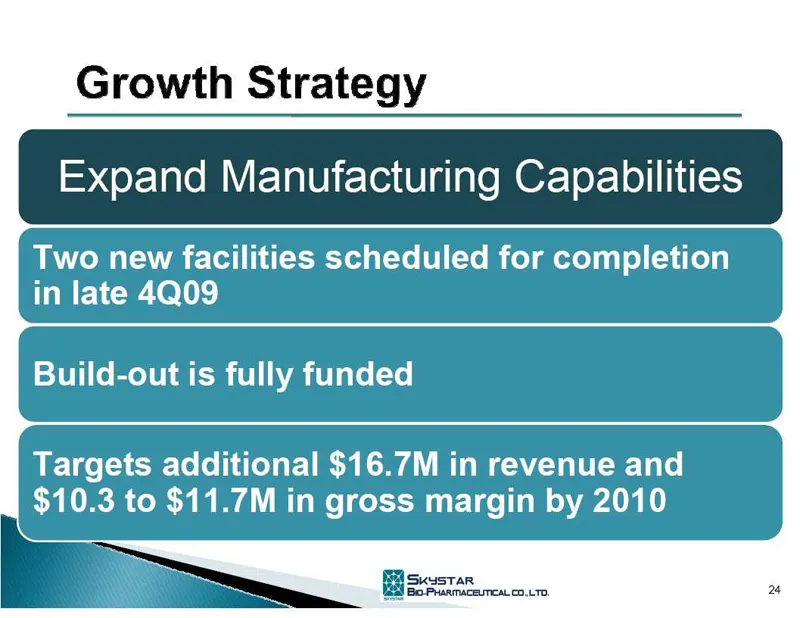
Growth Strategy Targets additional $16.7M in revenue and $10.3 to $11.7M in gross margin by 2010
Slide 25: Growth Strategy
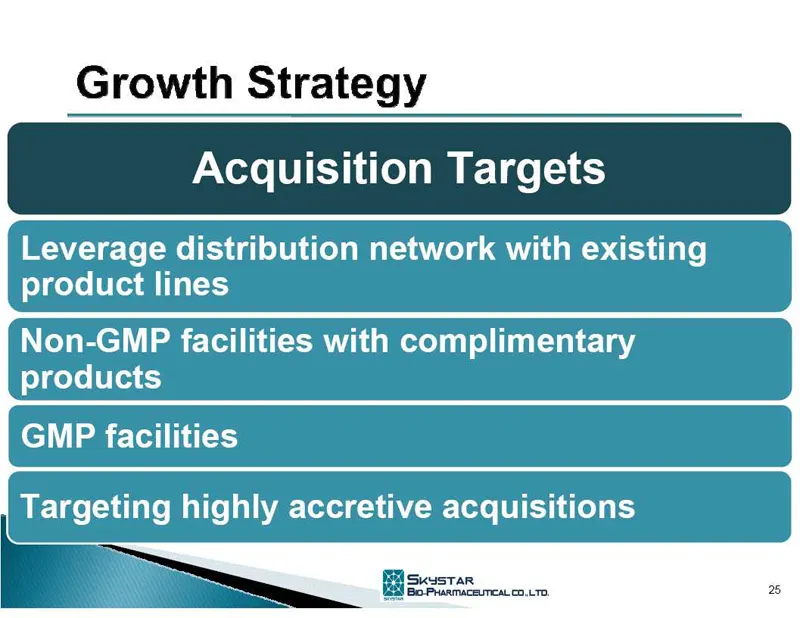
Growth Strategy Non-GMP facilities with complimentary products
Slide 26: Annual Revenue Growth
Annual Revenue Growth $30.00 $25.00 $20.00 $15.00 $10.00 $5.00 $0.00 + $25.58 $15.10 $9.80 $6.00 $4.00 = o Ef = . 2003 2004 2005 2006 2007 2008 Revenue (SMM) SkysTAR
Slide 27: 1H Revenue
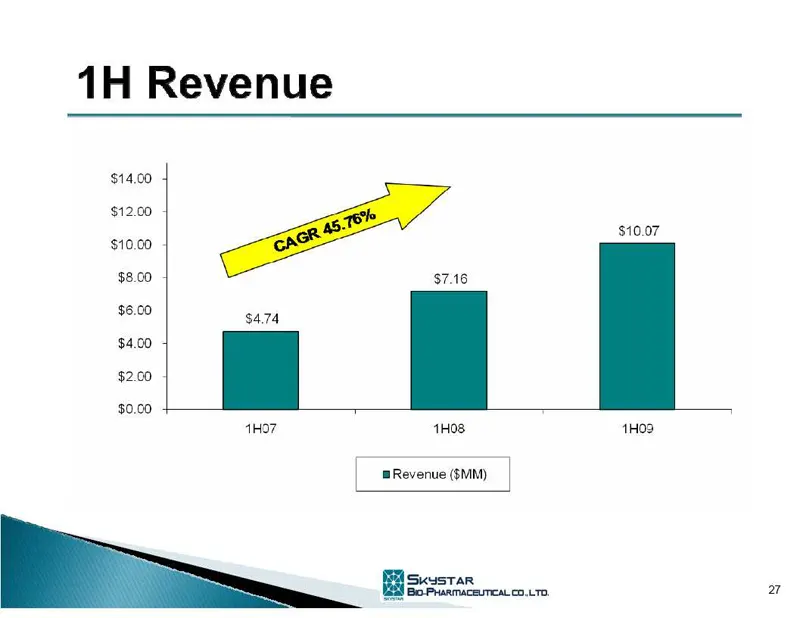
1H Revenue $14.00 $12.00 $10.00 $10.07 $8.00 $7.16 $6.09 $474 $4.00, $2.00 $0.00 + 4HO7 4HOS- 4HO9 Revenue ($MM) SkusTaR Bo PramaceureaL.c0.L70.
Slide 28: Annual Gross Margin Expansion
Annual Gross Margin Expansion $14.00 $12.00 $10.00 $8.00 $6.00 $4.00 $2.00 $0.00 + 2003 2004 2005 2006 2007 2008 Tim Gross Margin (SMM) __ ~*~ Gross Margin (%) SkusTaR WES) Bo Prasmaceurea.co.L10.
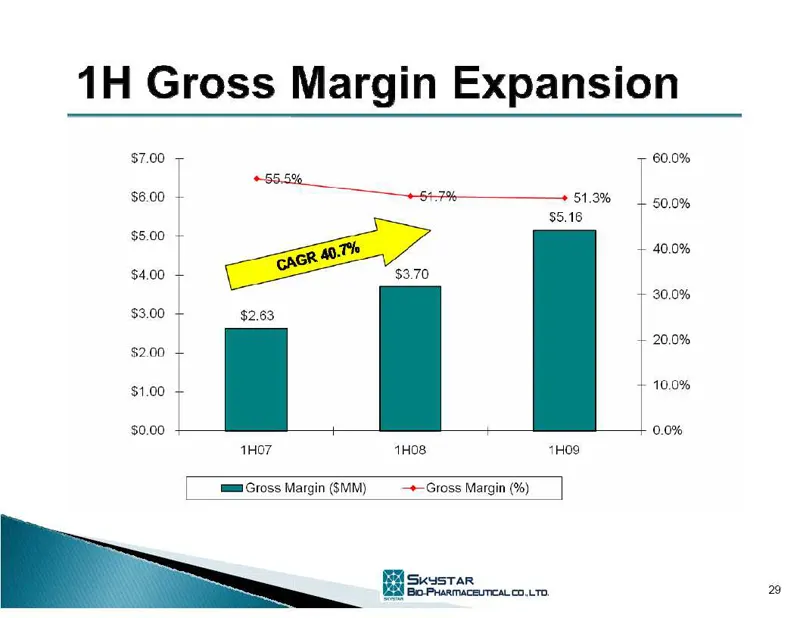
Slide 29: 1H Gross Margin Expansion
1H Gross Margin Expansion $7.00 > a a $8.00 BF + 51.3% $5.16 $6.00 $4.00 + a. 70 $3.00 + $2.63 s200 + $1.00 + 30,00 1HO7 HOB HOS = Gross Margin (SMM) + Gross Margin (%) SkusTaR Af Bo Prasmaceurcaco.L70.
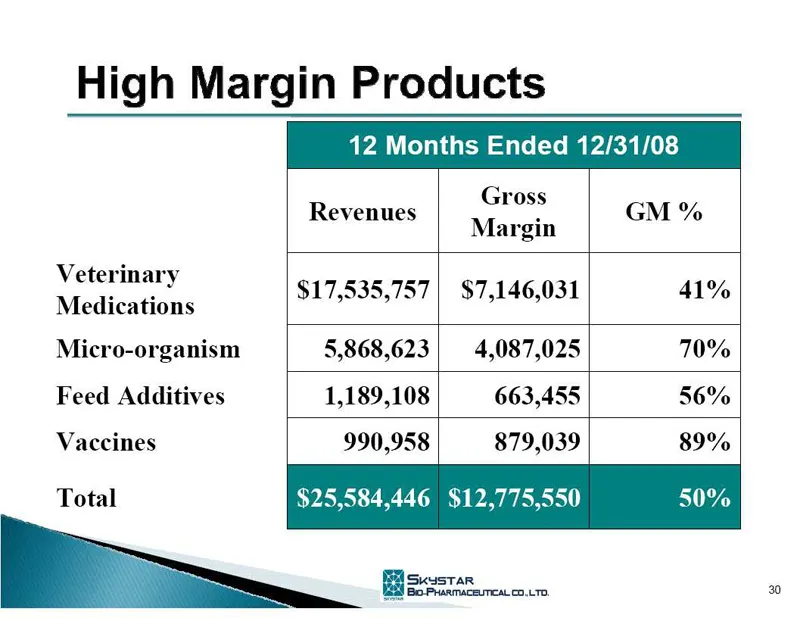
Slide 30: High Margin Products
High Margin Products Revenues Mavaia GM % Leena $17,535,757| $7,146,031 41% Micro-organism 5,868,623 | 4,087,025 70% Feed Additives 1,189,108] 663,455 56% Vaccines 990,958; 879,039 89% Total 25,584,446 $12,775,550
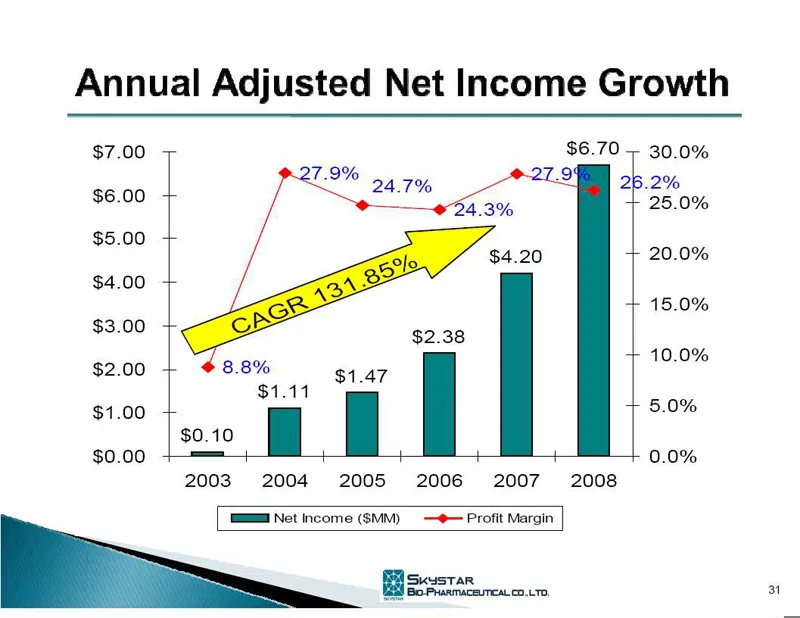
Slide 31: Annual Adjusted Net Income Growth
Annual Adjusted Net Income Growth $7.00 7 $6.70 + 30.0% 2% $6.00 25.0% $5.00 20.0% $4.00 15.0% $3.00 $2.00 es $1.00 5.0% $0.00 0.0% 2003 2004 2005 2006 2007 2008 EEN Net Income (SMM) _—@— Profit Margin SkusTaR WES) Bo Pranmaceurea.co.L10.
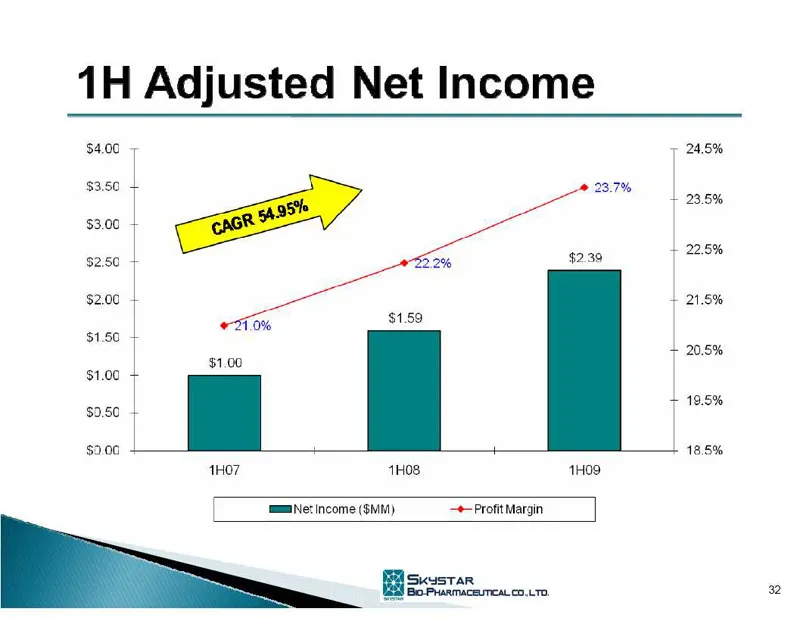
Slide 32: 1H Adjusted Net Income
1H Adjusted Net Income $4.00 7 24.5% $3.50 23.7% + 235% $3.00 + 225% $2.50 2.2% $239 $2.00 + 21.5% en $1.59 $1.50 + 20.5% $1.00 $1.00 + 19.5% $0.50 $9.00 185% 1HO7 1H08, 4HO9 EBNet income (SMI) + Profit Margin SkysTaR Bo PrarmaceurecaL co.L70.
Slide 33: Select Balance Sheet Data
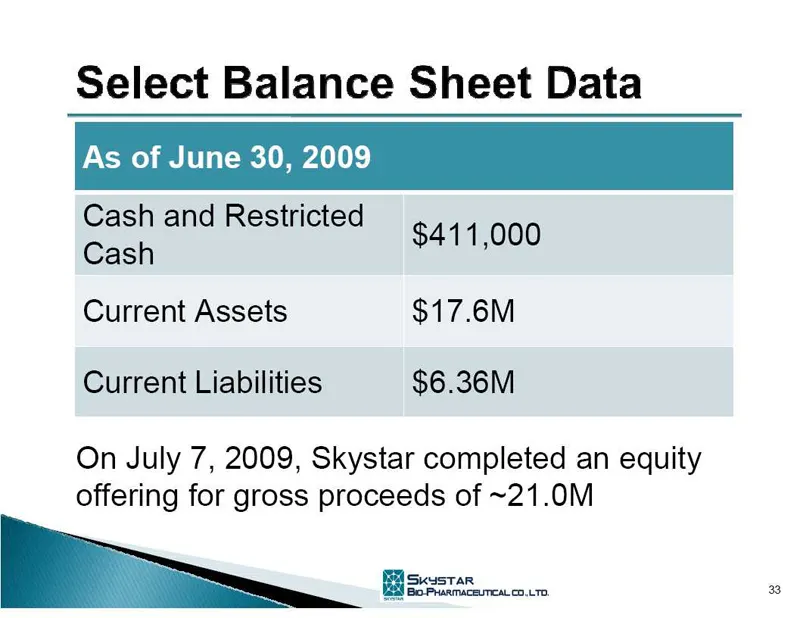
Select Balance Sheet Data As of June 30, 2009 Cash and Restricted Cash $411,000 Current Assets $17.6M Current Liabilities $6.36M On July 7, 2009, Skystar completed an equity offering for gross proceeds of ~21.0M SkusTaR WES) Bo Pranmaceurca.co.Lr,
Slide 34: Weibing Lu - Chairman and CEO
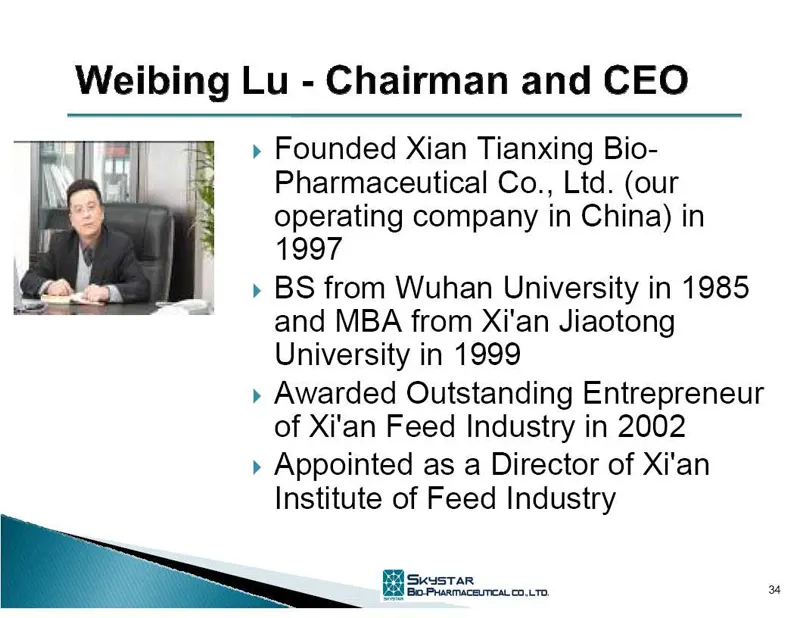
Weibing Lu - Chairman and CEO » Founded Xian Tianxing Bio- Pharmaceutical Co., Ltd. (our operating company in China) in 1997 » BS from Wuhan University in 1985 and MBA from Xi'an Jiaotong University in 1999 » Awarded Outstanding Entrepreneur of Xi'an Feed Industry in 2002 » Appointed as a Director o
Slide 35: Wei Wen - Director and Vice General Manager
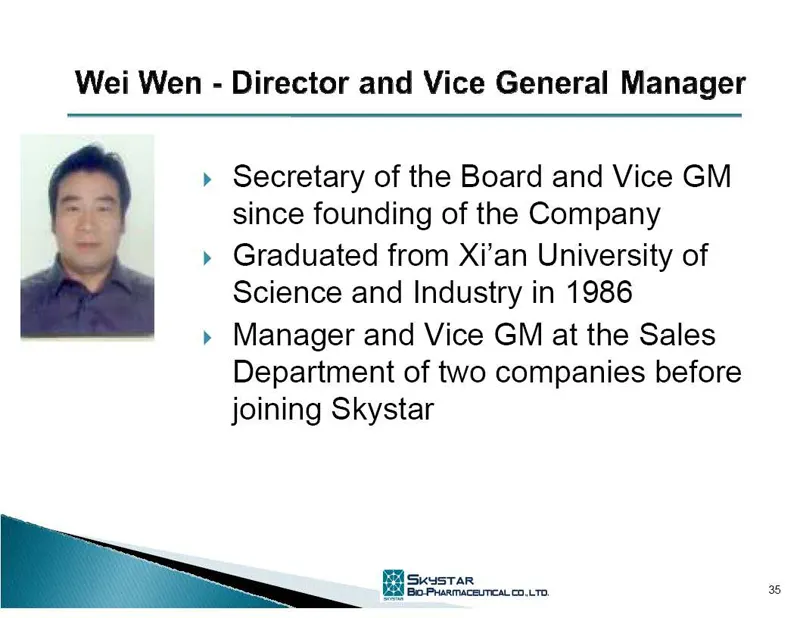
Wei Wen - Director and Vice General Manager » Secretary of the Board and Vice GM since founding of the Company » Graduated from Xi’an University of Science and Industry in 1986 » Manager and Vice GM at the Sales Department of two companies before joining Skystar
Slide 36: Bennet P. Tchaikovsky, CPA, Esq. - CFO
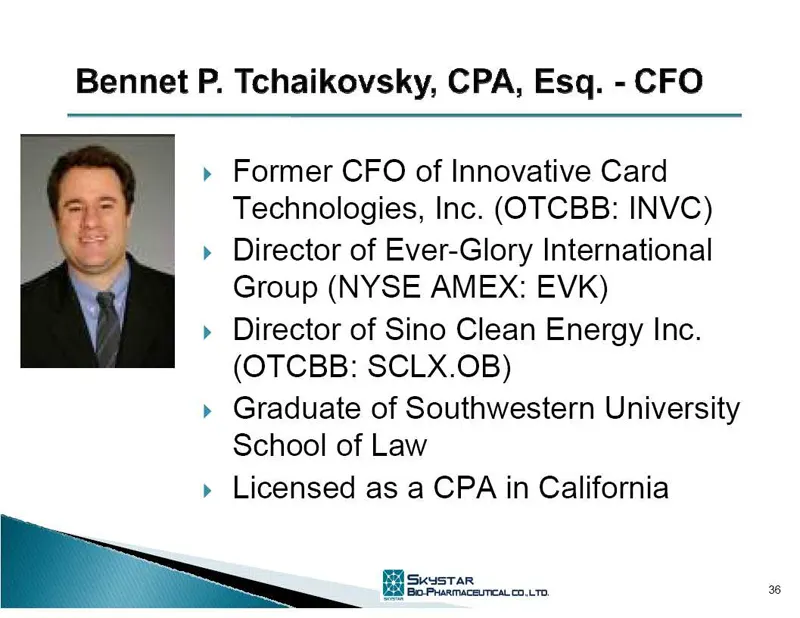
Bennet P. Tchaikovsky, CPA, Esq. - CFO » Former CFO of Innovative Card Technologies, Inc. (OTCBB: INVC) » Director of Ever-Glory International Group (NYSE AMEX: EVk) » Director of Sino Clean Energy Inc. (OTCBB: SCLX.OB) » Graduate of Southwestern University School of Law » Licensed as a CPA in Calif
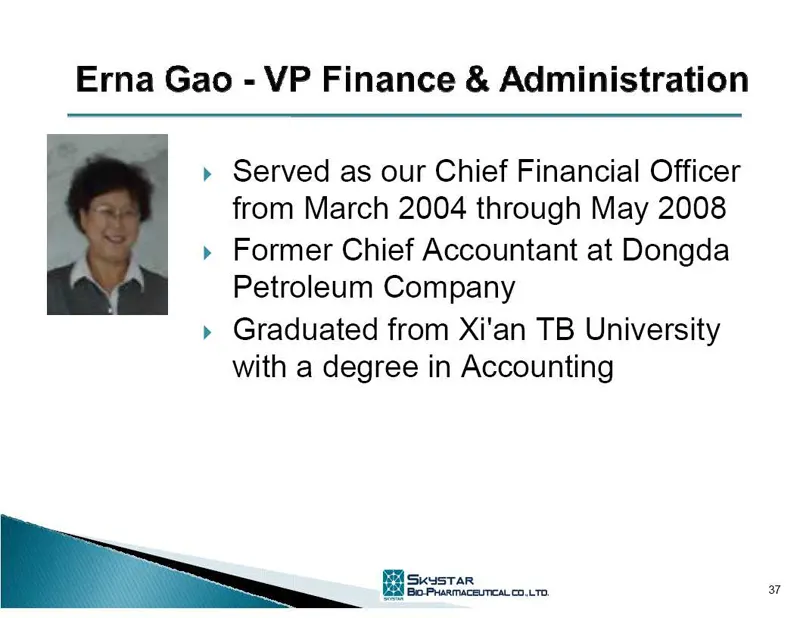
Slide 37: Erna Gao - VP Finance & Administration
Erna Gao - VP Finance & Administration » Served as our Chief Financial Officer from March 2004 through May 2008 » Former Chief Accountant at Dongda Petroleum Company » Graduated from Xi'an TB University with a degree in Accounting 37
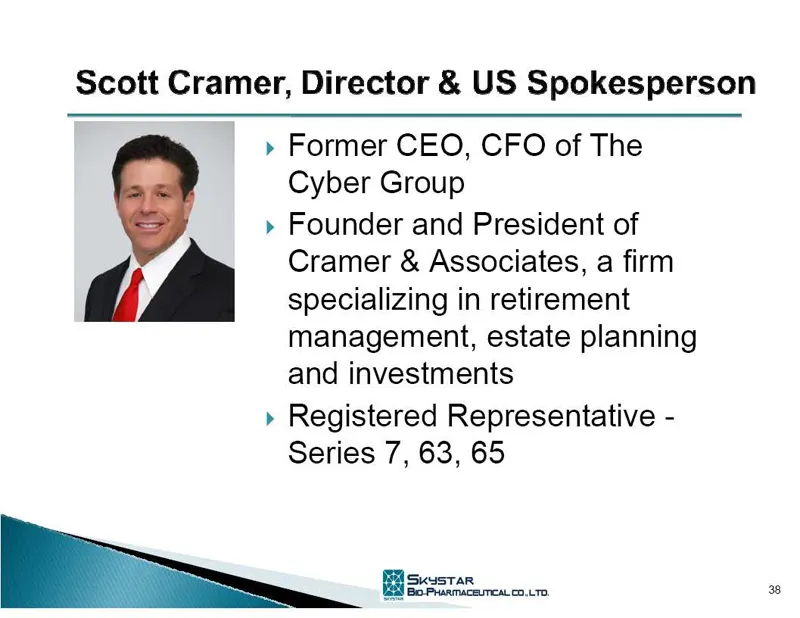
Slide 38: Scott Cramer, Director & US Spokesperson
Scott Cramer, Director & US Spokesperson » Former CEO, CFO of The Cyber Group » Founder and President of Cramer & Associates, a firm a specializing in retirement management, estate planning and investments » Registered Representative - Series 7, 63, 65
Slide 39: Why Invest in Skystar
Why Invest in Skystar » Leader in young, fragmented industry: demand exceeds supply » Compelling market opportunity » Extensive product lines covering all key segments of the animal farming industry » Large, established sales and distribution network » Diverse customer base covers all 29 farm oducin
Slide 40: Why Invest in Skystar
Why Invest in Skystar » Proven manufacturing capabilities, fully funded expansion plans » Proven track record of growing revenues, gross margins and adjusted net income » 2003 — 2008 CAGR of 84.39% in revenues; 84.36% in gross margins;131.85% in adjusted net income » Experienced management team WES)
Slide 41: Appendix
Www band SKUSTAR XS | Janes BiOo-PHARMACEUTICAL CO.,LTD. ‘SKYSTAR APPENDIX
Slide 42: Why Invest in Skystar
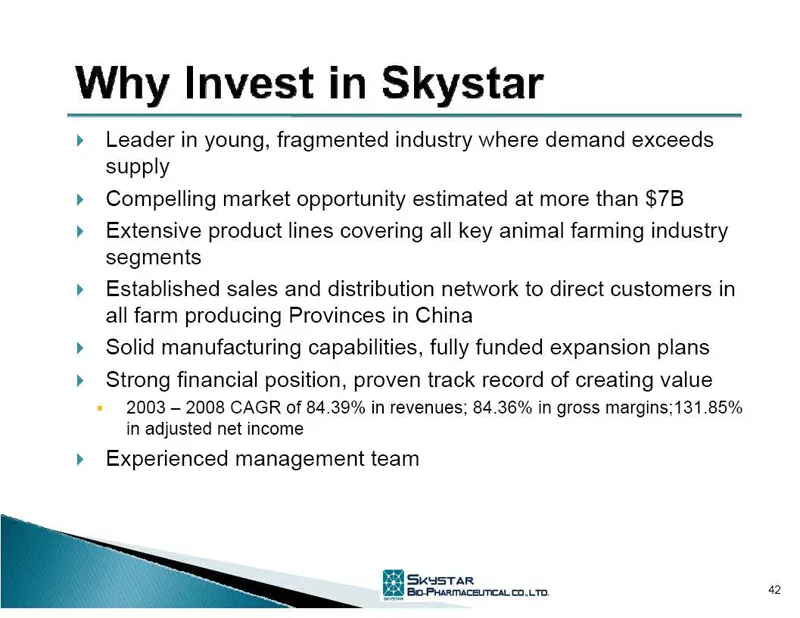
Why Invest in Skystar » Leader in young, fragmented industry where demand exceeds supply Compelling market opportunity estimated at more than $7B Extensive product lines covering all key animal farming industry segments Established sales and distribution network to direct customers in all farm produ
Slide 43: Impact of significant non-recurring items on Net Income
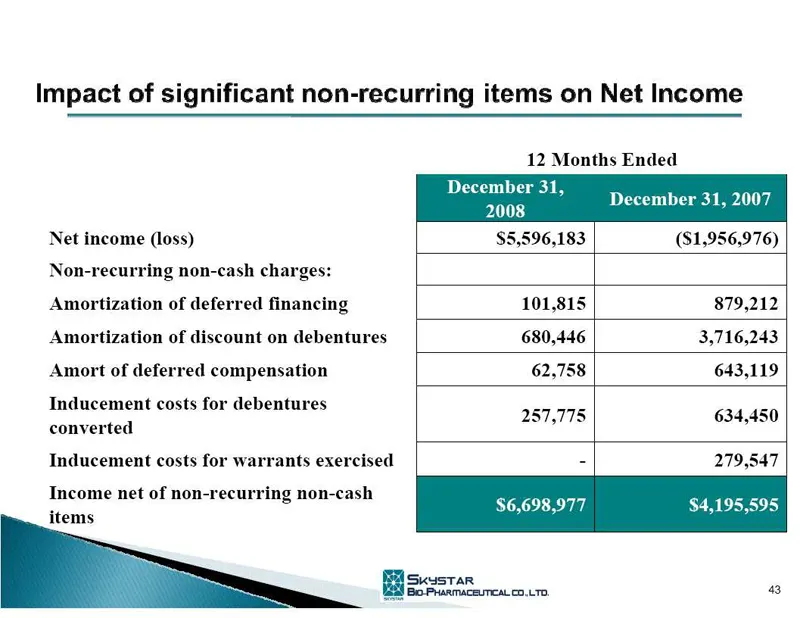
Impact of signi icant non-recurring items on Net Income 12 Months Ended Decembe 2008 Decemb: 1, 2007 Net income (loss) $5,596,183 ($1,956,976) Non-recurring non-cash charges: Amortization of deferred financing 101,815 879,212 Amortization of discount on debentures 680,446 3,716,243 Amort of deferred
Source: SEC EDGAR · 8-K filed Sep 9, 2009
More decks from Skystar Bio-Pharmaceutical Company
 RENN Investor Conference, May 14, 201037 slides · May 17, 2010
 Investor Presentation (March 2010)41 slides · Mar 17, 2010
 Investor Presentation (March 2010)34 slides · Mar 8, 2010
 Investor Presentation (November 2009)40 slides · Nov 20, 2009
 Investor Presentation (October 2009)30 slides · Oct 14, 2009
 Investor Presentation (July 2009)24 slides · Jul 31, 2009