South Jersey Industries — AGA Financial Forum 2015
26 slides from South Jersey Industries's conference presentation, May 15, 2015

Slide 1: AGA Financial Forum South Jersey Industries
AGA FINANCIAL FORUM South Jersey Industries MAY 18, 2015 1
Slide 2: Forward Looking Statements
2 Certain statements contained in this presentation may qualify as “forward-looking statements” within the meaning of Section 27A of the Securities Act of 1933 and Section 21E of the Securities Exchange Act of 1934. All statements other than statements of historical fact included in this Report shou
Slide 3: Strategic Focus
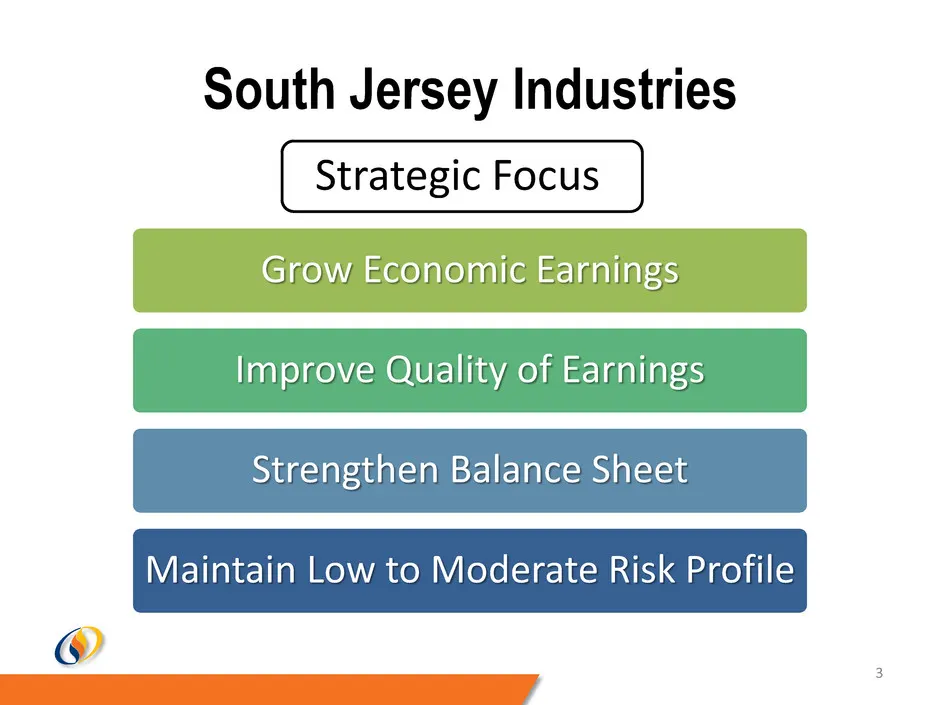
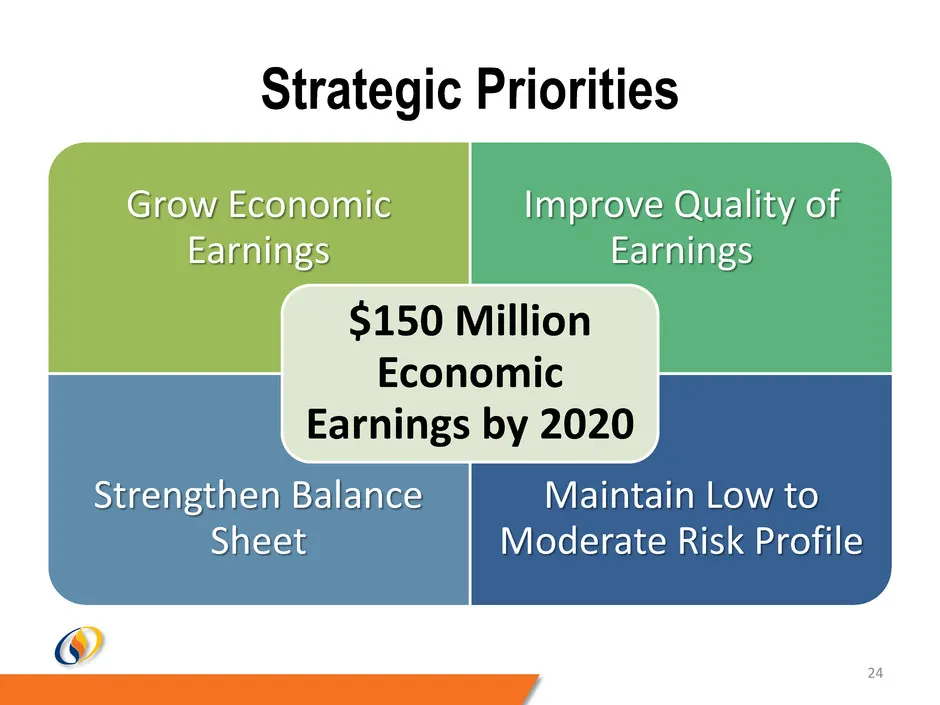
3 South Jersey Industries Grow Economic Earnings Improve Quality of Earnings Strengthen Balance Sheet Maintain Low to Moderate Risk Profile Strategic Focus
Slide 4: Organization of Business
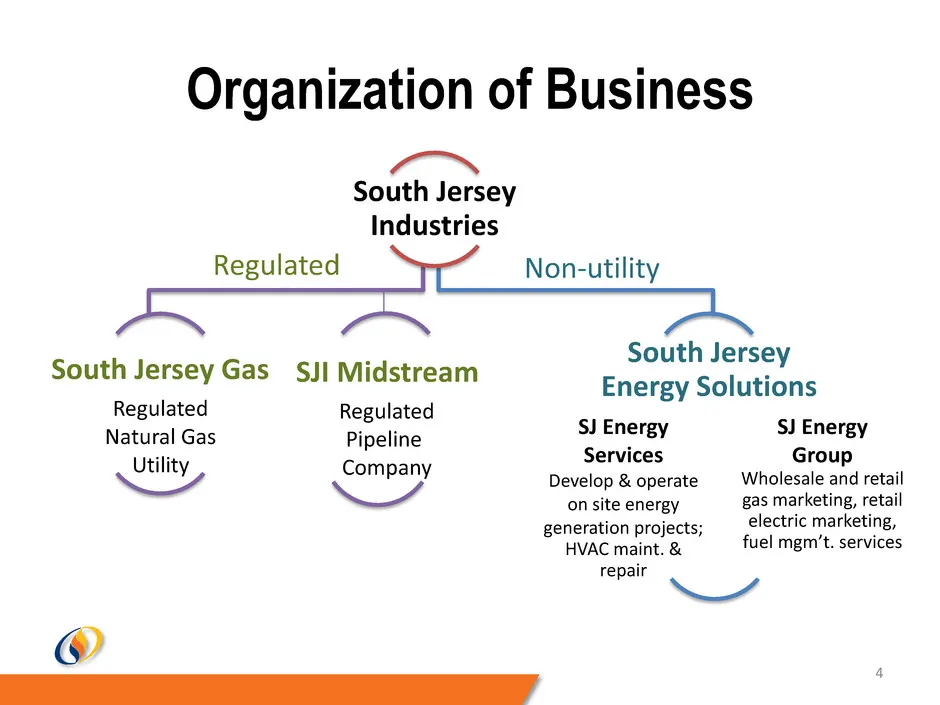
4 South Jersey Industries South Jersey Gas SJI Midstream South Jersey Energy Solutions Regulated Natural Gas Utility Regulated Pipeline Company SJ Energy Services Develop & operate on site energy generation projects; HVAC maint. & repair SJ Energy Group Wholesale and retail gas marketing, retail ele
Slide 5: Management Team
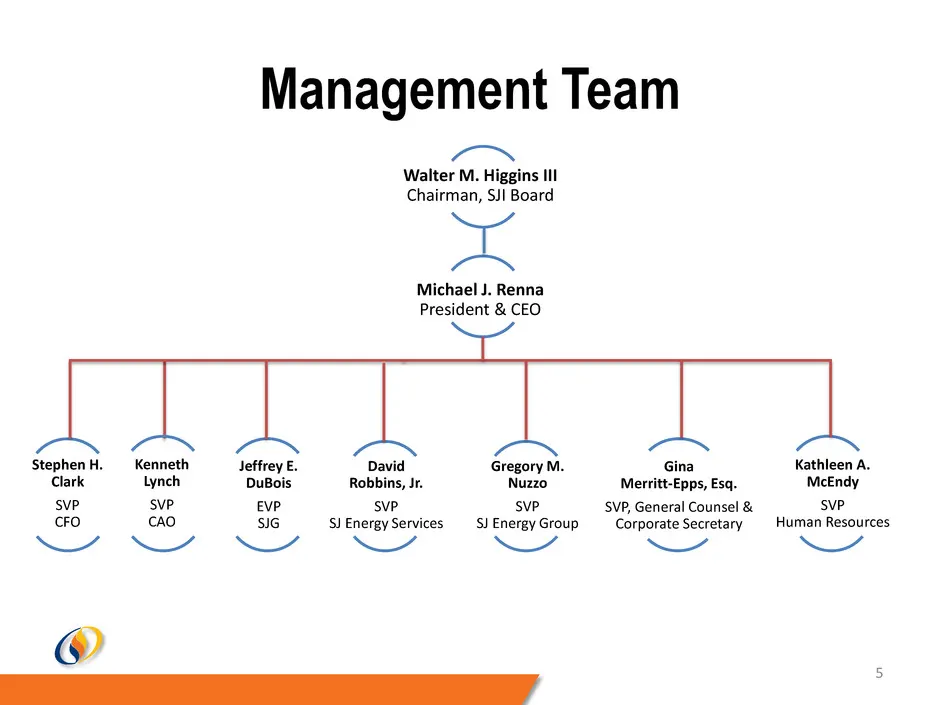
Management Team 5 Michael J. Renna President & CEO Stephen H. Clark SVP CFO Jeffrey E. DuBois EVP SJG David Robbins, Jr. SVP SJ Energy Services Gregory M. Nuzzo SVP SJ Energy Group Gina Merritt-Epps, Esq. SVP, General Counsel & Corporate Secretary Kathleen A. McEndy SVP Human Resources Walter M. Hig
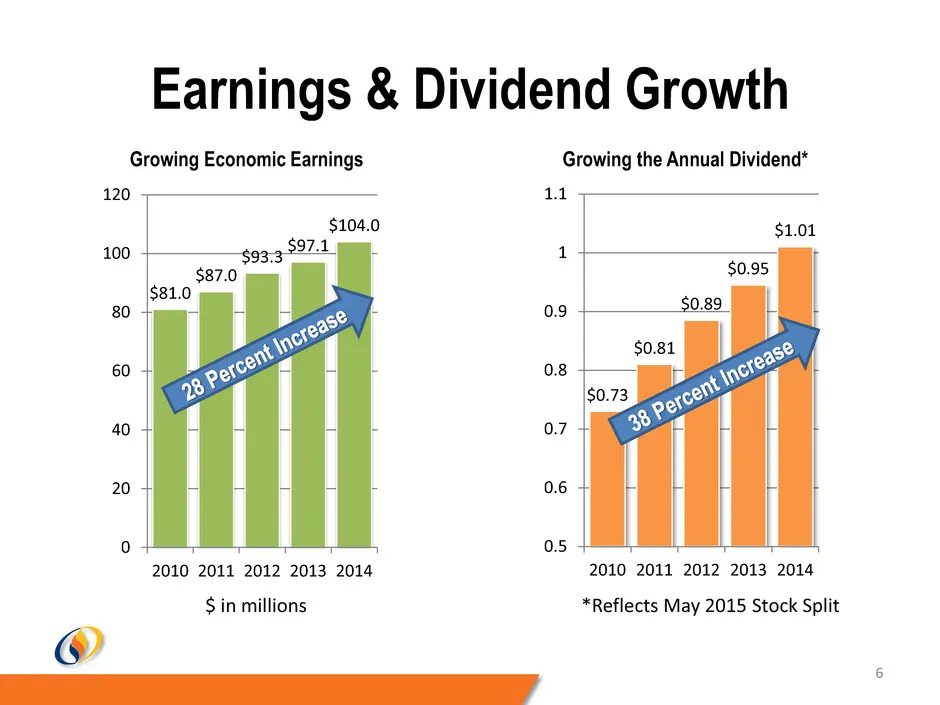
Slide 6: Earnings & Dividend Growth
6 Earnings & Dividend Growth $0.73 $0.81 $0.89 $0.95 $1.01 0.5 0.6 0.7 0.8 0.9 1 1.1 2010 2011 2012 2013 2014 $81.0 $87.0 $93.3 $97.1 $104.0 0 20 40 60 80 100 120 2010 2011 2012 2013 2014 Growing Economic Earnings Growing the Annual Dividend* *Reflects May 2015 Stock Split $ in millions
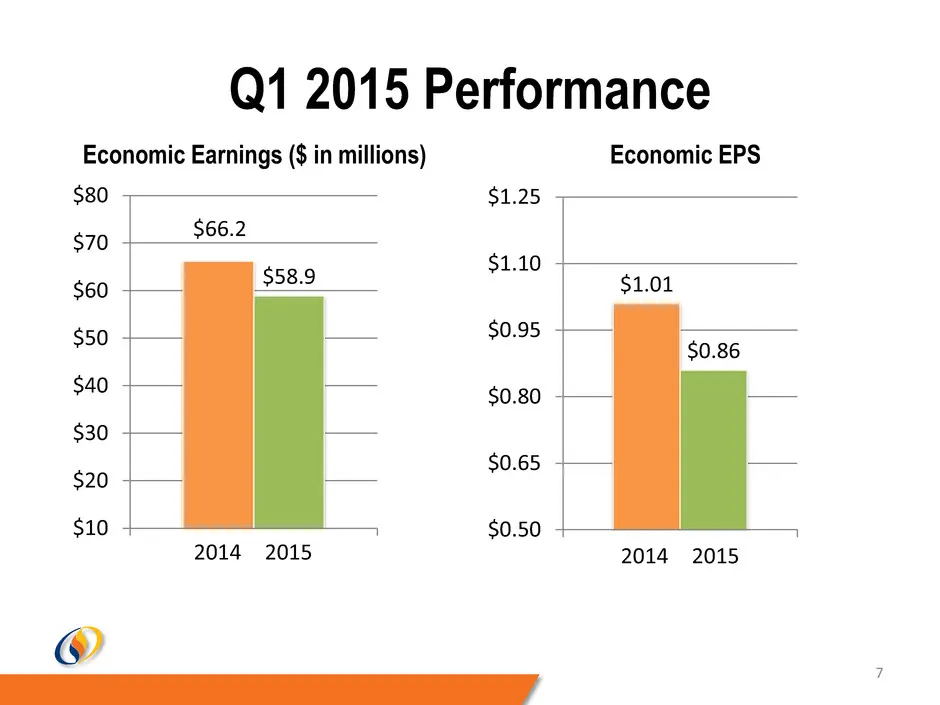
Slide 7: Q1 2015 Performance
7 Economic Earnings ($ in millions) Economic EPS Q1 2015 Performance $66.2 $58.9 $10 $20 $30 $40 $50 $60 $70 $80 2014 2015 $1.01 $0.86 $0.50 $0.65 $0.80 $0.95 $1.10 $1.25 2014 2015
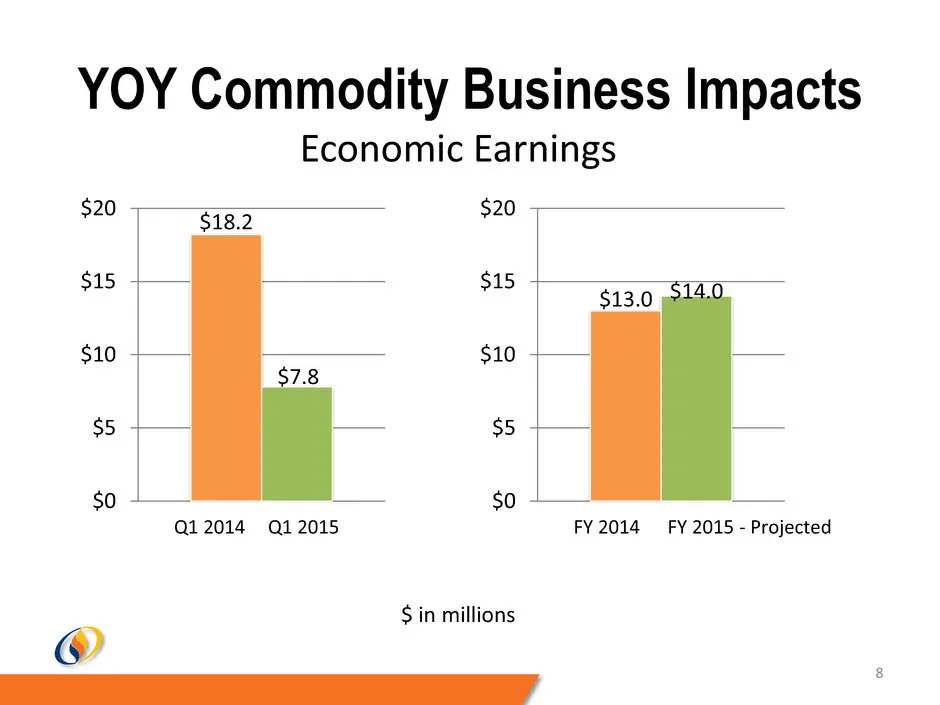
Slide 8: Commodity Business Impacts Economic Earnings
8 $18.2 $7.8 $0 $5 $10 $15 $20 Q1 2015 Q1 2014 YOY Commodity Business Impacts Economic Earnings $13.0 $14.0 $0 $5 $10 $15 $20 FY 2015 - Projected FY 2014 $ in millions
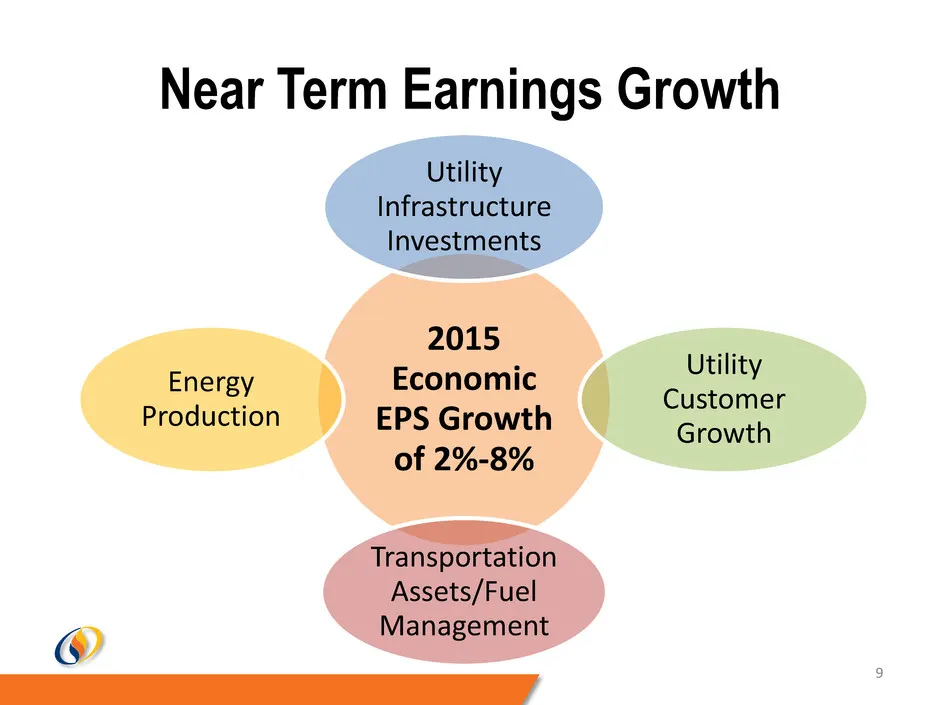
Slide 9: Near Term Earnings Growth
Near Term Earnings Growth 2015 Economic EPS Growth of 2%-8% Utility Infrastructure Investments Utility Customer Growth Transportation Assets/Fuel Management Energy Production 9
Slide 10: South Jersey Gas
SOUTH JERSEY GAS WSsII
Slide 11: Utility Growth Summary
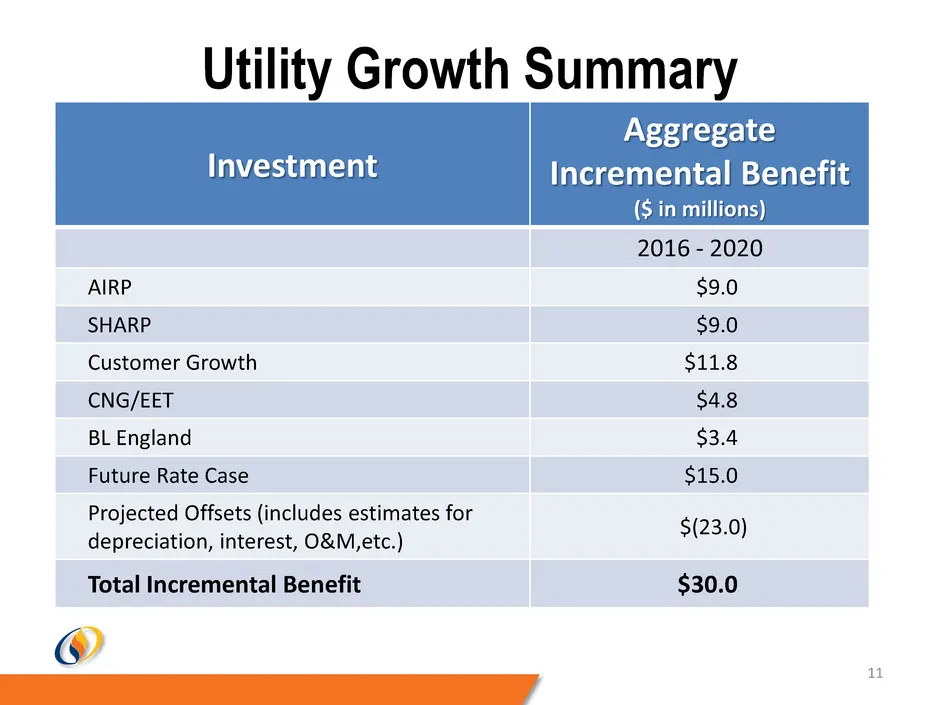
Investment Aggregate Incremental Benefit ($ in millions) 2016 - 2020 AIRP $9.0 SHARP $9.0 Customer Growth $11.8 CNG/EET $4.8 BL England $3.4 Future Rate Case $15.0 Projected Offsets (includes estimates for depreciation, interest, O&M,etc.) $(23.0) Total Incremental Benefit $30.0 11 Utility Growth Su
Slide 12: Utility Infrastructure Investment
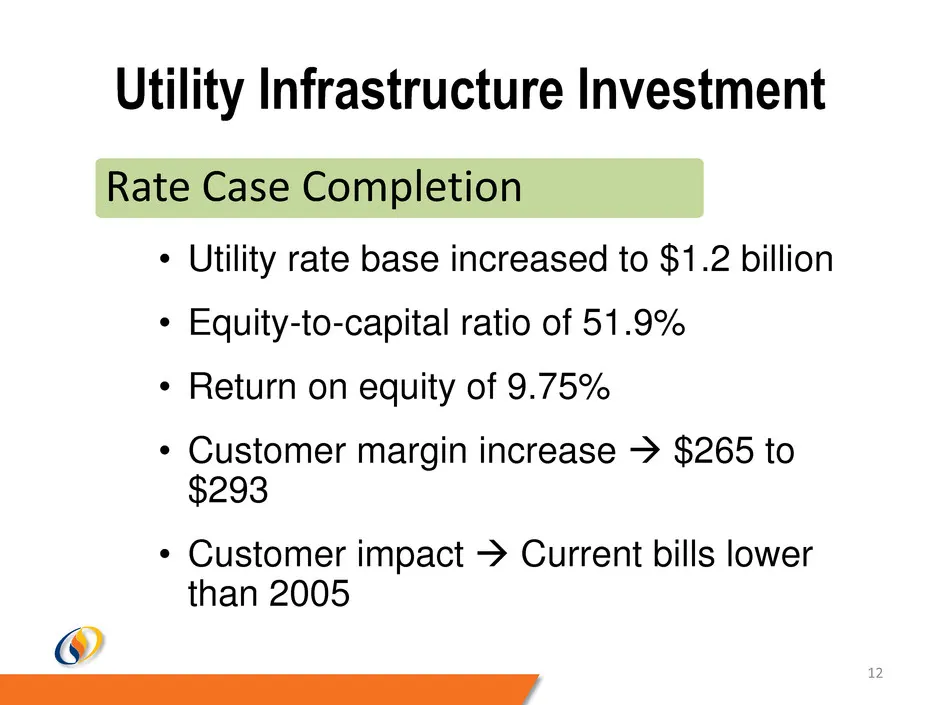
12 Utility Infrastructure Investment • Utility rate base increased to $1.2 billion • Equity-to-capital ratio of 51.9% • Return on equity of 9.75% • Customer margin increase $265 to $293 • Customer impact Current bills lower than 2005 Rate Case Completion
Slide 13: Utility Infrastructure Investment
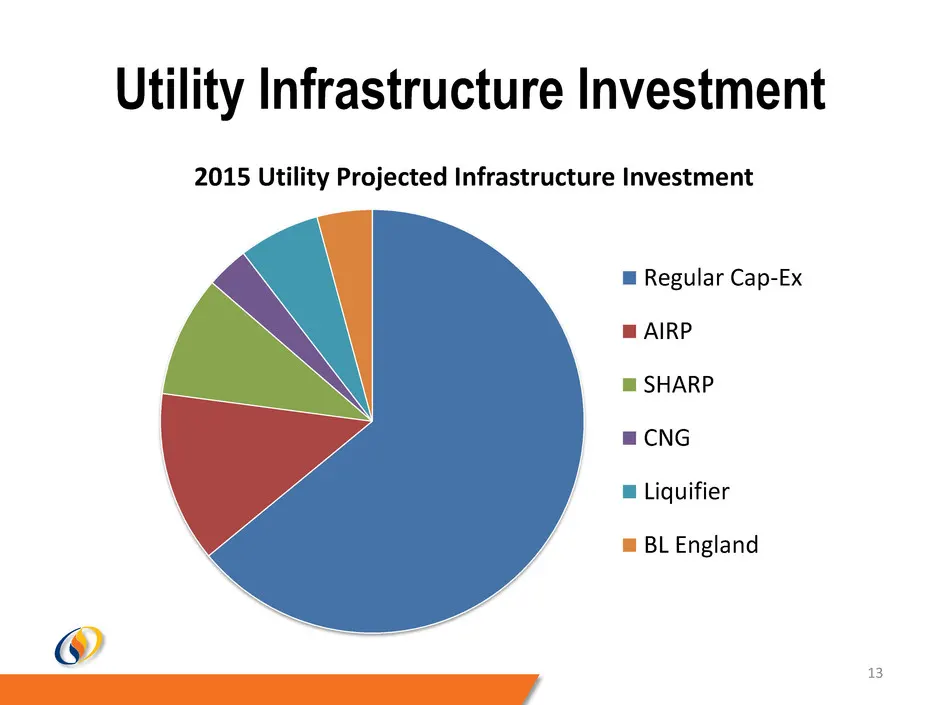
13 Utility Infrastructure Investment 2015 Utility Projected Infrastructure Investment Regular Cap-Ex AIRP SHARP CNG Liquifier BL England
Slide 14: 2015 Utility Customer Growth
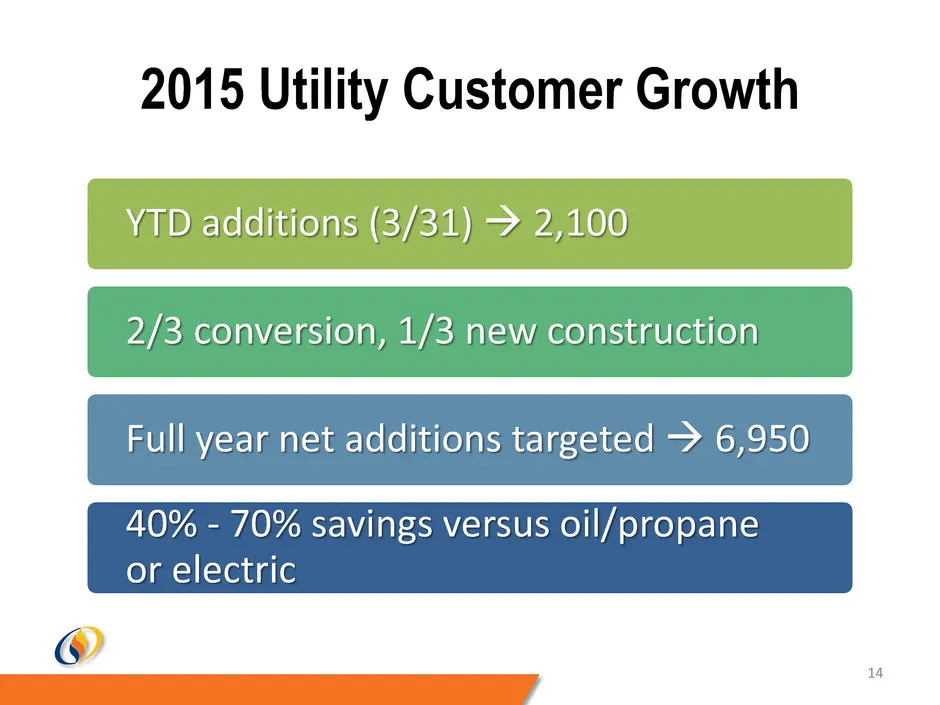
2015 Utility Customer Growth YTD additions (3/31) 2,100 2/3 conversion, 1/3 new construction Full year net additions targeted 6,950 40% - 70% savings versus oil/propane or electric 14

Slide 15: SJI Midstream
SJI MIDSTREAM WSsII
Slide 16: PennEast Pipeline Project
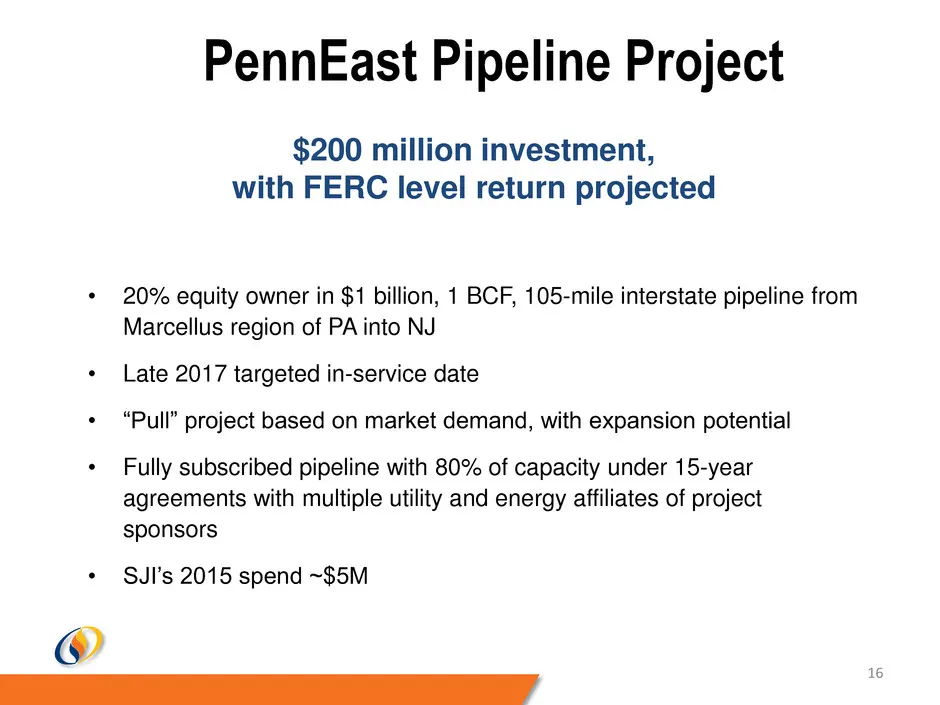
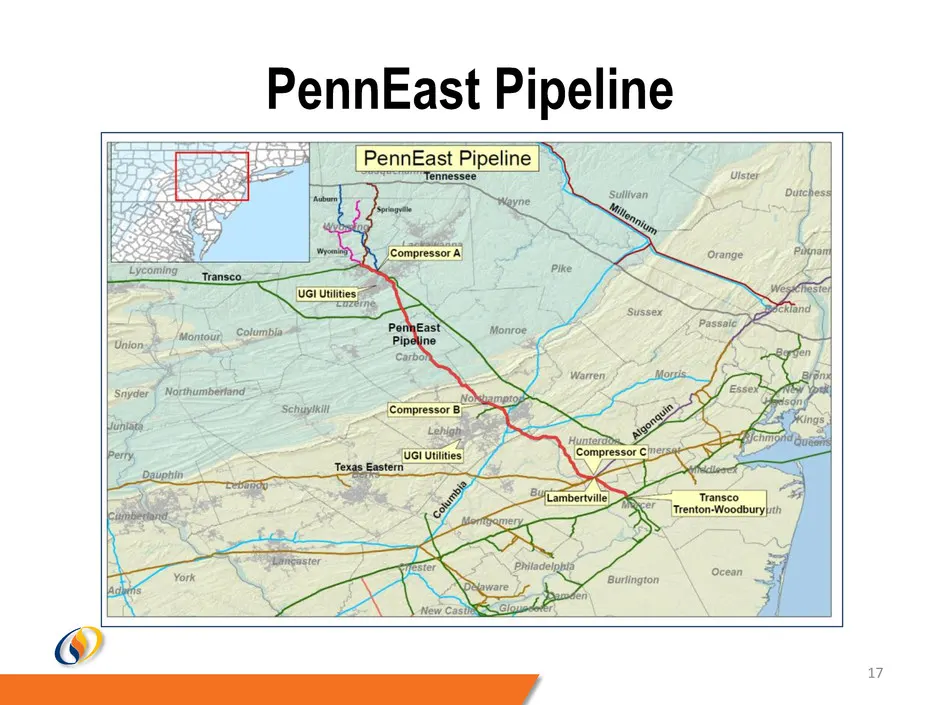
16 $200 million investment, with FERC level return projected • 20% equity owner in $1 billion, 1 BCF, 105-mile interstate pipeline from Marcellus region of PA into NJ • Late 2017 targeted in-service date • “Pull” project based on market demand, with expansion potential • Fully subscribed pipeline wi
Slide 17: PennEast Pipeline
PennEast Pipeline L34 _ | PennEast Pipeline | >) ue
Slide 18: SJ Energy Solutions
SJ ENERGY SOLUTIONS WSsII
Slide 19: Non-Utility Growth Summary
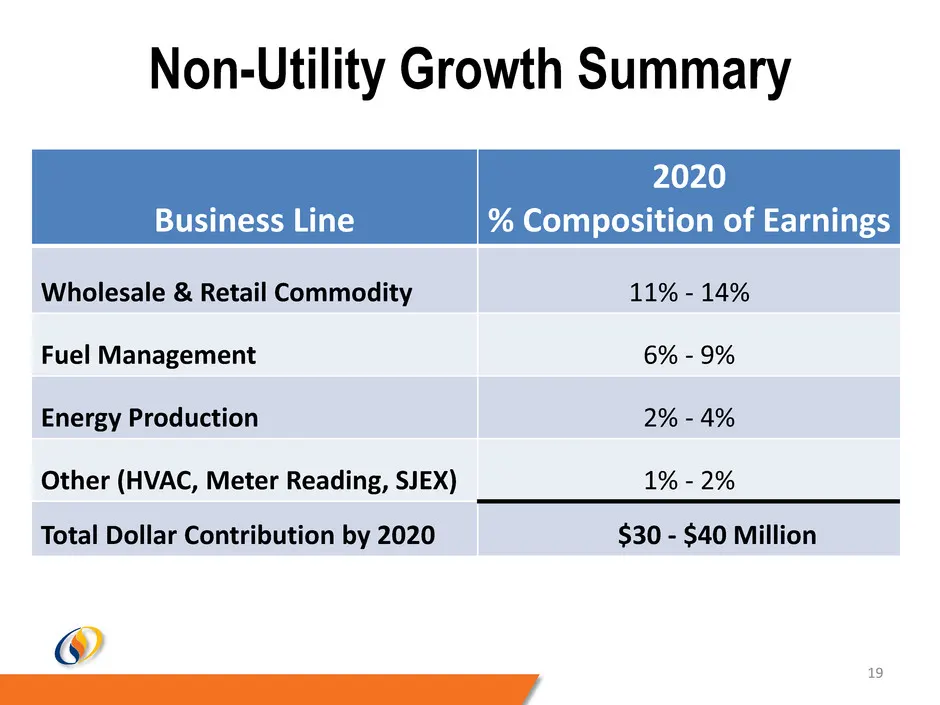
Business Line 2020 % Composition of Earnings Wholesale & Retail Commodity 11% - 14% Fuel Management 6% - 9% Energy Production 2% - 4% Other (HVAC, Meter Reading, SJEX) 1% - 2% Total Dollar Contribution by 2020 $30 - $40 Million 19 Non-Utility Growth Summary
Slide 20: Fuel Supply Management
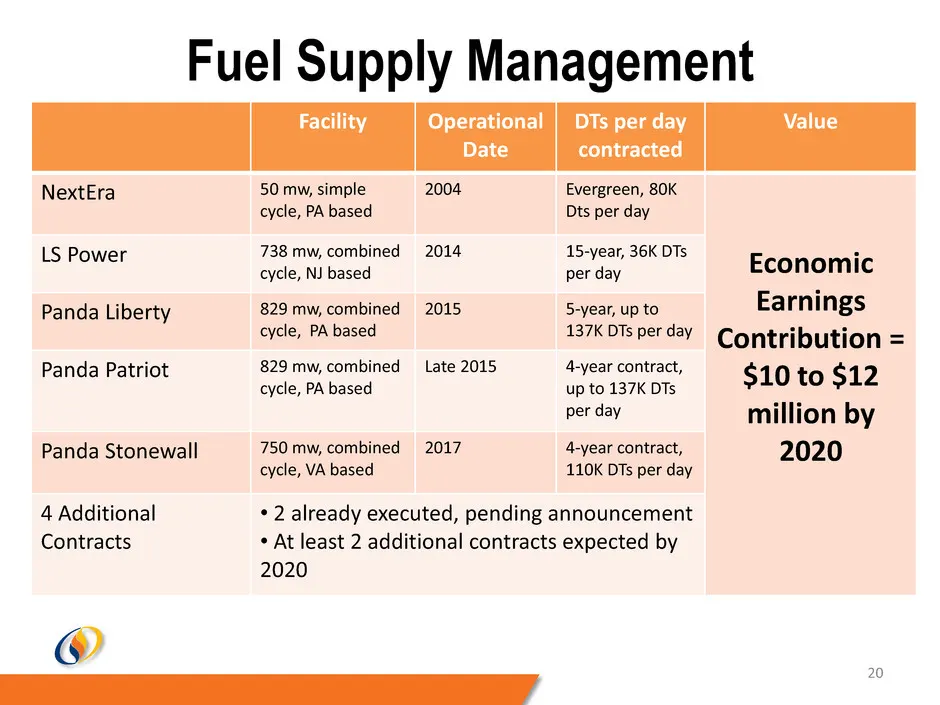
Fuel Supply Management Facility Operational Date DTs per day contracted Value NextEra 50 mw, simple cycle, PA based 2004 Evergreen, 80K Dts per day Economic Earnings Contribution = $10 to $12 million by 2020 LS Power 738 mw, combined cycle, NJ based 2014 15-year, 36K DTs per day Panda Liberty 829 mw
Slide 21: Energy Production Assets
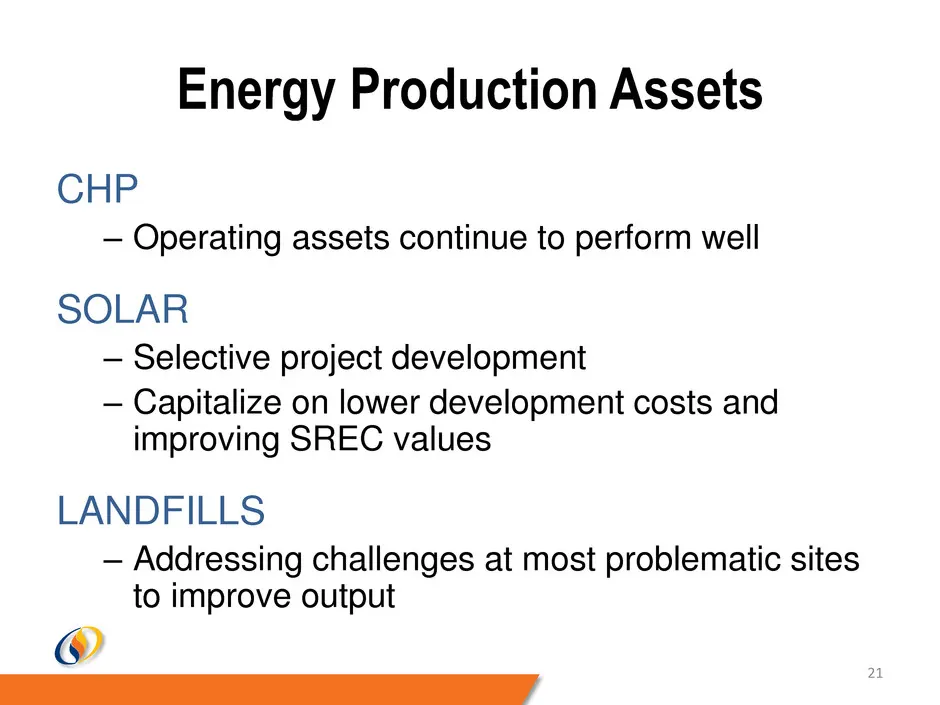
Energy Production Assets 21 CHP – Operating assets continue to perform well SOLAR – Selective project development – Capitalize on lower development costs and improving SREC values LANDFILLS – Addressing challenges at most problematic sites to improve output
Slide 22: Revel Update
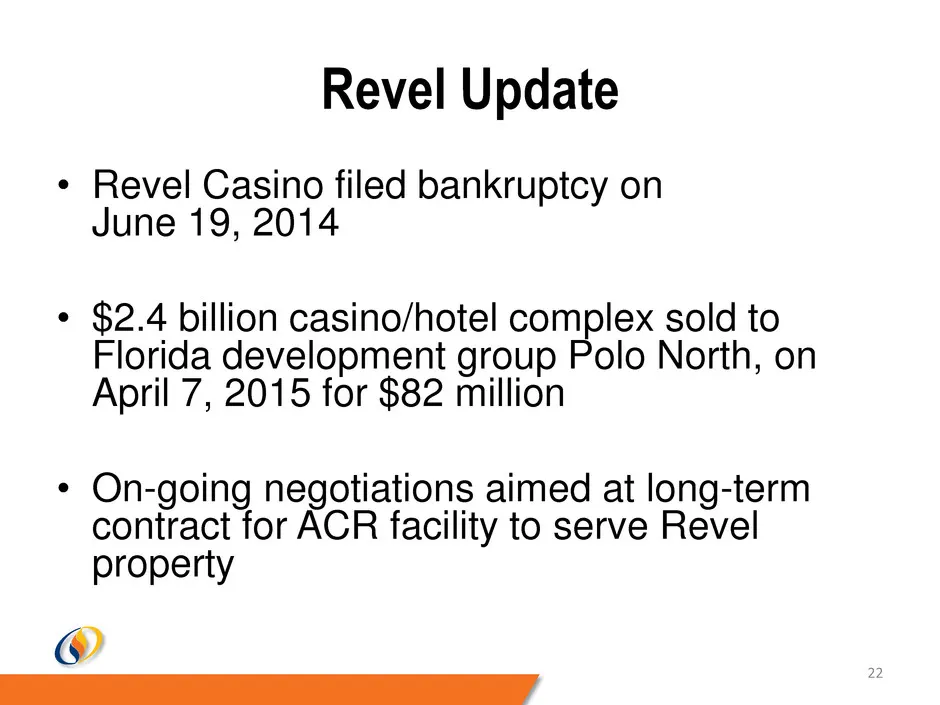
Revel Update • Revel Casino filed bankruptcy on June 19, 2014 • $2.4 billion casino/hotel complex sold to Florida development group Polo North, on April 7, 2015 for $82 million • On-going negotiations aimed at long-term contract for ACR facility to serve Revel property 22
Slide 23: Looking Ahead
LOOKING AHEAD WSsII
Slide 24: Strategic Priorities
24 Strategic Priorities Grow Economic Earnings Improve Quality of Earnings Strengthen Balance Sheet Maintain Low to Moderate Risk Profile $150 Million Economic Earnings by 2020
Slide 25: Executing on Strategic Priorities
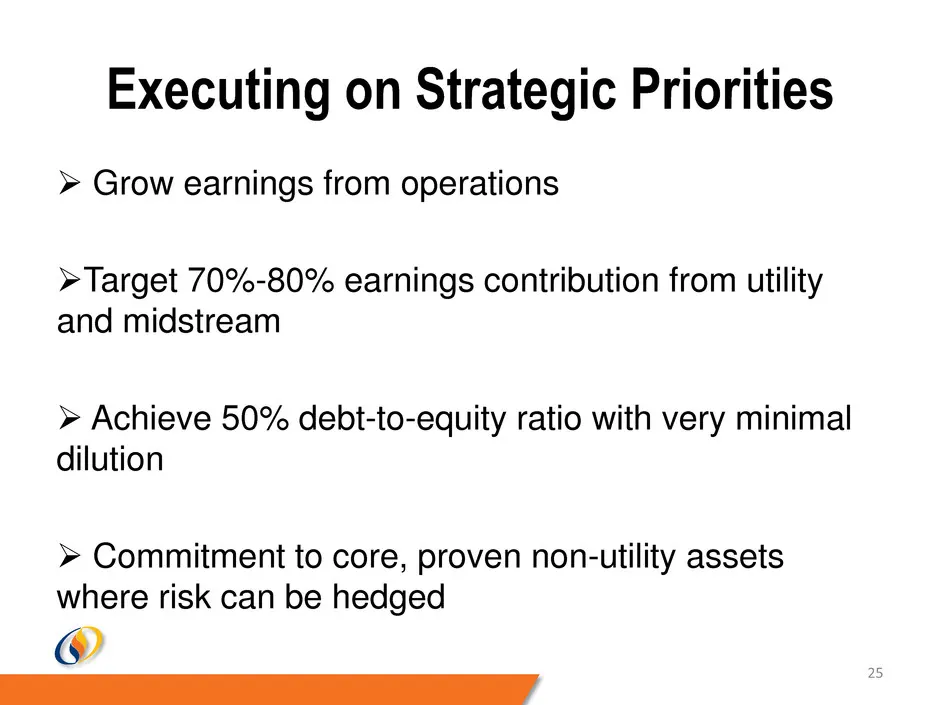
Executing on Strategic Priorities 25 Grow earnings from operations Target 70%-80% earnings contribution from utility and midstream Achieve 50% debt-to-equity ratio with very minimal dilution Commitment to core, proven non-utility assets where risk can be hedged
Slide 26: Contribution to Economic Earnings
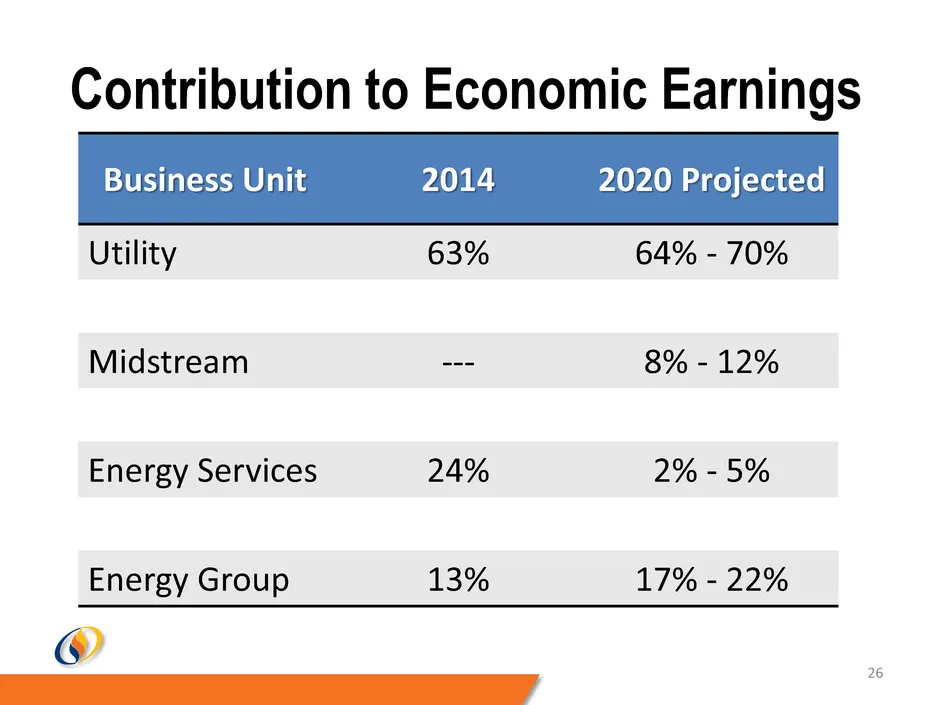
26 Contribution to Economic Earnings Business Unit 2014 2020 Projected Utility 63% 64% - 70% Midstream --- 8% - 12% Energy Services 24% 2% - 5% Energy Group 13% 17% - 22%
Source: SEC EDGAR · 8-K filed May 15, 2015
More decks from South Jersey Industries Inc
 FY2021 Earnings Presentation29 slides · Feb 24, 2022
 Q3 2021 Earnings Presentation31 slides · Nov 3, 2021
 Q2 2021 Earnings Presentation31 slides · Aug 4, 2021
 Investor Day (May 2021)88 slides · May 6, 2021
 FY2020 Earnings Presentation31 slides · Feb 24, 2021
 Q3 2020 Earnings Presentation37 slides · Nov 4, 2020