Consolidated Communications — Morgan Stanley TMT Conference 2021
12 slides from Consolidated Communications's conference presentation, Mar 1, 2021

Slide 1: Morgan Stanley TMT Conference March 1, 2021
Morgan Stanley TMT Conference March 1, 2021
Slide 2: Safe Harbor
2 Safe Harbor The Securities and Exchange Commission (“SEC”) encourages companies to disclose forward-looking information so that investors can better understand a company’s future prospects and make informed investment decisions. Certain statements in this communication are forward-looking statemen
Slide 3: Non-GAAP Measures
3 Non-GAAP Measures This presentation includes certain non-GAAP historical and forward-looking financial measures, including but not limited to “EBITDA,” “adjusted EBITDA,” “total net debt to last twelve month adjusted EBITDA ratio,” and “free cash flow.” In addition to providing key metrics for man
Slide 4: About Consolidated Communications: Current Fiber Network
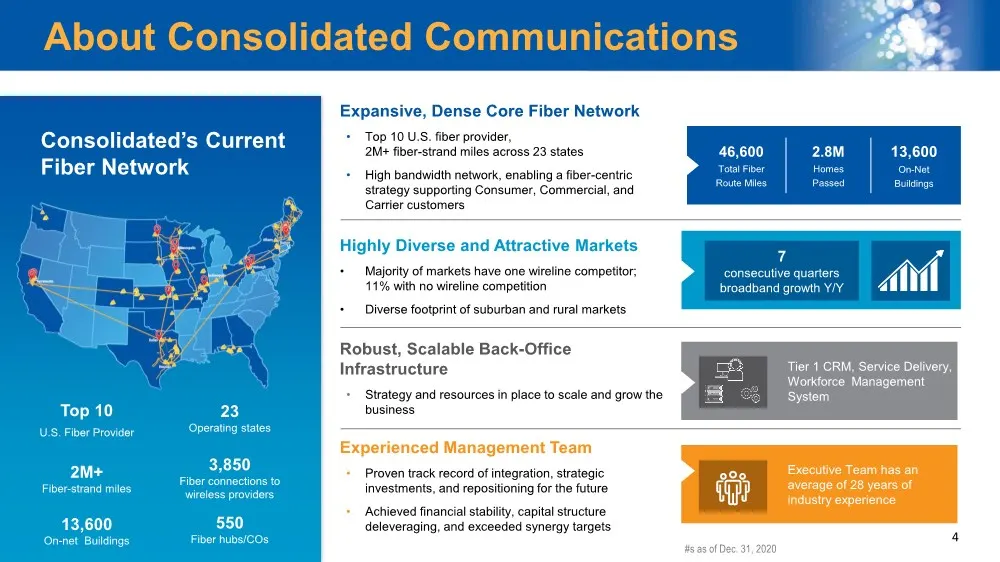
4 Consolidated’s Current Fiber Network About Consolidated Communications 46,600 Total Fiber Route Miles 2.8M Homes Passed 13,600 On-Net Buildings Executive Team has an average of 28 years of industry experience Expansive, Dense Core Fiber Network • Top 10 U.S. fiber provider, 2M+ fiber-strand miles
Slide 5: Consolidated Q4 Highlights; Future Plan
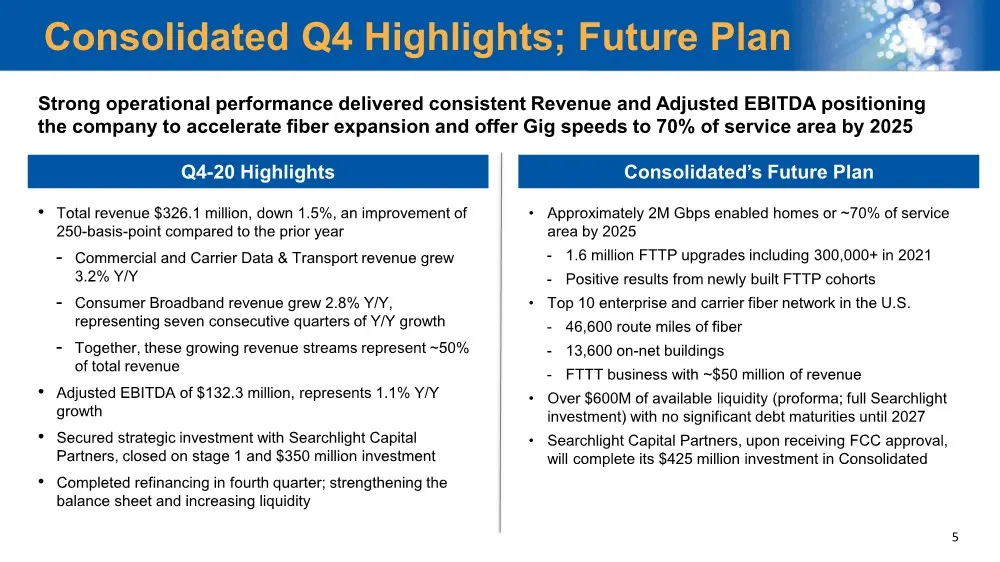
5 Consolidated Q4 Highlights; Future Plan • Total revenue $326.1 million, down 1.5%, an improvement of 250-basis-point compared to the prior year - Commercial and Carrier Data & Transport revenue grew 3.2% Y/Y - Consumer Broadband revenue grew 2.8% Y/Y, representing seven consecutive quarters of Y/Y
Slide 6: Fiber Build Plan: 2021-2025
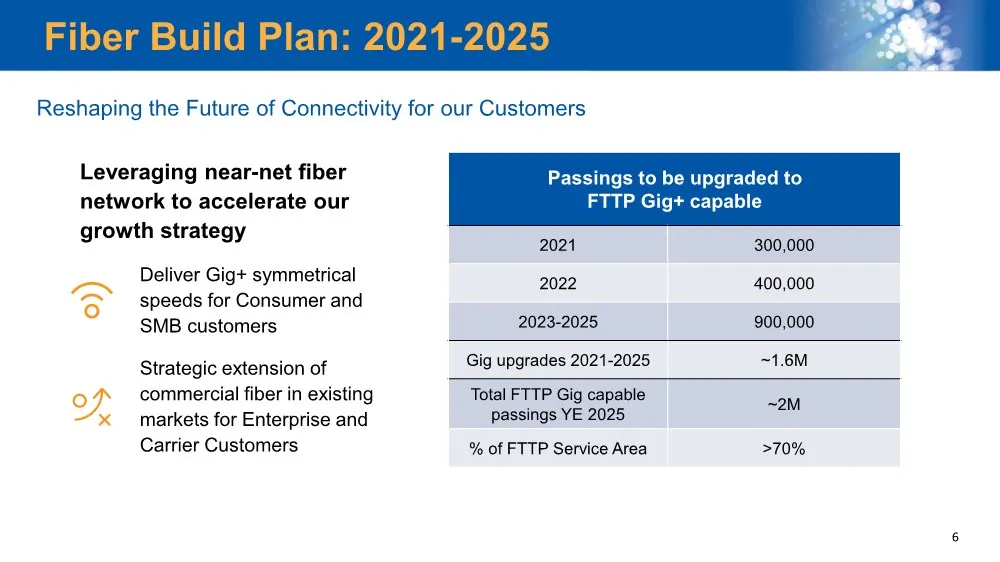
6 Fiber Build Plan: 2021-2025 Reshaping the Future of Connectivity for our Customers Leveraging near-net fiber network to accelerate our growth strategy Deliver Gig+ symmetrical speeds for Consumer and SMB customers Strategic extension of commercial fiber in existing markets for Enterprise and Carri
Slide 7: Consolidated Strategic Priorities
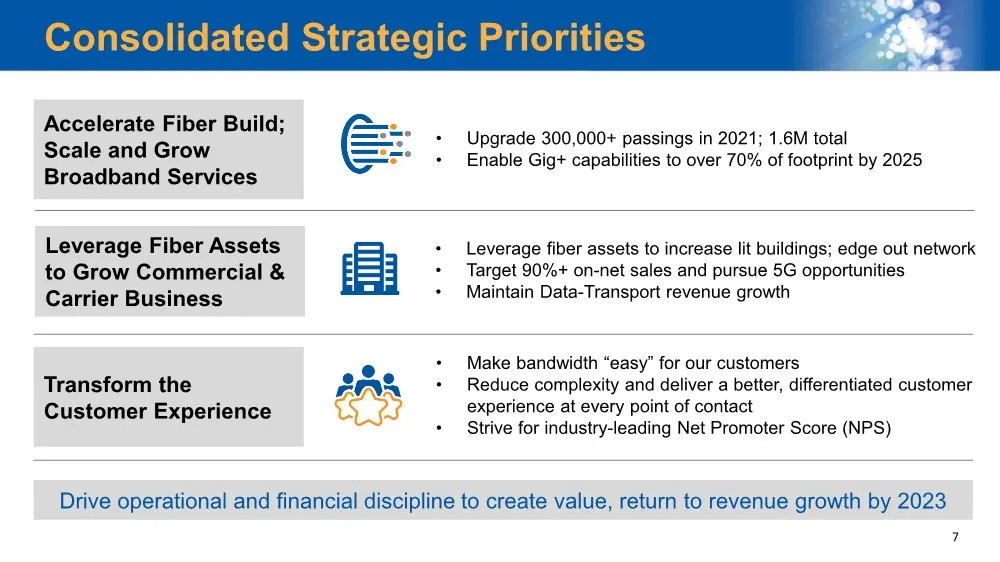
7 Consolidated Strategic Priorities • Upgrade 300,000+ passings in 2021; 1.6M total • Enable Gig+ capabilities to over 70% of footprint by 2025 Accelerate Fiber Build; Scale and Grow Broadband Services Leverage Fiber Assets to Grow Commercial & Carrier Business • Leverage fiber assets to increase li
Slide 8: Capital Structure; Funded Growth Plan
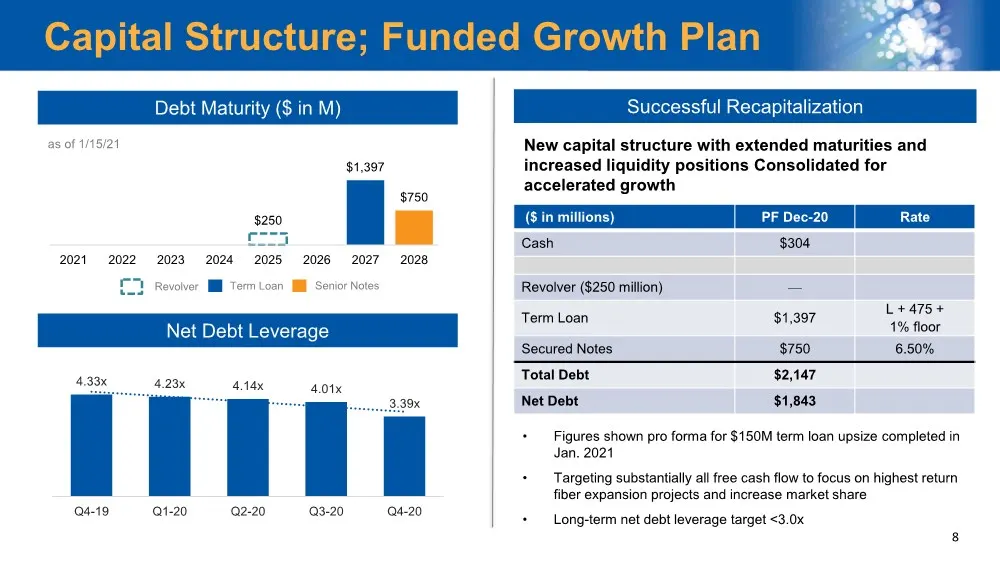
8 $250 $1,397 $750 2021 2022 2023 2024 2025 2026 2027 2028 Senior Notes Term Loan Revolver Capital Structure; Funded Growth Plan Debt Maturity ($ in M) Net Debt Leverage • Figures shown pro forma for $150M term loan upsize completed in Jan. 2021 • Targeting substantially all free cash flow to focus

Slide 9: Appendix
| Consolidated’ Qe communications Appendix
Slide 10: 2021 Outlook
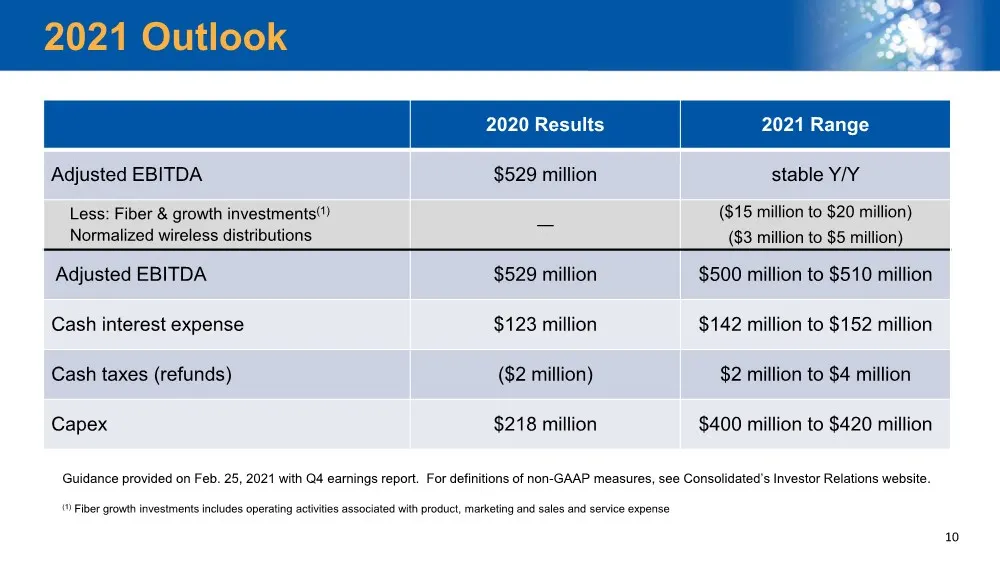
10 2021 Outlook 2020 Results 2021 Range Adjusted EBITDA $529 million stable Y/Y Less: Fiber & growth investments(1) Normalized wireless distributions —($15 million to $20 million) ($3 million to $5 million) Adjusted EBITDA $529 million $500 million to $510 million Cash interest expense $123 million
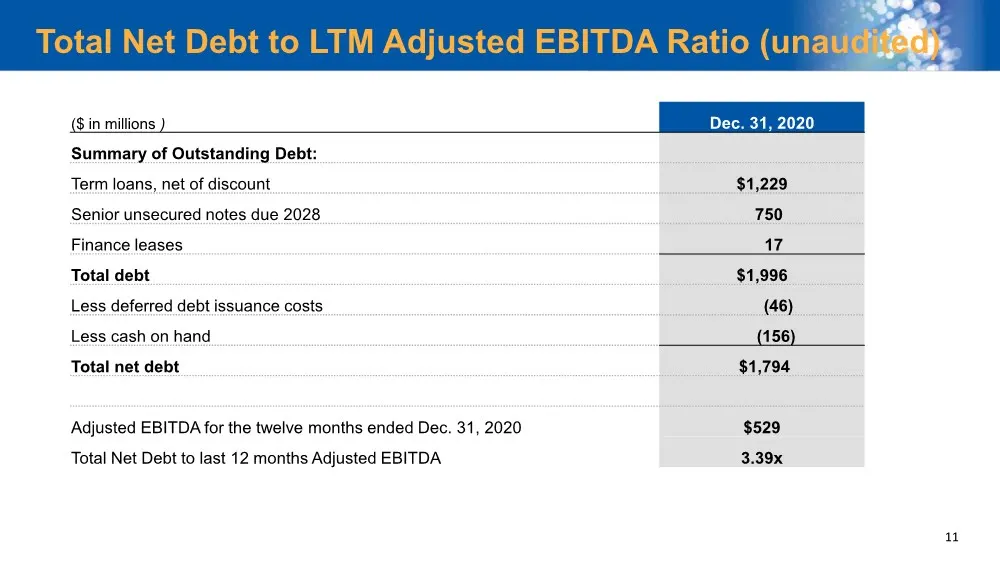
Slide 11: Total Net Debt to LTM Adjusted EBITDA Ratio
11 Total Net Debt to LTM Adjusted EBITDA Ratio (unaudited) ($ in millions ) Dec. 31, 2020 Summary of Outstanding Debt: Term loans, net of discount $1,229 Senior unsecured notes due 2028 750 Finance leases 17 Total debt $1,996 Less deferred debt issuance costs (46) Less cash on hand (156) Total net d
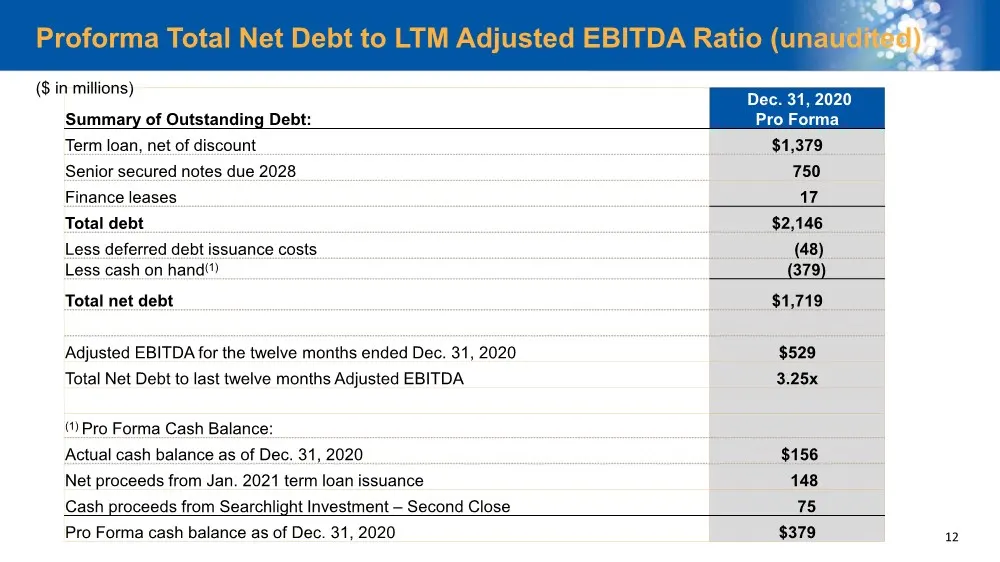
Slide 12: Proforma Total Net Debt to LTM Adjusted EBITDA Ratio
12 Proforma Total Net Debt to LTM Adjusted EBITDA Ratio (unaudited) Summary of Outstanding Debt: Dec. 31, 2020 Pro Forma Term loan, net of discount $1,379 Senior secured notes due 2028 750 Finance leases 17 Total debt $2,146 Less deferred debt issuance costs (48) Less cash on hand(1) (379) Total net
Source: SEC EDGAR · 8-K filed Mar 1, 2021
More decks from Consolidated Communications
 Proxy Contest (January 2024)34 slides · Jan 11, 2024
 Merger or Acquisition (October 2023)7 slides · Oct 16, 2023
 Q2 2023 Earnings Presentation27 slides · Aug 8, 2023
 Q1 2023 Earnings Presentation28 slides · May 2, 2023
 Shareholder Meeting (May 2023)15 slides · May 1, 2023
 J.P. Morgan Global High Yield & Leveraged Finance Conference 202317 slides · Mar 7, 2023