Meredith — UBS 40th Annual Global Media and Communications Conference December 2012
52 slides from Meredith's conference presentation, Dec 4, 2012

Slide 1: Placeholder for Saks MXM video
Placeholder for Saks MXM video

Slide 2: UBS 40th Annual Global Media and Communications Conference
UBS 40th Annual Global Media and Communications Conference • December 2012
Slide 3: Safe Harbor
Safe Harbor This presentation and management’s public commentary contain certain forward-looking statements that are subject to risks and uncertainties. These statements are based on management’s current knowledge and estimates of factors affecting the Company and its operations. Statements in this
Slide 4: Agenda
+ local media brands + marketing solutions + national media brands Agenda Meredith Overview Key Initiatives: National Media Group Key Initiatives: Local Media Group Financial Strategy 4
Slide 5: 3 Things to Know about Meredith
1. Powerful media and marketing company: A) Trusted national brands and an unrivaled female reach B) Leading full-service global digital marketing agency C) Portfolio of highly-rated television stations in fast-growing markets 2. Experienced management team with a proven record of operational excell
Slide 6: Meredith at a Glance
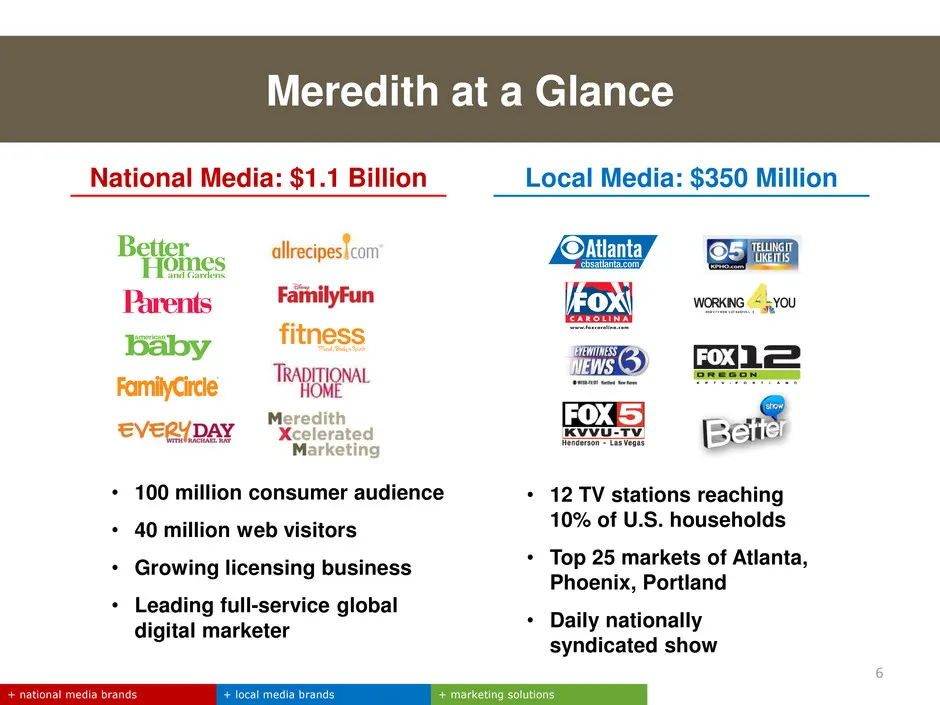
Meredith at a Glance + local media brands + marketing solutions + national media brands 6 National Media: $1.1 Billion Local Media: $350 Million WORKING YOU WS M V -TV W SM V-DT NASHV IL L E • 12 TV stations reaching 10% of U.S. households • Top 25 markets of Atlanta, Phoenix, Portland • Daily natio
Slide 7: Reaching 100 Million Women
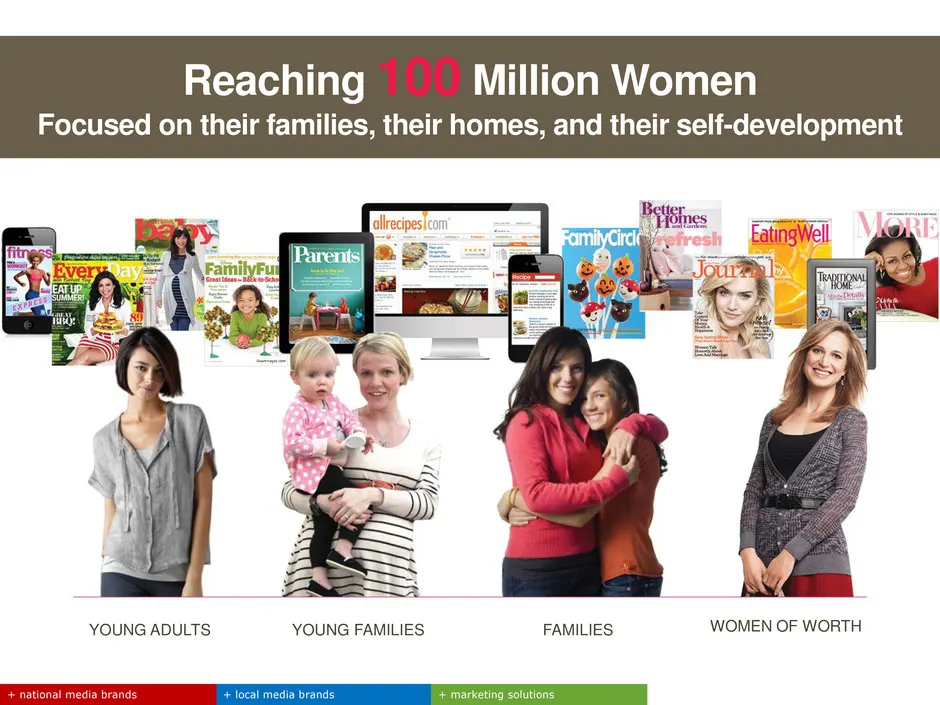
YOUNG ADULTS YOUNG FAMILIES FAMILIES WOMEN OF WORTH Reaching 100 Million Women Focused on their families, their homes, and their self-development + local media brands + marketing solutions + national media brands
Slide 8: Local Brands in Growth Markets
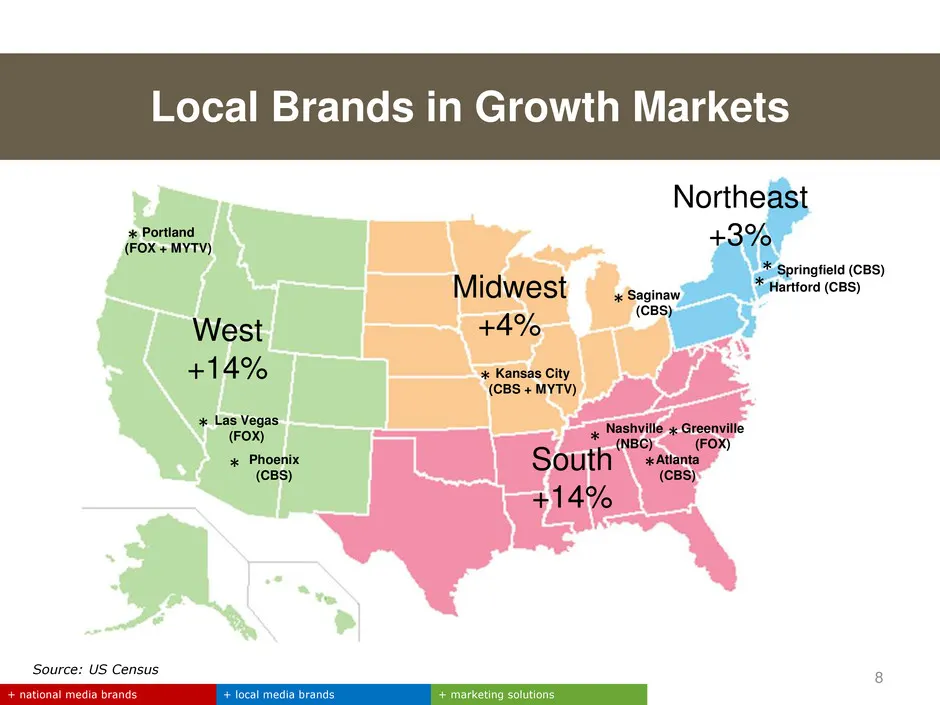
Local Brands in Growth Markets Source: US Census + local media brands + marketing solutions + national media brands West +14% Midwest +4% South +14% Northeast +3% Portland (FOX + MYTV) Las Vegas (FOX) Phoenix (CBS) Kansas City (CBS + MYTV) Saginaw (CBS) Atlanta (CBS) Nashville (NBC) Greenville (FOX)
Slide 9: Monetizing Audience Scale Across Platforms
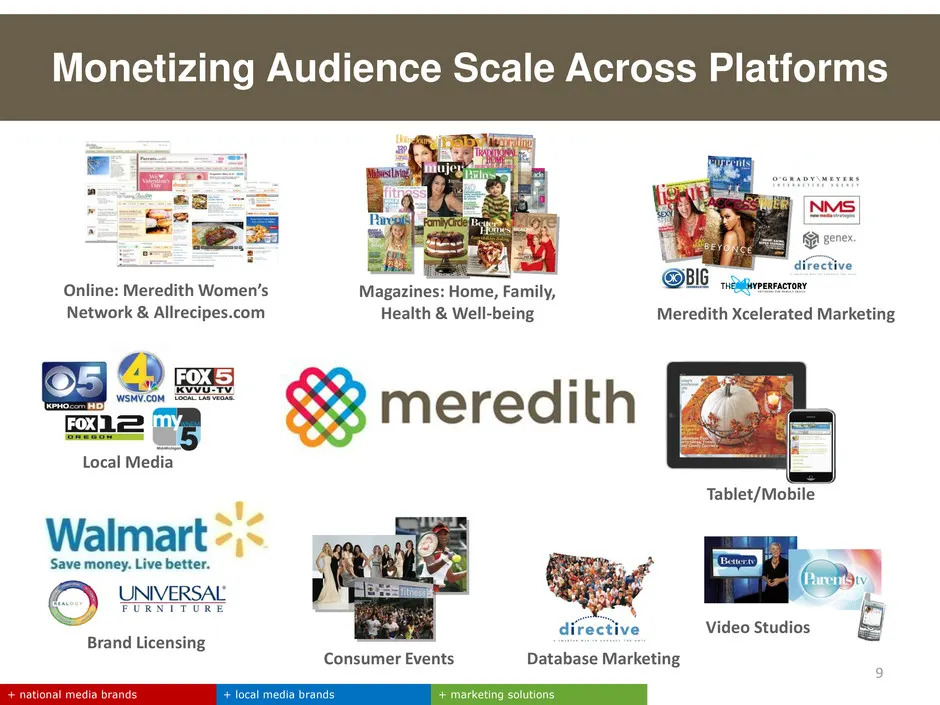
Monetizing Audience Scale Across Platforms Online: Meredith Women’s Network & Allrecipes.com Magazines: Home, Family, Health & Well-being Consumer Events Meredith Xcelerated Marketing Database Marketing Video Studios Brand Licensing Local Media + local media brands + marketing solutions + national m
Slide 10: Fiscal 2012 accomplishments
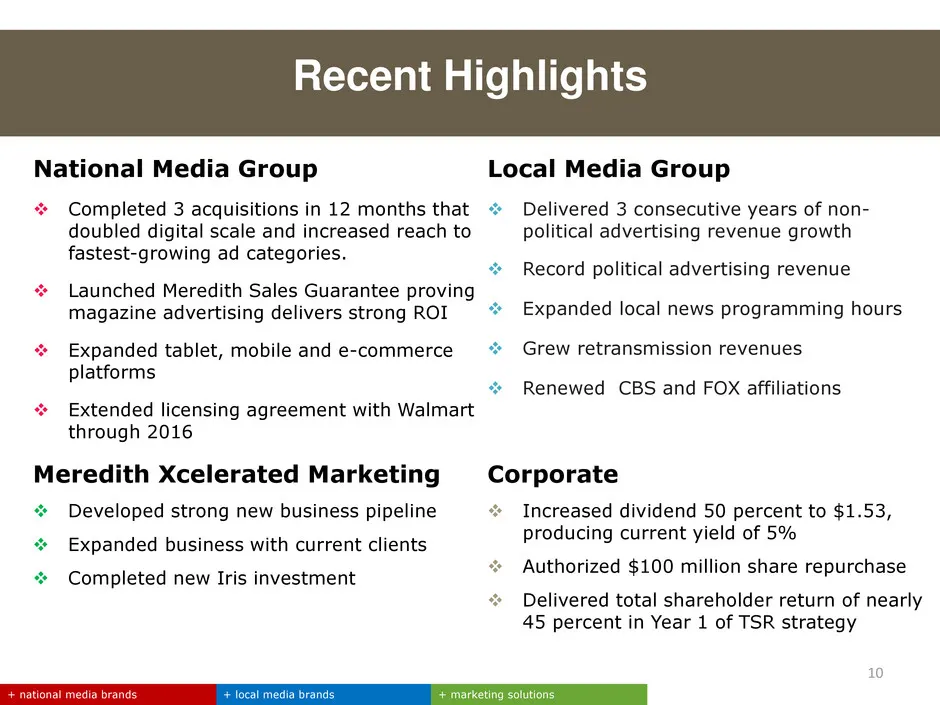
National Media Group Completed 3 acquisitions in 12 months that doubled digital scale and increased reach to fastest-growing ad categories. Launched Meredith Sales Guarantee proving magazine advertising delivers strong ROI Expanded tablet, mobile and e-commerce platforms Extended licensing a
Slide 11: Agenda: National Media Group Key Initiatives
11 + local media brands + marketing solutions + national media brands Agenda Meredith Overview Key Initiatives: National Media Group — Gaining advertising market share — Capitalizing on strength in food, parenting and home categories — Increasing reach to fast-growing categories — Growing brand

Slide 12: Placeholder for NMG video
Placeholder for NMG video
Slide 13: We Focus on What Matters to Women
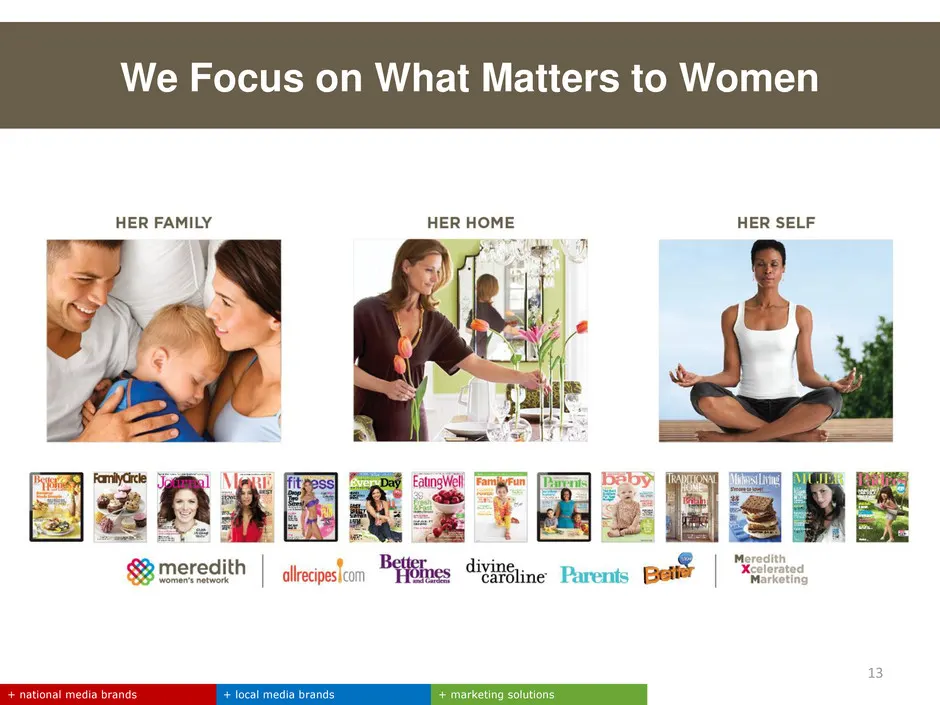
13 We Focus on What Matters to Women + local media brands + marketing solutions + national media brands
Slide 14: Our Consumer Reach is Growing Across Platforms
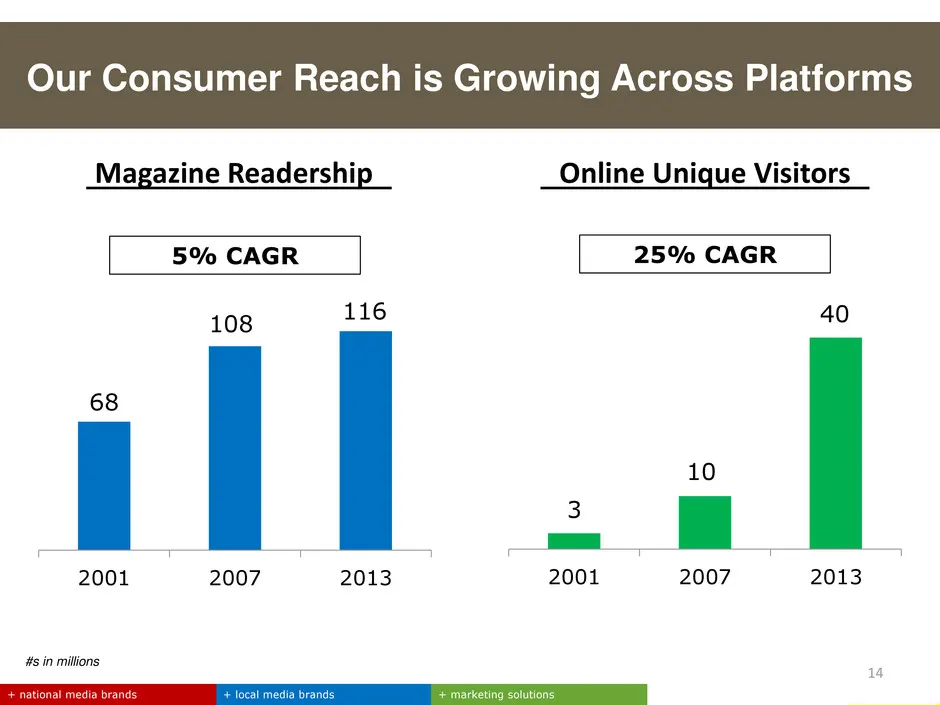
Our Consumer Reach is Growing Across Platforms #s in millions + local media brands + marketing solutions + national media brands 14 3 10 40 2001 2007 2013 Magazine Readership Online Unique Visitors 68 108 116 2001 2007 2013 5% CAGR 25% CAGR
Slide 15: Better Homes and Gardens is America's #1 Choice Magazine
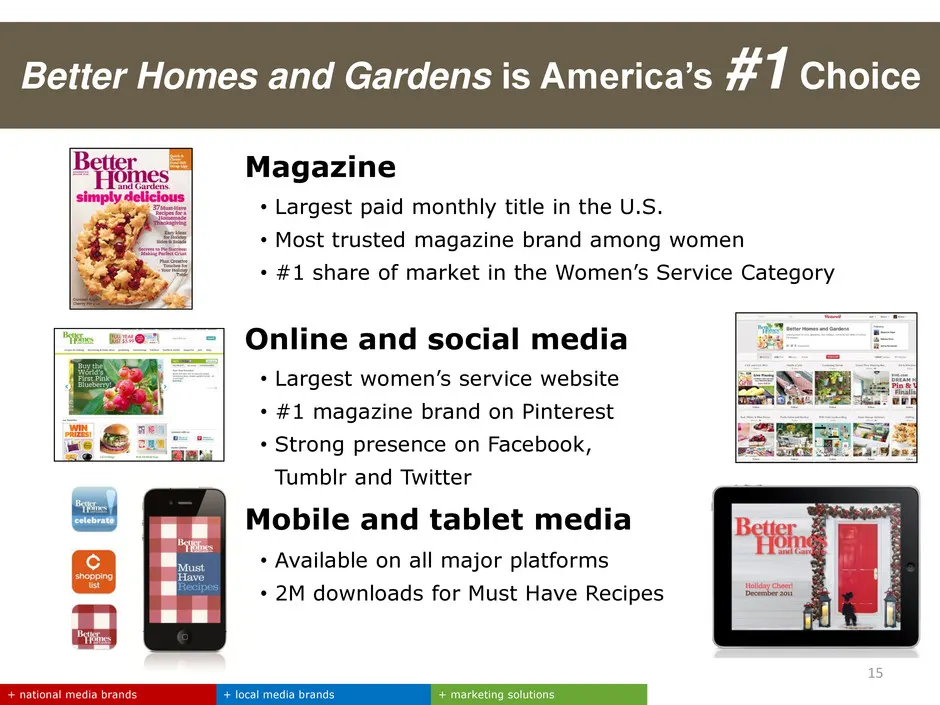
15 Better Homes and Gardens is America’s #1 Choice Magazine • Largest paid monthly title in the U.S. • Most trusted magazine brand among women • #1 share of market in the Women’s Service Category Online and social media • Largest women’s service website • #1 magazine brand on Pinterest • Strong pres
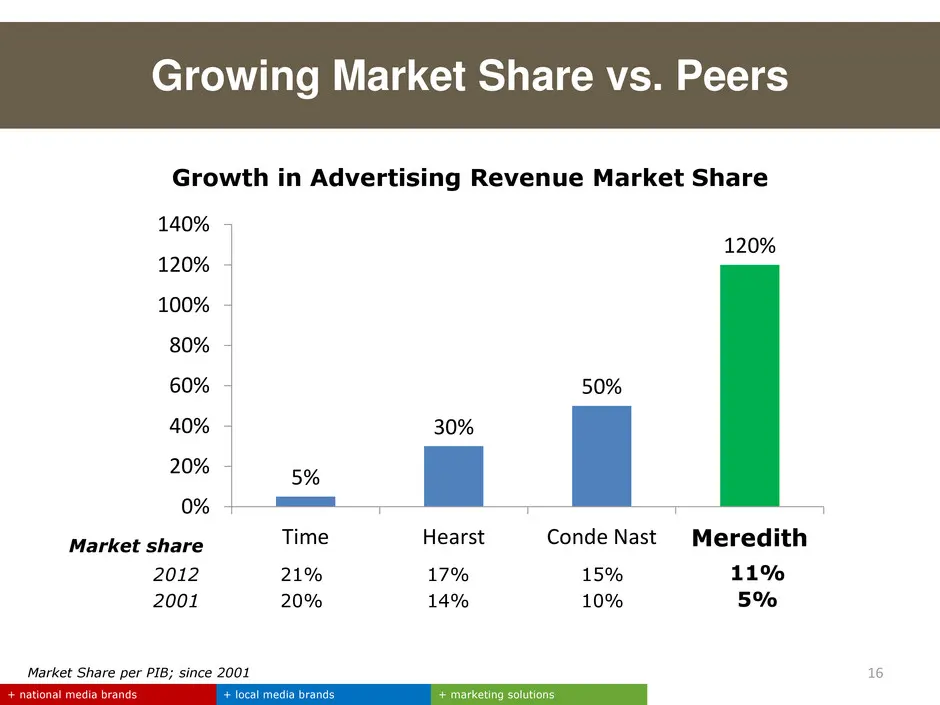
Slide 16: Growing Market Share vs. Peers
Market Share per PIB; since 2001 Growing Market Share vs. Peers + local media brands + marketing solutions + national media brands 16 Growth in Advertising Revenue Market Share 2012 21% 17% 15% 11% 2001 20% 14% 10% 5% Market share 5% 30% 50% 120% 0% 20% 40% 60% 80% 100% 120% 140% Time Hearst Conde N
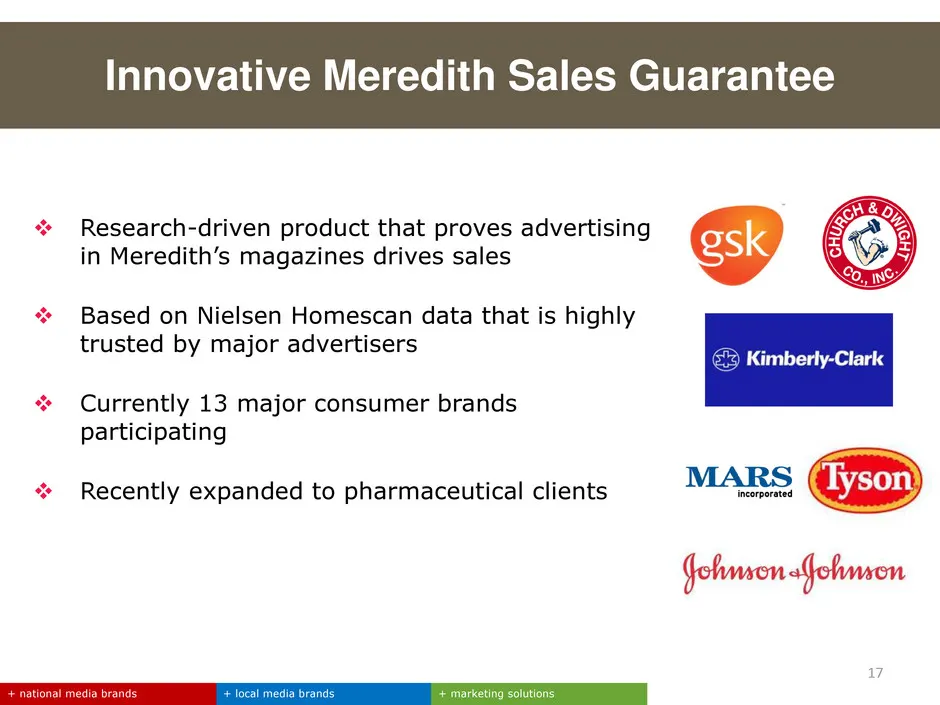
Slide 17: Innovative Meredith Sales Guarantee
+ local media brands + marketing solutions + national media brands Innovative Meredith Sales Guarantee Research-driven product that proves advertising in Meredith’s magazines drives sales Based on Nielsen Homescan data that is highly trusted by major advertisers Currently 13 major consumer bra
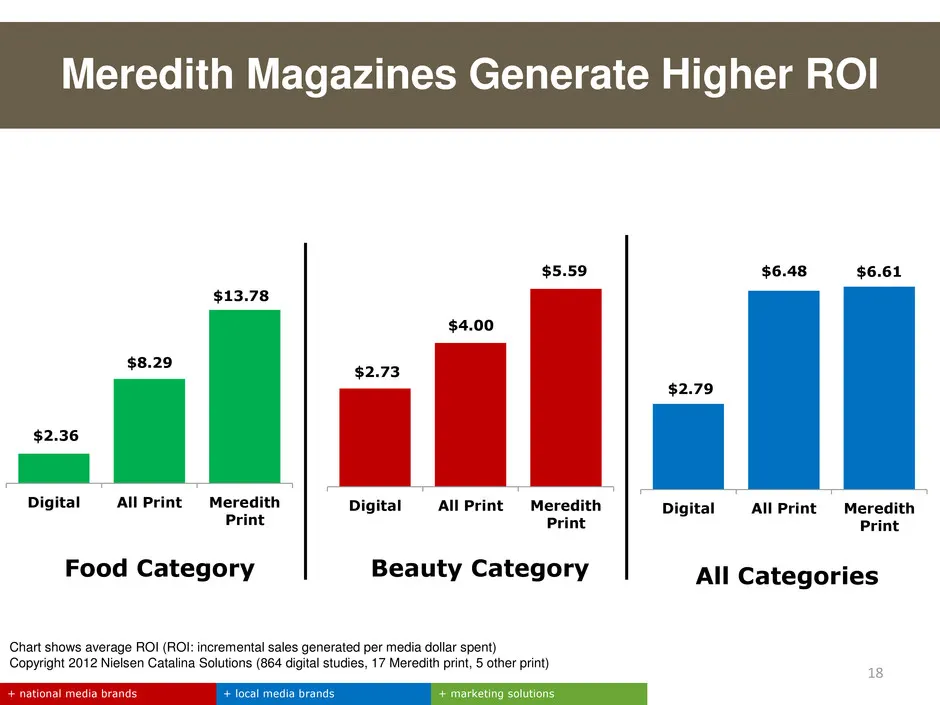
Slide 18: Meredith Magazines Generate Higher ROI
Meredith Magazines Generate Higher ROI 18 $2.79 $6.48 $6.61 Digital All Print Meredith Print $2.36 $8.29 Digital All Print Meredith Print All Categories Food Category $2.73 $4.00 $5.59 Digital All Print Meredith Print Beauty Category Chart shows average ROI (ROI: incremental sales generated per medi
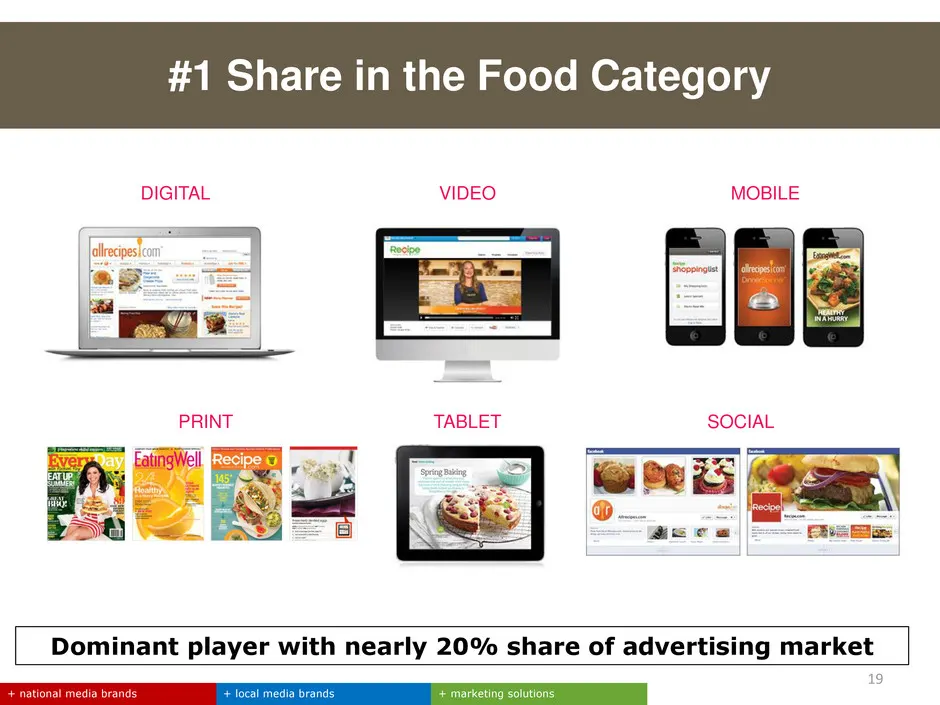
Slide 19: #1 Share in the Food Category
DIGITAL VIDEO MOBILE PRINT TABLET SOCIAL 19 #1 Share in the Food Category + local media brands + marketing solutions + national media brands Dominant player with nearly 20% share of advertising market
Slide 20: #1 Share in the Parenthood Category
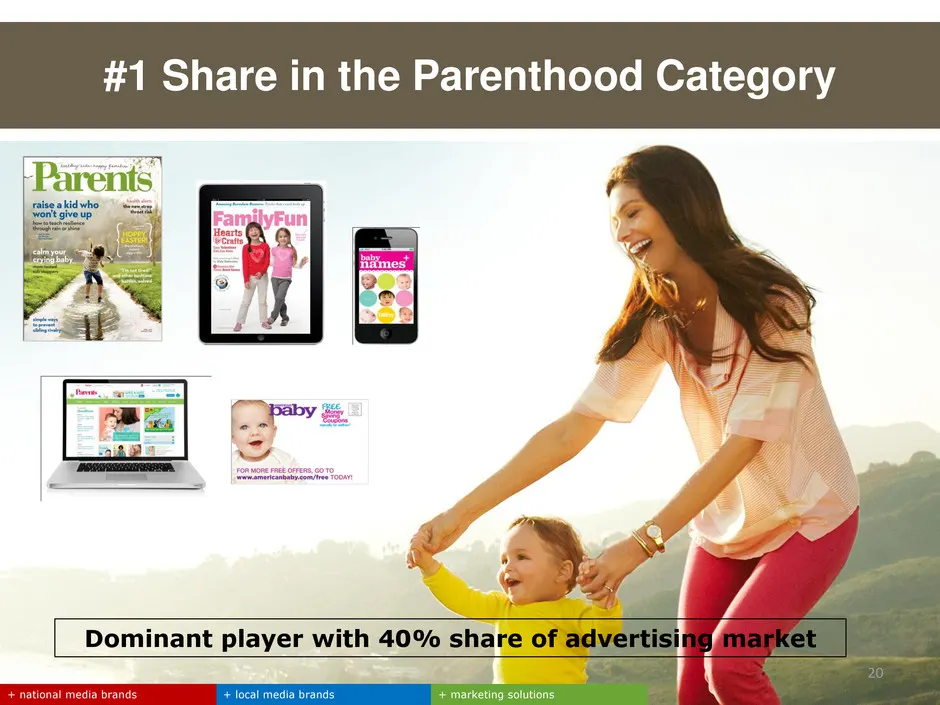
#1 Share in the Parenthood Category Dominant player with 40% share of advertising market + local media brands + marketing solutions + national media brands 20
Slide 21: #1 Share in the Home Category
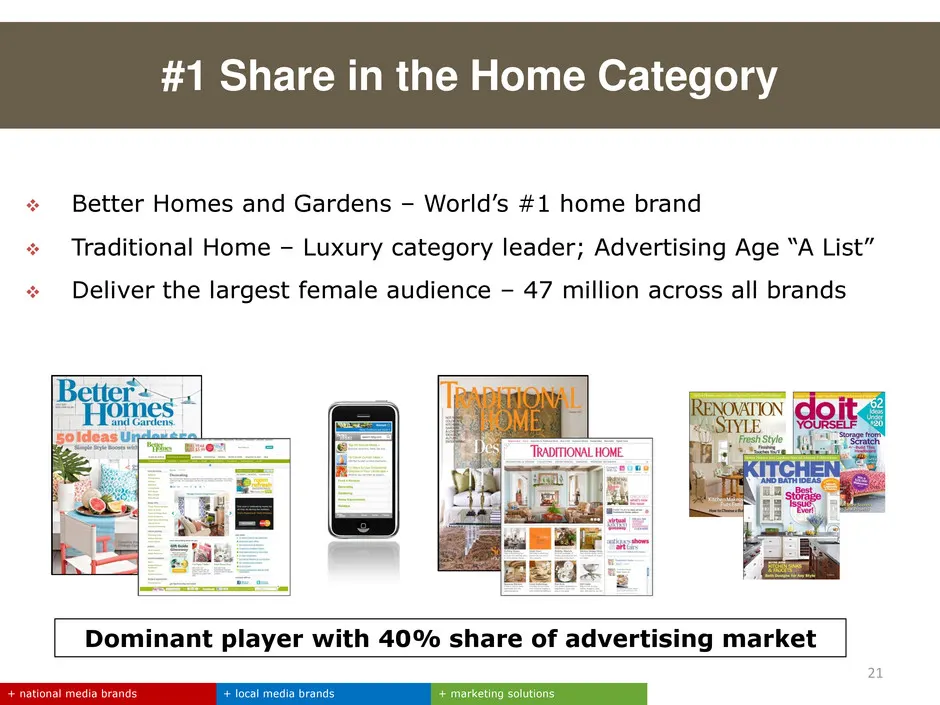
21 #1 Share in the Home Category Dominant player with 40% share of advertising market + local media brands + marketing solutions + national media brands Better Homes and Gardens – World’s #1 home brand Traditional Home – Luxury category leader; Advertising Age ―A List‖ Deliver the largest fema
Slide 22: #1 Share in the Hispanic Category
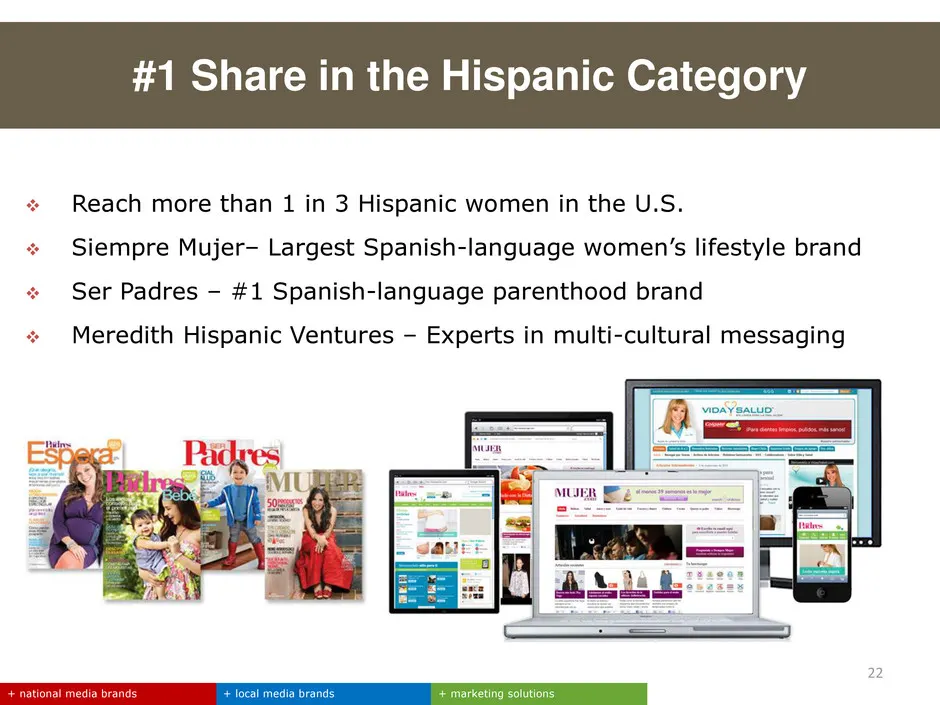
22 #1 Share in the Hispanic Category + local media brands + marketing solutions + national media brands Reach more than 1 in 3 Hispanic women in the U.S. Siempre Mujer– Largest Spanish-language women’s lifestyle brand Ser Padres – #1 Spanish-language parenthood brand Meredith Hispanic Ventur
Slide 23: Increasing Reach to Fast-Growing Ad Categories
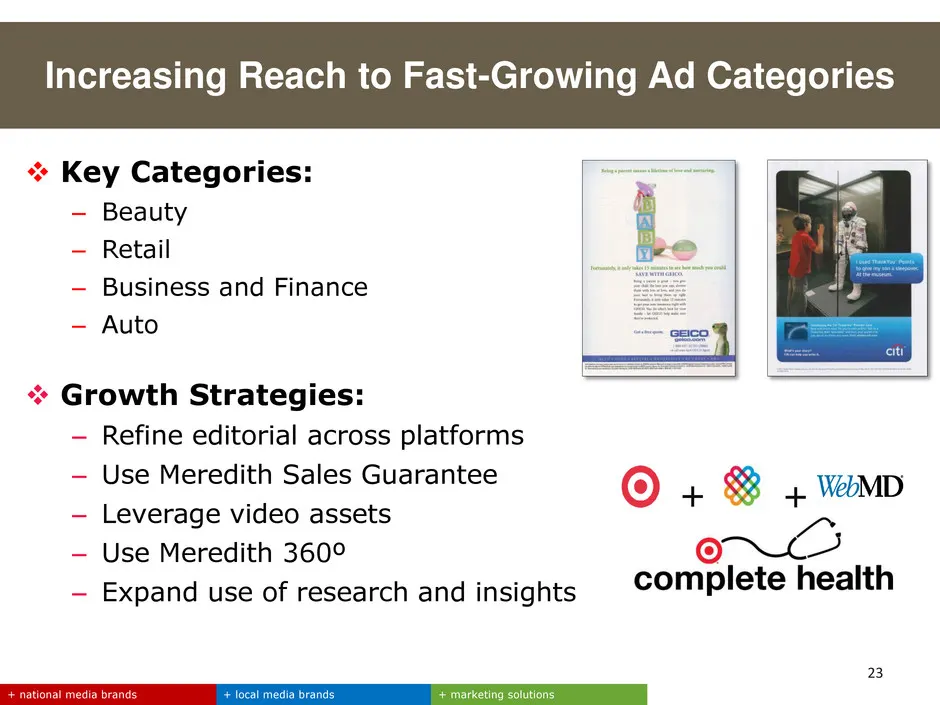
23 Key Categories: – Beauty – Retail – Business and Finance – Auto Growth Strategies: – Refine editorial across platforms – Use Meredith Sales Guarantee – Leverage video assets – Use Meredith 360º – Expand use of research and insights Increasing Reach to Fast-Growing Ad Categories + local media
Slide 24: Expanding Brand Licensing Activities
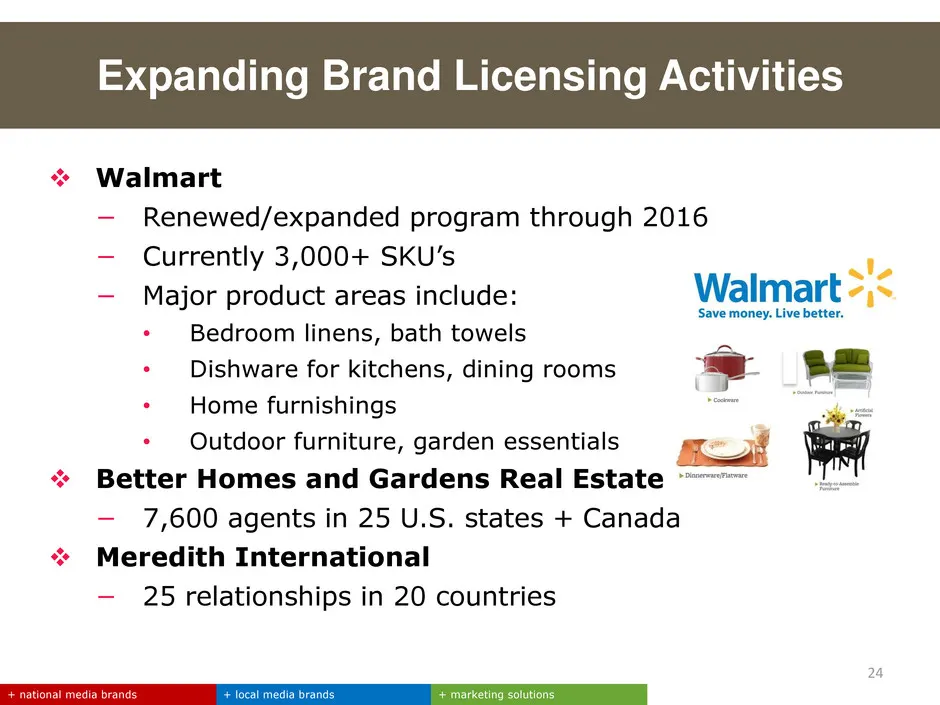
Walmart − Renewed/expanded program through 2016 − Currently 3,000+ SKU’s − Major product areas include: • Bedroom linens, bath towels • Dishware for kitchens, dining rooms • Home furnishings • Outdoor furniture, garden essentials Better Homes and Gardens Real Estate − 7,600 agents in 25 U.S. sta
Slide 25: Meredith Women's Network
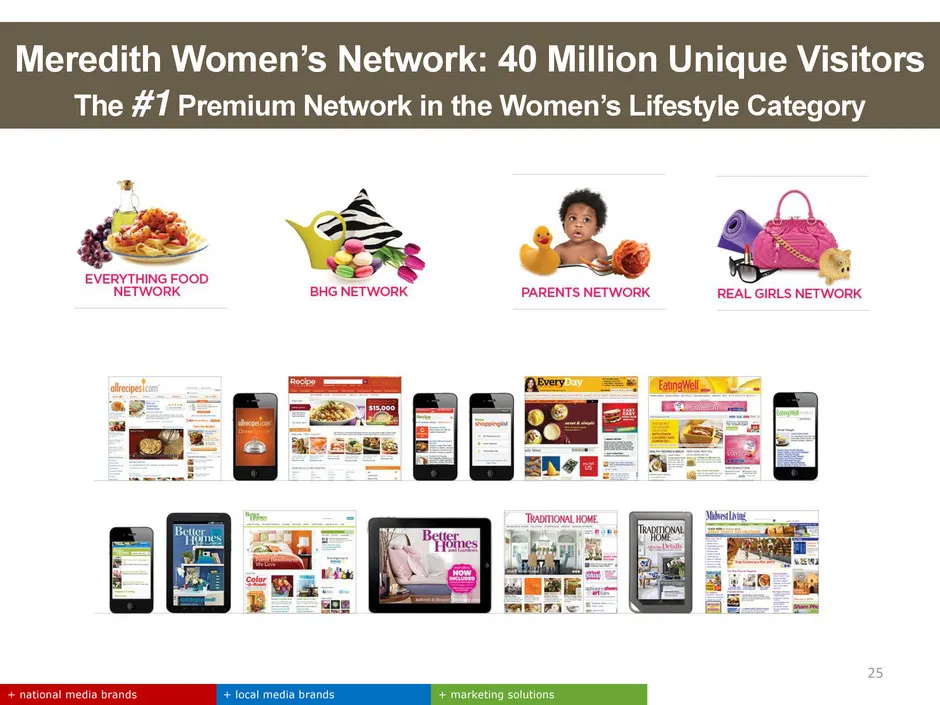
+ local media brands + marketing solutions + national media brands 25 Meredith Women’s Network: 40 Million Unique Visitors The #1 Premium Network in the Women’s Lifestyle Category
Slide 26: #1 Food Brand in the World
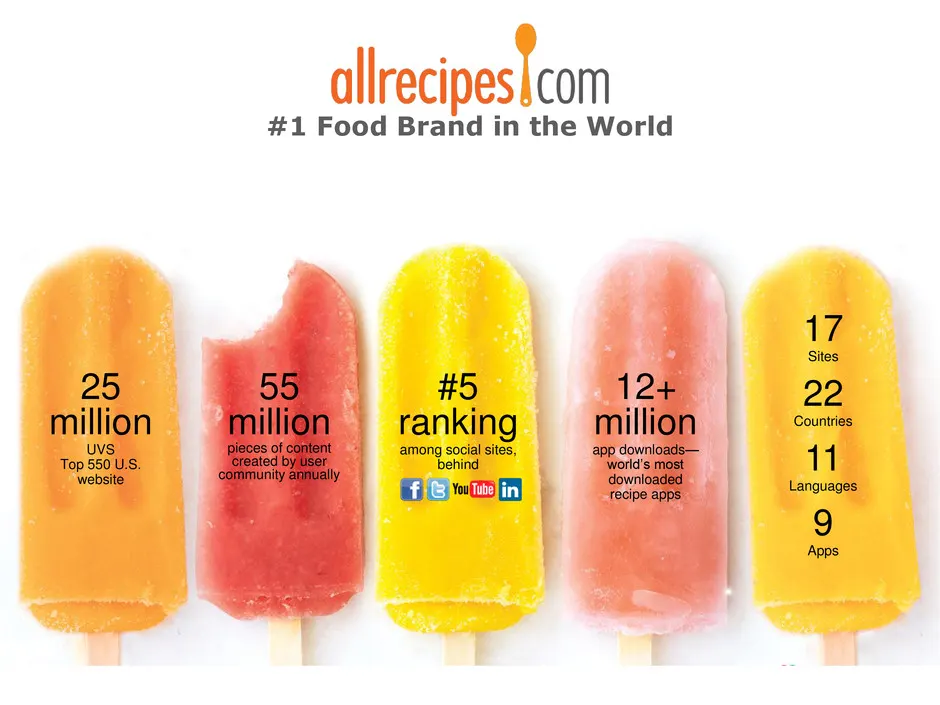
#1 Food Brand in the World 25 million UVS Top 550 U.S. website 55 million pieces of content created by user community annually #5 ranking among social sites, behind 12+ million app downloads— world’s most downloaded recipe apps 17 Sites 22 Countries 11 Languages 9 Apps
Slide 27: Why Grow Meredith's Food Category Online?
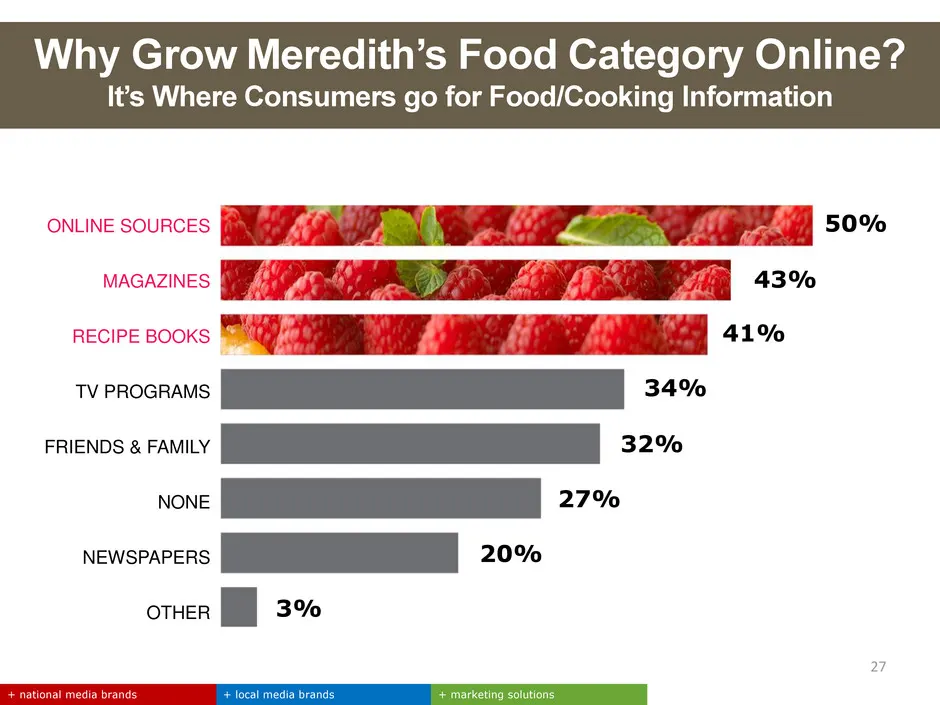
ONLINE SOURCES MAGAZINES RECIPE BOOKS TV PROGRAMS FRIENDS & FAMILY NONE NEWSPAPERS OTHER 34% 32% 27% 20% 3% + local media brands + marketing solutions + national media brands 27 50% 41% 32% 20% 43% 34% 27% 3% Why Grow Meredith’s Food Category Online? It’s Where Consumers go for Food/Cooking Informat
Slide 28: Scale Player in Digital Food + Women's Lifestyle
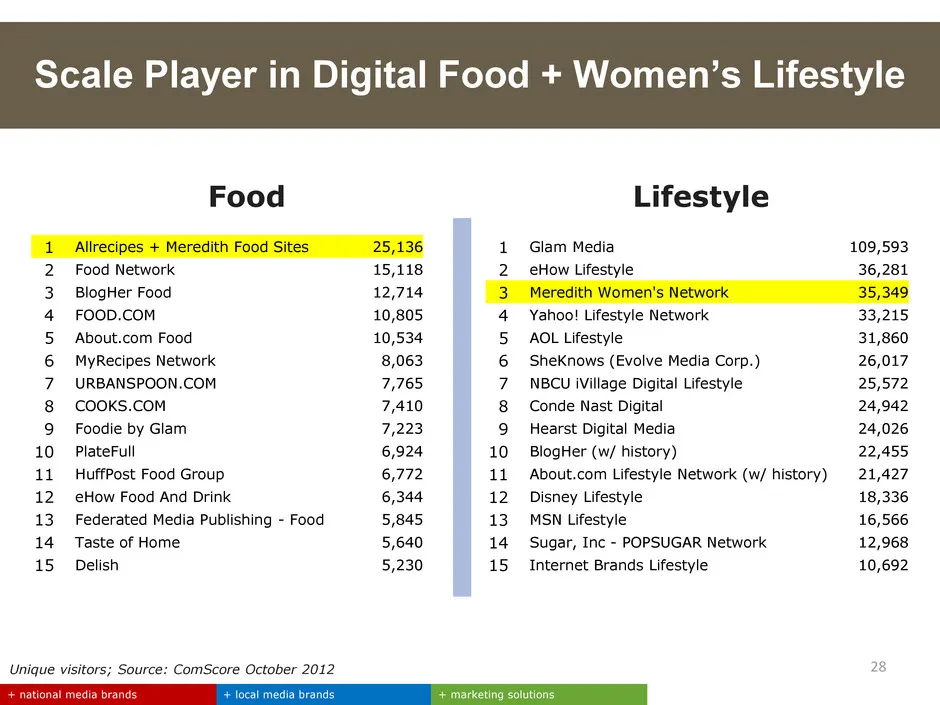
1 Allrecipes + Meredith Food Sites 25,136 1 Glam Media 109,593 2 Food Network 15,118 2 eHow Lifestyle 36,281 3 BlogHer Food 12,714 3 Meredith Women's Network 35,349 4 FOOD.COM 10,805 4 Yahoo! Lifestyle Network 33,215 5 About.com Food 10,534 5 AOL Lifestyle 31,860 6 MyRecipes Network 8,063 6 SheKnows
Slide 29: Allrecipes.com is Growing Across Platforms
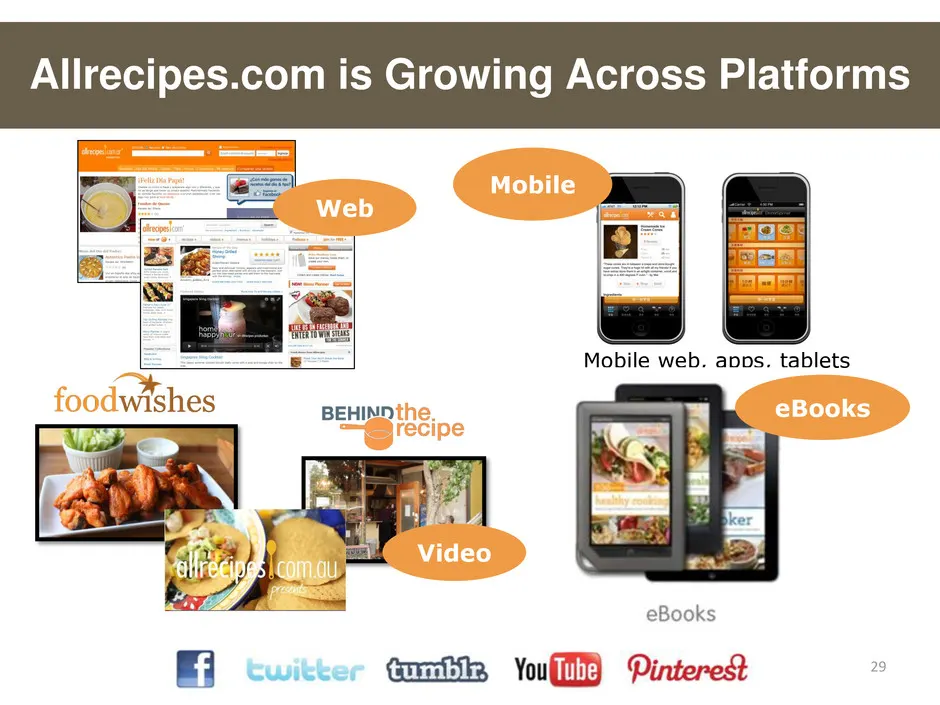
Mobile web, apps, tablets Web Mobile Video eBooks Allrecipes.com is Growing Across Platforms 29

Slide 30: Placeholder for Allrecipes/Microsoft video
Placeholder for Allrecipes/Microsoft video
Slide 31: Growing Mobile & Tablet Presence
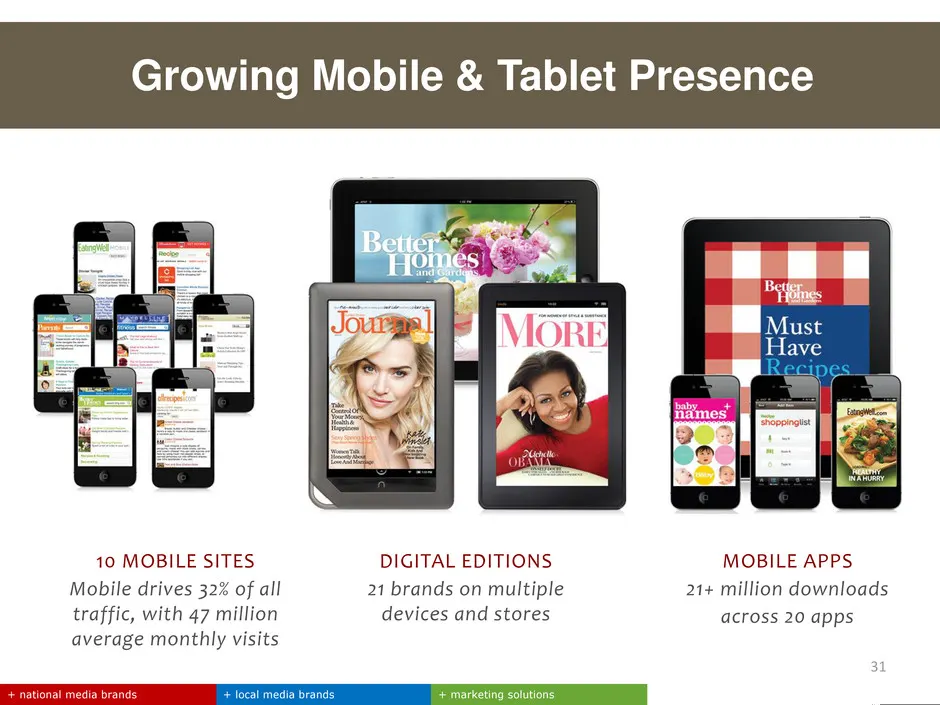
Growing Mobile & Tablet Presence + local media brands + marketing solutions + national media brands 31 10 MOBILE SITES Mobile drives 32% of all traffic, with 47 million average monthly visits DIGITAL EDITIONS 21 brands on multiple devices and stores MOBILE APPS 21+ million downloads across 20 apps
Slide 32: Migrating Consumer Transactions Online
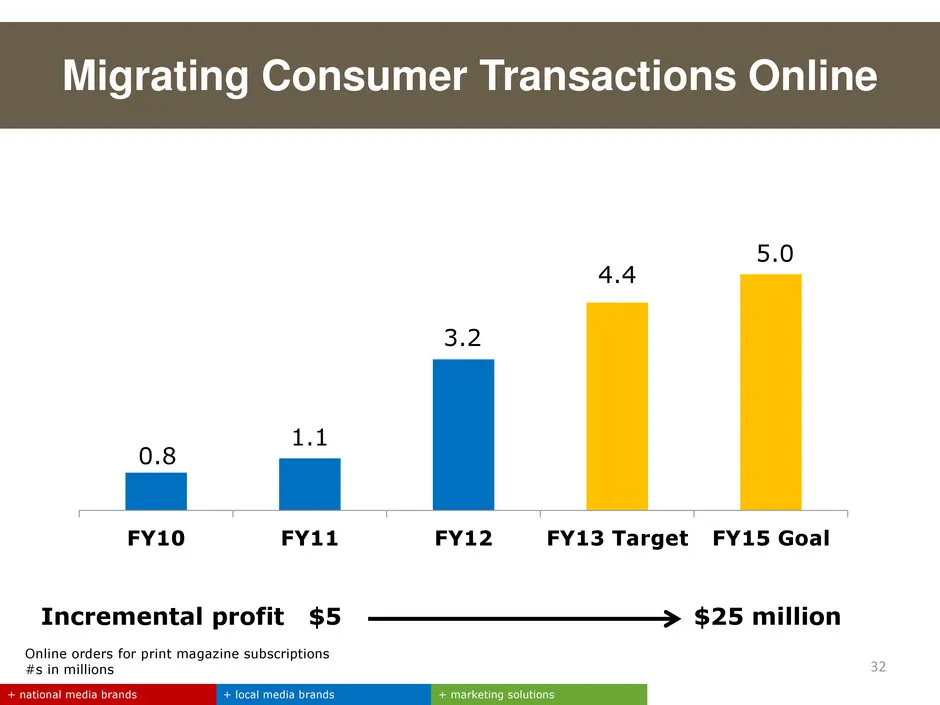
+ local media brands + marketing solutions + national media brands Migrating Consumer Transactions Online 0.8 1.1 3.2 4.4 5.0 FY10 FY11 FY12 FY13 Target FY15 Goal Online orders for print magazine subscriptions #s in millions 32 Incremental profit $5 $25 million
Slide 33: Meredith Xcelerated Marketing
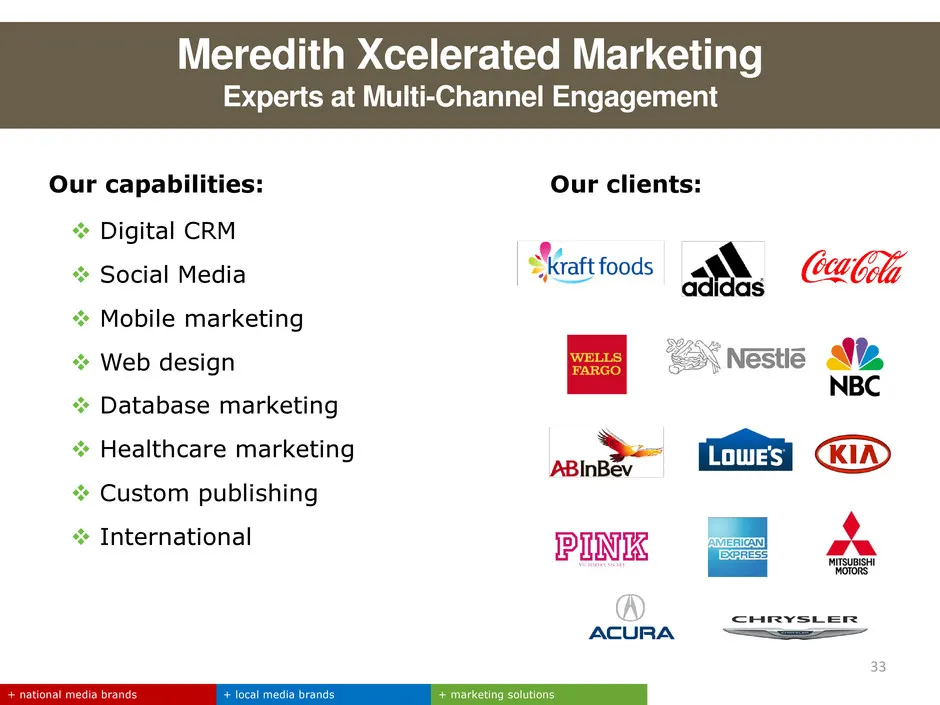
+ local media brands + marketing solutions + national media brands Our capabilities: Digital CRM Social Media Mobile marketing Web design Database marketing Healthcare marketing Custom publishing International Our clients: 33 Meredith Xcelerated Marketing Experts at Multi-Channel Eng
Slide 34: Lowe's Creative Ideas Marketing Engine
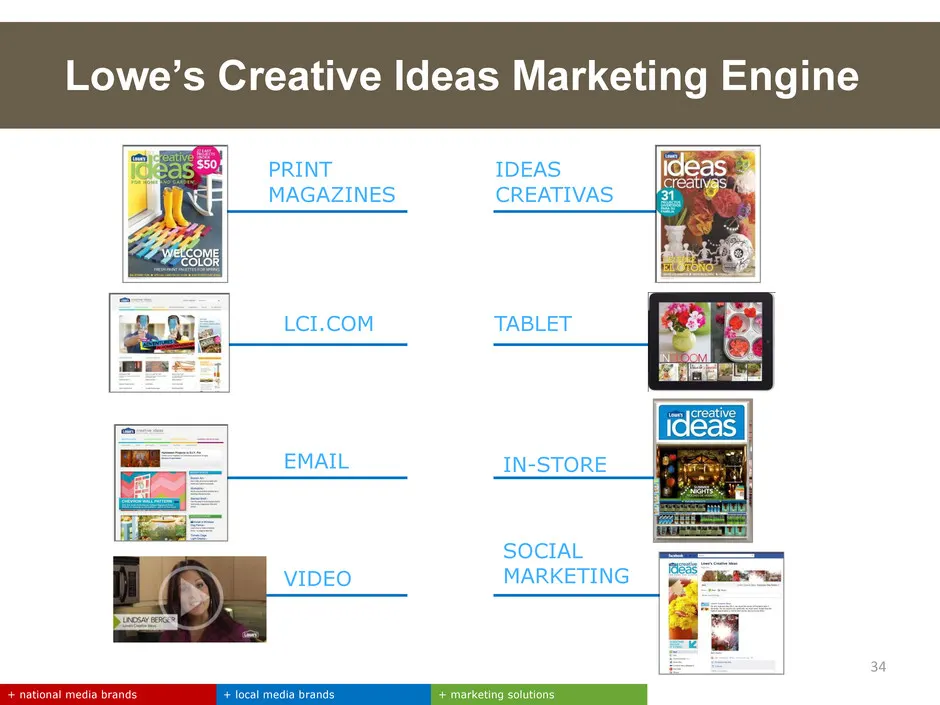
EMAIL IN-STORE PRINT MAGAZINES LCI.COM TABLET Lowe’s Creative Ideas Marketing Engine VIDEO SOCIAL MARKETING + local media brands + marketing solutions + national media brands IDEAS CREATIVAS 34

Slide 35: Placeholder for Hartford video
Placeholder for Hartford video
Slide 36: Agenda: Local Media Group Key Initiatives
+ local media brands + marketing solutions + national media brands Agenda Meredith Overview Key Initiatives: National Media Group Key Initiatives: Local Media Group — Growing ratings to drive rates — Continuing non-political advertising growth — Capitalizing on political advertising opportunit
Slide 37: Growing Ratings to Drive Advertising Rates
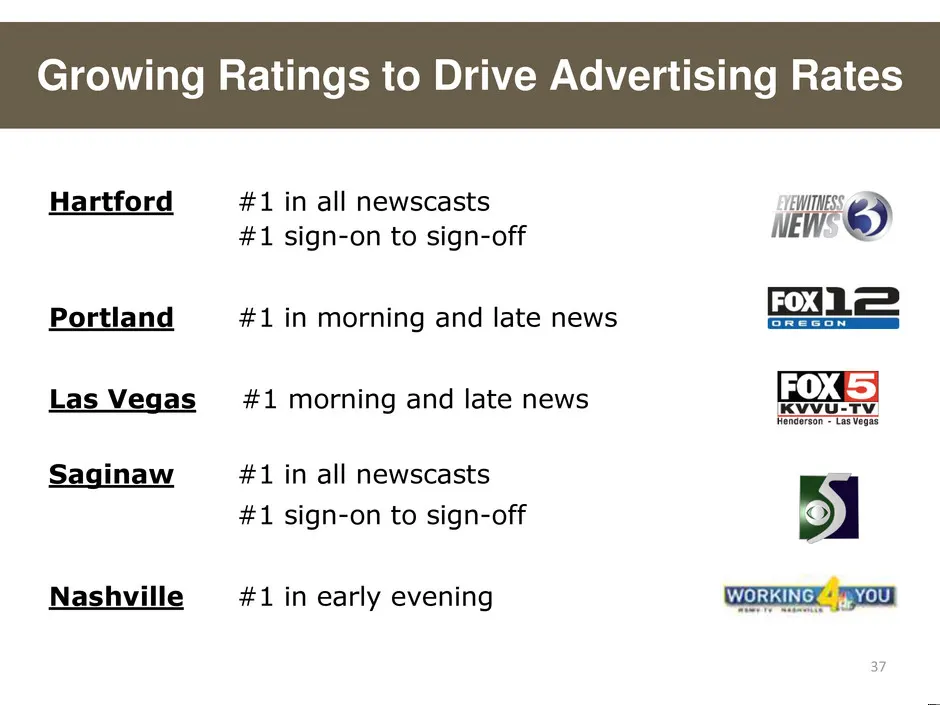
Growing Ratings to Drive Advertising Rates Hartford #1 in all newscasts #1 sign-on to sign-off Portland #1 in morning and late news Las Vegas #1 morning and late news Saginaw #1 in all newscasts #1 sign-on to sign-off Nashville #1 in early evening 37
Slide 38: Strong Non-Political Advertising Growth
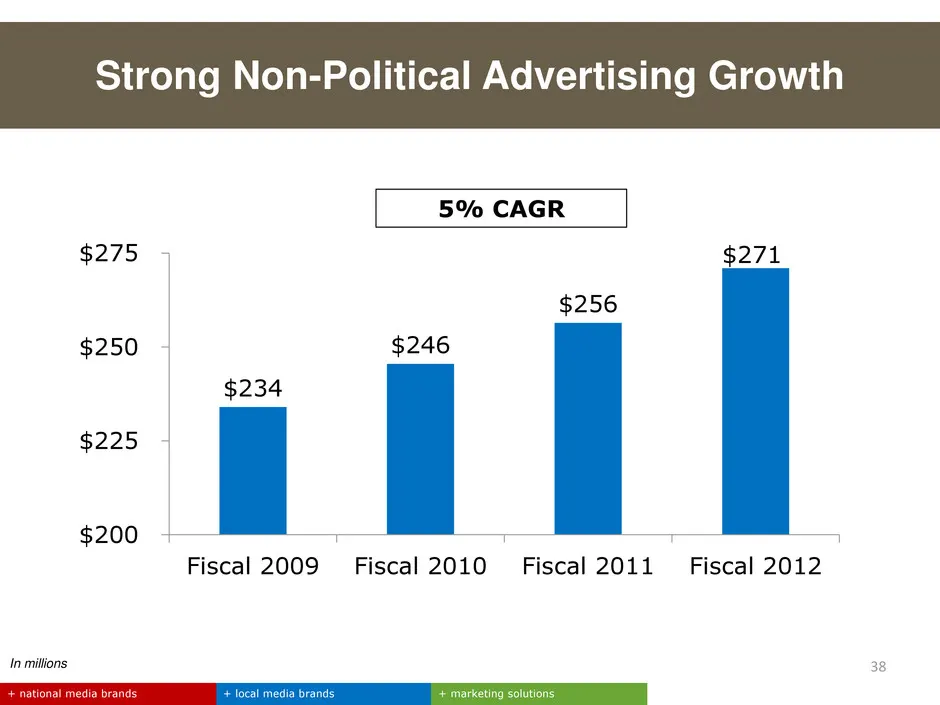
Strong Non-Political Advertising Growth + local media brands + marketing solutions + national media brands In millions 38 $234 $246 $256 $200 $225 $250 $275 Fiscal 2009 Fiscal 2010 Fiscal 2011 Fiscal 2012 $271 5% CAGR
Slide 39: Auto & Professional Services Driving Growth
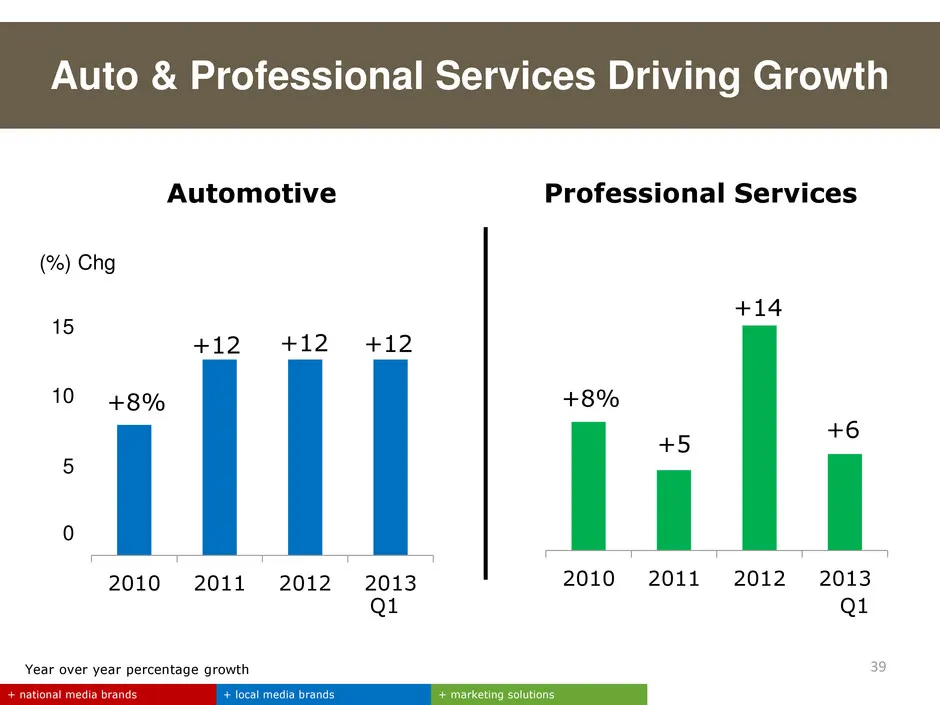
Auto & Professional Services Driving Growth +8% +5 +14 +6 2010 2011 2012 2013 + local media brands + marketing solutions + national media brands Automotive Professional Services Year over year percentage growth +8% +12 +12 +12 2010 2011 2012 2013 Q1 Q1 39 (%) Chg 5 15 10 0
Slide 40: Political Advertising Results
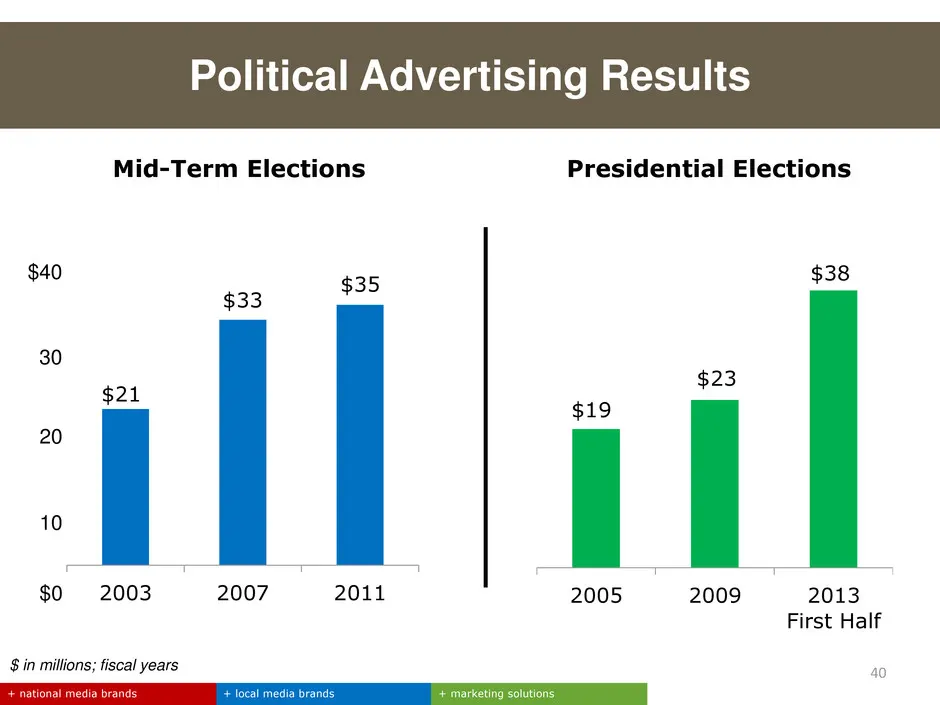
2003 2007 2011 $21 $33 $35 2005 2009 2013 First Half $19 $23 Mid-Term Elections Presidential Elections $ in millions; fiscal years $38 Political Advertising Results 40 + local media brands + marketing solutions + national media brands 20 10 $0 $40 30
Slide 41: Network Affiliation Update
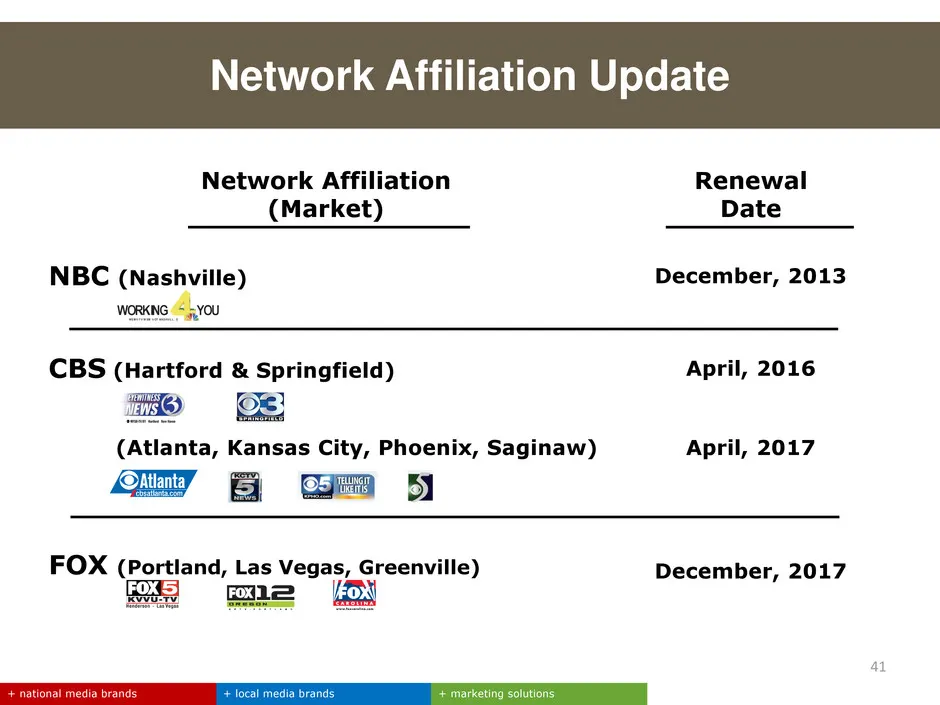
Network Affiliation (Market) Renewal Date NBC (Nashville) December, 2013 CBS (Hartford & Springfield) April, 2016 (Atlanta, Kansas City, Phoenix, Saginaw) April, 2017 FOX (Portland, Las Vegas, Greenville) December, 2017 Network Affiliation Update + local media brands + marketing solutions + national
Slide 42: Agenda: Financial Strategy
+ local media brands + marketing solutions + national media brands Agenda Meredith Overview Key Initiatives: National Media Group Key Initiatives: Local Media Group Financial Strategy 42
Slide 43: Meredith's Goal: Approach Top Quartile TSR
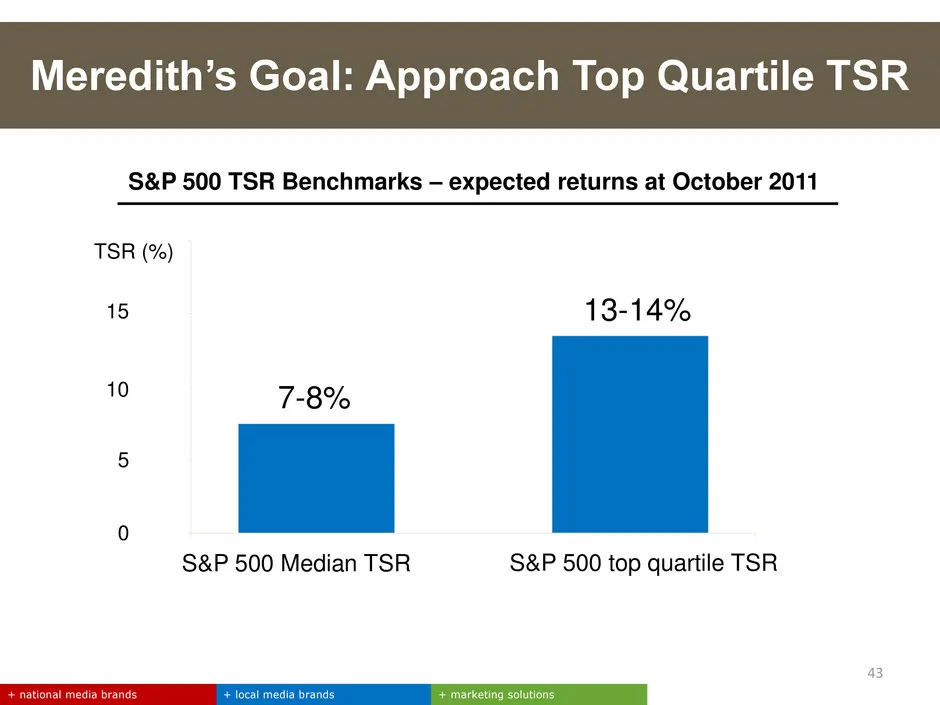
TSR (%) 5 15 10 0 13-14% 7-8% S&P 500 Median TSR S&P 500 top quartile TSR S&P 500 TSR Benchmarks – expected returns at October 2011 Meredith’s Goal: Approach Top Quartile TSR + local media brands + marketing solutions + national media brands 43
Slide 44: Meredith's View of Total Shareholder Return
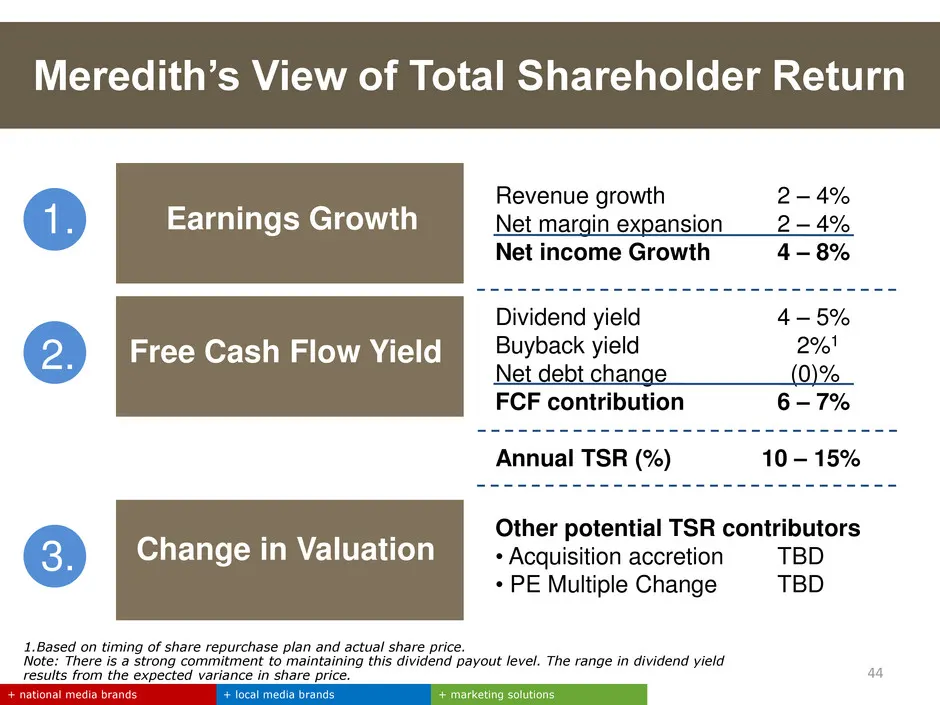
Revenue growth 2 – 4% Net margin expansion 2 – 4% Net income Growth 4 – 8% 1.Based on timing of share repurchase plan and actual share price. Note: There is a strong commitment to maintaining this dividend payout level. The range in dividend yield results from the expected variance in share price. +
Slide 45: Earnings Per Share (Historical and Forecast)
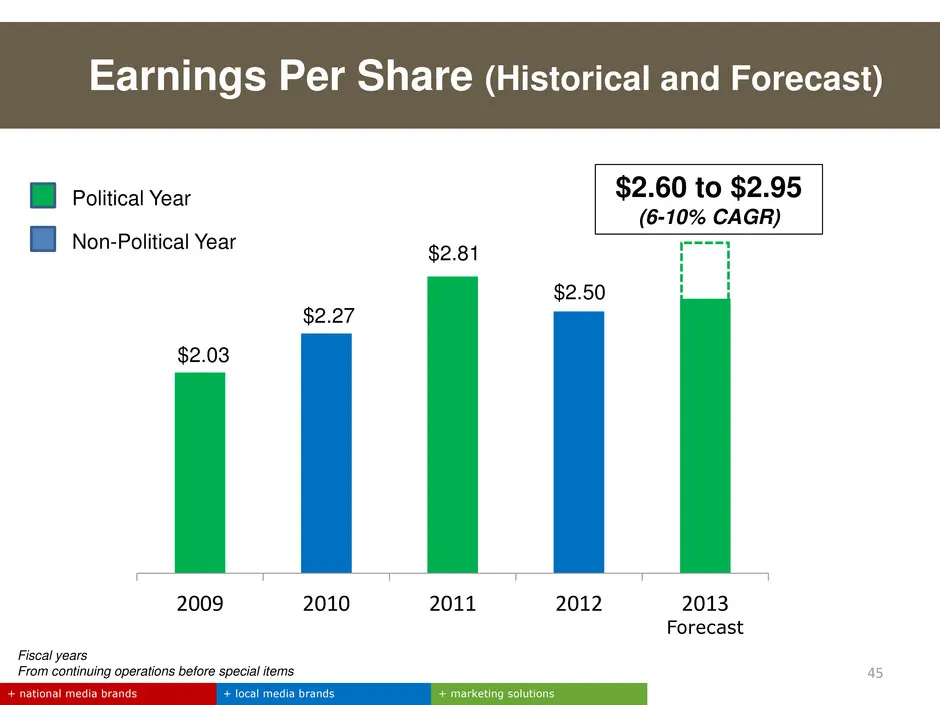
45 Fiscal years From continuing operations before special items 2009 2010 2011 2012 2013 $2.03 $2.27 $2.81 $2.50 $2.60 to $2.95 (6-10% CAGR) Forecast + local media brands + marketing solutions + national media brands Earnings Per Share (Historical and Forecast) Non-Political Year Political Year
Slide 46: History of Returning Capital to Shareholders
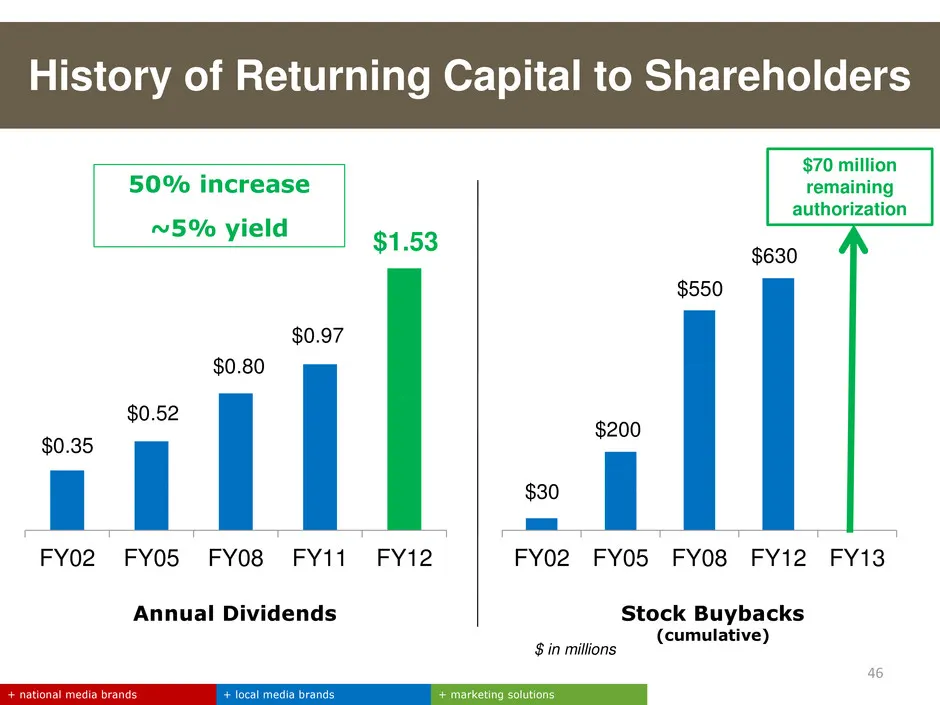
46 History of Returning Capital to Shareholders + local media brands + marketing solutions + national media brands $30 $200 $550 $630 FY02 FY05 FY08 FY12 FY13 $70 million remaining authorization $0.35 $0.52 $0.80 $0.97 $1.53 FY02 FY05 FY08 FY11 FY12 Annual Dividends Stock Buybacks (cumulative) $ in
Slide 47: Cash Flow and Strategic Uses
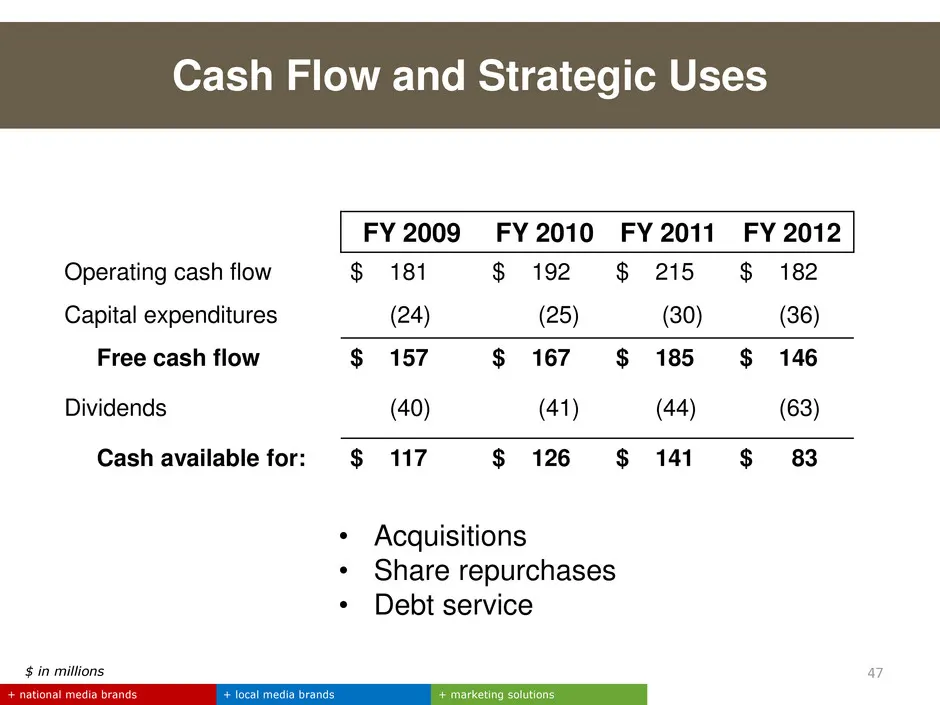
Cash Flow and Strategic Uses + local media brands + marketing solutions + national media brands FY 2009 FY 2010 FY 2011 FY 2012 Operating cash flow $ 181 $ 192 $ 215 $ 182 Capital expenditures (24) (25) (30) (36) Free cash flow $ 157 $ 167 $ 185 $ 146 Dividends (40) (41) (44) (63) Cash available for
Slide 48: Use of Cash: Fiscal 2002 to Fiscal 2012
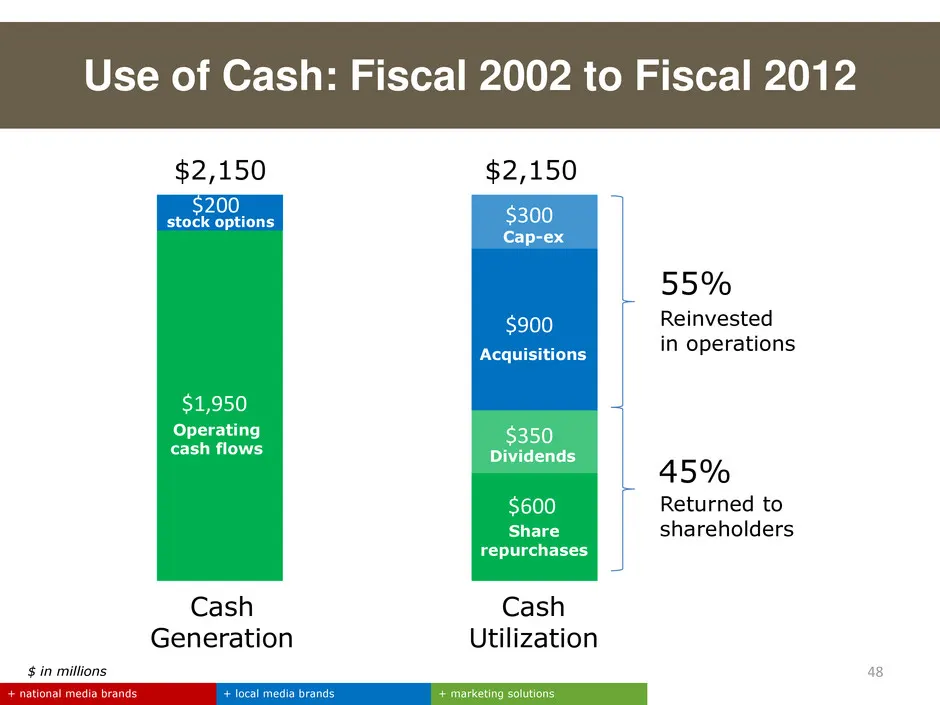
48 + local media brands + marketing solutions + national media brands $ in millions $1,900 $200 $1,950 $200 Cash Generation Cash Utilization $2,150 $2,150 $600 $350 Dividends $300 $900 Share repurchases Acquisitions Cap-ex Operating cash flows stock options 45% 55% Reinvested in operations Returned
Slide 49: Year 1 TSR Results: Approaching Top Quartile
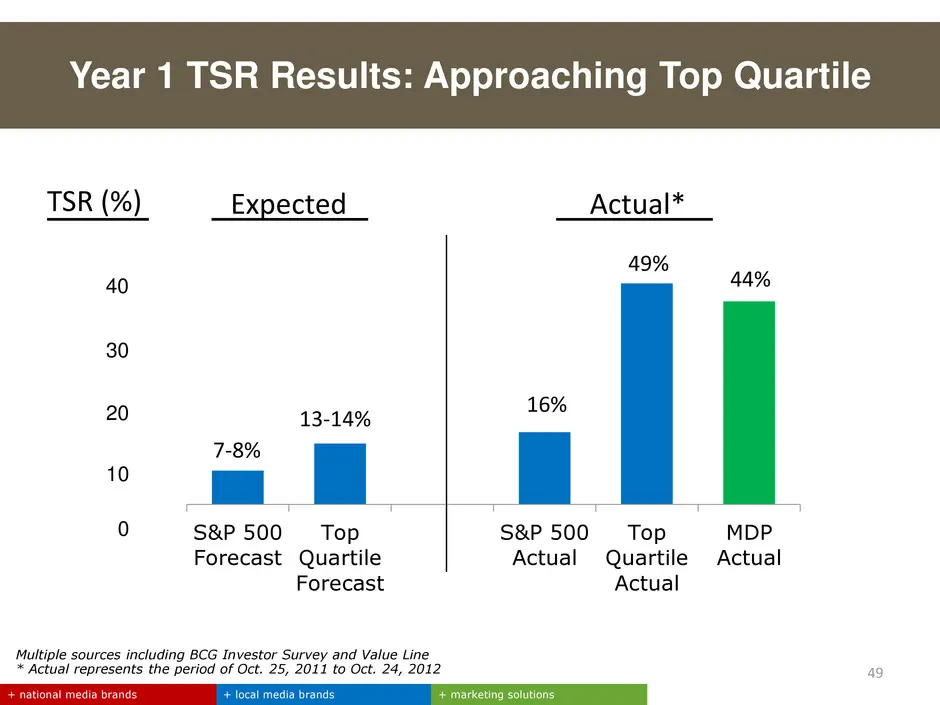
TSR (%) 10 30 20 0 Multiple sources including BCG Investor Survey and Value Line * Actual represents the period of Oct. 25, 2011 to Oct. 24, 2012 Year 1 TSR Results: Approaching Top Quartile + local media brands + marketing solutions + national media brands 49 S&P 500 Forecast Top Quartile Forecast
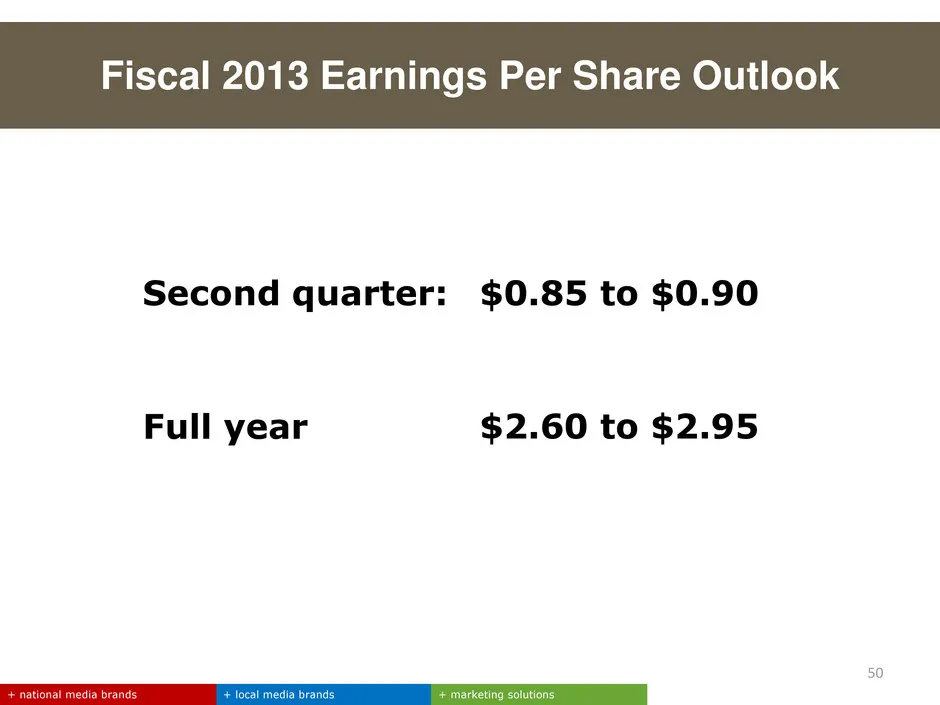
Slide 50: Fiscal 2013 Earnings Per Share Outlook
Fiscal 2013 Earnings Per Share Outlook + local media brands + marketing solutions + national media brands 50 Second quarter: Full year $0.85 to $0.90 $2.60 to $2.95
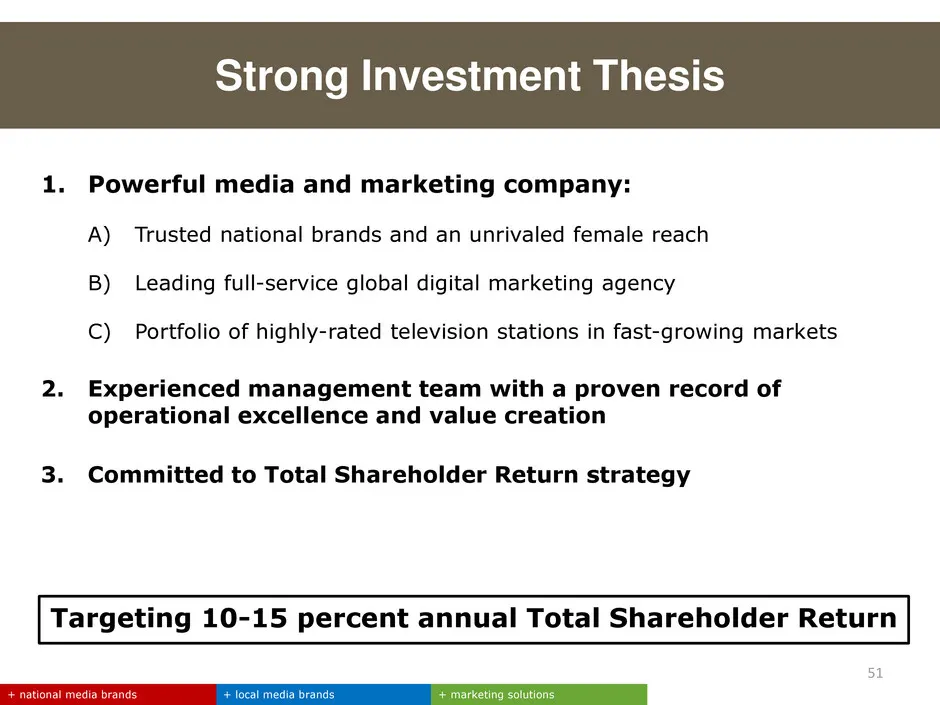
Slide 51: Strong Investment Thesis
1. Powerful media and marketing company: A) Trusted national brands and an unrivaled female reach B) Leading full-service global digital marketing agency C) Portfolio of highly-rated television stations in fast-growing markets 2. Experienced management team with a proven record of operational excell

Slide 52: UBS 40th Annual Global Media and Communications Conference
UBS 40th Annual Global Media and Communications Conference • December 2012
Source: SEC EDGAR · 8-K filed Dec 4, 2012
More decks from Meredith Corporation
 Q4 FY2021 Earnings Presentation20 slides · Aug 12, 2021
 Investor Presentation (June 2021)17 slides · Jun 16, 2021
 Merger or Acquisition (May 2021)15 slides · May 3, 2021
 Citi 2021 Global TMT West Virtual Conference11 slides · Jan 6, 2021
 Q4 FY2020 Earnings Presentation19 slides · Aug 13, 2020
 Q3 FY2020 Earnings Presentation15 slides · May 14, 2020