Bank of Florida — Bancshares of Florida — Investor Presentation (March 2006)
32 slides from Bank of Florida's investor presentation, Mar 7, 2006
Slide 1: Bancshares of Florida, Inc. Investor Presentation
Bancshares of Florida, Inc. Investor Presentation Financial Data at 121.05 Walston Data at 2.806 NASDAQ: BOF. | BANCSHARES oF FLORIDA v«
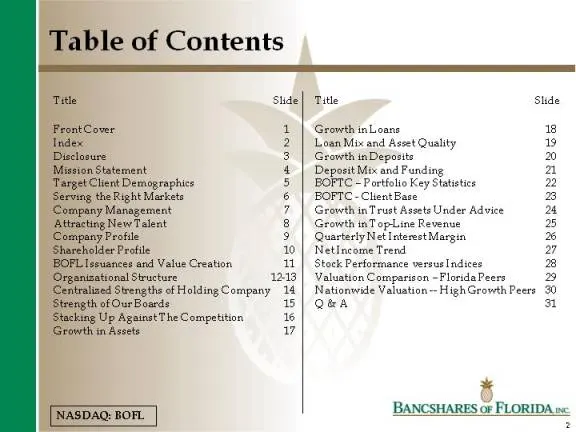
Slide 2: Table of Contents
Table of Contents Title FrontCover 1 Index 2 Disclosure 3 Mission Statement 4 Target Client Demographics 5 Serving the Right Markets 6 ‘Company Management 7 Attracting New Talent Company Profile Shareholder Profile 10 BOFL [seuances and Value Creation a (Organizational Structure 1213 Genlealsed Sten
Slide 3: Disclosure
Disclosure This presentation includes numerous estimates and assumptions. Actual results will vary from the information presented herein and such results may be negative and adverse. This information is presented for discussion purposes only. NASDAQ: BOF. | BANCSHARES oF FLORIDA v«
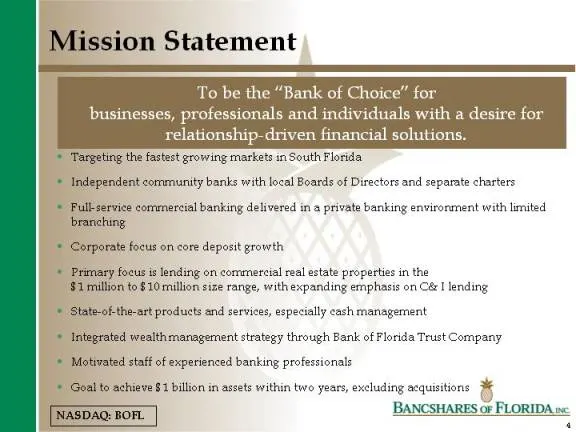
Slide 4: Mission Statement
Mission Statement To be the “Bank of Choice” for businesses, professionals and individuals with a desire for relationship-driven financial solutions. Baerga ie faciest growing markets ie South Fiorvia © Independent community banks with local Boards of Directors and separate charters = Fulkservice co
Slide 5: Target Client Demographics
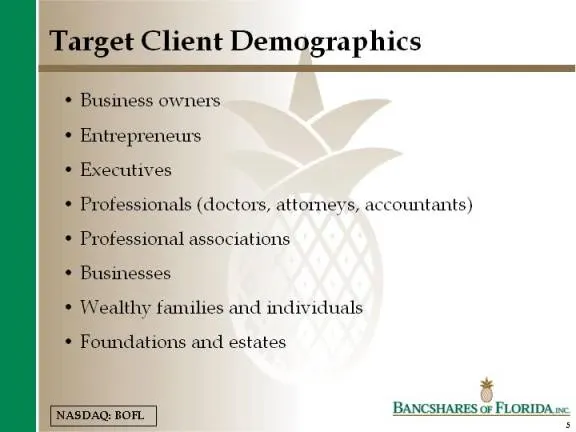
Target Client Demographics * Business owners + Entrepreneurs * Executives * Professionals (doctors, attorneys, accountants) * Professional associations * Businesses * Wealthy families and individuals * Foundations and estates NASDAQ: BOF. | BANCSHARES of FLORIDA ne
Slide 6: Serving The Right Markets
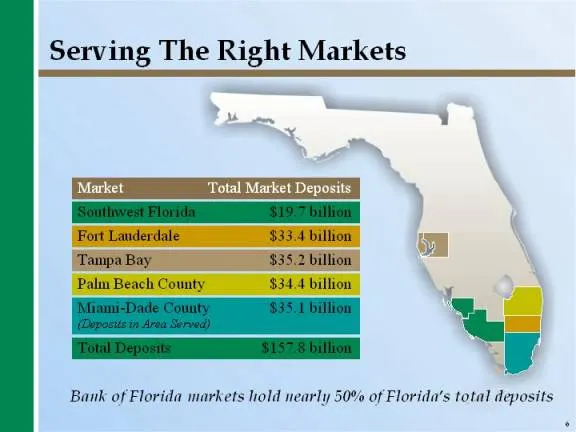
Serving The Right Markets Fort Lauderdale $33.4 billion Tampa Bay $35.2 billion Palm Beach County $34.4 billion er ‘“, 0% of Florida’s total deposits Bank of Florida markets hold nearly
Slide 7: Company Management
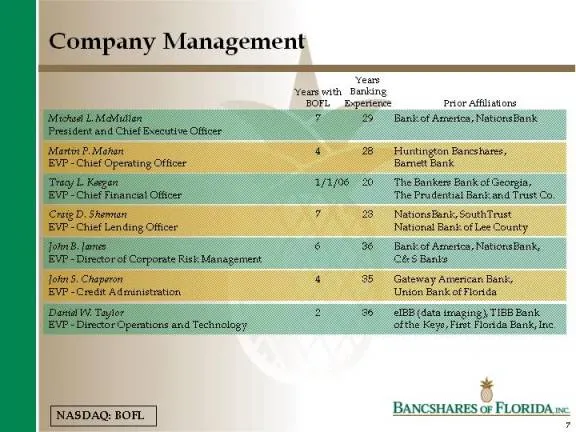
Company Management ews wth parking ‘DOFL Eapertence Prior affstions Marton P. Mohan 4 26 Huntington Bancstaree, [EVE -Chief Operating Orfcer Bamet Bank Crile D. Shoman 7 28 Nationslenk, SouthTrust EVP Chief Lending Otticer [National Bank of Lee County. John 8. Chaperon 4 95 Gateway American Bank, EV
Slide 8: Attracting Talent
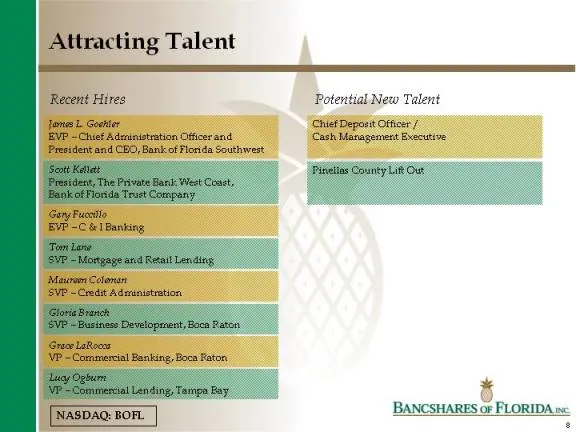
Attracting Talent Recent Hires Potential New Talent Jones L Goehier ‘ChiehDepanit officer / EVE -Chief Aderinistvation Officer and Cash Management Executive President and CBO, Bankof londa Southwest Gary Fuctlo EVP -C& I Banking Moueracs Colon SVP = Credit Administration Grace lakoos VP Commercial B
Slide 9: Company Profile
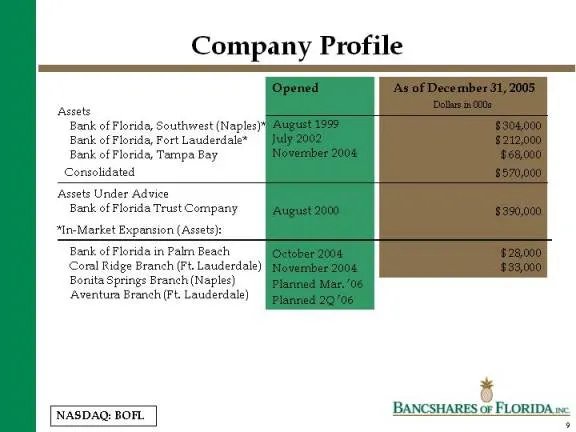
Company Profile Assets Bank of Florida, Southvrest (Naples) Bank of Florida, Fort Lauderdale” Bank of Florida, Tampa Bay Contolidated Assets Under Advice Bank of Florida Trust Company “In-Market Expansion (Assets) Bank of Florida in Palm Beach ‘Coral Ridge Branch (Ft. Lauderdale) Bonita Spring: Bran
Slide 10: Shareholder Profile
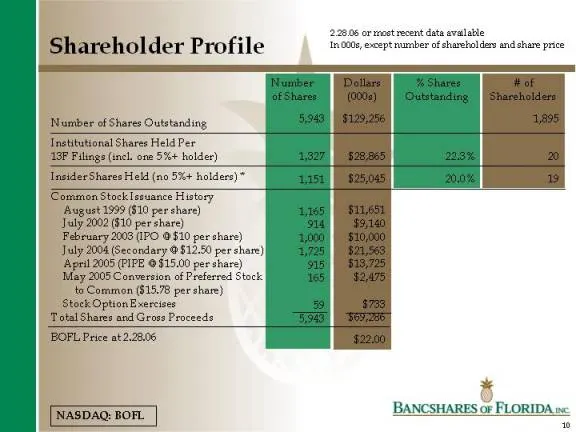
Shareholder Profile Number of Shares Outstanding Tratitutional Shares Held Per AGF Filings (inel. one 5%+ holes) TnelderShaces Held (no 5%+ holders)” Conn Stock Iesuance History ‘August 1999 (610 per share) July 2002 ($10 per share) February 2003 (IPO © $10 per share) July 2004 (Secondary @ $12.50 p
Slide 11: BOFL Issuances and Market Value Creation
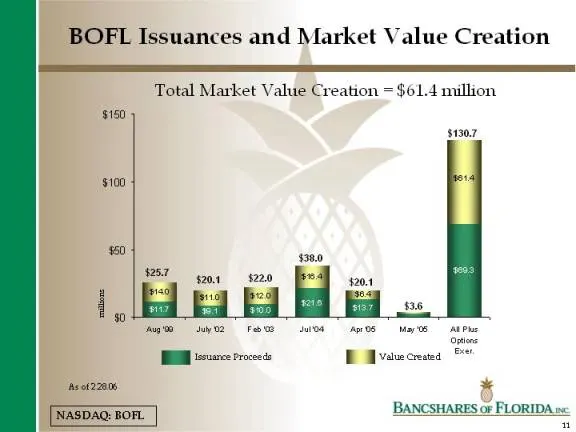
BOFL Issuances and Market Value Creation Total Market Value Creation = $61.4 million $150 $1307, $100 gS Juy02 Fem Jato AOS ayes ALP HB to esrceProseets Bi vane crested BANCSHARES oF FLORIDA ne:
Slide 12: Organizational Structure
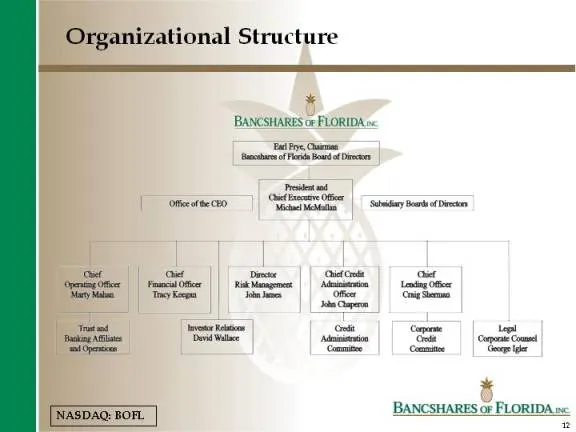
Organizational Structure BANCSHARES of FLORIDA nc Bil Fe Ch tr Fra Ba of a ares Omearsecmn || Celie Oe | — sayfa cn cm out eo Sat soe. ||| teen | | te | | acta See || pte || | cme | aphoms santana ict == os — ta pala Fer pan | | SSS | | cette
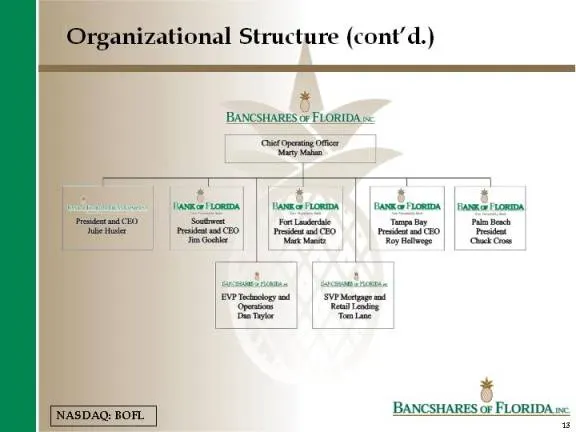
Slide 13: Organizational Structure (cont'd.)
Organizational Structure (cont’d.) BANCSHARES oF FLORIDA w« ‘it Opin Or Taber Freie aod CEO. ‘reed CBO reset an CEO eet NASDAQ: BOF. | BANCSHARES oF FLORIDA ==
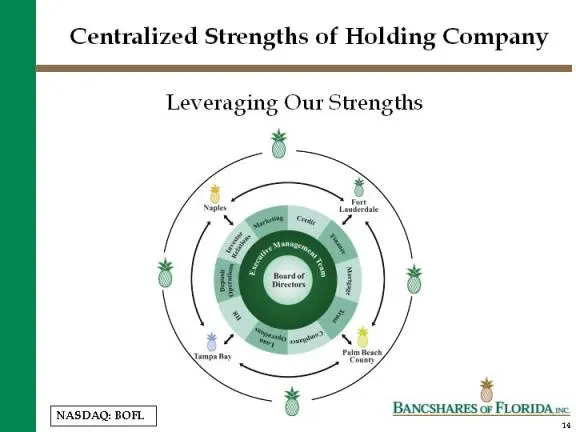
Slide 14: Centralized Strengths of Holding Company
Centralized Strengths of Holding Company Leveraging Our Strengths BANCSHARES oF FLORIDA n= NASDAQ: BOFL
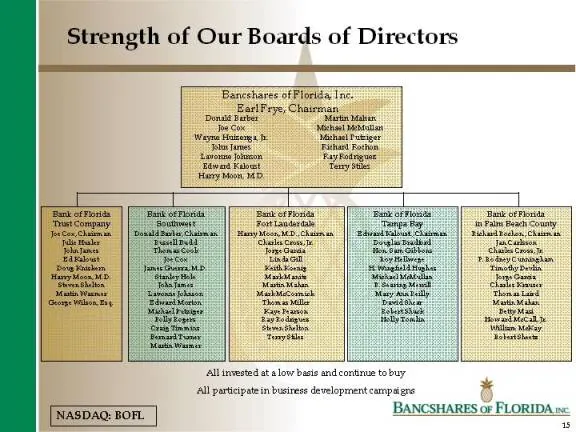
Slide 15: Strength of Our Boards of Directors
Strength of Our Boards of Directors <a Wagga Heng Banssharce of Florida Tae. EarlFeye, Chatman hace ined [NASDAG: TOR. | ‘all nested at alow base and continue tobuy ‘All participate in business development carapaene BANCSHARES oF FLORIDA ne.
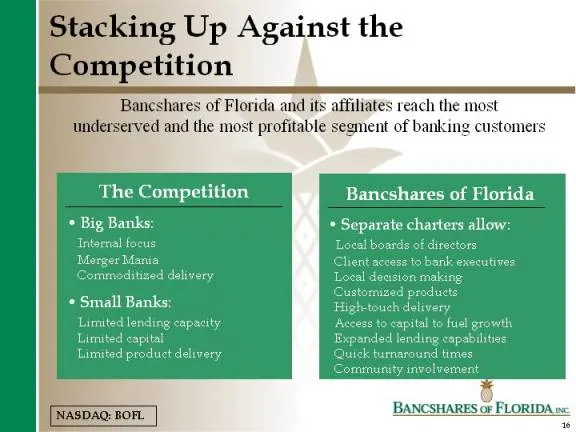
Slide 16: Stacking Up Against the Competition
king Up Against the shares of Florida and its affiliates reach the most ed and the most profitable segment of banking customers The Competition * Big Banks: Internal focus Bancshares of Florida * Separate charters allow: rectors Manger Mania ci ank executives Commo livery ion making oducts © Small B
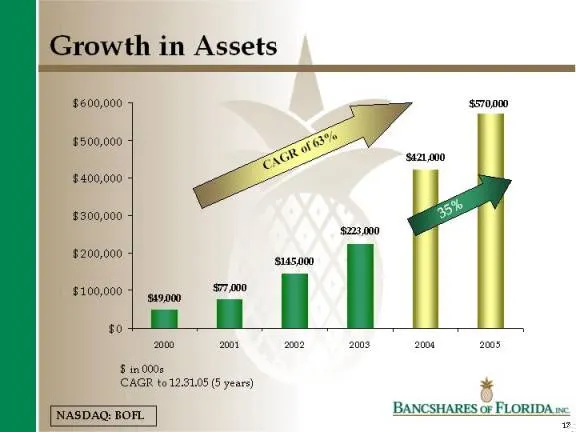
Slide 17: Growth in Assets
Growth in Assets $600,000 $500,000 $400,000 $200,000 $200,000 Mat, $100,000 | $7000 19000 rT] $0 § 1n000e CAGR to 12.51.05 (5 years) NASDAQ BOR. | BANCSHARES oF FLORIDA w=.
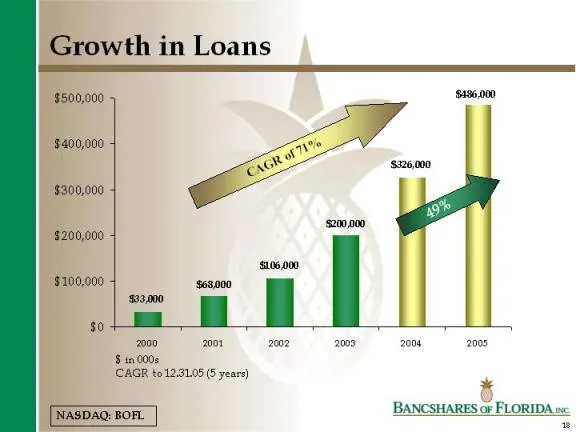
Slide 18: Growth in Loans
Growth in Loans $500,000 $06,000 $400,000 ok AG SS $200,000 “a ] 200900 $200,000 106,000 $100,000 28000 ne i $0 = 2000 2001 2e02 2008 2008 2005 § 120006 CAGR to12:31.05 (5 NASDAQ: BOF. | BANCSHARES oF FLORIDA v«
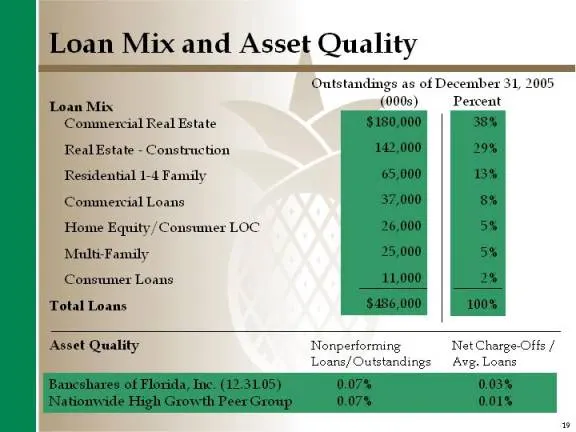
Slide 19: Loan Mix and Asset Quality
Loan Mix and Asset Quality Outstandings as of December 31, 2005 fipan Mix (0003) Percent Commercial Real Estate Real Estate - Construction Residential 1-4 Family Commercial Loans Home Equity /Consumer LOC Multi-Family Consumer Loans Total Loans Asset Quality Nonperforming Loans/Outstandings
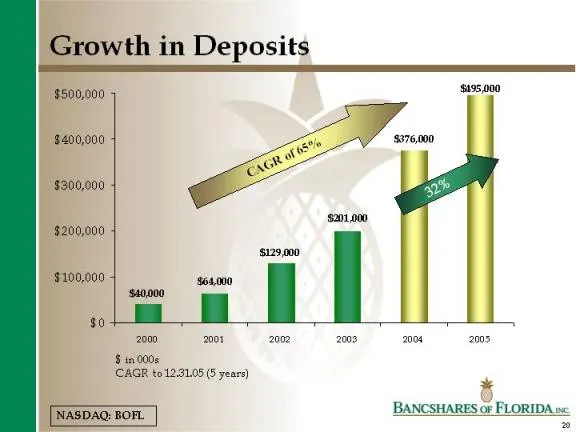
Slide 20: Growth in Deposits
Growth in Deposits $500,000 $185,000 $400,000 176,000 $300,000 a $200,000 129,00 $100,000 se4on0 | +o 2000 001 om 203 20 $0005 CAGR t01231.05 (8 yeare) NASDAQ: FOR. | BANCSHARES oF FLORIDA v«
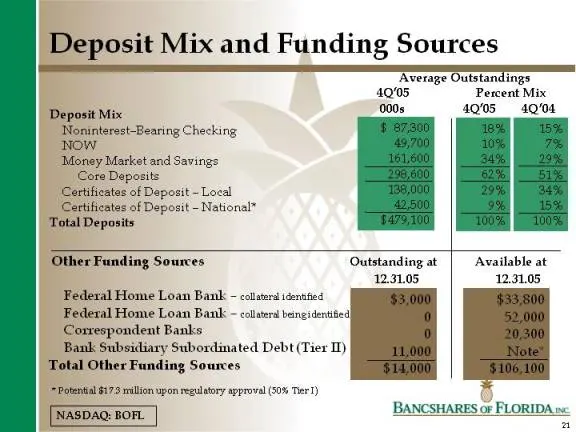
Slide 21: Deposit Mix and Funding Sources
Deposit Mix and Funding Sources ‘Average Outstandings 4Q‘05, Percent Mix Deposit Mix 000s 4Q'05 49/04 Noninterest Bearing Checking Now Money Market and Savings Core Deposits Certificates of Deposit - Local Certificates of Deposit - National” Total Deposits OtherFanding Sources Outstanding at | Avail
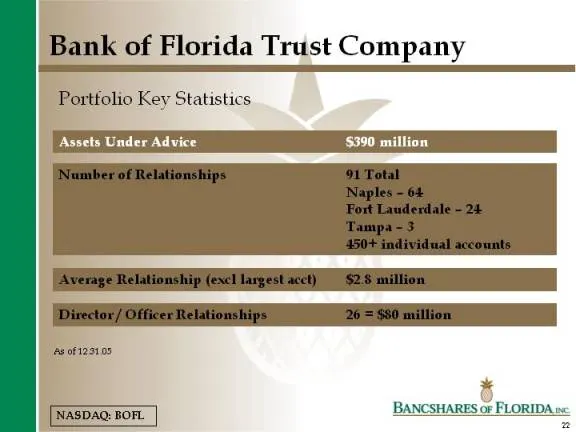
Slide 22: Bank of Florida Trust Company: Portfolio Key Statistics
Bank of Florida Trust Company Portfolio Key Statistics
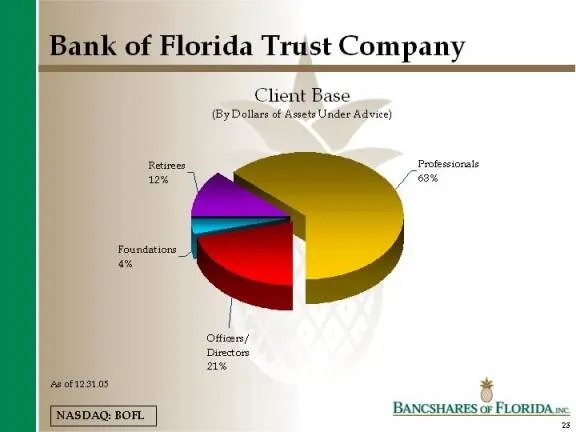
Slide 23: Bank of Florida Trust Company: Client Base
Bank of Florida Trust Company Client Base (By Dollars of Assets Under Advice) Retirees _ Professionals 12% ox Foundations a Officer / Directore a6 “peot2stos * [Naspaanon. | BANCSHARES oF FLonDAve
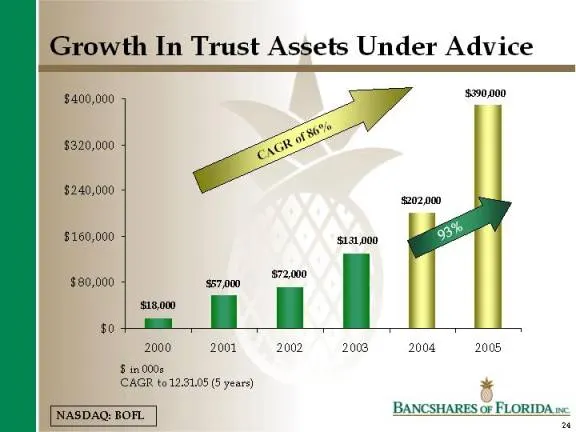
Slide 24: Growth In Trust Assets Under Advice
Growth In Trust Assets Under Advice $400,000 s0000 Ze $220,000 <— ie $249,000 202000 $160,000 acm $80,000 ‘coo = os so} 2000 ©2001-2002, 2008 2005 $0 000 CAGR to 12.51.05 (5 years) NASDAQ BOR. | BANCSHARES oF FLORIDA n
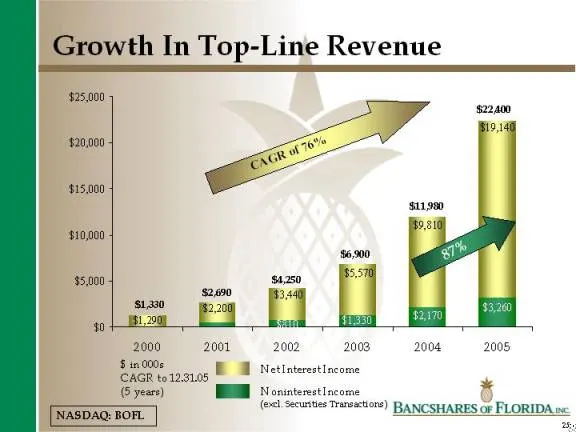
Slide 25: Growth In Top-Line Revenue
Growth In Top-Line Revenue $25,000 $20,000 15,000 10,000 $5,000 $1330 51.299) 2000 2001 2002 2003 2 $ 12 000¢ I CAGR to 1231.05 G year) NASDAQ: BOF. 40+ I NetInterestIacome
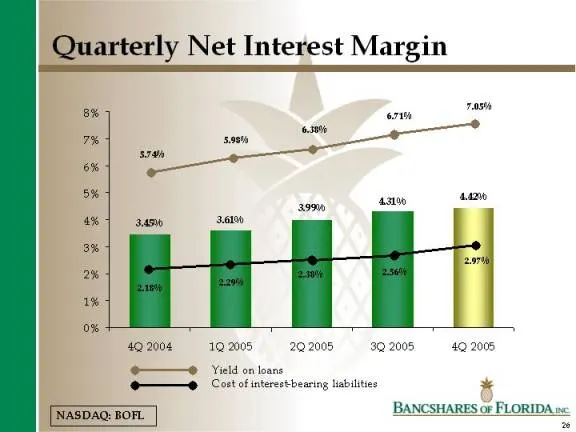
Slide 26: Quarterly Net Interest Margin
Quarterly Net Interest Margin EA. asi 467 sam0 3.1% 2978 49200 © 192005292005) 30.2008 4 —@ Yield on loane Oe Cott of interest bearing labilities NASDAQ BOR. | BANCSHARES oF FLORIDA n
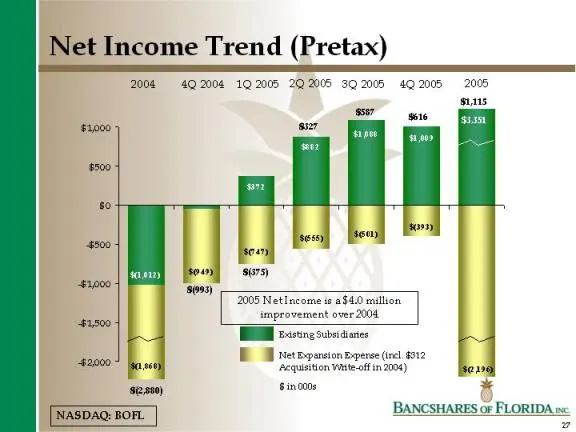
Slide 27: Net Income Trend (Pretax)
Net Income Trend (Pretax) 2006 4Q. 2004 19205 202005 sQr005 492005 2005 suas soe fo om) sinoone [NASDAQ TOR. | [BANCSHARES oF FLORIDA n=
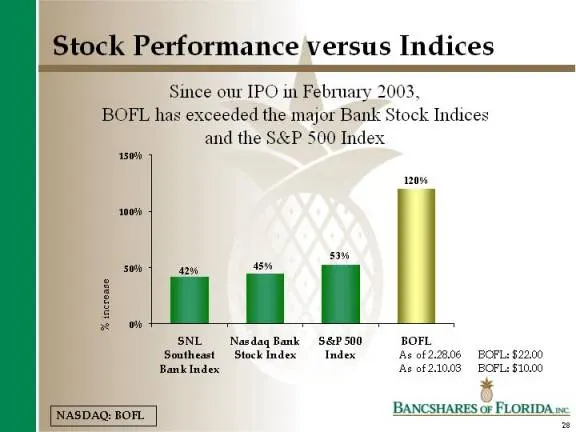
Slide 28: Stock Performance versus Indices
Stock Performance versus Indices Since our IPO in February 2003. BOPL has exceeded the major Bank Stock Indices and the S&P 500 Index 150% 100% so em SNL NardaqBank S&P500 BOFL Southeast Stock Index Index As 0f 2.28.06 BOFL: $2200 Bank Index ‘Ae 0f2.1003 BOFL:$10,00 NASDAQ: BOF. | BANCSHARES oF FLOR
Slide 29: Nationwide Valuation Comparison
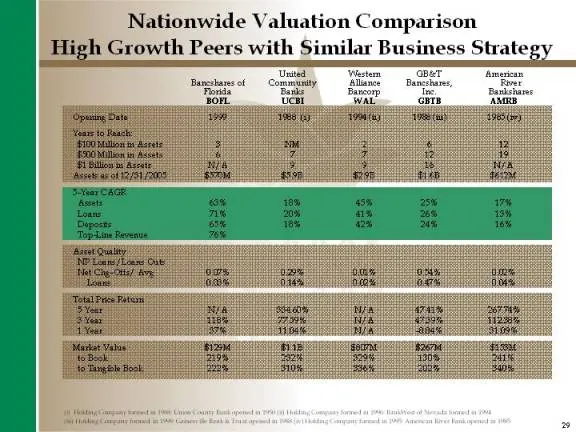
Nationwide Valuation Comparison High Growth Peers with Similar Business Strategy Ustad Wertern Tamslascf Communty lace ioe ine Or. cel Wal ore Space Du Sue Ain ao ah heey Saat Haase ‘SOD Blioa te Aerte in a ‘FroMionn Asets z % ‘Bie a Aerte as Asse a of ARS sii ‘Aut Guay WP Linte/laaas Oe ‘Hel is foe
Slide 30: Florida Demographic Analysis
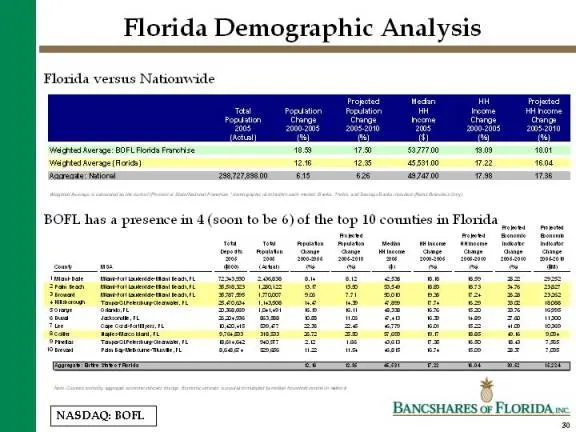
Florida Demographic Analysis Florida versus Nationwide Wares vege: BFL Fei Faetize e770 08 ‘001 wagtesnverage Res) 28 8 gsm at ‘804 pasate esareremo 81 ST 38 BOFL has a presence in 4 (soon to be 6) of the top 10 counties in Florida =e =——n 7 [Naspagron] = BANCSHARES oF FLORIDA ns:
Slide 31: Florida Demographic Analysis: State Map
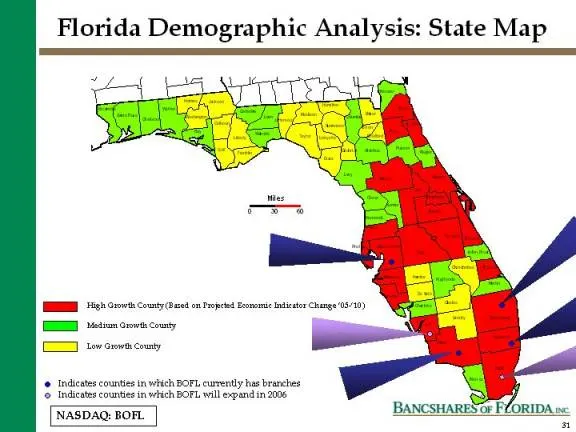
Florida Demographic Analysis: State Map HE Yetion ores county [Ea tev crower coty 4 Indestes counties in wich BOFL curently hes branes 3 ndieates counties sn wtih BOFL, wal expand in 2008, BANCSHARES OF F/ORIDA ne.
Slide 32: Bancshares of Florida, Inc.
Bancshares of Florida, Inc. Investor Presentation Financial Data at 12.31.05 Valuation Data at 2.28.06 NASDAQ: BOFL [LOGO OF BANCSHARES OF FLORIDA, INC.] Table of Contents Title Slide Front Cover Index Disclosure Mission Statement Target Client Demographics Serving the Right Markets Company Manageme
Source: SEC EDGAR · 8-K filed Mar 7, 2006
More decks from Bank of Florida Corp
 IPO Roadshow (November 2009)47 slides · Nov 6, 2009
 Shareholder Meeting (May 2009)39 slides · May 1, 2009
 Raymond James Investor Conference March 200933 slides · Mar 10, 2009
 Investor Presentation (December 2008)26 slides · Dec 1, 2008
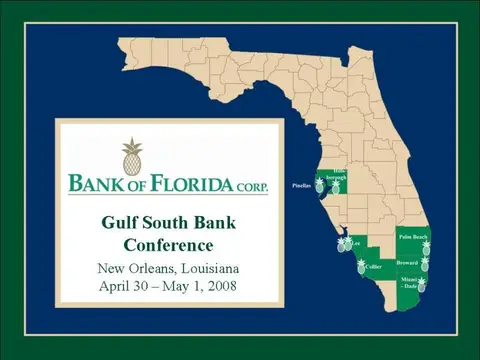 Gulf South Bank Conference 200835 slides · Apr 28, 2008
 Keefe, Bruyette & Woods Visitation (February 2008)28 slides · Feb 5, 2008