First Niagara Financial Group Inc
First Niagara Financial — Sterne Agee Banking Conference February 2014
20 slides from First Niagara Financial's conference presentation, Feb 13, 2014
Slide 1: Sterne Agee Banking Conference February 2014
Sterne Agee Banking Conference February 2014 Gary M. Crosby President & Chief Executive Officer Gregory W. Norwood Chief Financial Officer
Slide 2: Safe Harbor Statement
Safe Harbor Statement Any statements contained in this presentation regarding the outlook for FNFG’s business and markets, such as projections of future earnings performance, statements of FNFG’s plans and objectives, forecasts or market trends and other matters, are forward-looking statements based
Slide 3: CEO Focus
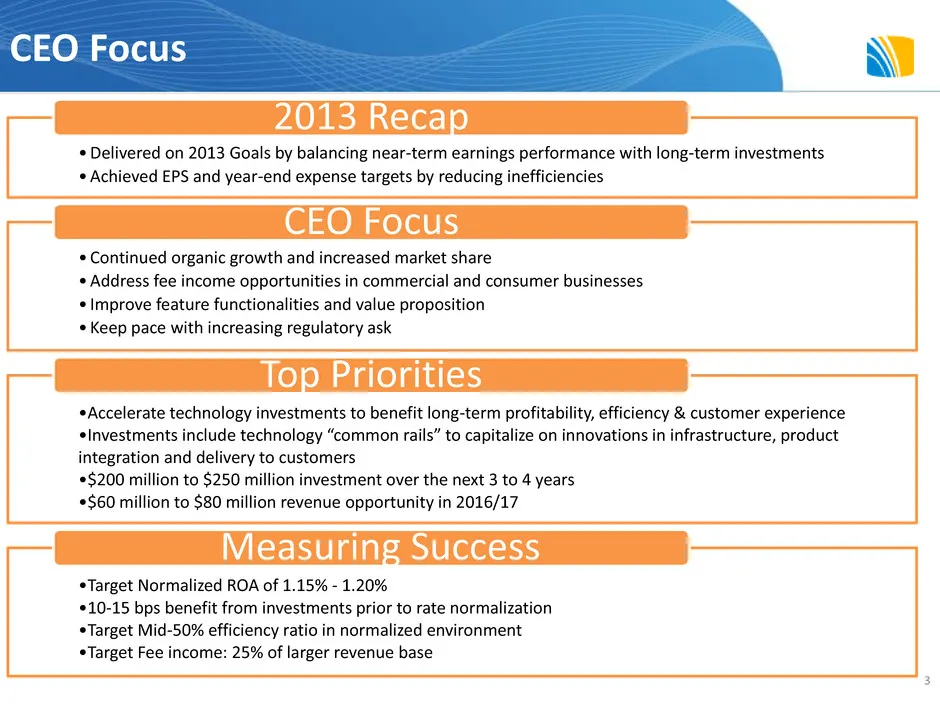
CEO Focus 3 • Delivered on 2013 Goals by balancing near-term earnings performance with long-term investments •Achieved EPS and year-end expense targets by reducing inefficiencies 2013 Recap •Continued organic growth and increased market share •Address fee income opportunities in commercial and consu
Slide 4: 4Q13 Financial Highlights
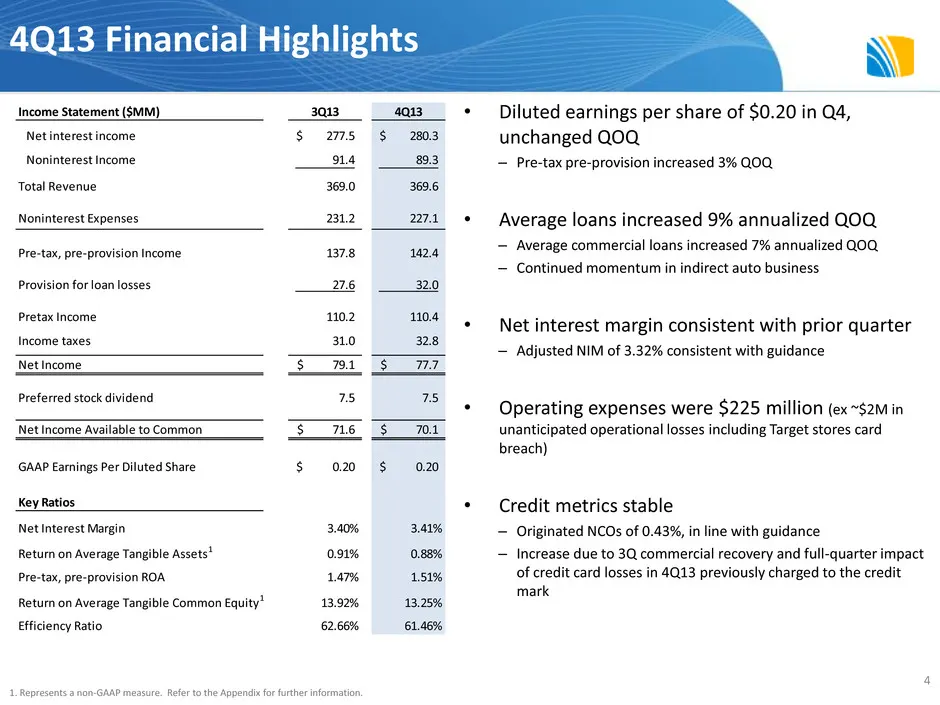
4Q13 Financial Highlights • Diluted earnings per share of $0.20 in Q4, unchanged QOQ – Pre-tax pre-provision increased 3% QOQ • Average loans increased 9% annualized QOQ – Average commercial loans increased 7% annualized QOQ – Continued momentum in indirect auto business • Net interest margin consis
Slide 5: Revenue Overview
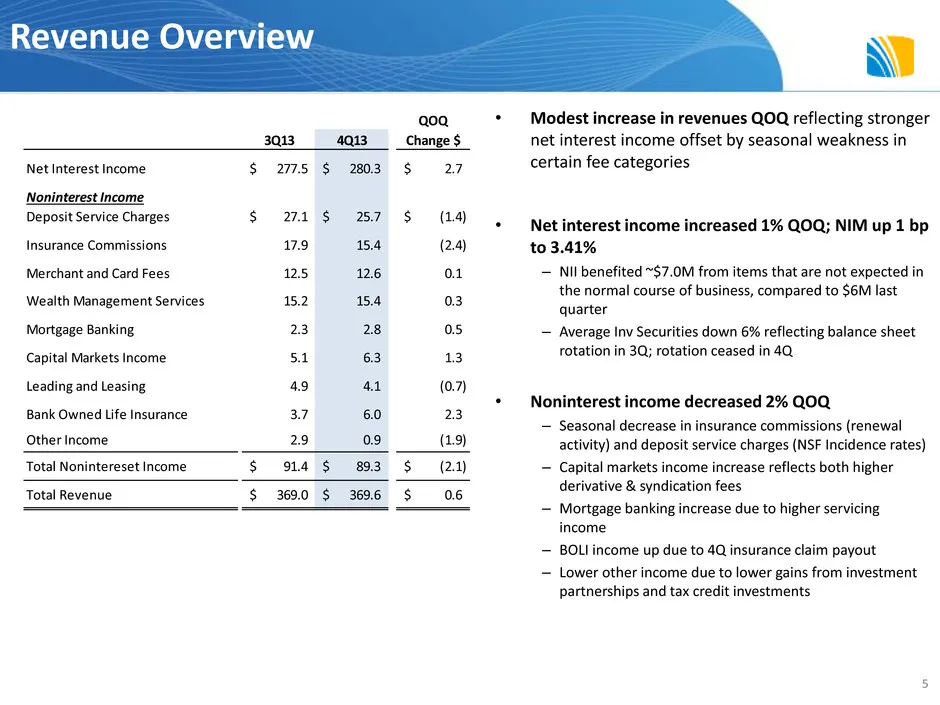
Revenue Overview • Modest increase in revenues QOQ reflecting stronger net interest income offset by seasonal weakness in certain fee categories • Net interest income increased 1% QOQ; NIM up 1 bp to 3.41% – NII benefited ~$7.0M from items that are not expected in the normal course of business, comp
Slide 6: Net Interest Income and Margin Overview
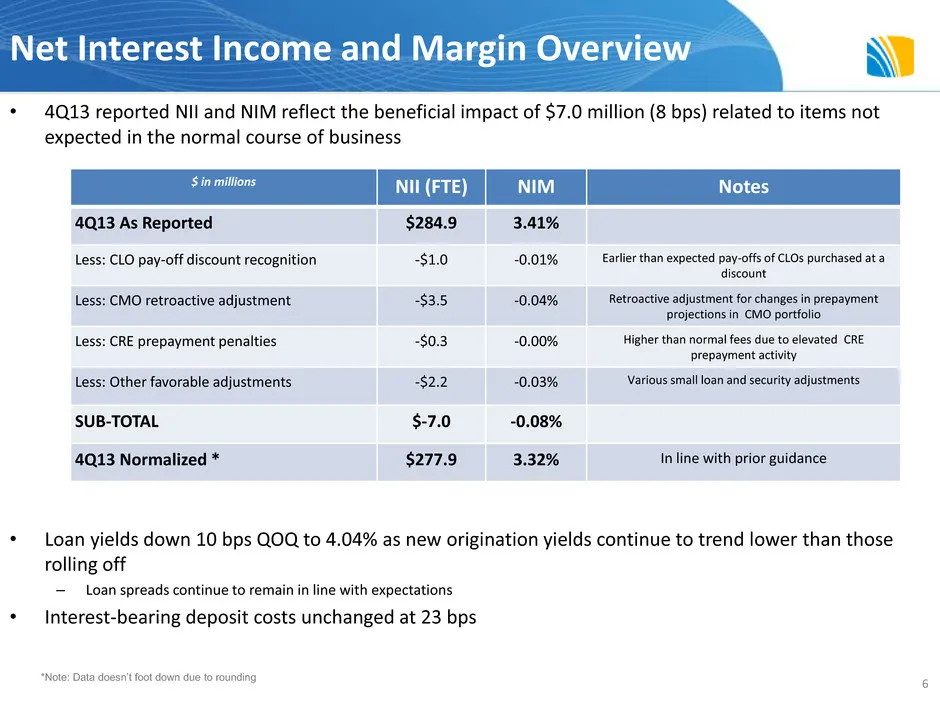
Net Interest Income and Margin Overview • 4Q13 reported NII and NIM reflect the beneficial impact of $7.0 million (8 bps) related to items not expected in the normal course of business • Loan yields down 10 bps QOQ to 4.04% as new origination yields continue to trend lower than those rolling off – L
Slide 7: Noninterest Expense Summary
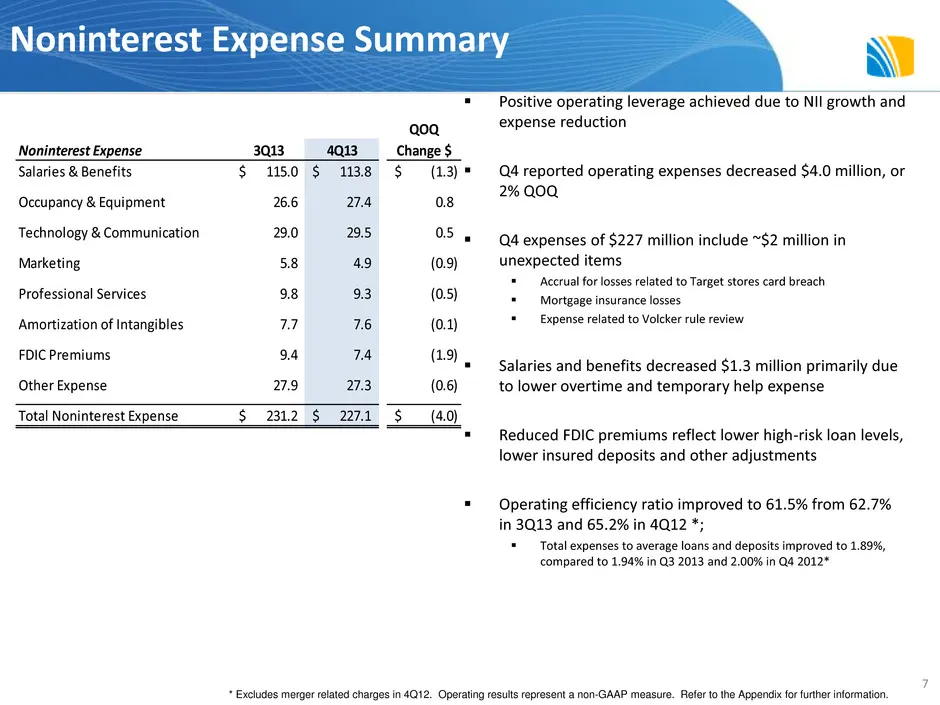
Noninterest Expense Summary Positive operating leverage achieved due to NII growth and expense reduction Q4 reported operating expenses decreased $4.0 million, or 2% QOQ Q4 expenses of $227 million include ~$2 million in unexpected items Accrual for losses related to Target stores card breac
Slide 8: Business Summary
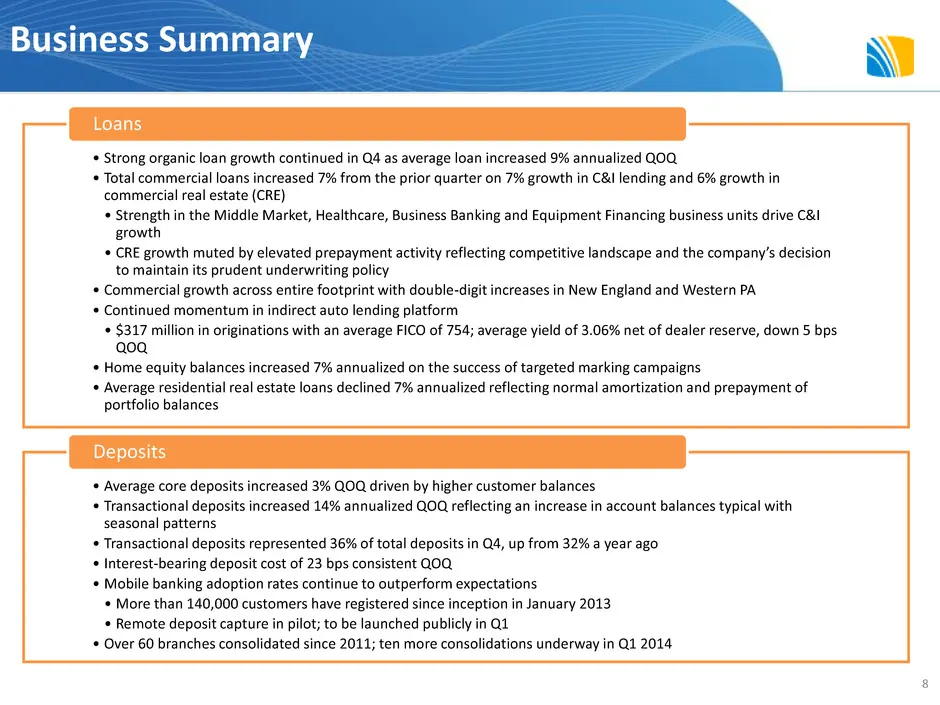
Business Summary 8 • Strong organic loan growth continued in Q4 as average loan increased 9% annualized QOQ • Total commercial loans increased 7% from the prior quarter on 7% growth in C&I lending and 6% growth in commercial real estate (CRE) • Strength in the Middle Market, Healthcare, Business Ban
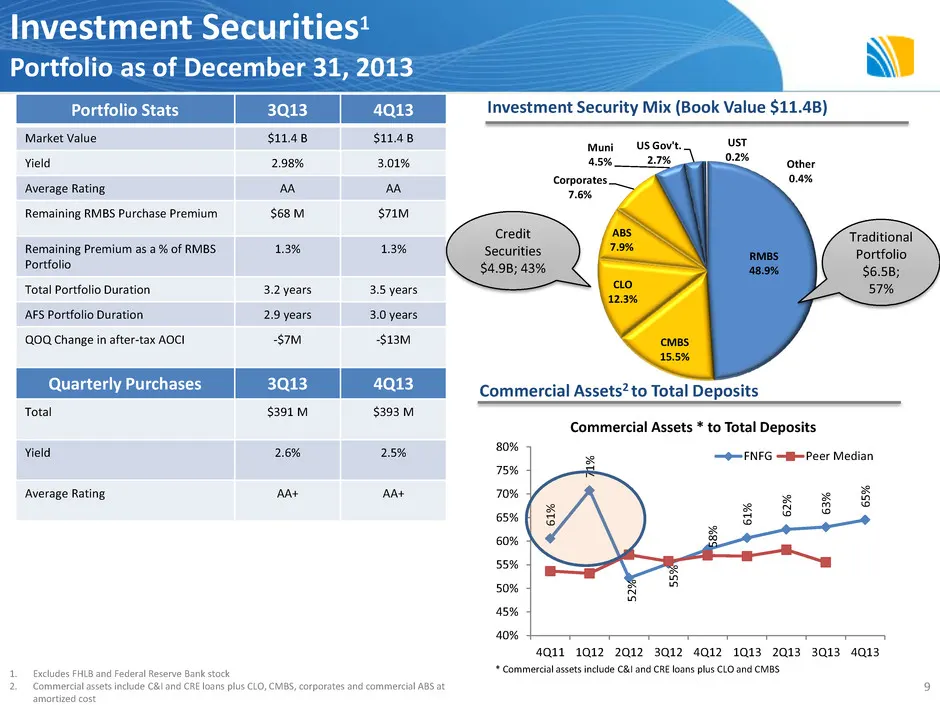
Slide 9: Investment Securities Portfolio as of December 31, 2013
RMBS 48.9% CMBS 15.5% CLO 12.3% ABS 7.9% Corporates 7.6% Muni 4.5% US Gov't. 2.7% Other 0.4% UST 0.2% Investment Securities1 Portfolio as of December 31, 2013 9 Portfolio Stats 3Q13 4Q13 Market Value $11.4 B $11.4 B Yield 2.98% 3.01% Average Rating AA AA Remaining RMBS Purchase Premium $68 M $71M Re
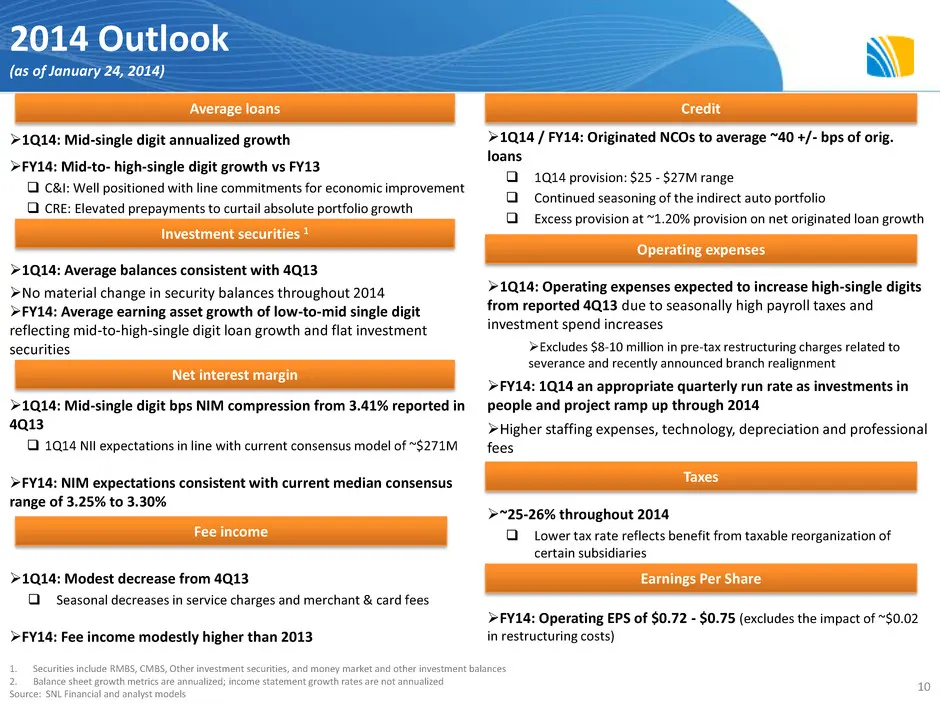
Slide 10: 2014 Outlook (as of January 24, 2014)
2014 Outlook (as of January 24, 2014) 1Q14: Mid-single digit annualized growth FY14: Mid-to- high-single digit growth vs FY13 C&I: Well positioned with line commitments for economic improvement CRE: Elevated prepayments to curtail absolute portfolio growth 1Q14: Average balances consistent wi
Slide 11: Appendix: Non-GAAP Measures
Appendix Non-GAAP Measures – This presentation contains financial information determined by methods other than in accordance with accounting principles generally accepted in the United States of America (GAAP). The Company believes that these non-GAAP financial measures provide a meaningful comparis
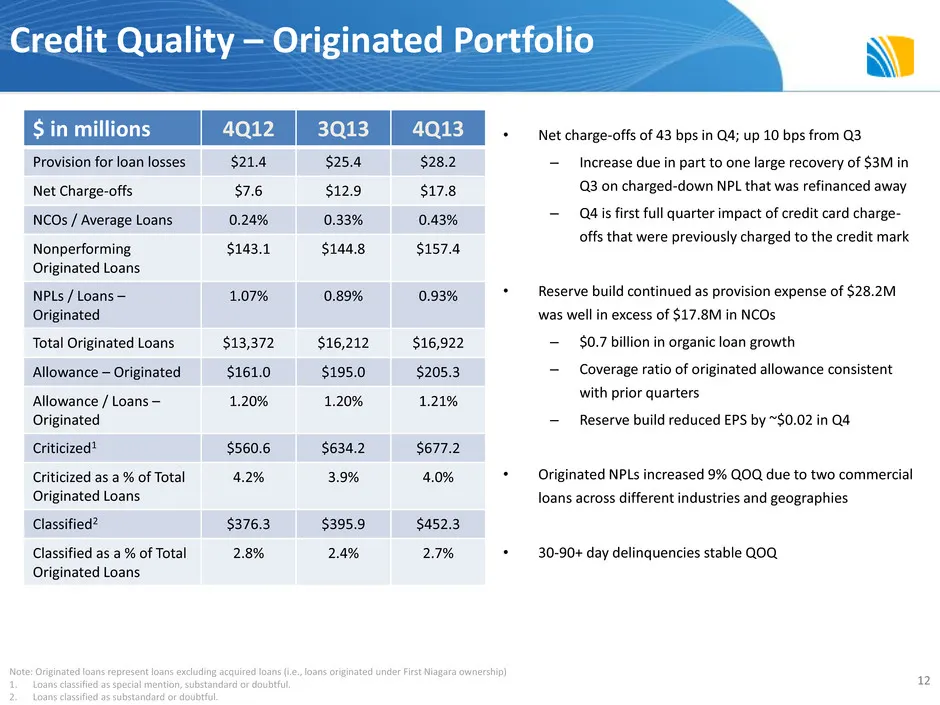
Slide 12: Credit Quality – Originated Portfolio
Credit Quality – Originated Portfolio • Net charge-offs of 43 bps in Q4; up 10 bps from Q3 – Increase due in part to one large recovery of $3M in Q3 on charged-down NPL that was refinanced away – Q4 is first full quarter impact of credit card charge- offs that were previously charged to the credit m
Slide 13: Credit Quality - Acquired Portfolio
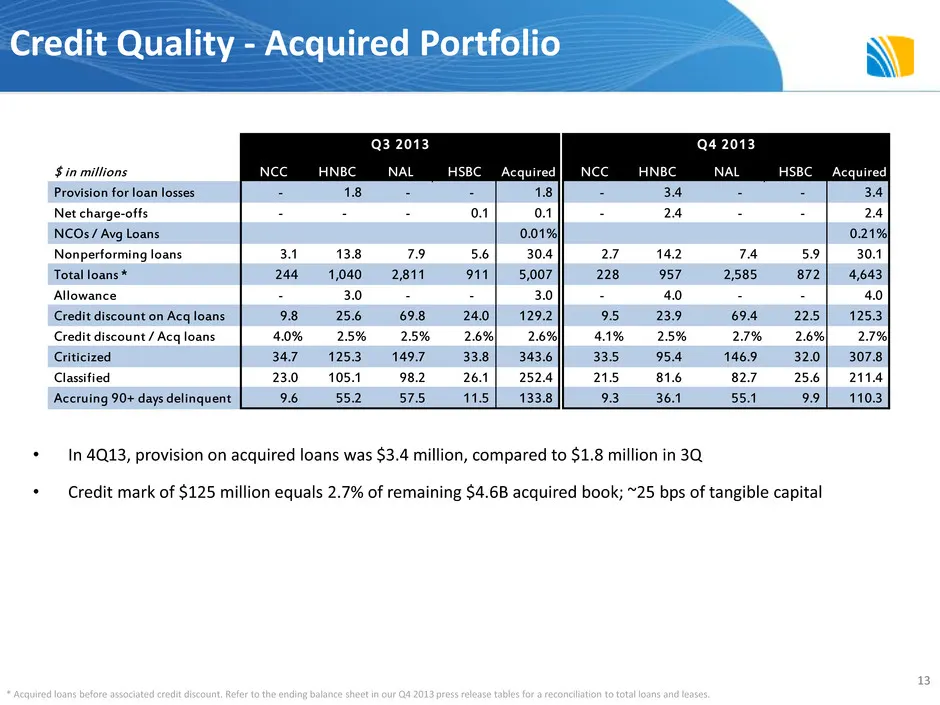
Credit Quality - Acquired Portfolio • In 4Q13, provision on acquired loans was $3.4 million, compared to $1.8 million in 3Q • Credit mark of $125 million equals 2.7% of remaining $4.6B acquired book; ~25 bps of tangible capital 13 * Acquired loans before associated credit discount. Refer to the endi
Slide 14: Strong Asset Quality: NPL and NCO by Loan Category
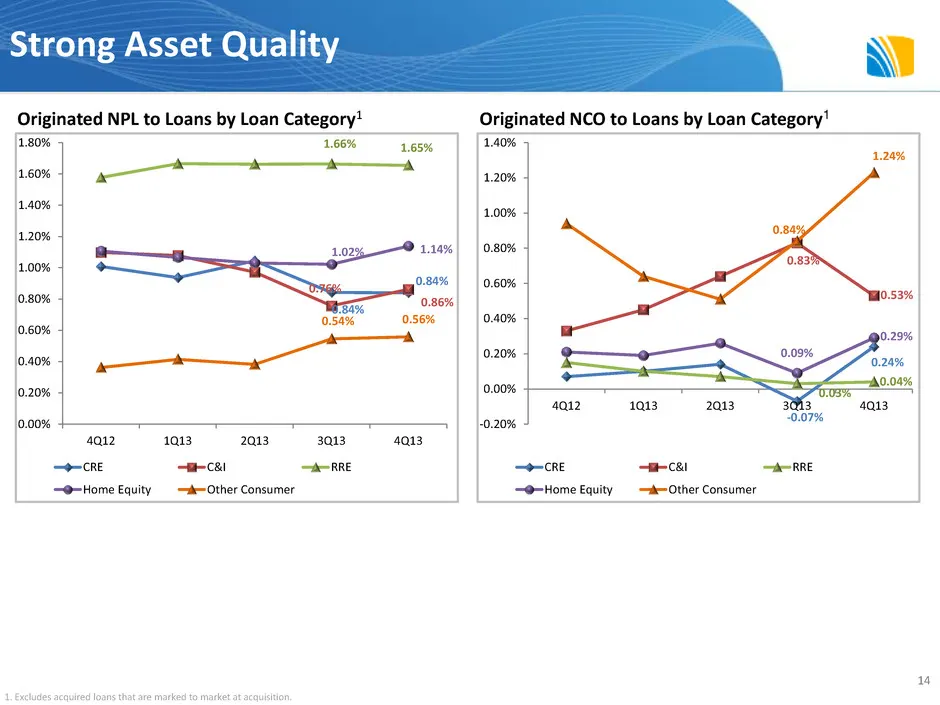
14 Originated NPL to Loans by Loan Category1 Originated NCO to Loans by Loan Category1 1. Excludes acquired loans that are marked to market at acquisition. Strong Asset Quality 0.84% 0.84% 0.76% 0.86% 1.66% 1.65% 1.02% 1.14% 0.54% 0.56% 0.00% 0.20% 0.40% 0.60% 0.80% 1.00% 1.20% 1.40% 1.60% 1.80% 4Q1
Slide 15: Strong Asset Quality: Moving Up Market with Discipline
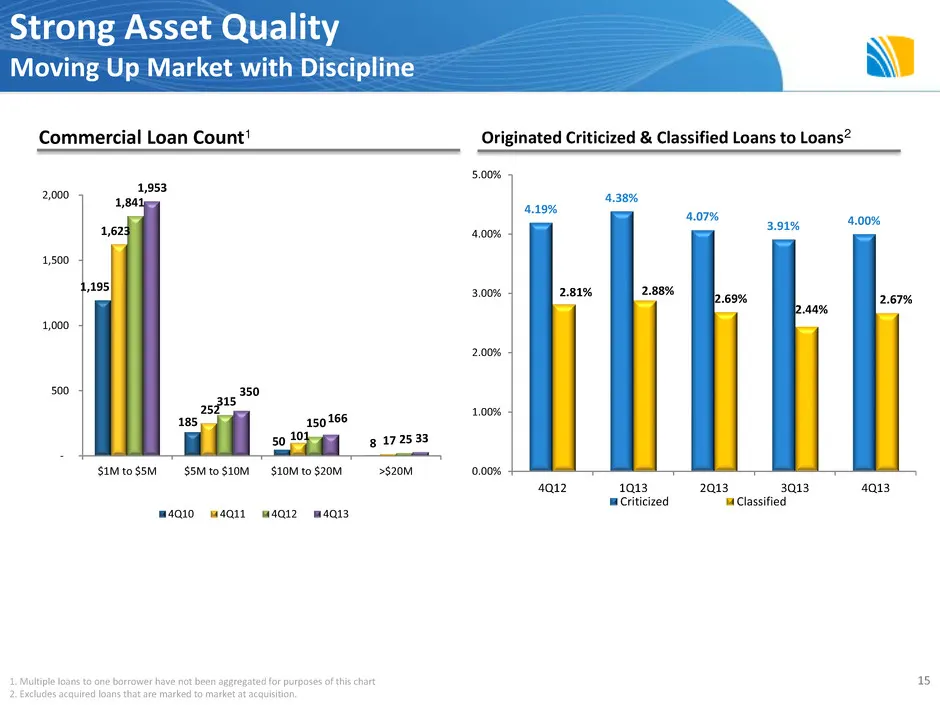
15 Commercial Loan Count1 Originated Criticized & Classified Loans to Loans2 1. Multiple loans to one borrower have not been aggregated for purposes of this chart 2. Excludes acquired loans that are marked to market at acquisition. Strong Asset Quality Moving Up Market with Discipline 1,195 185 50 8
Slide 16: Continued Momentum in Loan Growth
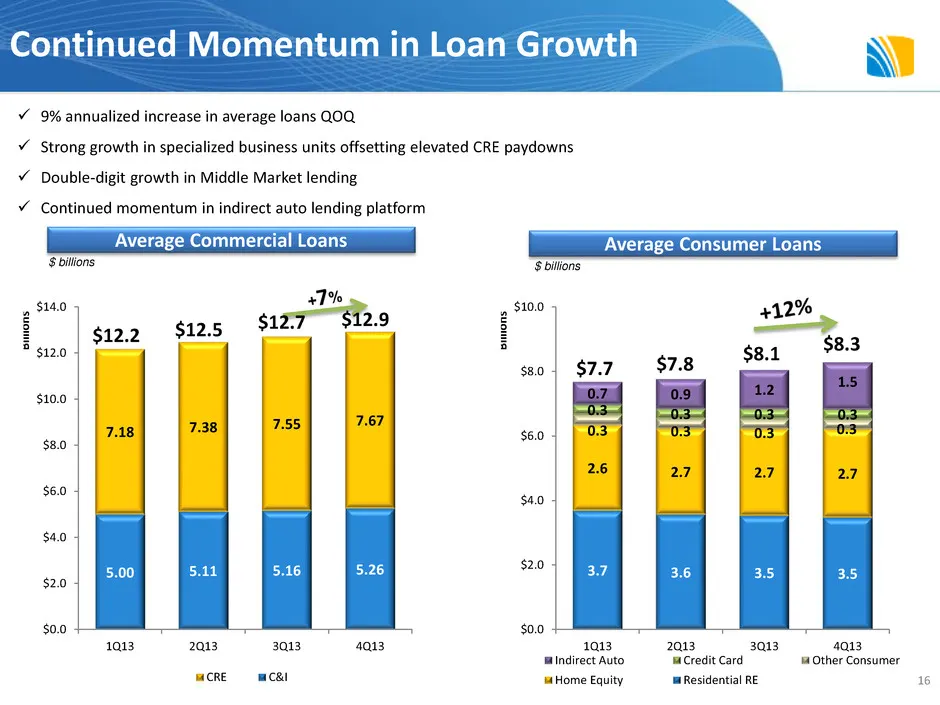
5.00 5.11 5.16 5.26 7.18 7.38 7.55 7.67 $0.0 $2.0 $4.0 $6.0 $8.0 $10.0 $12.0 $14.0 1Q13 2Q13 3Q13 4Q13 B ill io n s CRE C&I 3.7 3.6 3.5 3.5 2.6 2.7 2.7 2.7 0.3 0.3 0.3 0.3 0.3 0.3 0.3 0.3 0.7 0.9 1.2 1.5 $0.0 $2.0 $4.0 $6.0 $8.0 $10.0 1Q13 2Q13 3Q13 4Q13 B ill io n s Indirect Auto Credit Card Other
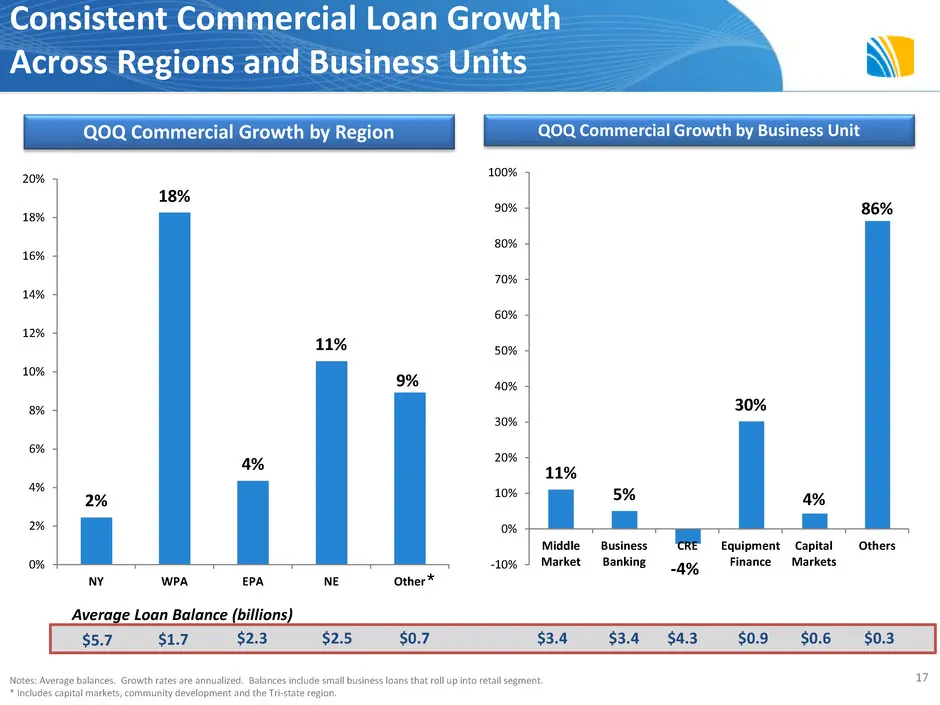
Slide 17: Consistent Commercial Loan Growth Across Regions and Business Units
2% 18% 4% 11% 9% 0% 2% 4% 6% 8% 10% 12% 14% 16% 18% 20% NY WPA EPA NE Other Consistent Commercial Loan Growth Across Regions and Business Units Notes: Average balances. Growth rates are annualized. Balances include small business loans that roll up into retail segment. * Includes capital markets, co
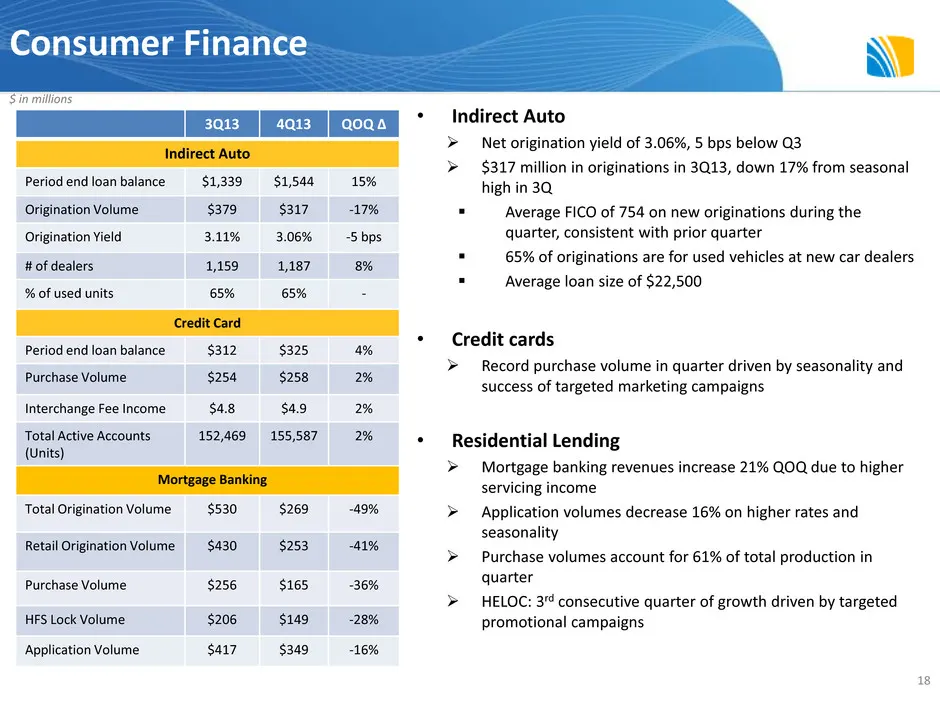
Slide 18: Consumer Finance
Consumer Finance 18 3Q13 4Q13 QOQ ∆ Indirect Auto Period end loan balance $1,339 $1,544 15% Origination Volume $379 $317 -17% Origination Yield 3.11% 3.06% -5 bps # of dealers 1,159 1,187 8% % of used units 65% 65% - Credit Card Period end loan balance $312 $325 4% Purchase Volume $254 $258 2% Inter
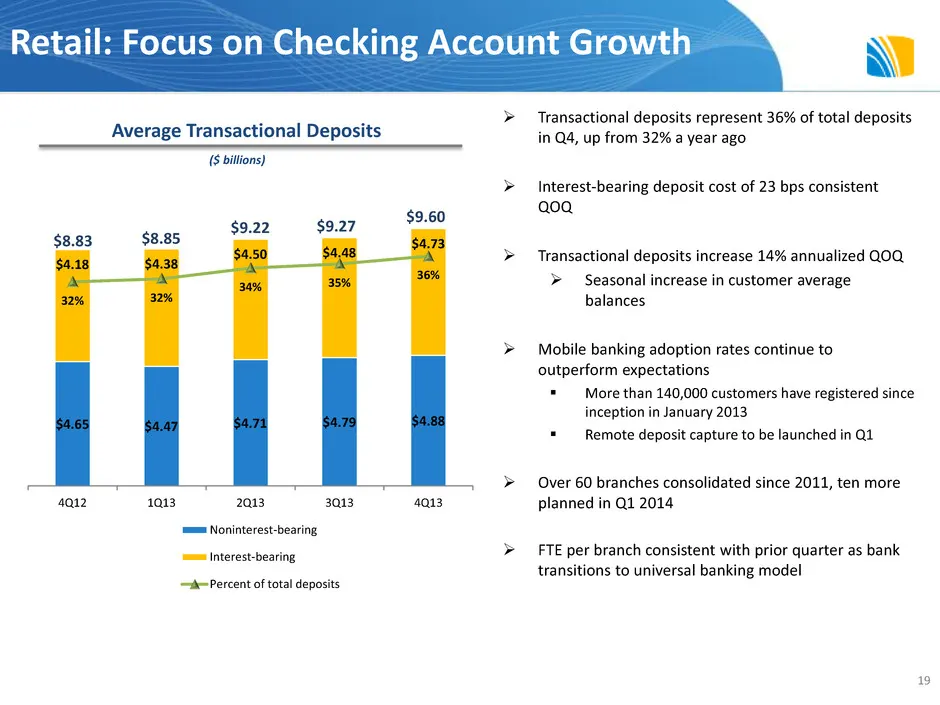
Slide 19: Retail: Focus on Checking Account Growth
$4.65 $4.47 $4.71 $4.79 $4.88 $4.18 $4.38 $4.50 $4.48 $4.73 32% 32% 34% 35% 36% 4Q12 1Q13 2Q13 3Q13 4Q13 Noninterest-bearing Interest-bearing Percent of total deposits Transactional deposits represent 36% of total deposits in Q4, up from 32% a year ago Interest-bearing deposit cost of 23 bps con
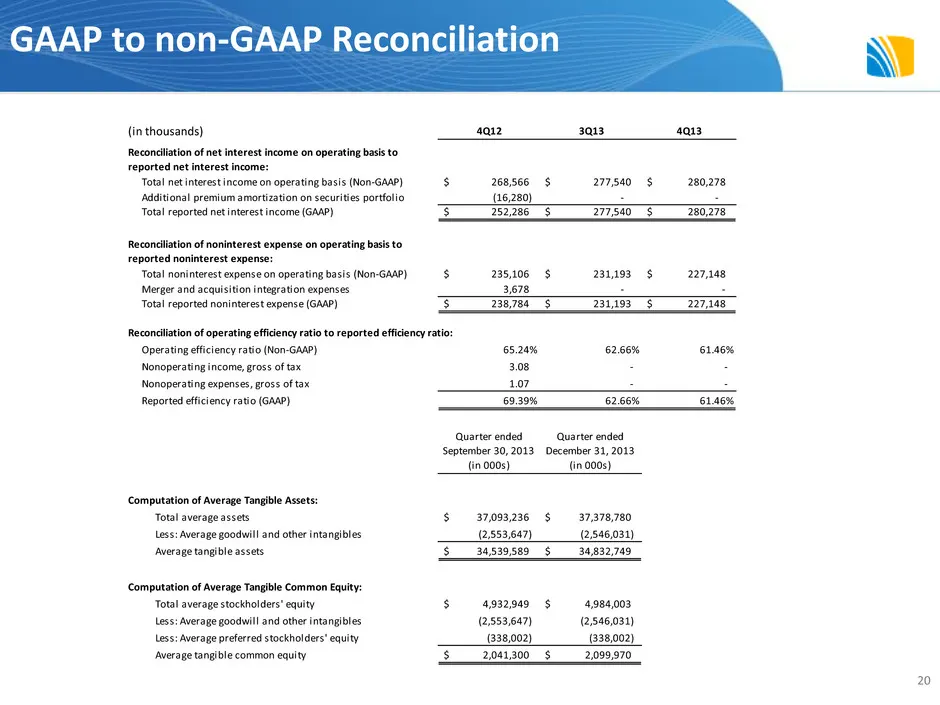
Slide 20: GAAP to non-GAAP Reconciliation
GAAP to non-GAAP Reconciliation 20 (in thousands) 4Q12 3Q13 4Q13 Total net interest income on operating basis (Non-GAAP) 268,566$ 277,540$ 280,278$ Additional premium amortization on securities portfolio (16,280) - - Total reported net interest income (GAAP) 252,286$ 277,540$ 280,278$ Total noninter
Source: SEC EDGAR · 8-K filed Feb 13, 2014
More decks from First Niagara Financial Group Inc
 Q4 2015 Earnings Presentation27 slides · Jan 21, 2016
 Merger or Acquisition (October 2015)18 slides · Oct 30, 2015
 Q3 2015 Earnings Presentation20 slides · Oct 23, 2015
 Q2 2015 Earnings Presentation20 slides · Jul 24, 2015
 Presentation (June 2015)11 slides · Jun 16, 2015
 Q1 2015 Earnings Presentation20 slides · Apr 24, 2015