Newalliance Bancshares — Investor Presentation (November 2009)
41 slides from Newalliance Bancshares's investor presentation, Nov 4, 2009
Slide 1: NewAlliance Bancshares
NewAlliance Bancshares November 4, 2009
Slide 2: Disclaimer & Forward-Looking Statements
Disclaimer & Forward-Looking Statements Statements in this document and presented orally at the conference, if any, concerning future results, performance, expectations or intentions are forward-looking statements. Actual results, performance or developments may differ materially from forward-lookin
Slide 3: Discussion Topics
Discussion Topics Company Profile and Business Focus Key 2009 Business Priorities Highlights of Third Quarter 2009 Credit Quality Organizational Strengths Investor Presentation - November 2009 3
Slide 4: NewAlliance Bank Executive Management Team
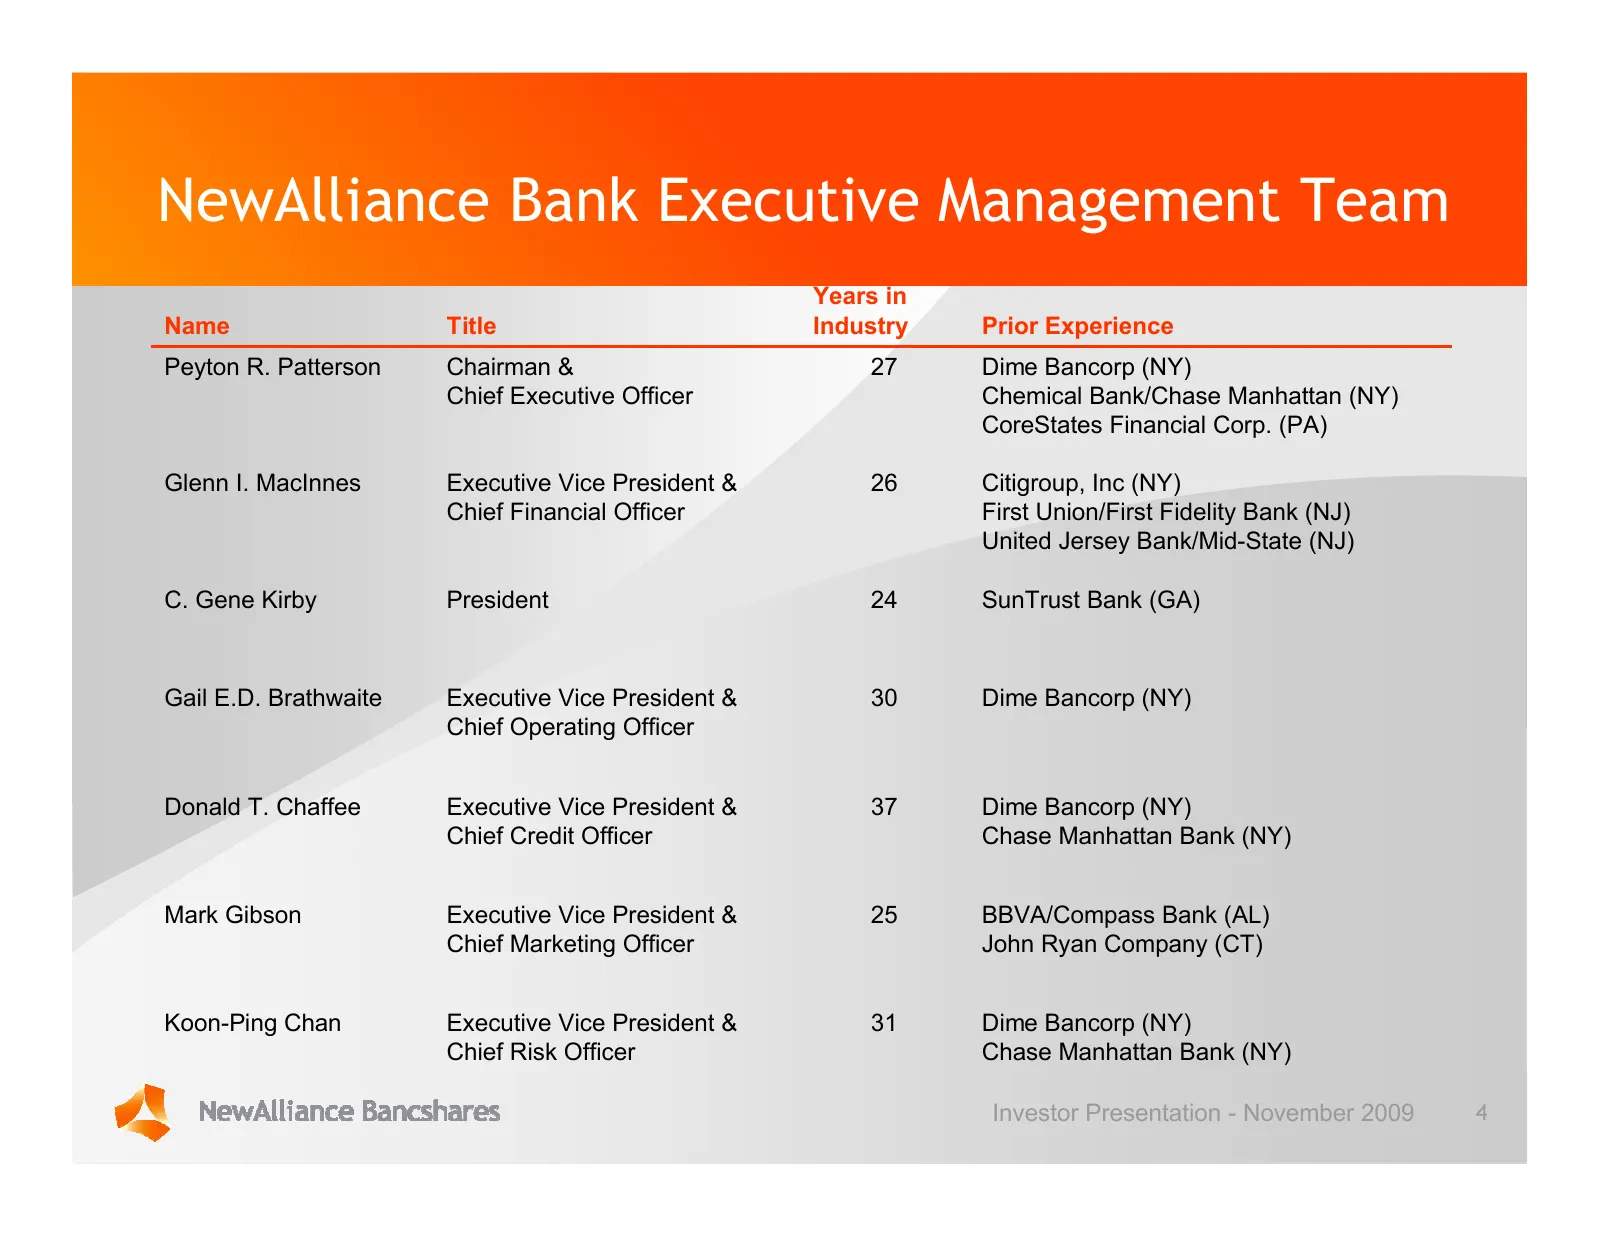
NewAlliance Bank Executive Management Team Years in Name Title Industry Prior Experience Peyton R. Patterson Chairman & 27 Dime Bancorp (NY) Chief Executive Officer Chemical Bank/Chase Manhattan (NY) CoreStates Financial Corp. (PA) Glenn I. MacInnes Executive Vice President & 26 Citigroup, Inc (NY)
Slide 5: Company Profile & Organizational Strengths
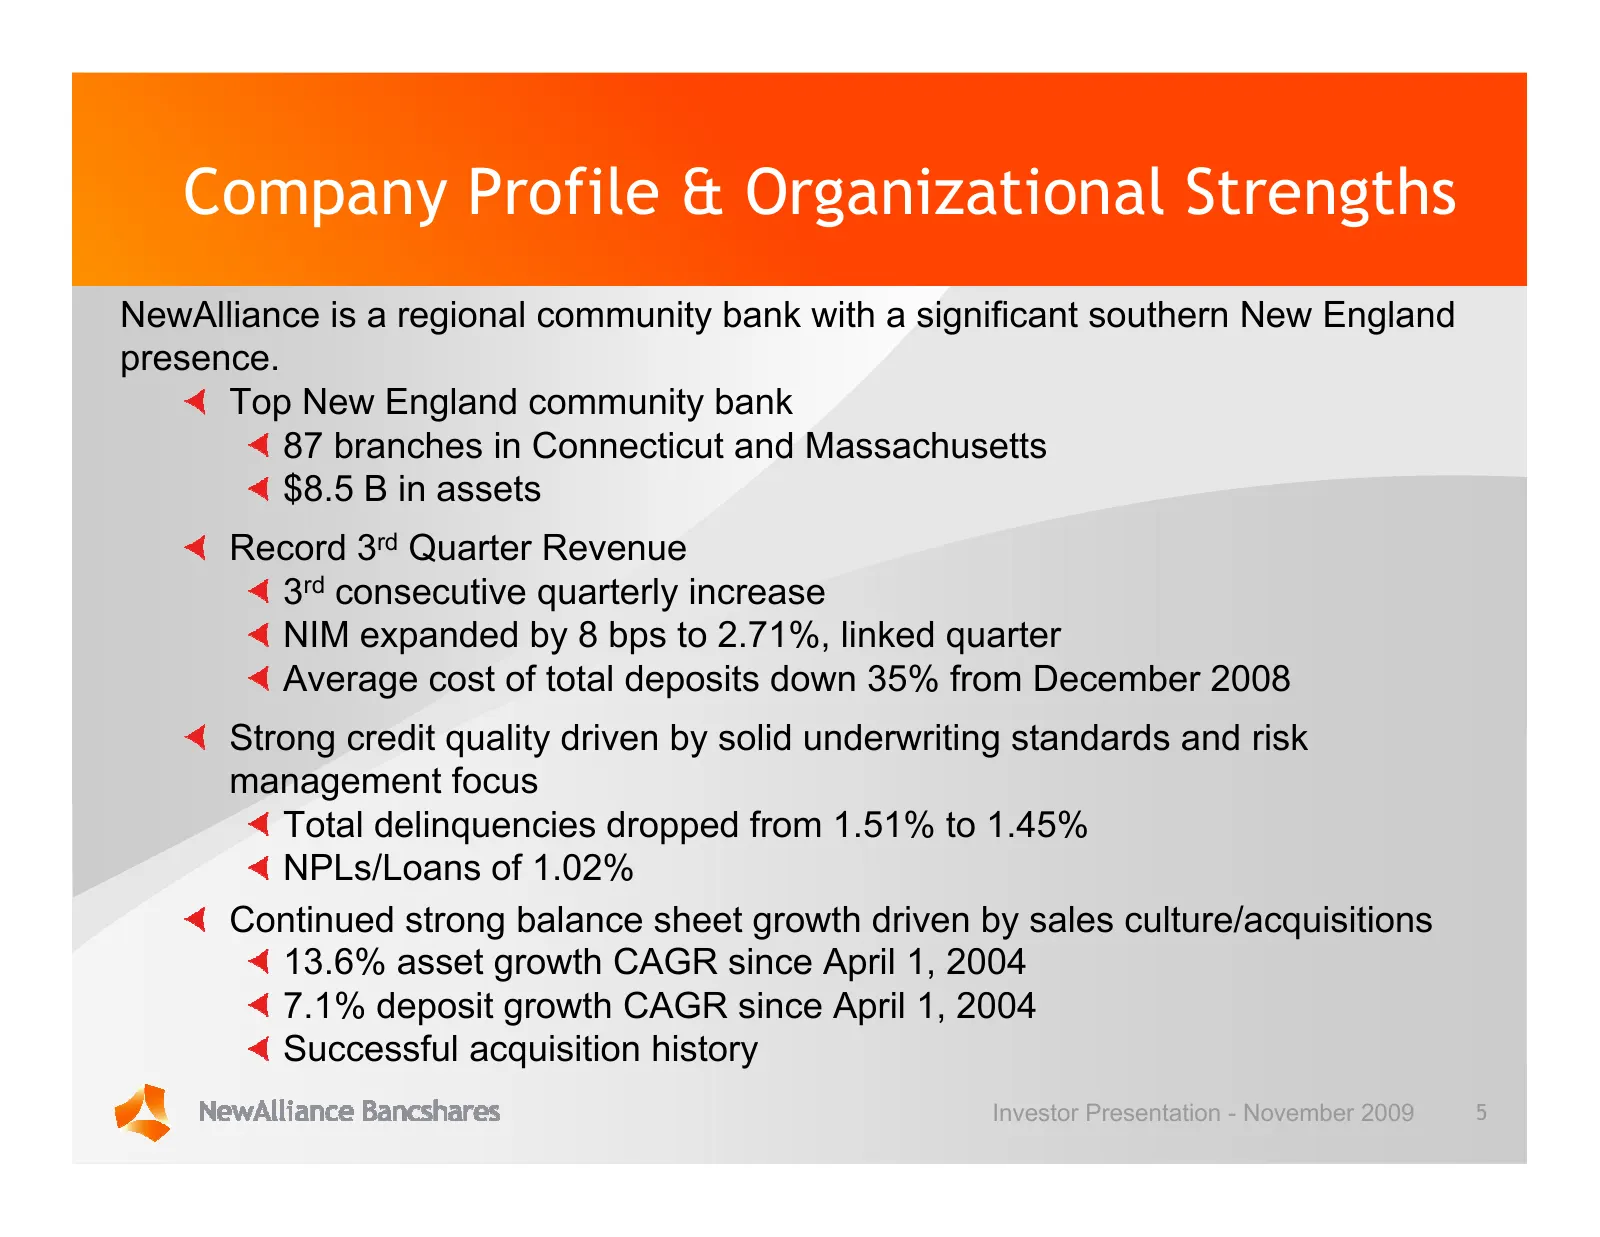
Company Profile & Organizational Strengths NewAlliance is a regional community bank with a significant southern New England presence. Top New England community bank 87 branches in Connecticut and Massachusetts $8.5 B in assets Record 3rd Quarter Revenue 3rd consecutive quarterly increase NIM expande
Slide 6: Company Profile & Organizational Strengths (continued)
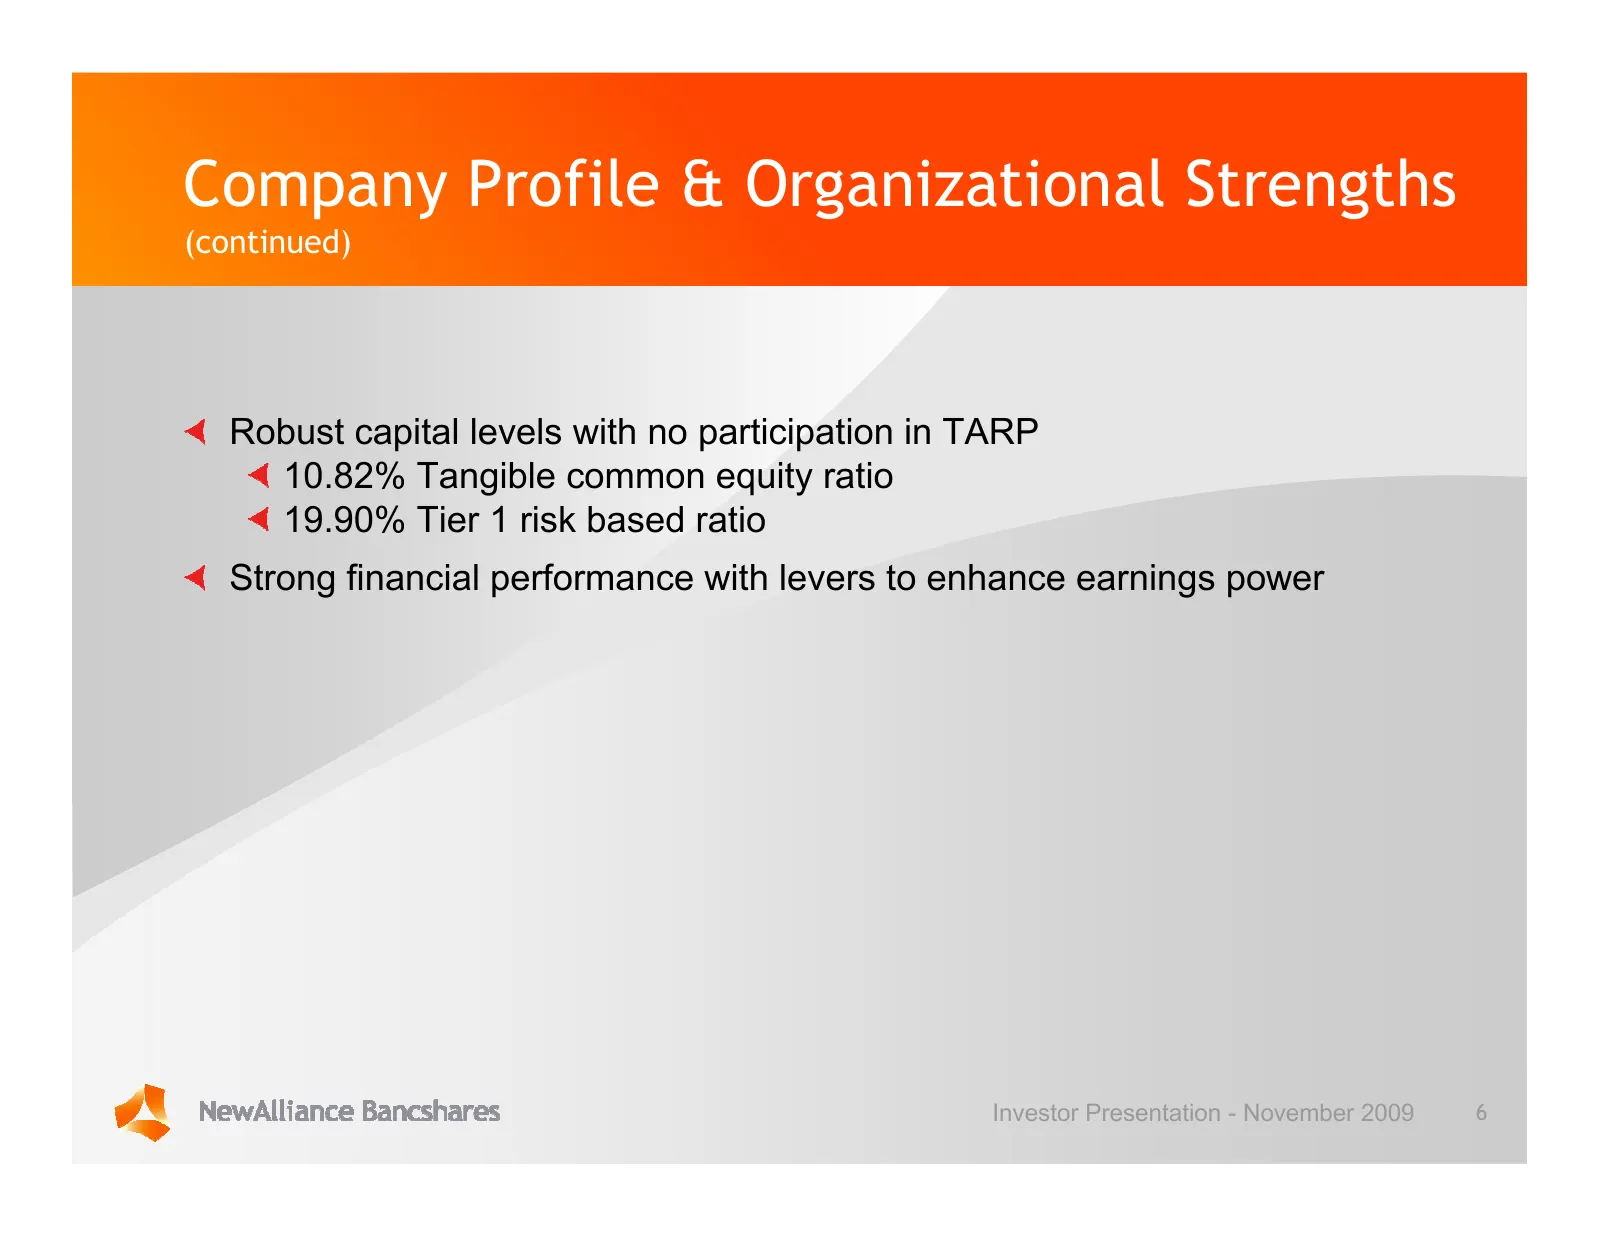
Company Profile & Organizational Strengths (continued) Robust capital levels with no participation in TARP 10.82% Tangible common equity ratio 19.90% Tier 1 risk based ratio Strong financial performance with levers to enhance earnings power Investor Presentation - November 2009 6
Slide 7: The NewAlliance Franchise
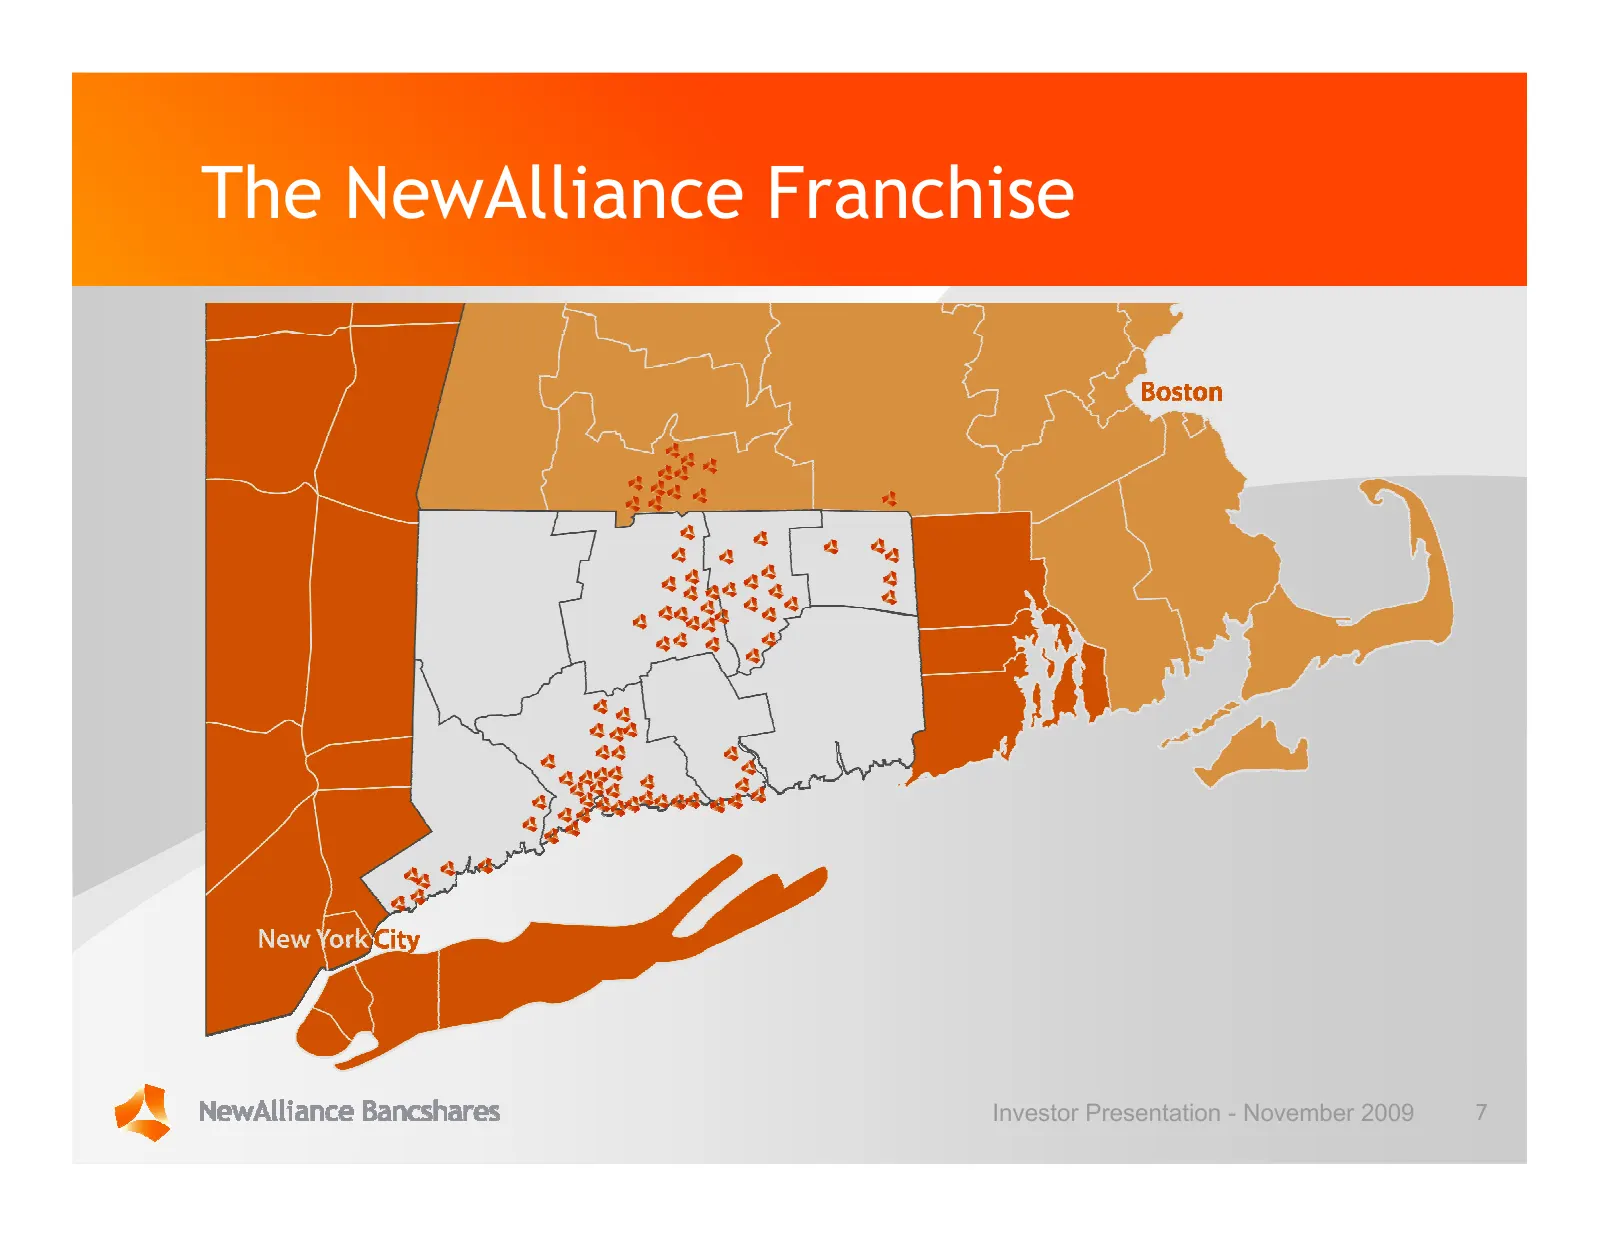
The NewAlliance Franchise Investor Presentation - November 2009 7
Slide 8: Credit Quality Trends — NAL vs. Peers
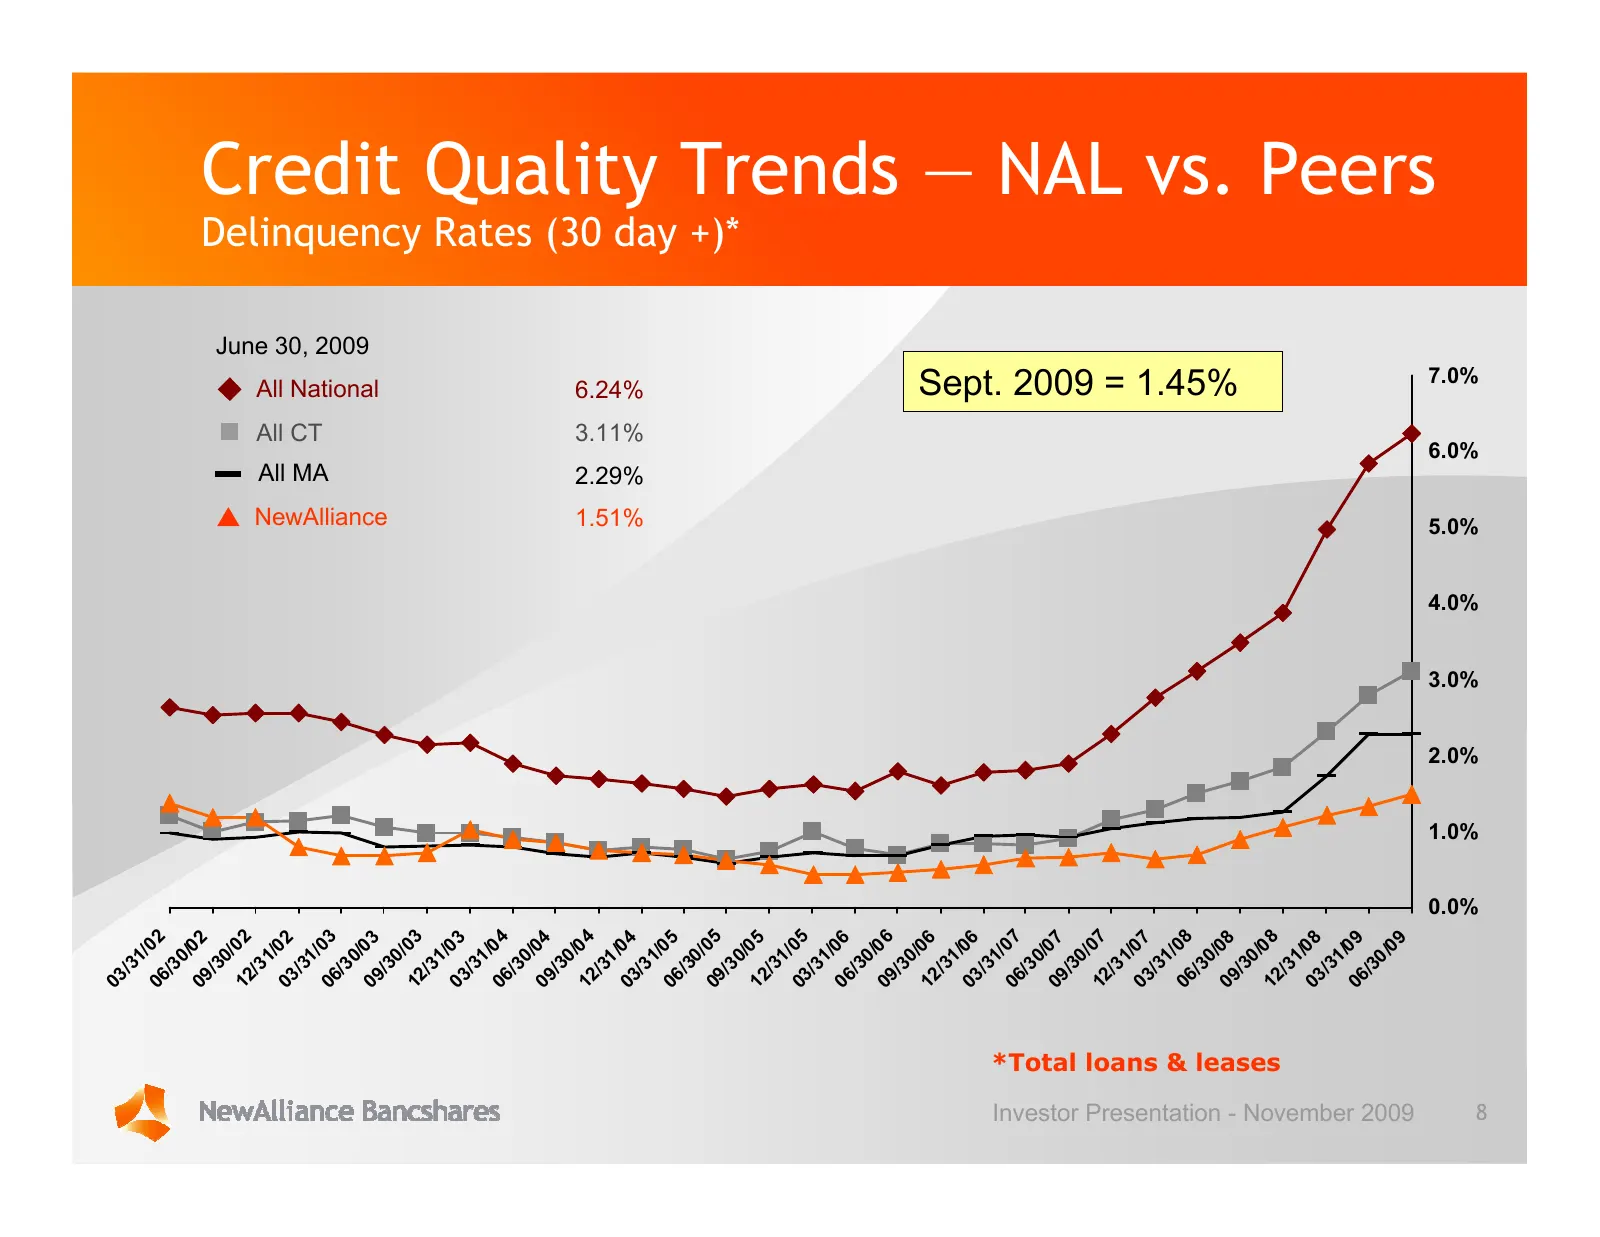
03 /3 1/ 06 02 /3 0 09 /02 /3 0/ 12 02 /3 1 03 /02 /3 All CT 1/ All MA 06 03 /3 0 June 30, 2009 All National 09 /03 NewAlliance /3 0/ 12 03 /3 1 03 /03 /3 1/ 06 0 4 /3 0 09 /04 /3 0/ 12 0 4 /3 1 03 /04 1.51% 2.29% 3.11% 6.24% /3 1 06 /05 /3 0/ 09 05 /3 Delinquency Rates (30 day +)* 0/ 12 0 5 /3 1 03
Slide 9: NewAlliance History
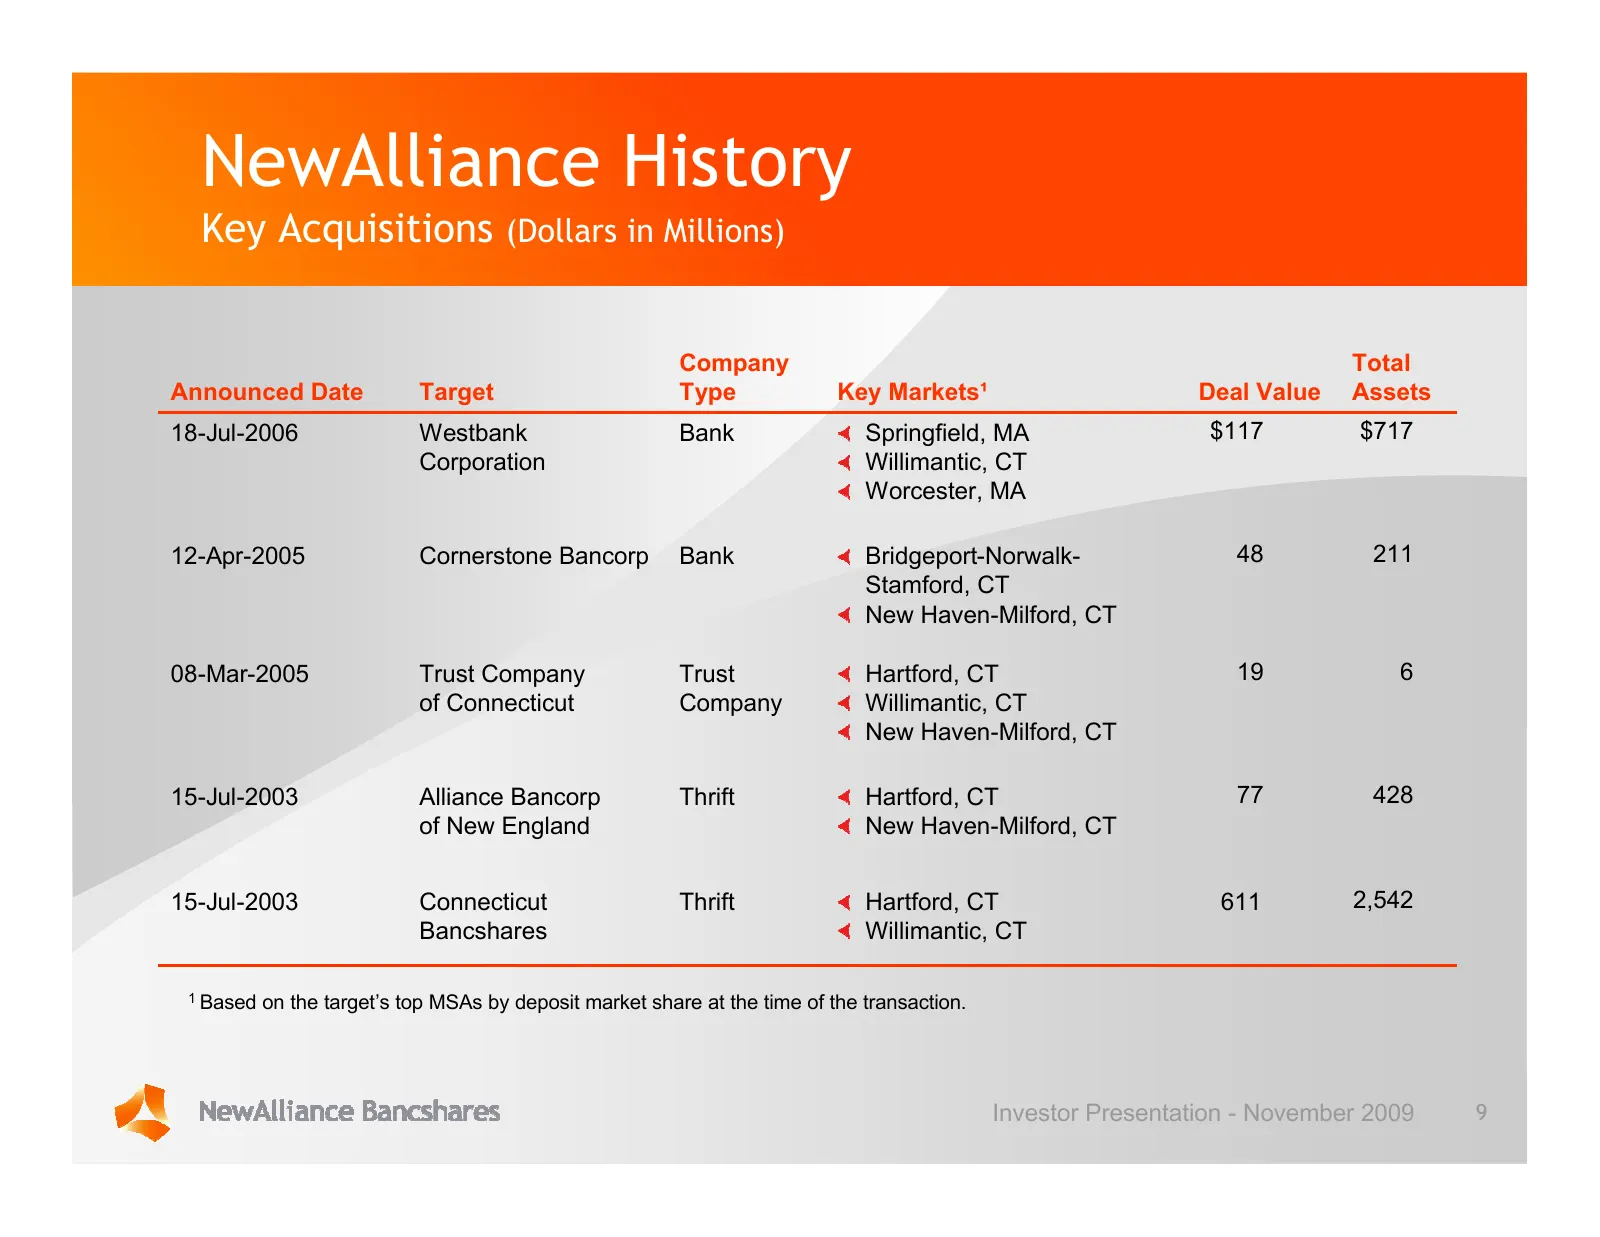
NewAlliance History Key Acquisitions (Dollars in Millions) Company Total Announced Date Target Type Key Markets¹ Deal Value Assets 18-Jul-2006 Westbank Bank Springfield, MA $117 $717 Corporation Willimantic, CT Worcester, MA 12-Apr-2005 Cornerstone Bancorp Bank Bridgeport-Norwalk- 48 211 Stamford, C
Slide 10: Key 2009 Business Priorities
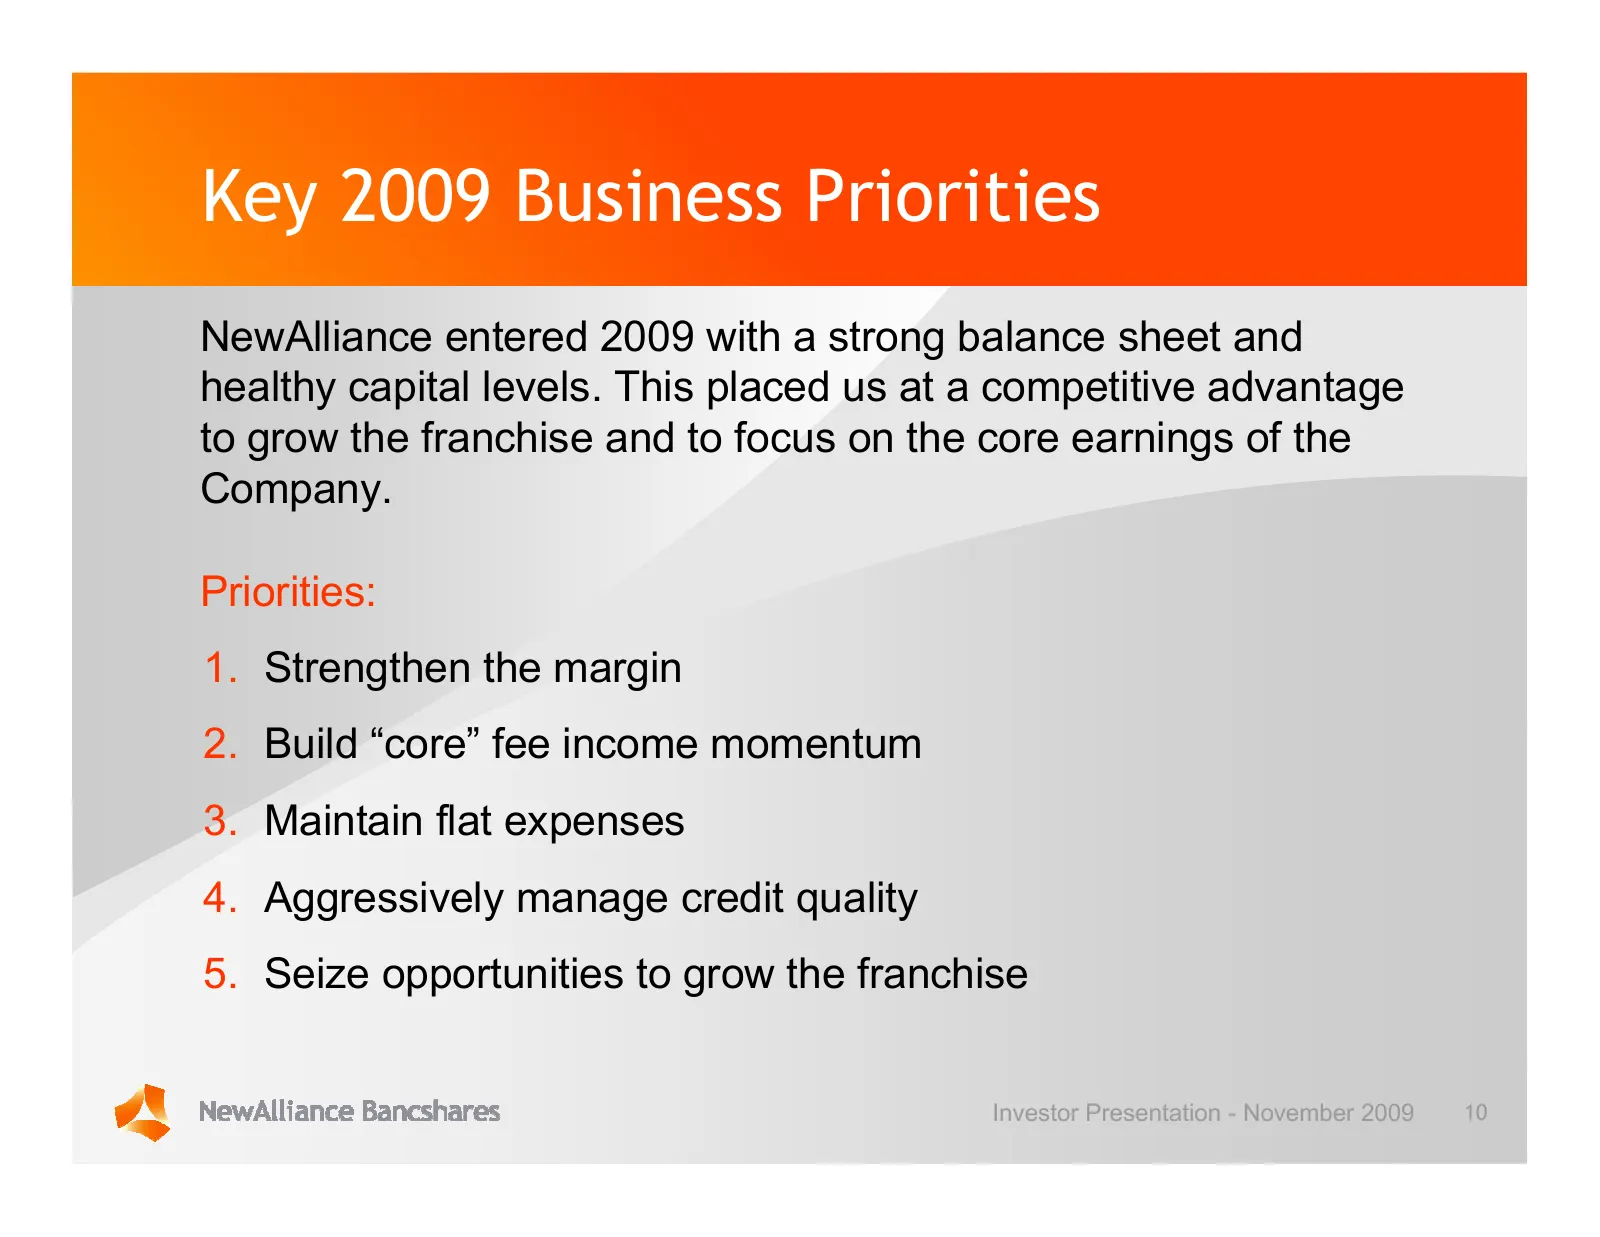
Key 2009 Business Priorities NewAlliance entered 2009 with a strong balance sheet and healthy capital levels. This placed us at a competitive advantage to grow the franchise and to focus on the core earnings of the Company. Priorities: 1. Strengthen the margin 2. Build “core” fee income momentum 3.
Slide 11: Consolidated Statements of Income
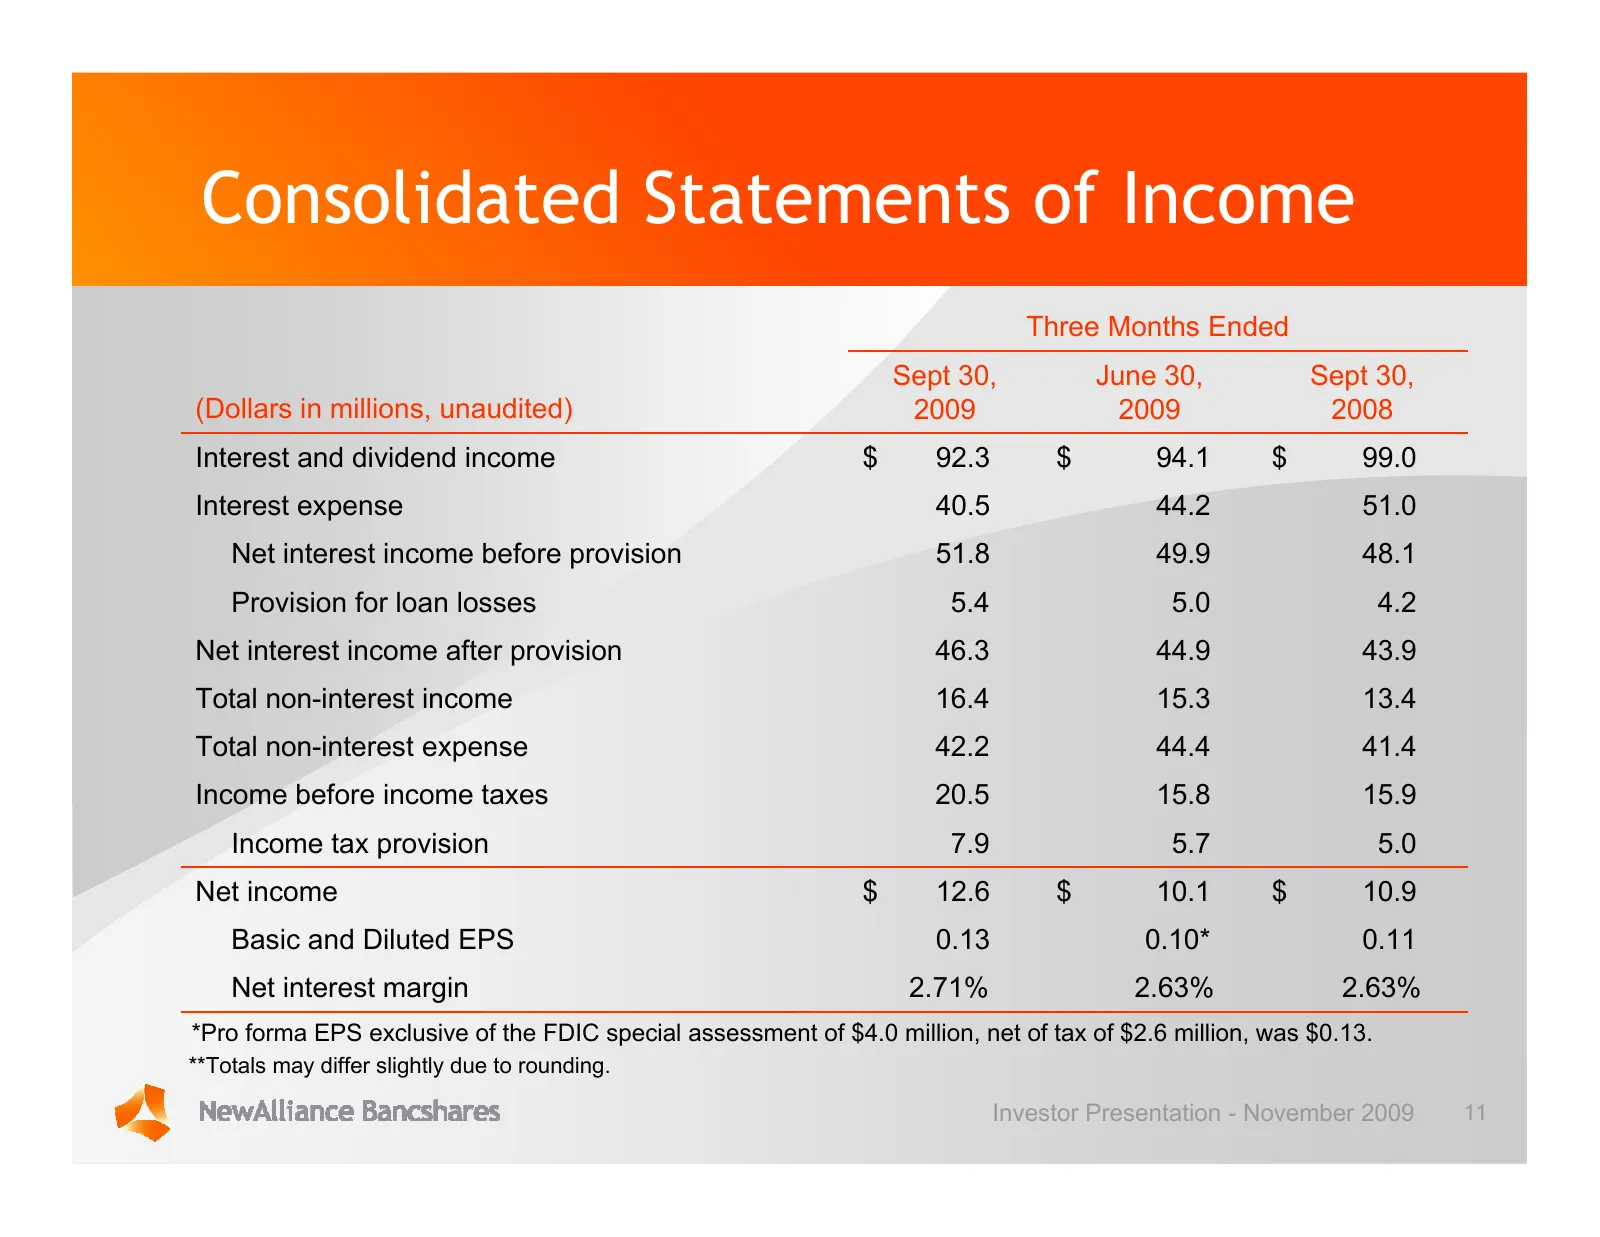
Consolidated Statements of Income Three Months Ended Sept 30, June 30, Sept 30, (Dollars in millions, unaudited) 2009 2009 2008 Interest and dividend income $ 92.3 $ 94.1 $ 99.0 Interest expense 40.5 44.2 51.0 Net interest income before provision 51.8 49.9 48.1 Provision for loan losses 5.4 5.0 4.2
Slide 12: Quarterly Revenues
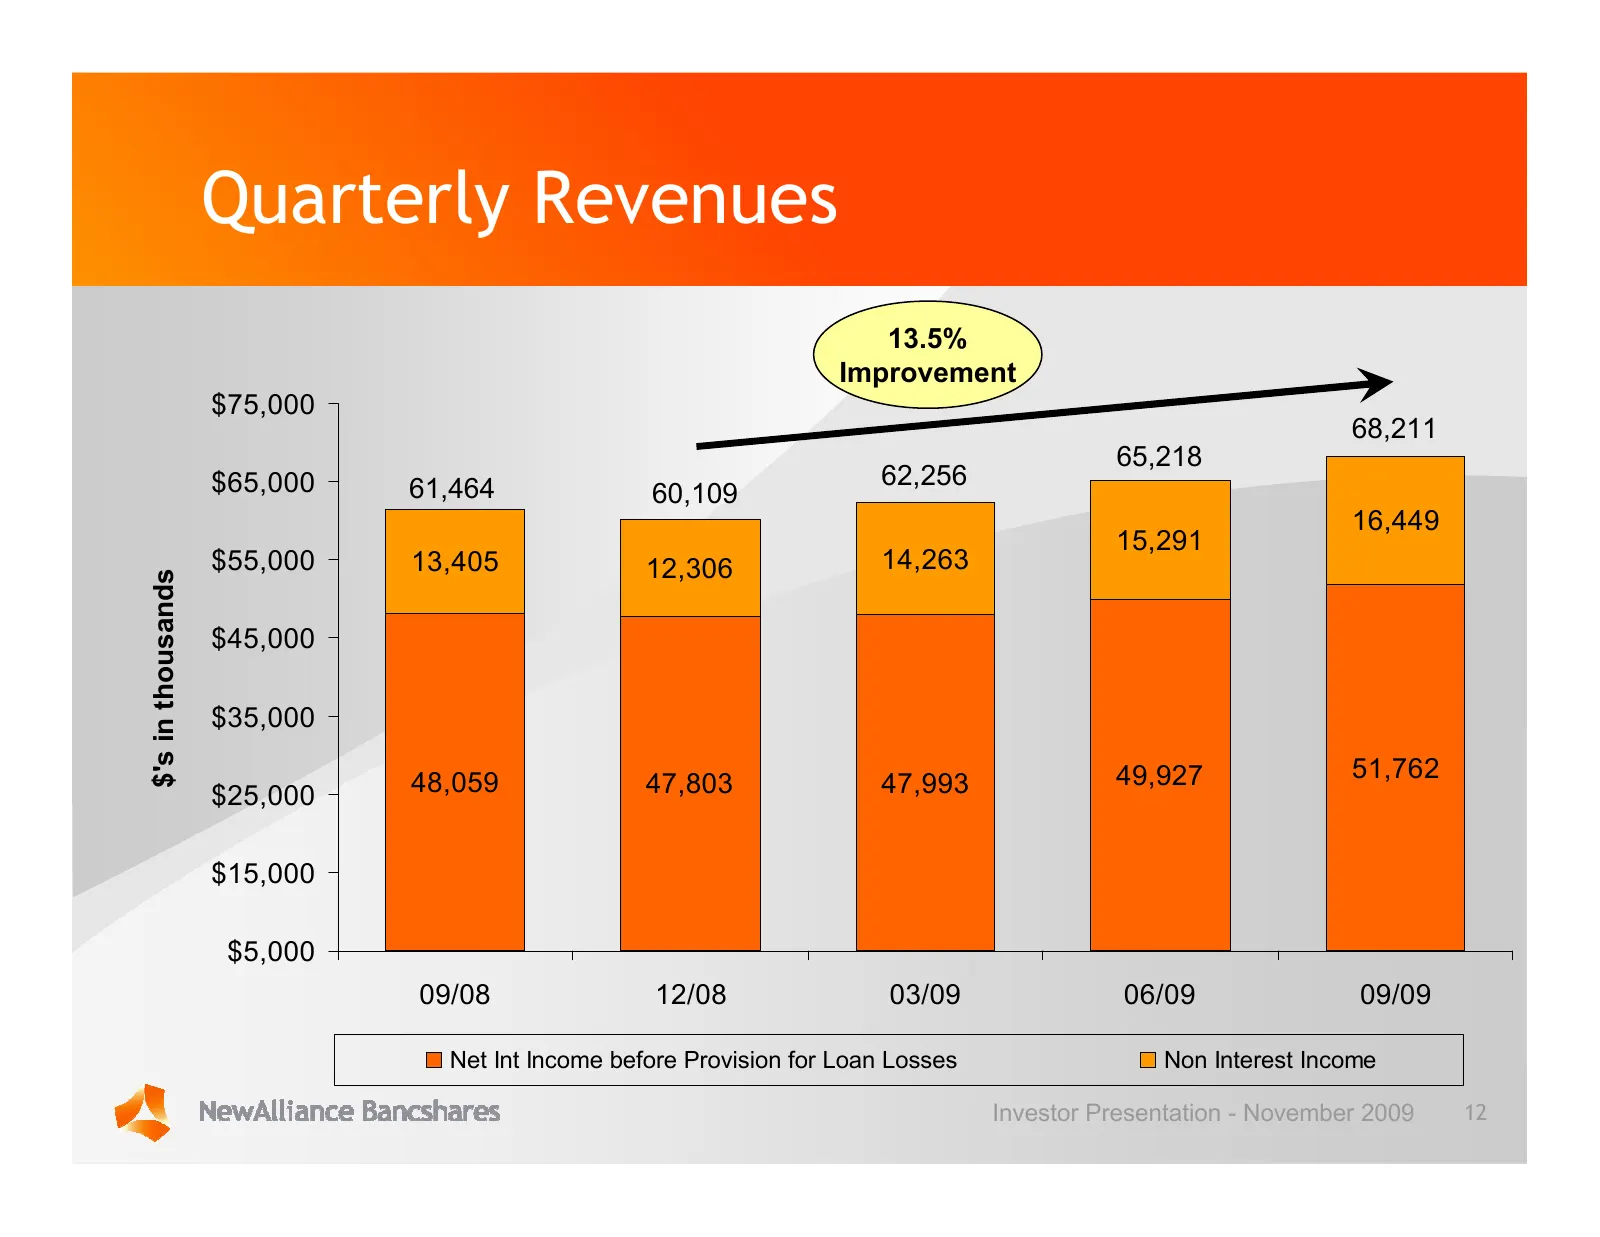
Quarterly Revenues 13.5% Improvement $75,000 68,211 65,218 $65,000 61,464 62,256 60,109 16,449 15,291 $55,000 13,405 12,306 14,263 $'s in thousands $45,000 $35,000 49,927 51,762 $25,000 48,059 47,803 47,993 $15,000 $5,000 09/08 12/08 03/09 06/09 09/09 Net Int Income before Provision for Loan Losses
Slide 13: Deposit Pricing Trends
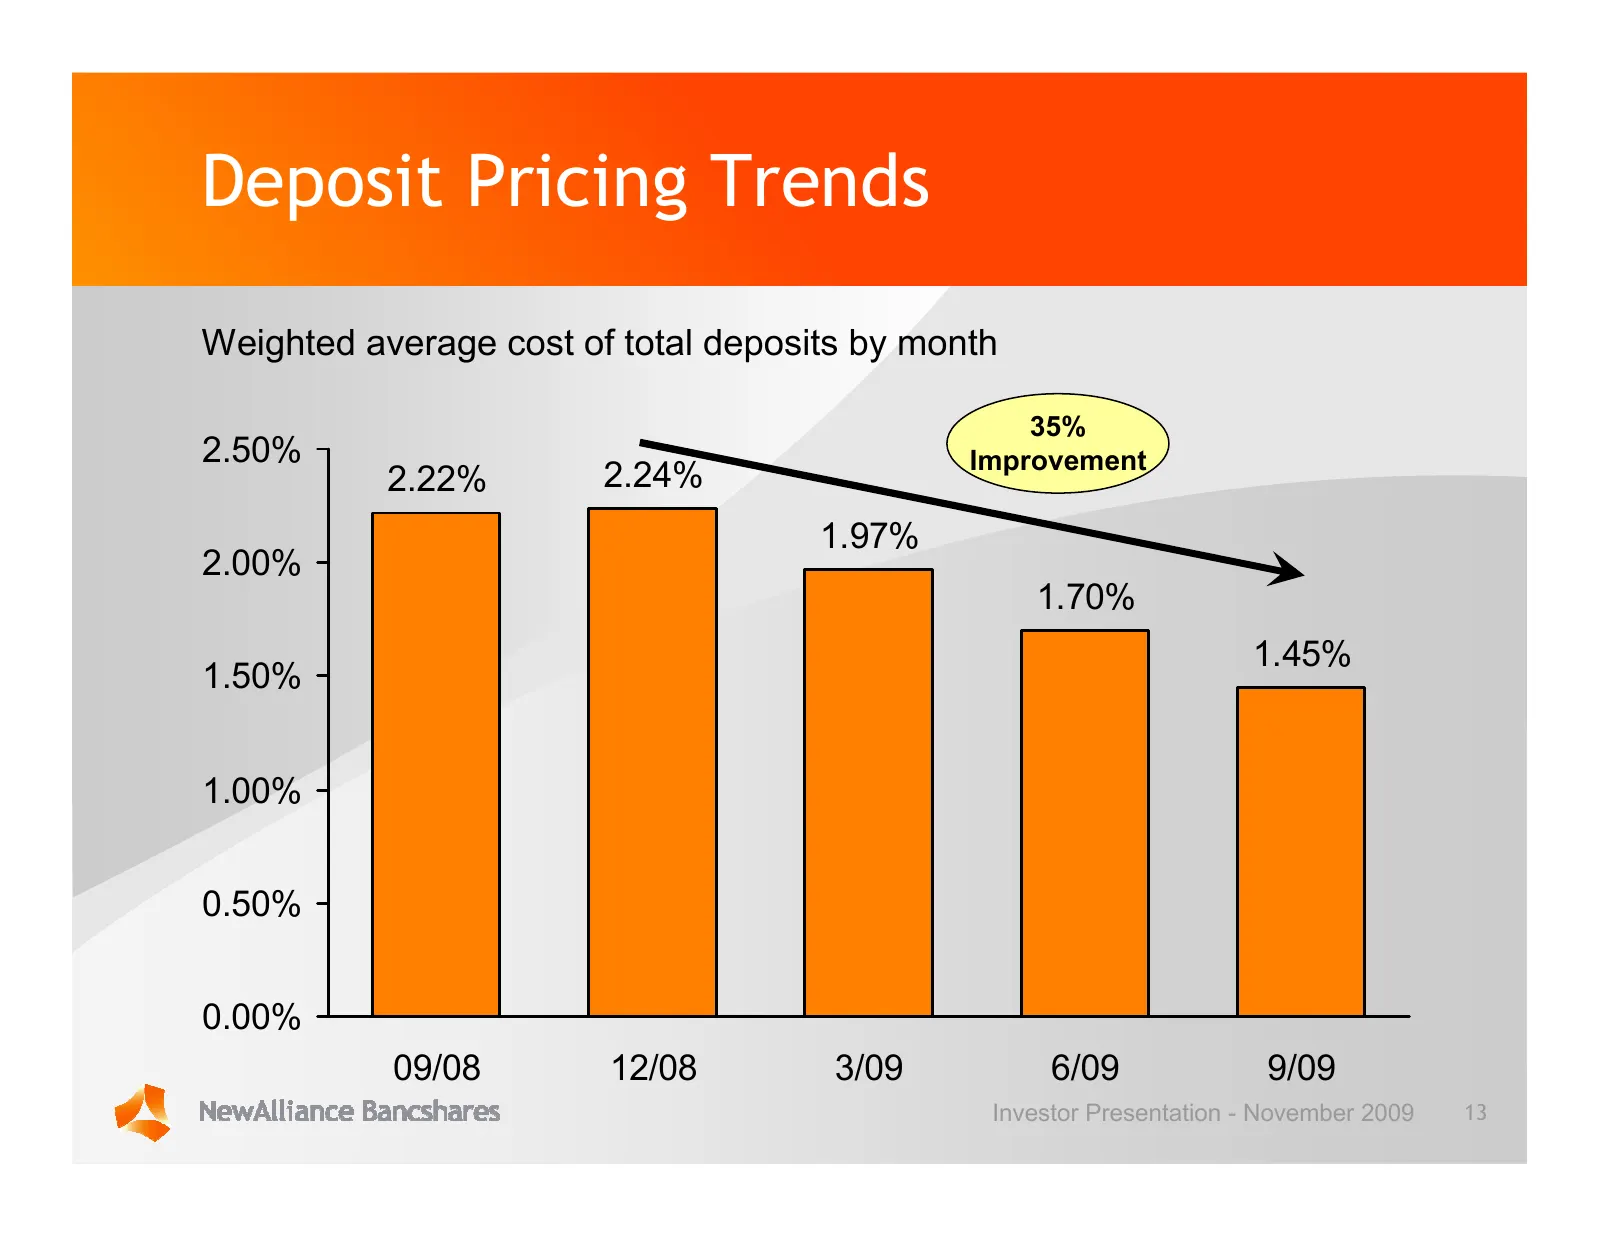
Deposit Pricing Trends Weighted average cost of total deposits by month 35% 2.50% Improvement 2.22% 2.24% 1.97% 2.00% 1.70% 1.45% 1.50% 1.00% 0.50% 0.00% 09/08 12/08 3/09 6/09 9/09 Investor Presentation - November 2009 13
Slide 14: Quarterly Non Interest Income
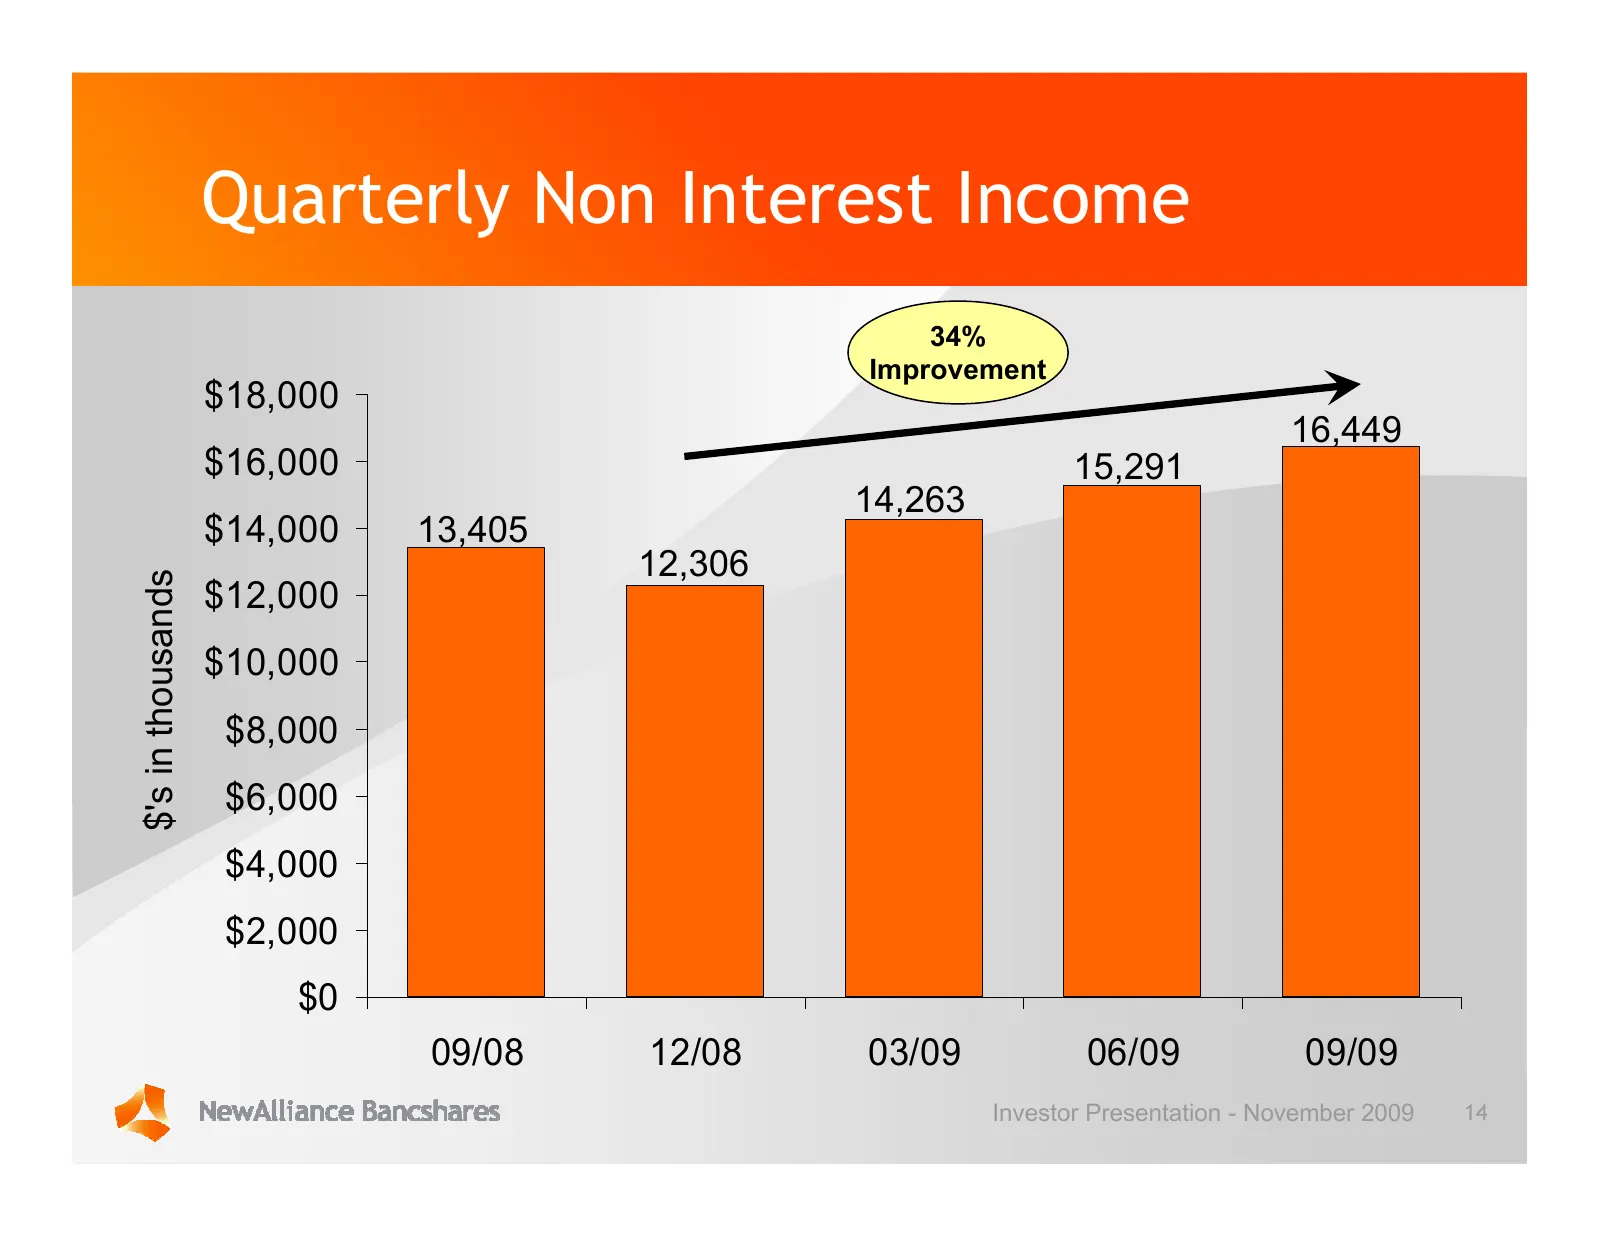
Quarterly Non Interest Income 34% Improvement $18,000 16,449 $16,000 15,291 14,263 $14,000 13,405 12,306 $'s in thousands $12,000 $10,000 $8,000 $6,000 $4,000 $2,000 $0 09/08 12/08 03/09 06/09 09/09 Investor Presentation - November 2009 14
Slide 15: Highlights of Third Quarter 2009
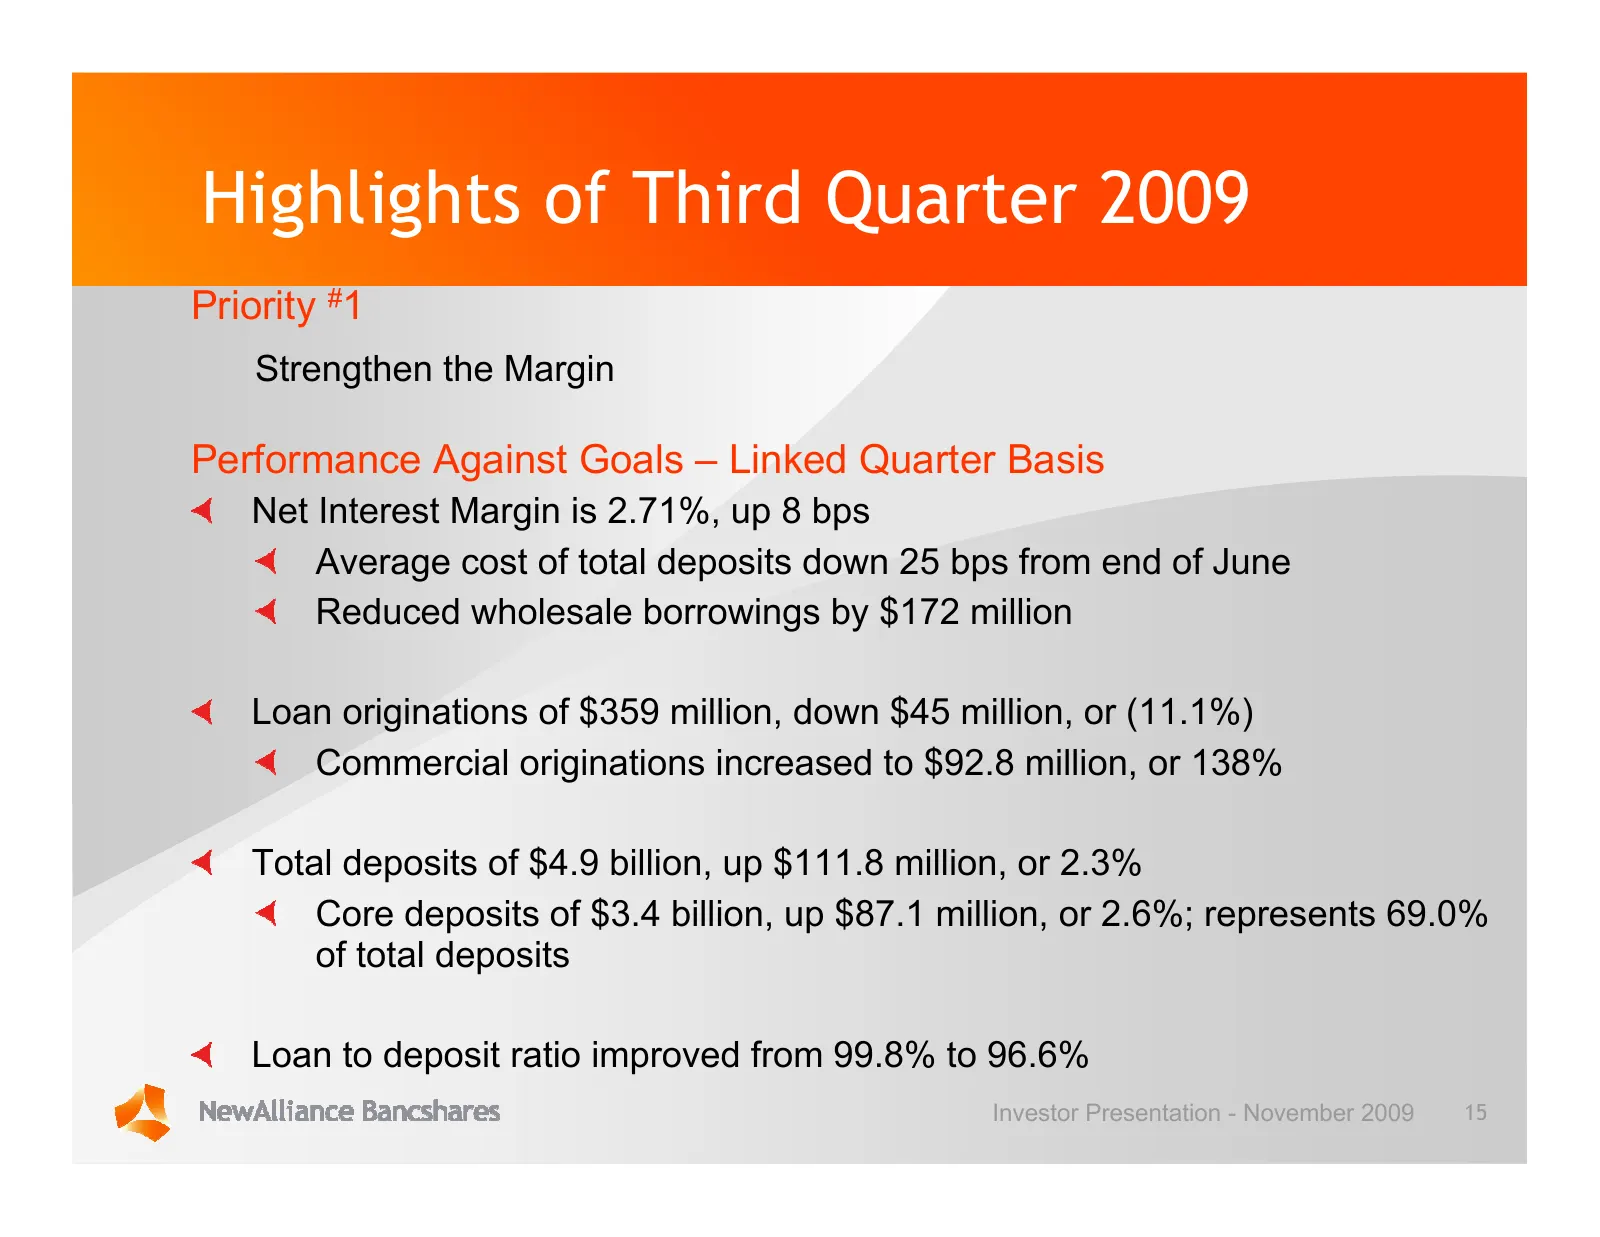
Highlights of Third Quarter 2009 Priority #1 Strengthen the Margin Performance Against Goals – Linked Quarter Basis Net Interest Margin is 2.71%, up 8 bps Average cost of total deposits down 25 bps from end of June Reduced wholesale borrowings by $172 million Loan originations of $359 million, down
Slide 16: Quarterly Loan Originations
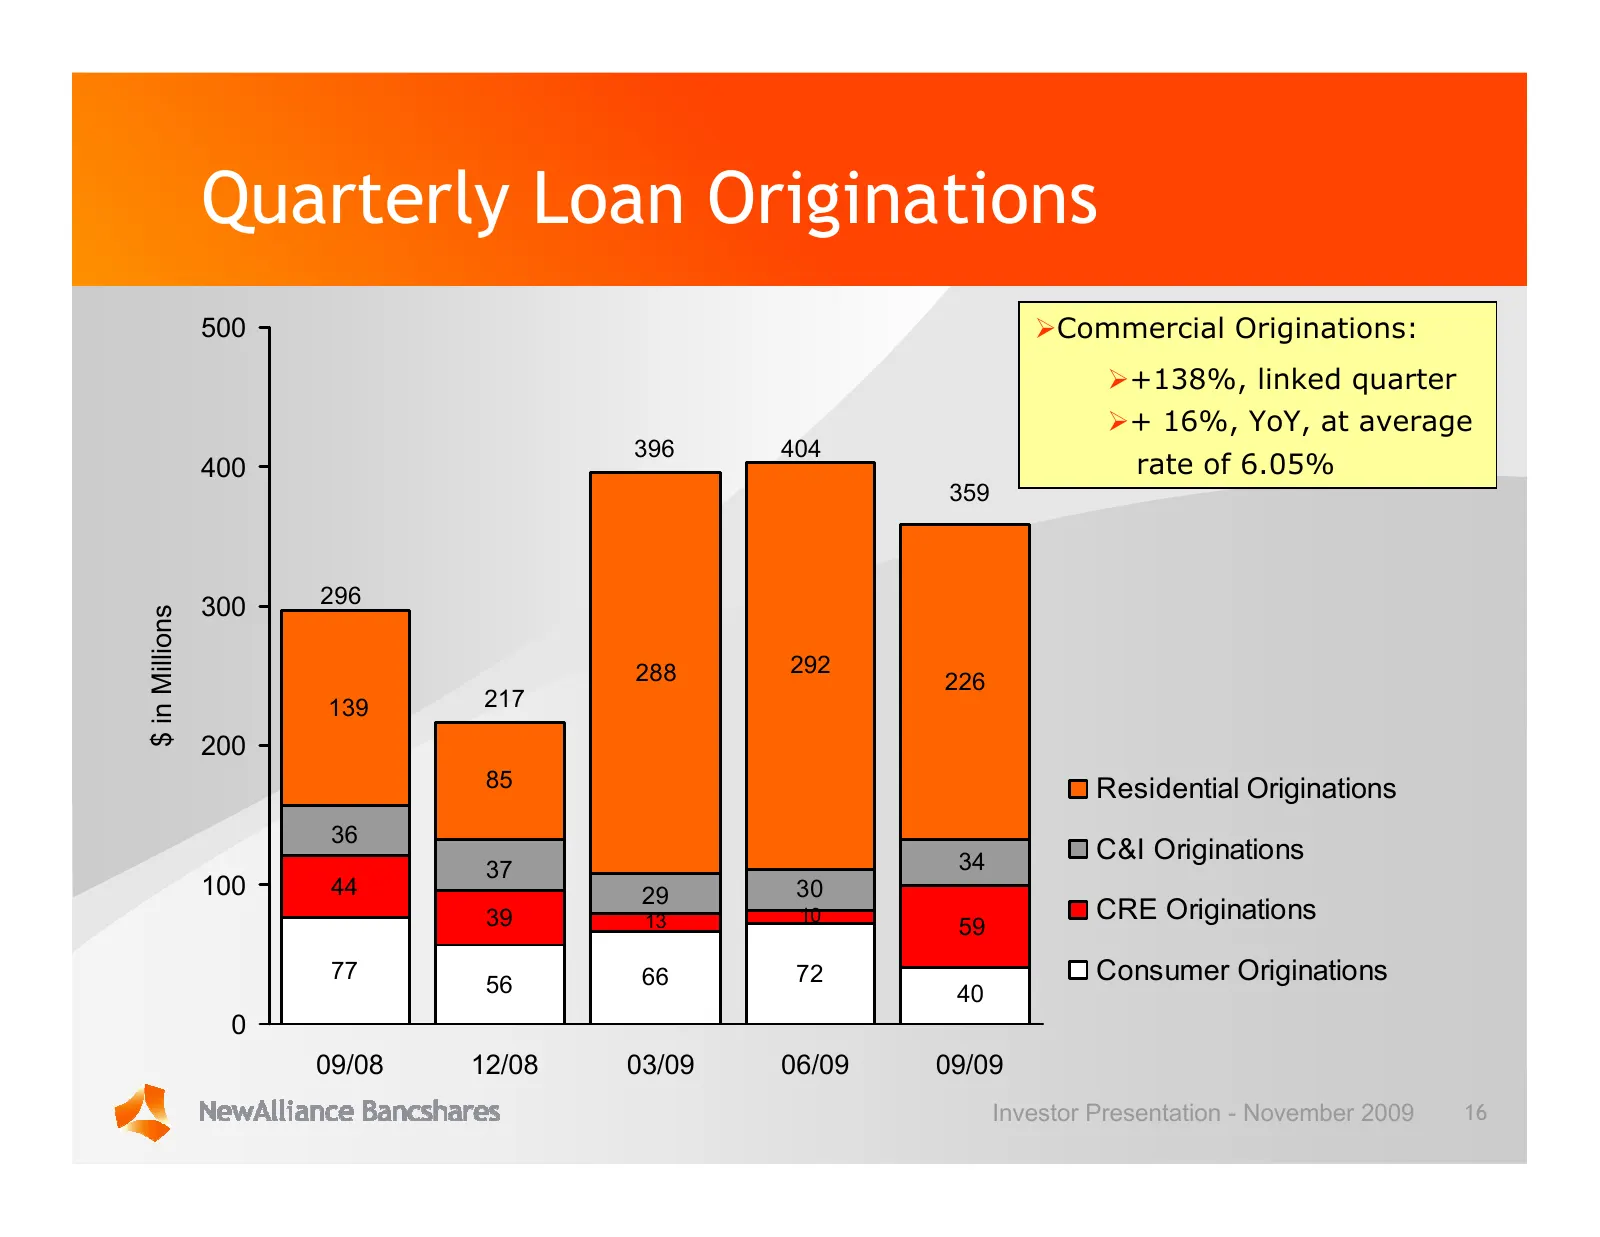
Quarterly Loan Originations 500 ØCommercial Originations: Ø+138%, linked quarter Ø+ 16%, YoY, at average 396 404 400 rate of 6.05% 359 296 300 $ in Millions 288 292 226 139 217 200 85 Residential Originations 36 34 C&I Originations 37 100 44 29 30 39 13 10 CRE Originations 59 77 56 66 72 Consumer Or
Slide 17: Quarter End Loan Balances
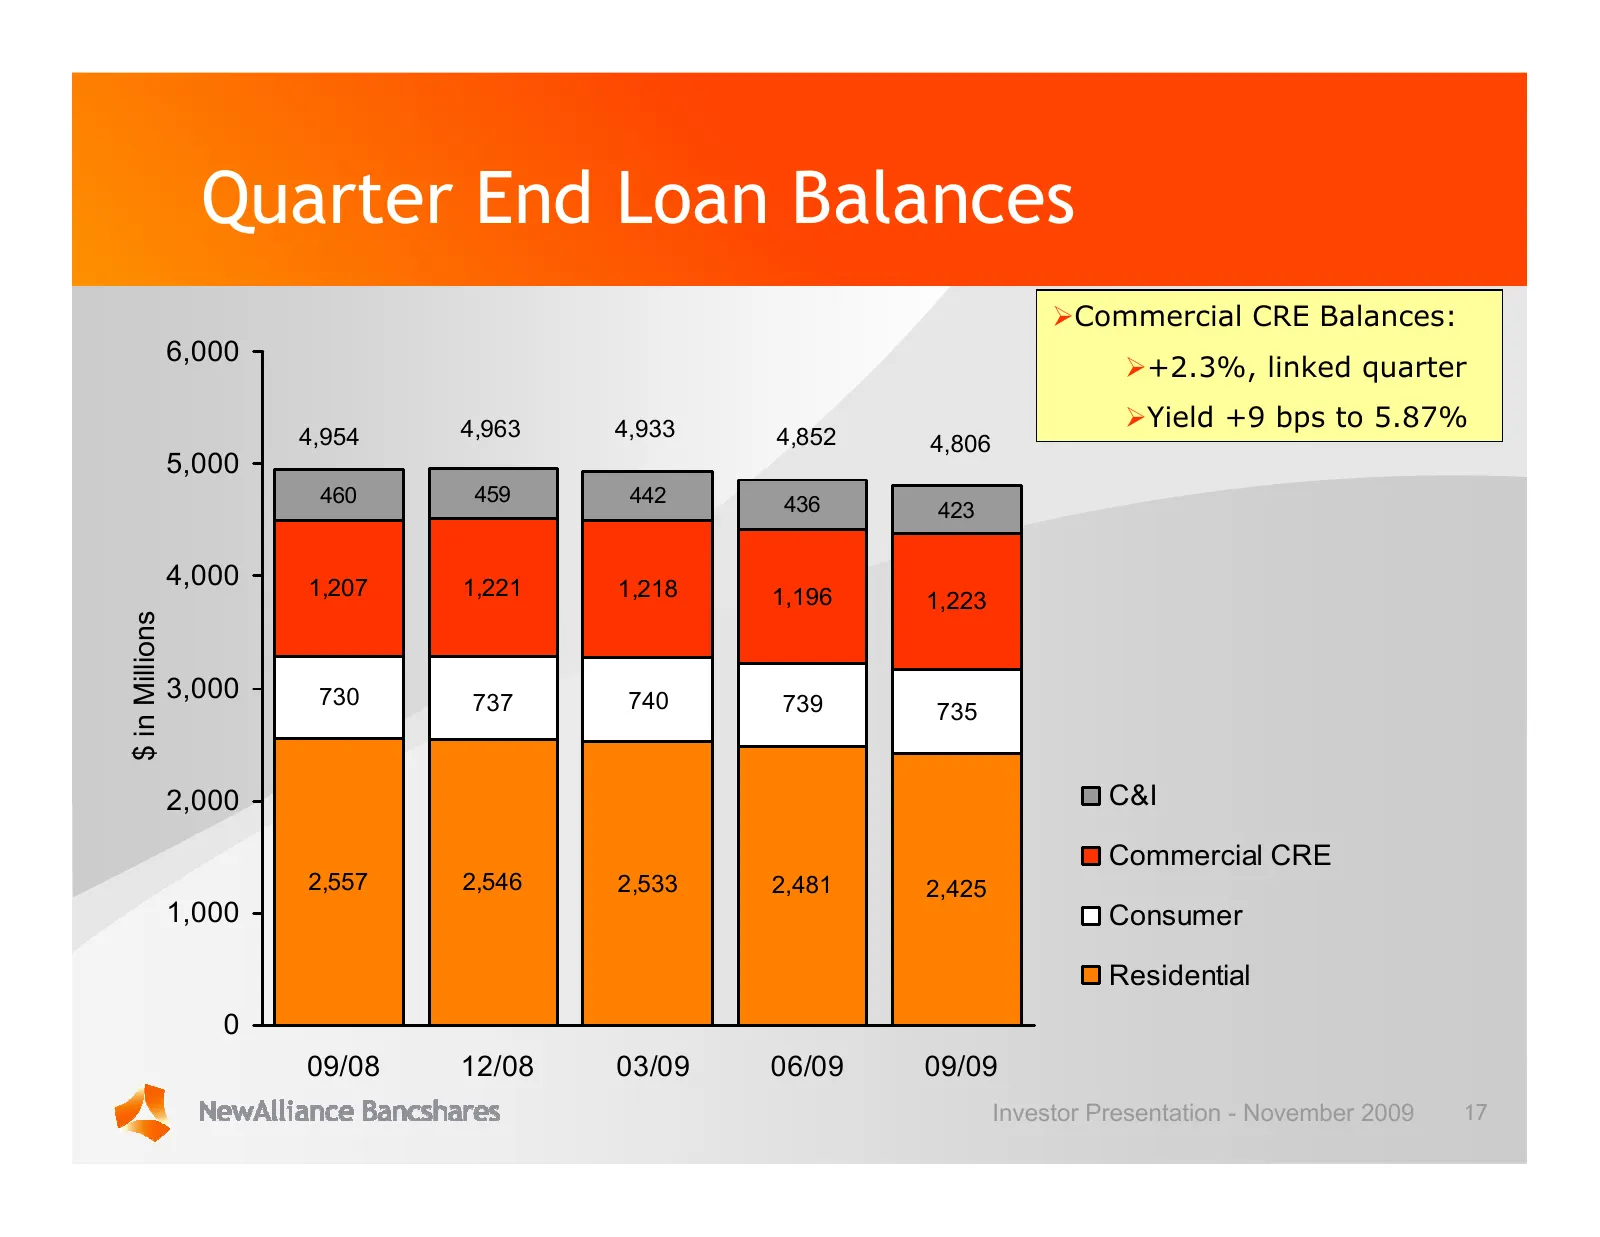
Quarter End Loan Balances ØCommercial CRE Balances: 6,000 Ø+2.3%, linked quarter 4,963 4,933 ØYield +9 bps to 5.87% 4,954 4,852 4,806 5,000 460 459 442 436 423 4,000 1,207 1,221 1,218 1,196 1,223 $ in Millions 3,000 730 737 740 739 735 2,000 C&I Commercial CRE 2,557 2,546 2,533 2,481 2,425 1,000 Con
Slide 18: Quarter End Deposit Balances
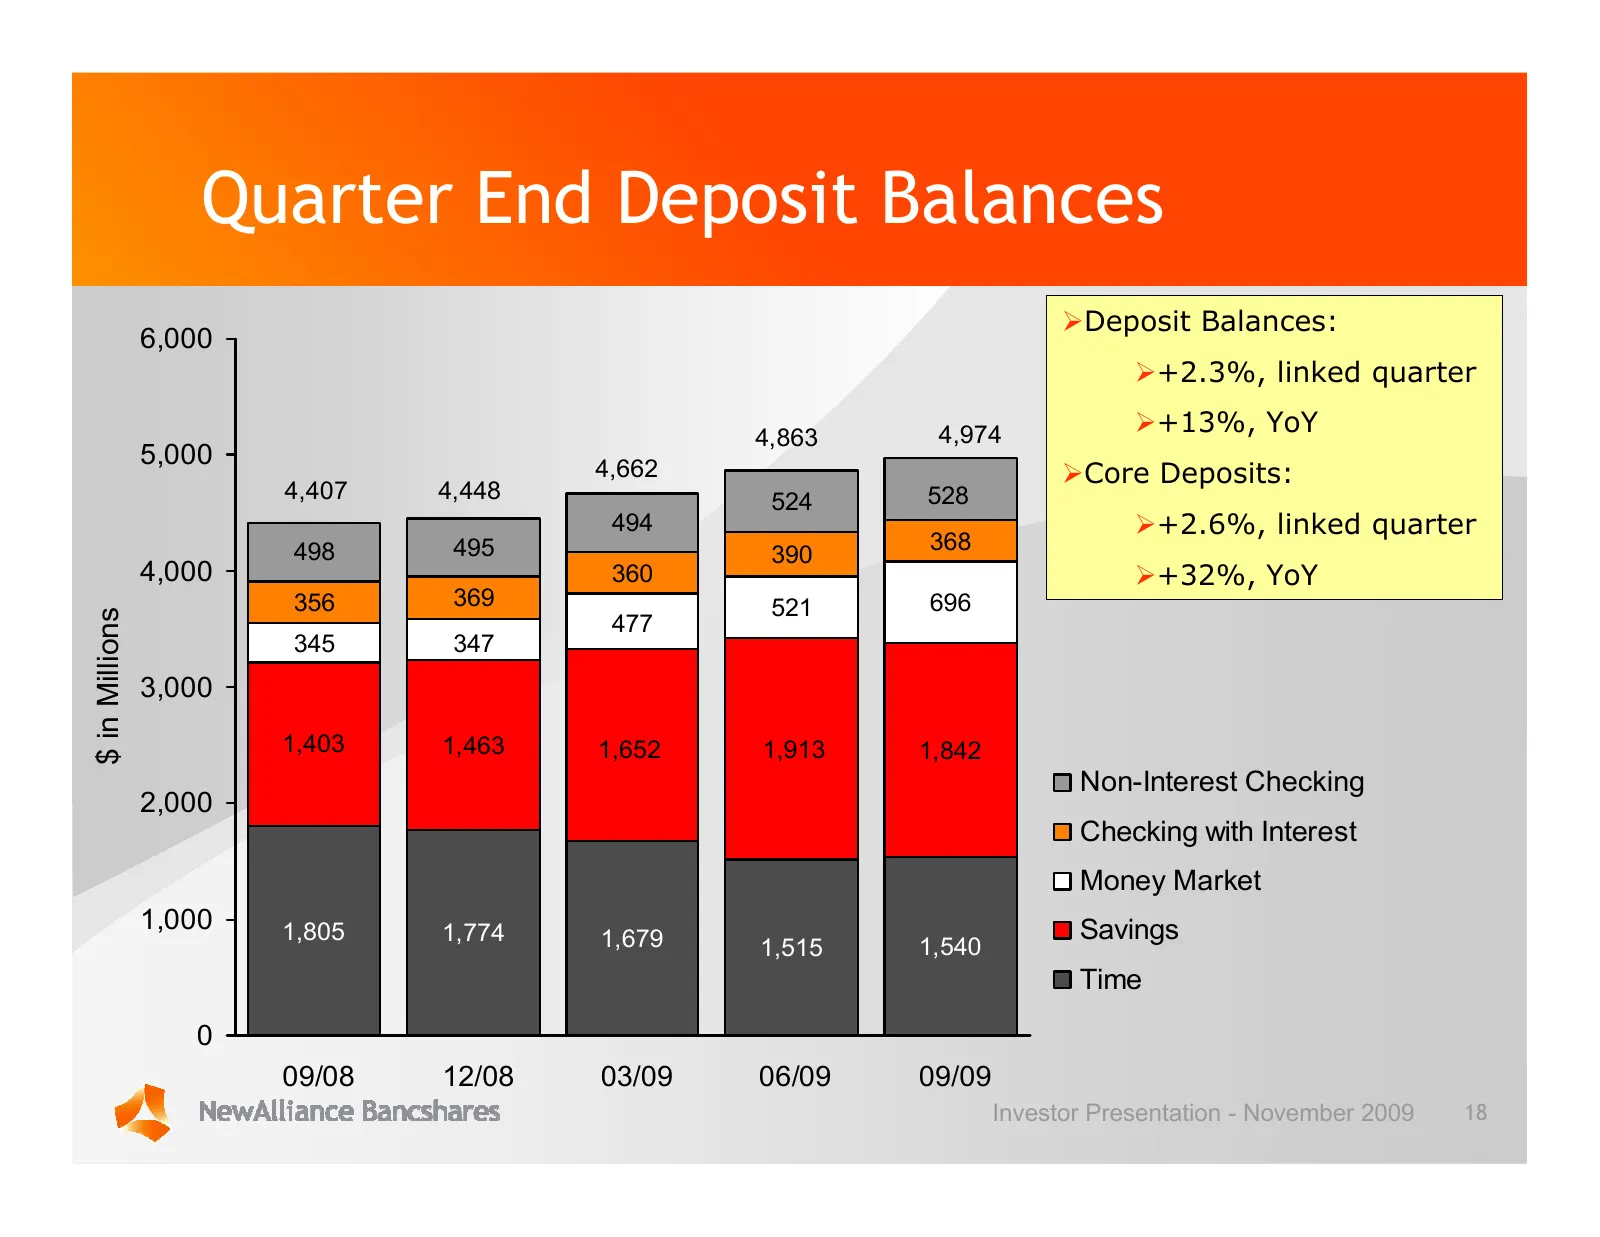
Quarter End Deposit Balances ØDeposit Balances: 6,000 Ø+2.3%, linked quarter 4,863 4,974 Ø+13%, YoY 5,000 4,662 ØCore Deposits: 4,407 4,448 524 528 494 Ø+2.6%, linked quarter 498 495 368 390 4,000 360 Ø+32%, YoY 356 369 521 696 $ in Millions 477 345 347 3,000 1,403 1,463 1,652 1,913 1,842 Non-Intere
Slide 19: Highlights of Third Quarter 2009: Build Core Fee Income
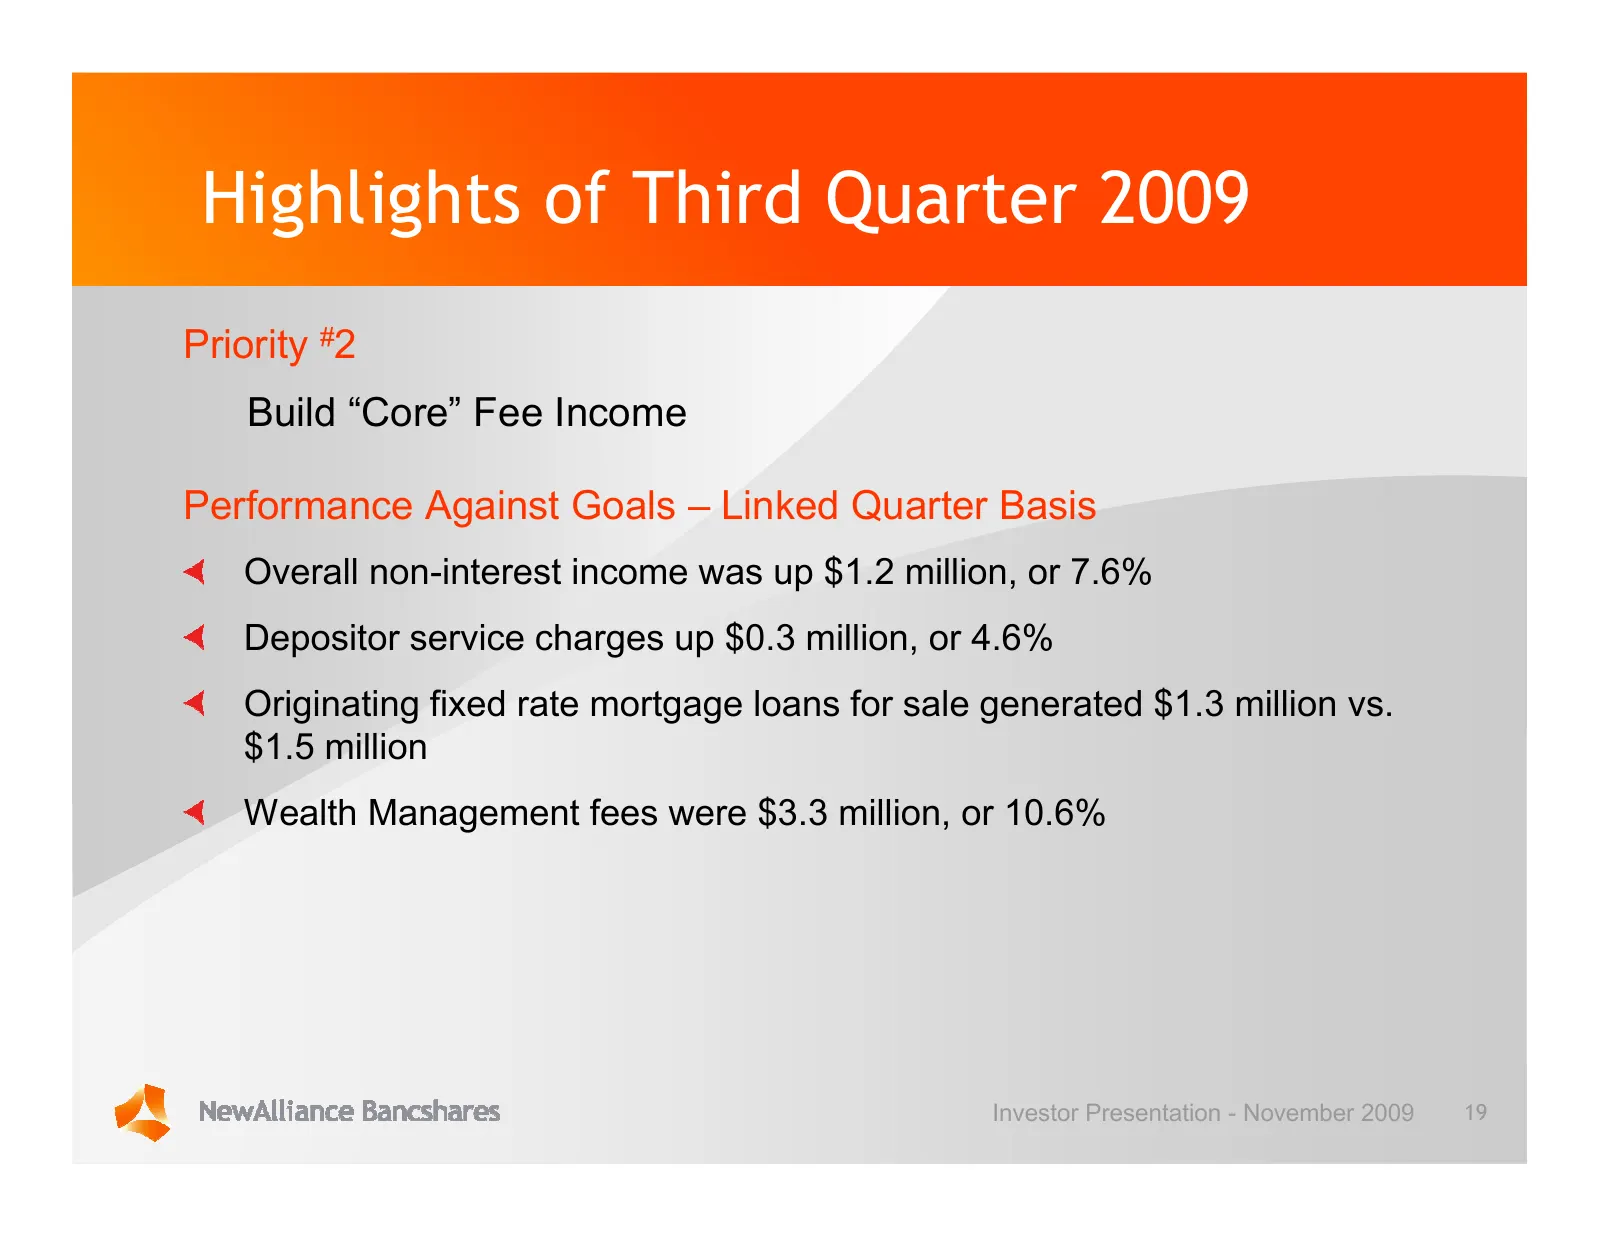
Highlights of Third Quarter 2009 Priority #2 Build “Core” Fee Income Performance Against Goals – Linked Quarter Basis Overall non-interest income was up $1.2 million, or 7.6% Depositor service charges up $0.3 million, or 4.6% Originating fixed rate mortgage loans for sale generated $1.3 million vs.
Slide 20: Highlights of Third Quarter 2009: Manage Credit Quality
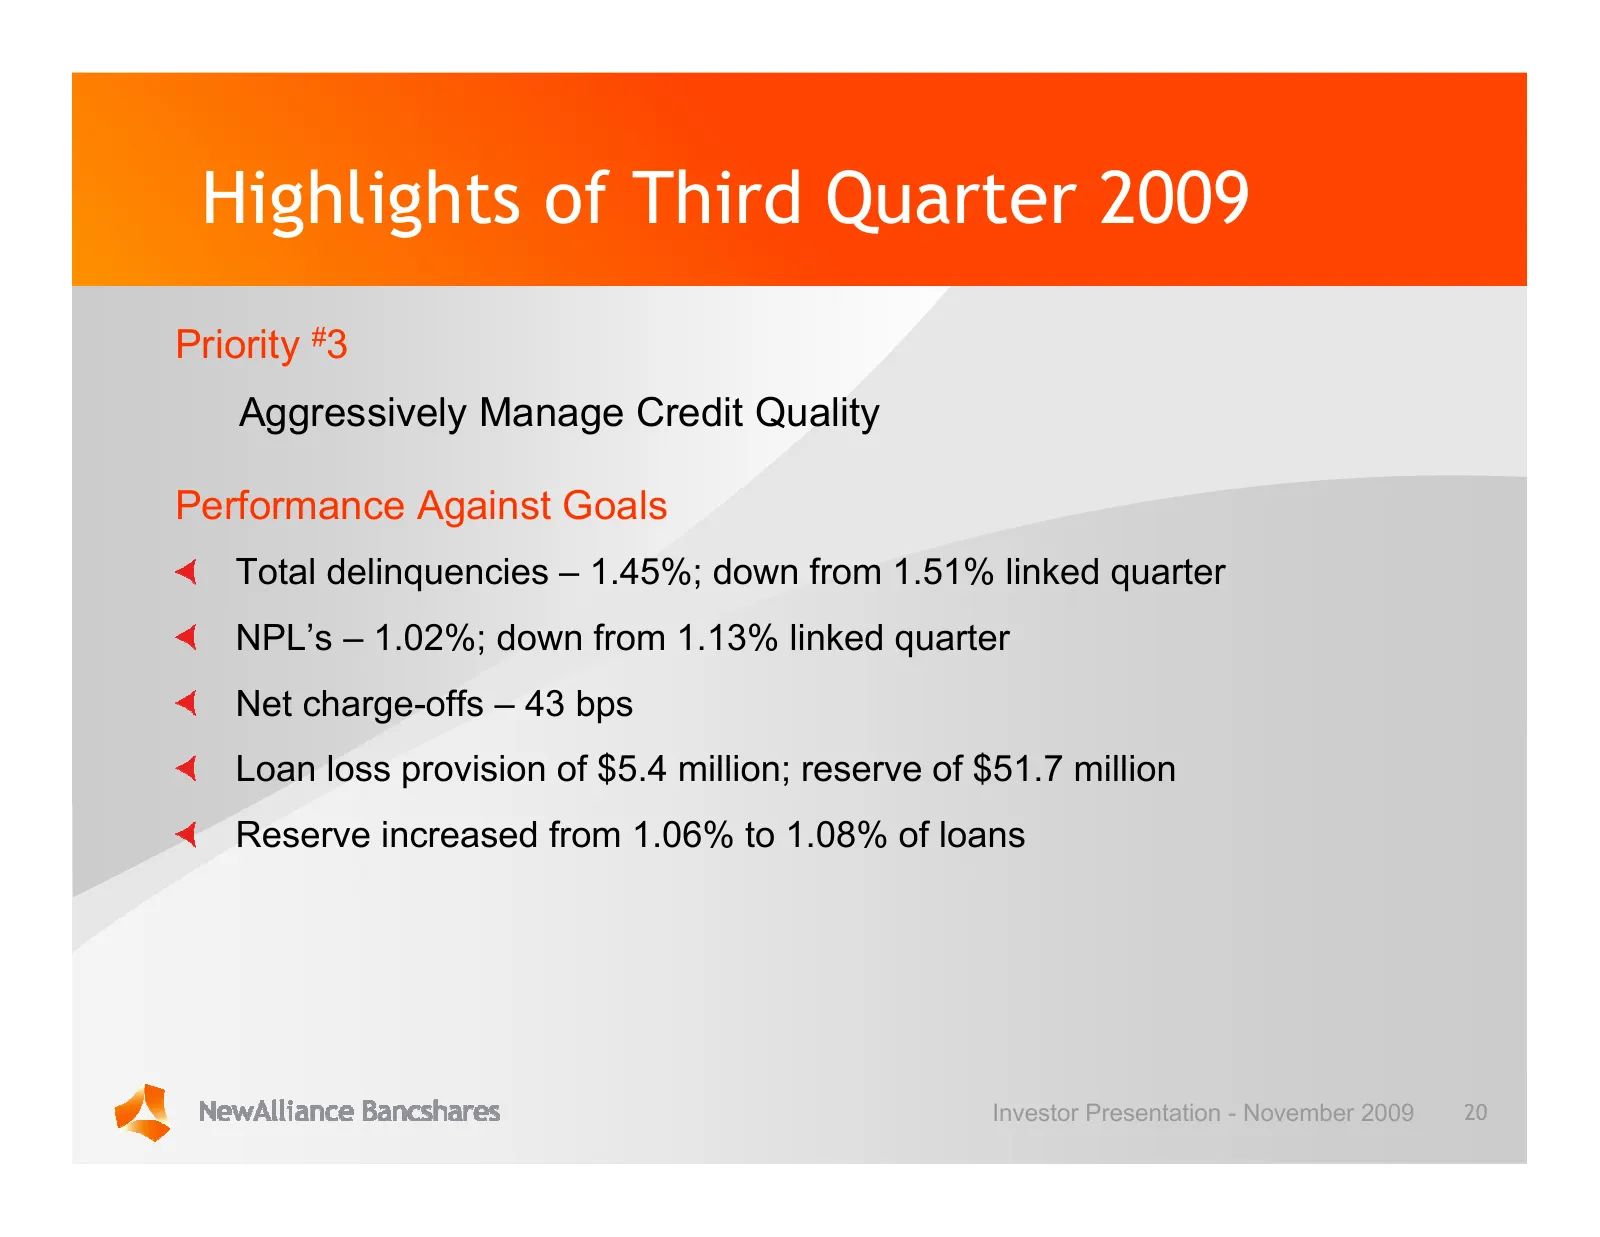
Highlights of Third Quarter 2009 Priority #3 Aggressively Manage Credit Quality Performance Against Goals Total delinquencies – 1.45%; down from 1.51% linked quarter NPL’s – 1.02%; down from 1.13% linked quarter Net charge-offs – 43 bps Loan loss provision of $5.4 million; reserve of $51.7 million R
Slide 21: Highlights of Third Quarter 2009: Maintain Flat Expenses
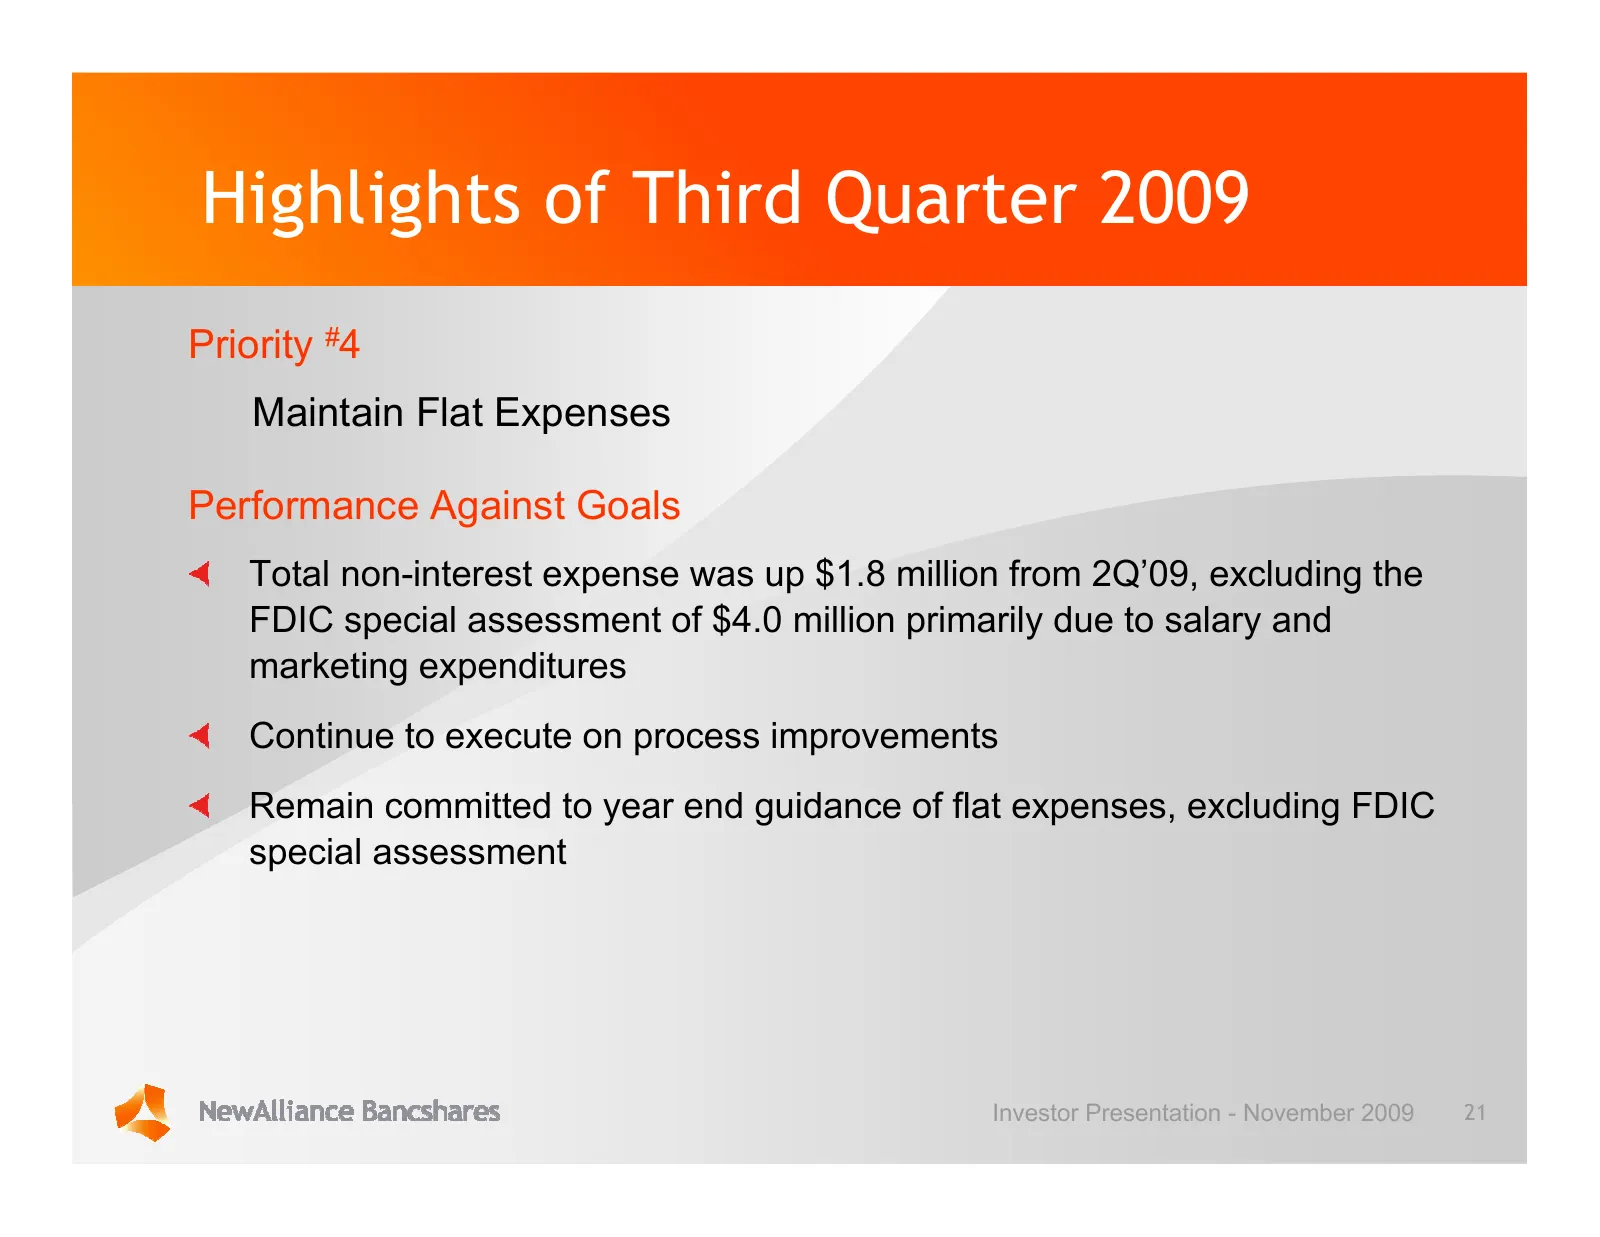
Highlights of Third Quarter 2009 Priority #4 Maintain Flat Expenses Performance Against Goals Total non-interest expense was up $1.8 million from 2Q’09, excluding the FDIC special assessment of $4.0 million primarily due to salary and marketing expenditures Continue to execute on process improvement
Slide 22: Highlights of Third Quarter 2009: Grow the Franchise
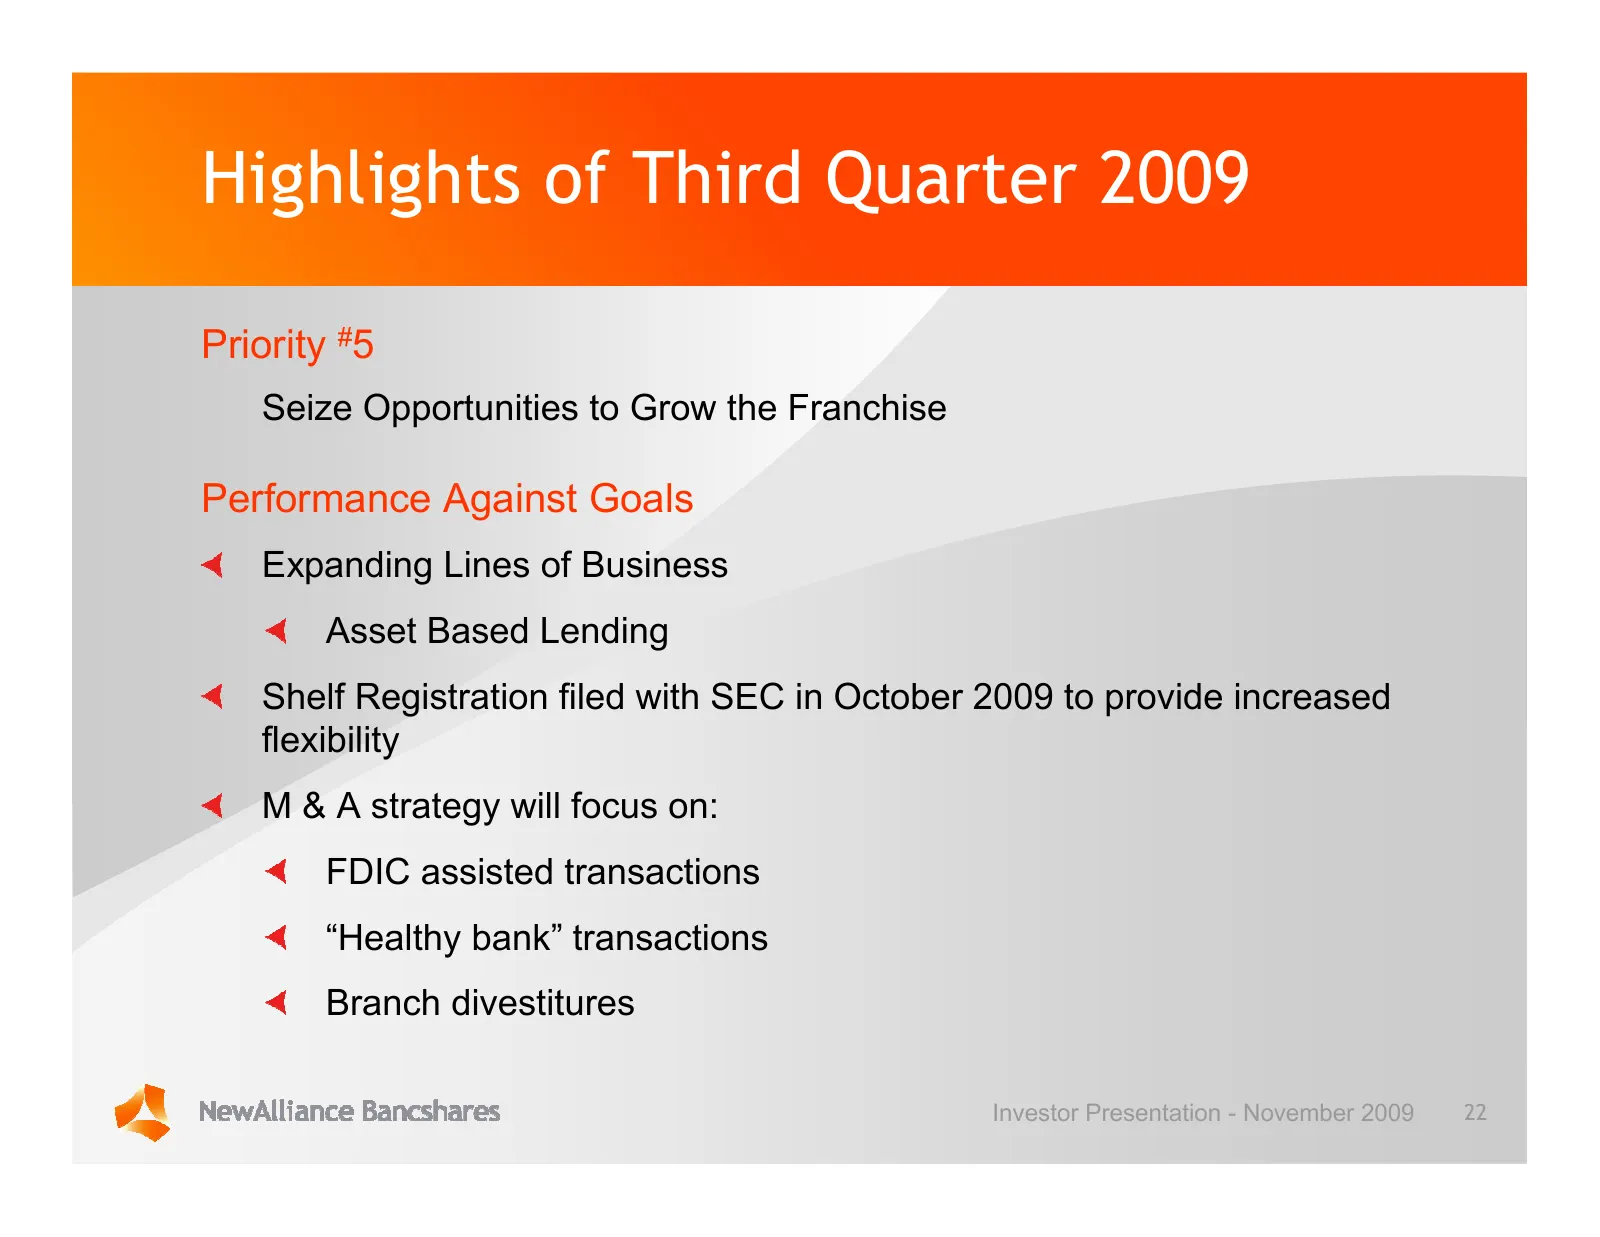
Highlights of Third Quarter 2009 Priority #5 Seize Opportunities to Grow the Franchise Performance Against Goals Expanding Lines of Business Asset Based Lending Shelf Registration filed with SEC in October 2009 to provide increased flexibility M & A strategy will focus on: FDIC assisted transactions

Slide 23: Balance Sheet and Credit Quality
Balance Sheet and Credit Quality
Slide 24: Balance Sheet
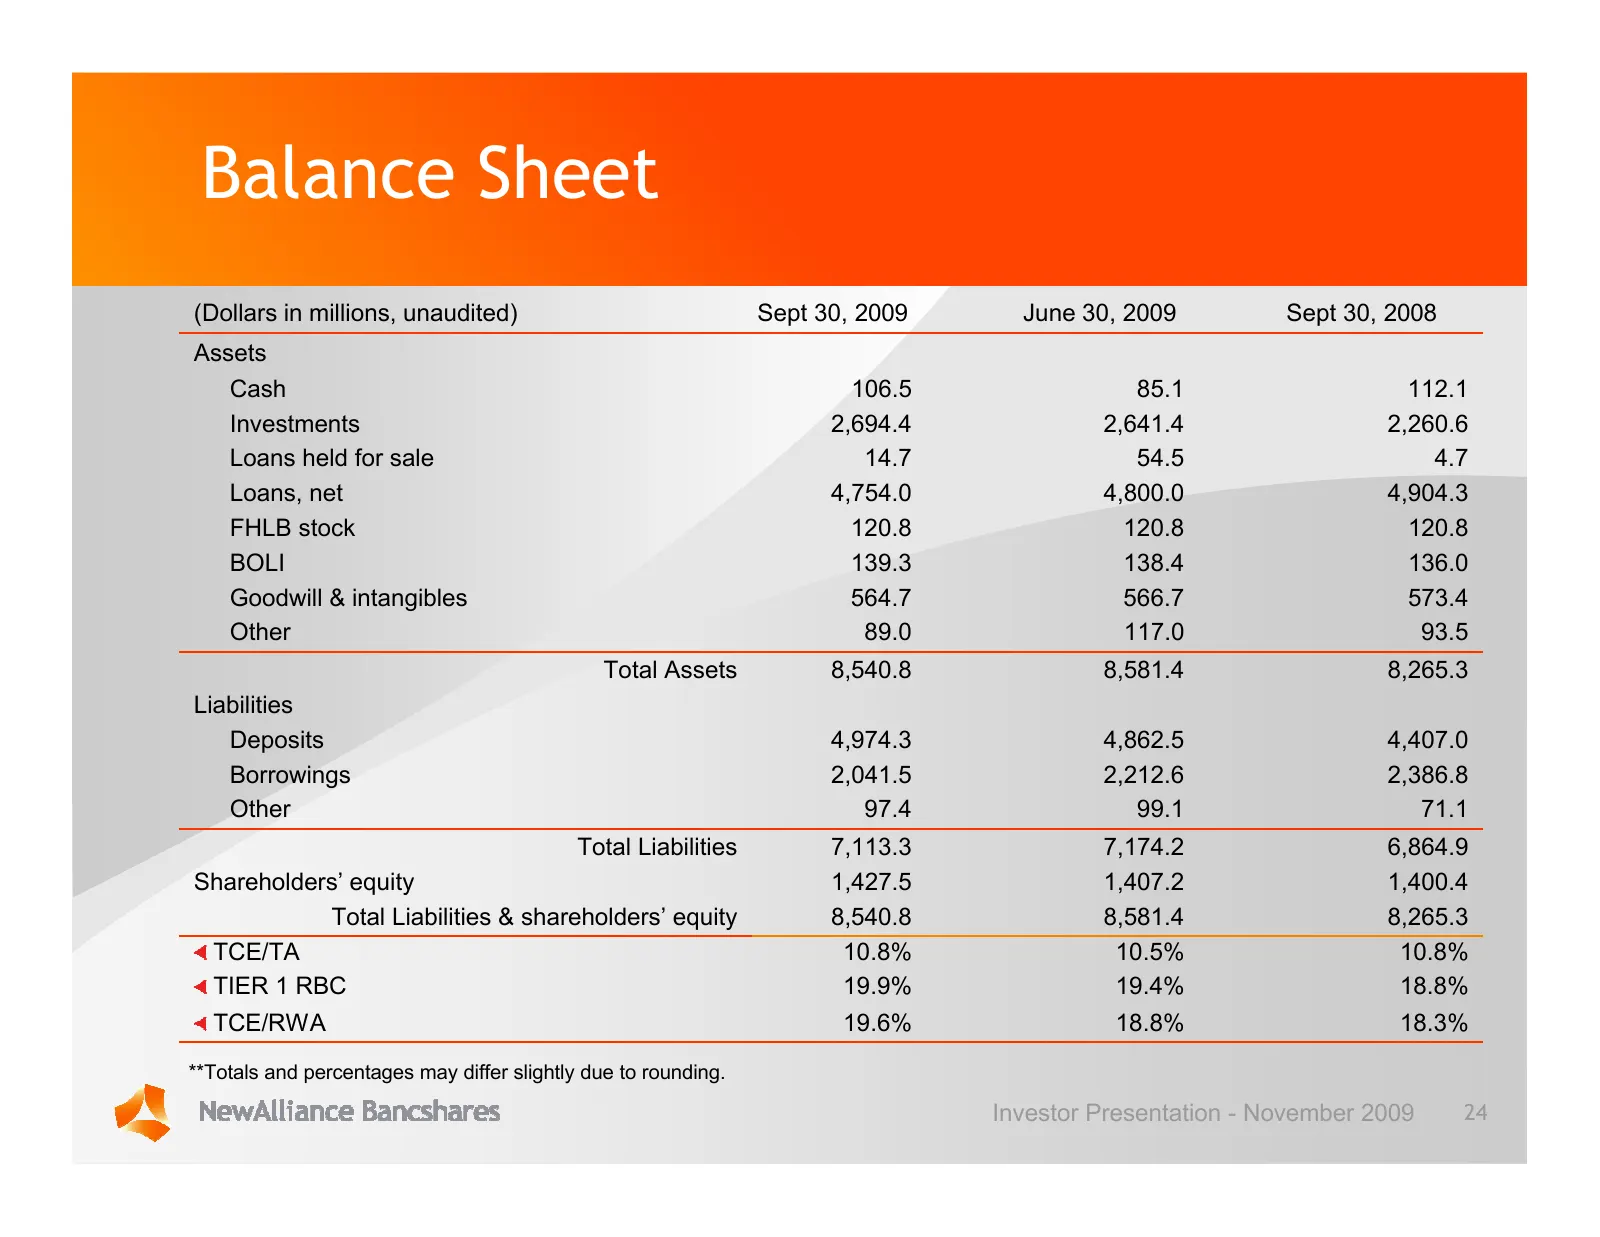
Balance Sheet (Dollars in millions, unaudited) Sept 30, 2009 June 30, 2009 Sept 30, 2008 Assets Cash 106.5 85.1 112.1 Investments 2,694.4 2,641.4 2,260.6 Loans held for sale 14.7 54.5 4.7 Loans, net 4,754.0 4,800.0 4,904.3 FHLB stock 120.8 120.8 120.8 BOLI 139.3 138.4 136.0 Goodwill & intangibles 56
Slide 25: Residential Portfolio Snapshot
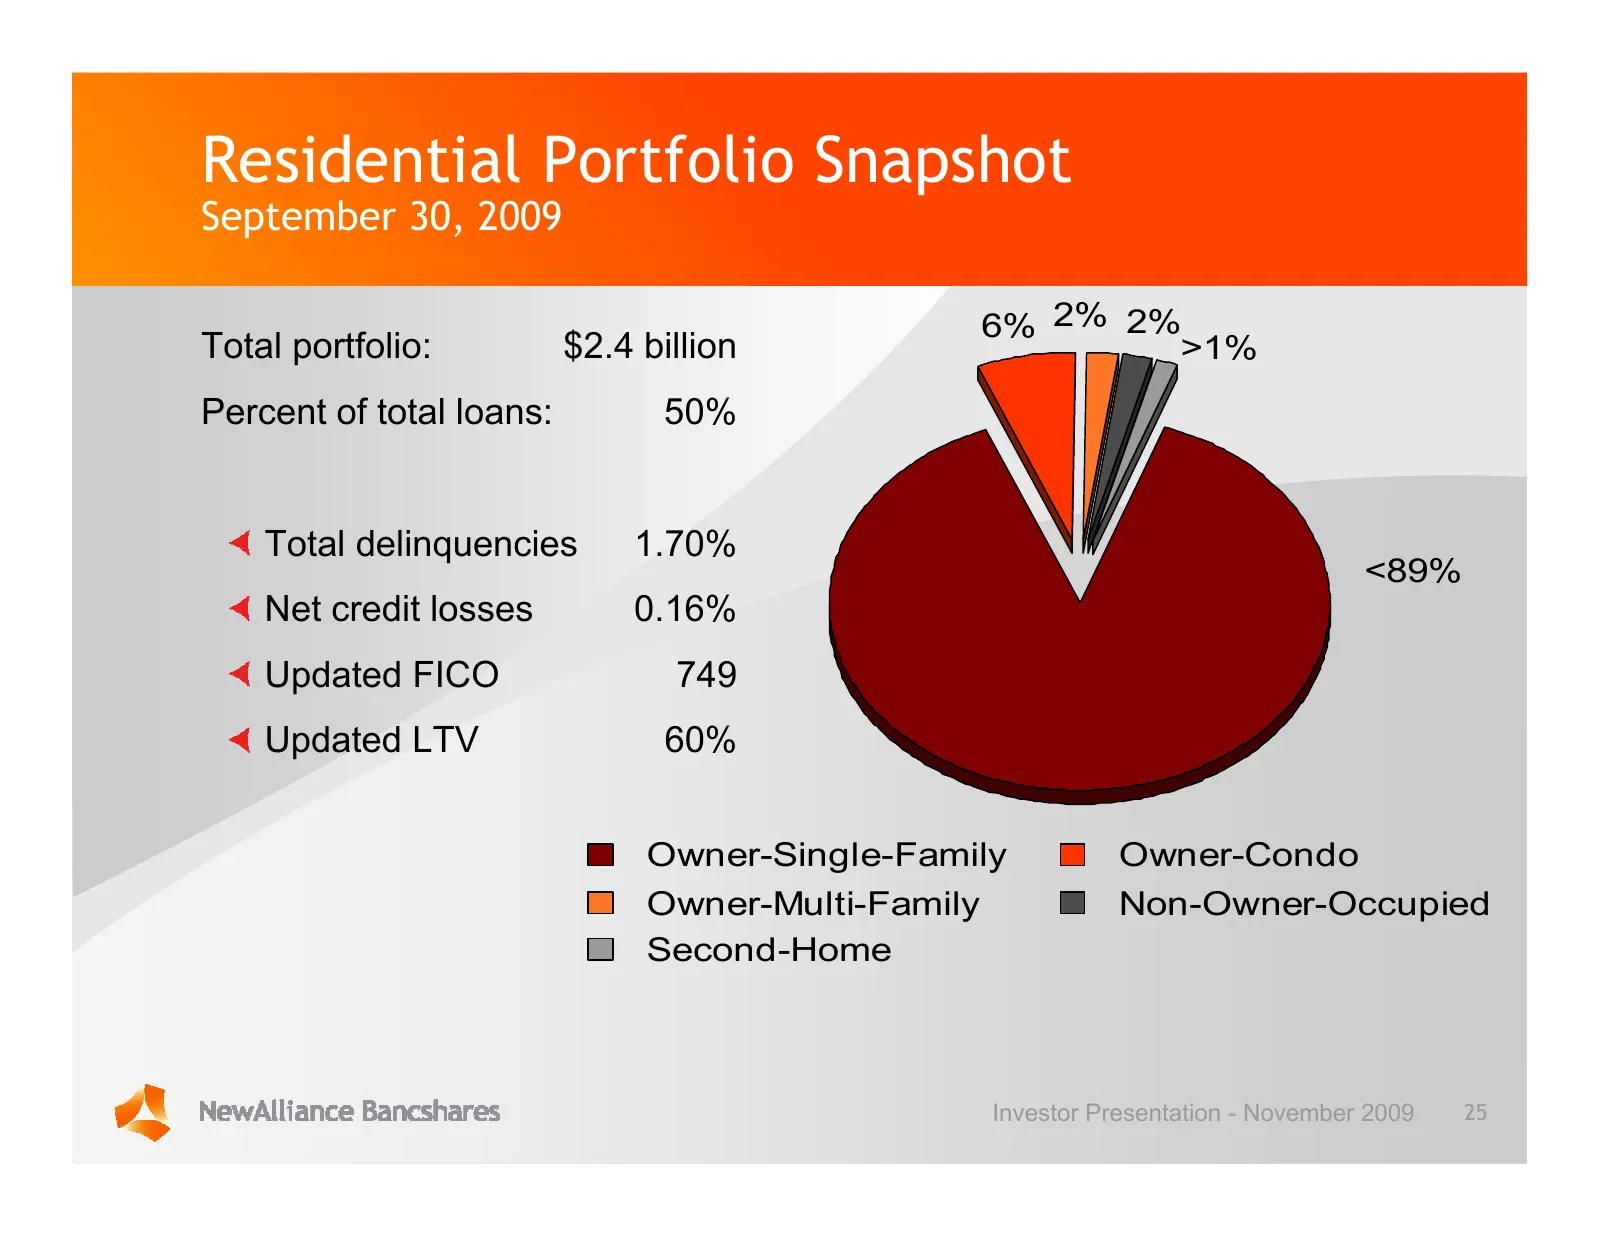
Residential Portfolio Snapshot September 30, 2009 6% 2% 2% Total portfolio: $2.4 billion >1% Percent of total loans: 50% Total delinquencies 1.70% <89% Net credit losses 0.16% Updated FICO 749 Updated LTV 60% Owner-Single-Family Owner-Condo Owner-Multi-Family Non-Owner-Occupied Second-Home Investor
Slide 26: Residential Portfolio FICO Score Distribution
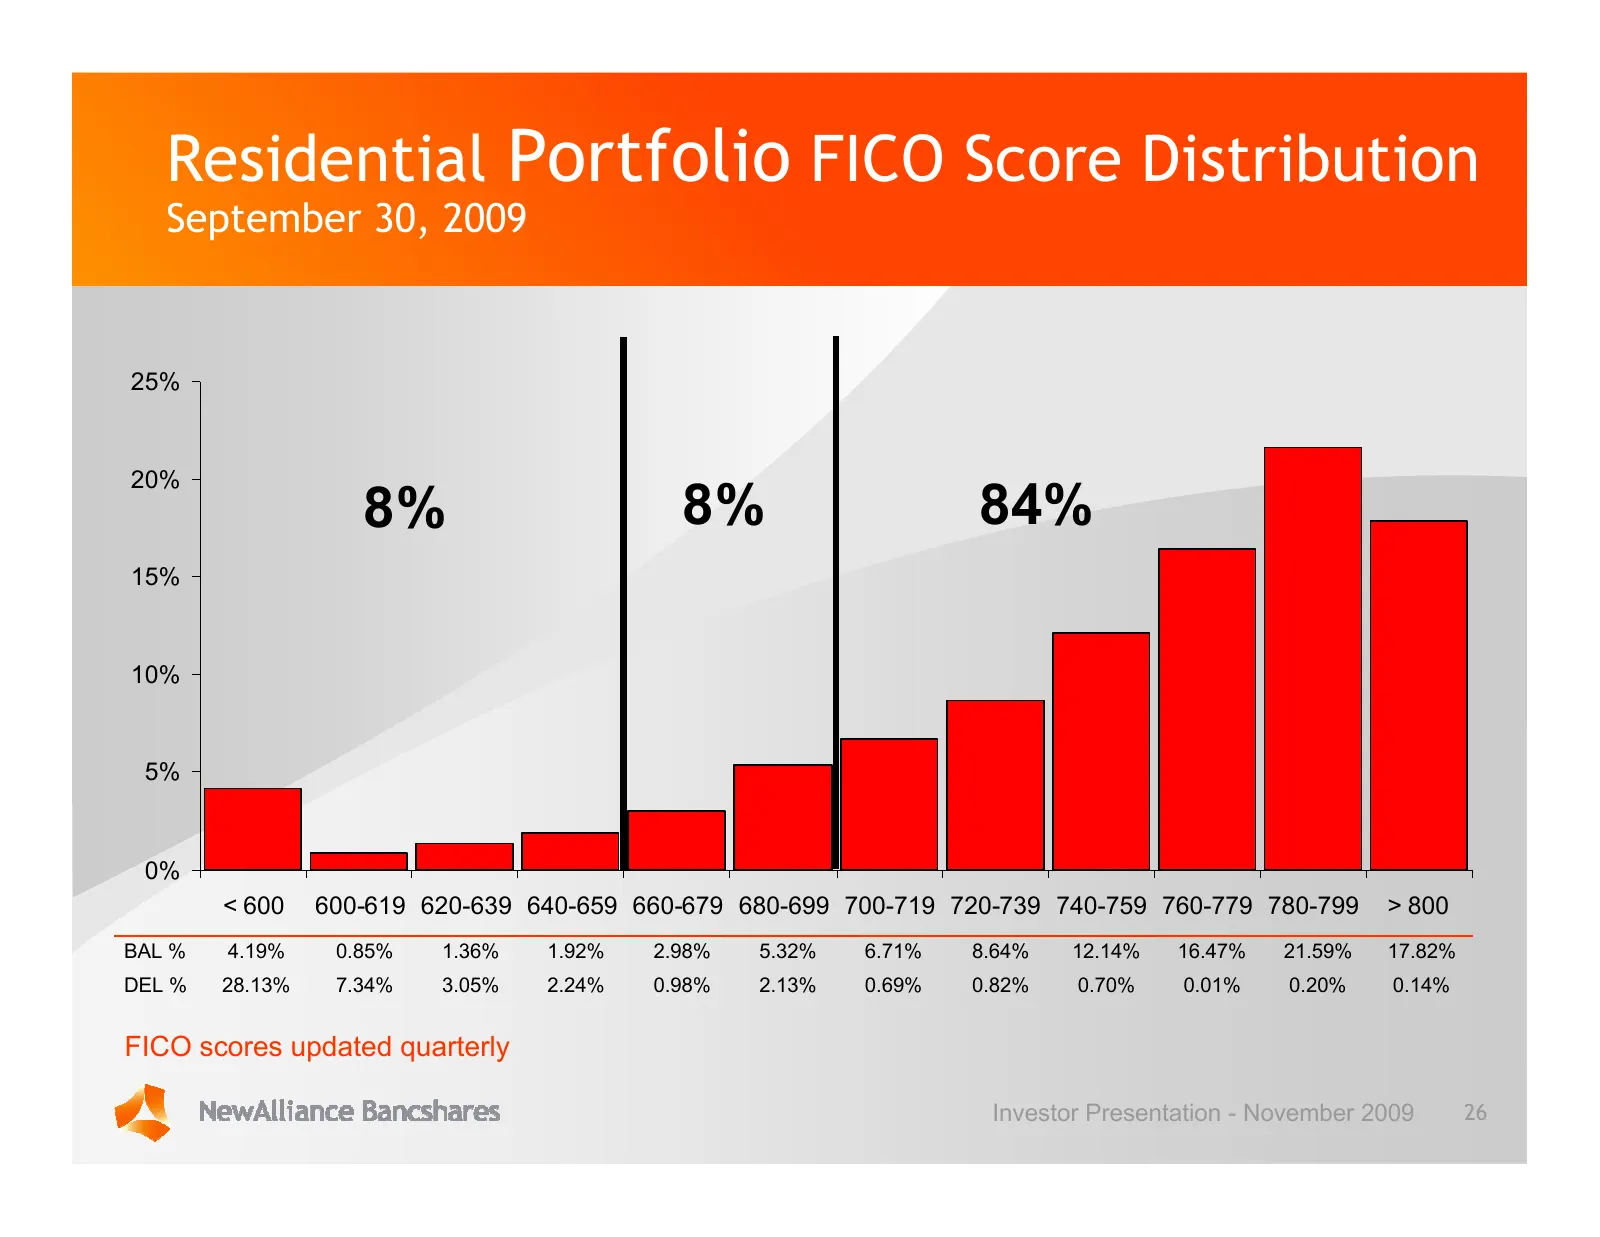
Residential Portfolio FICO Score Distribution September 30, 2009 25% 20% 8% 8% 84% 15% 10% 5% 0% < 600 600-619 620-639 640-659 660-679 680-699 700-719 720-739 740-759 760-779 780-799 > 800 BAL % 4.19% 0.85% 1.36% 1.92% 2.98% 5.32% 6.71% 8.64% 12.14% 16.47% 21.59% 17.82% DEL % 28.13% 7.34% 3.05% 2.24
Slide 27: Residential Mortgage FICO/LTV/Volume Matrix
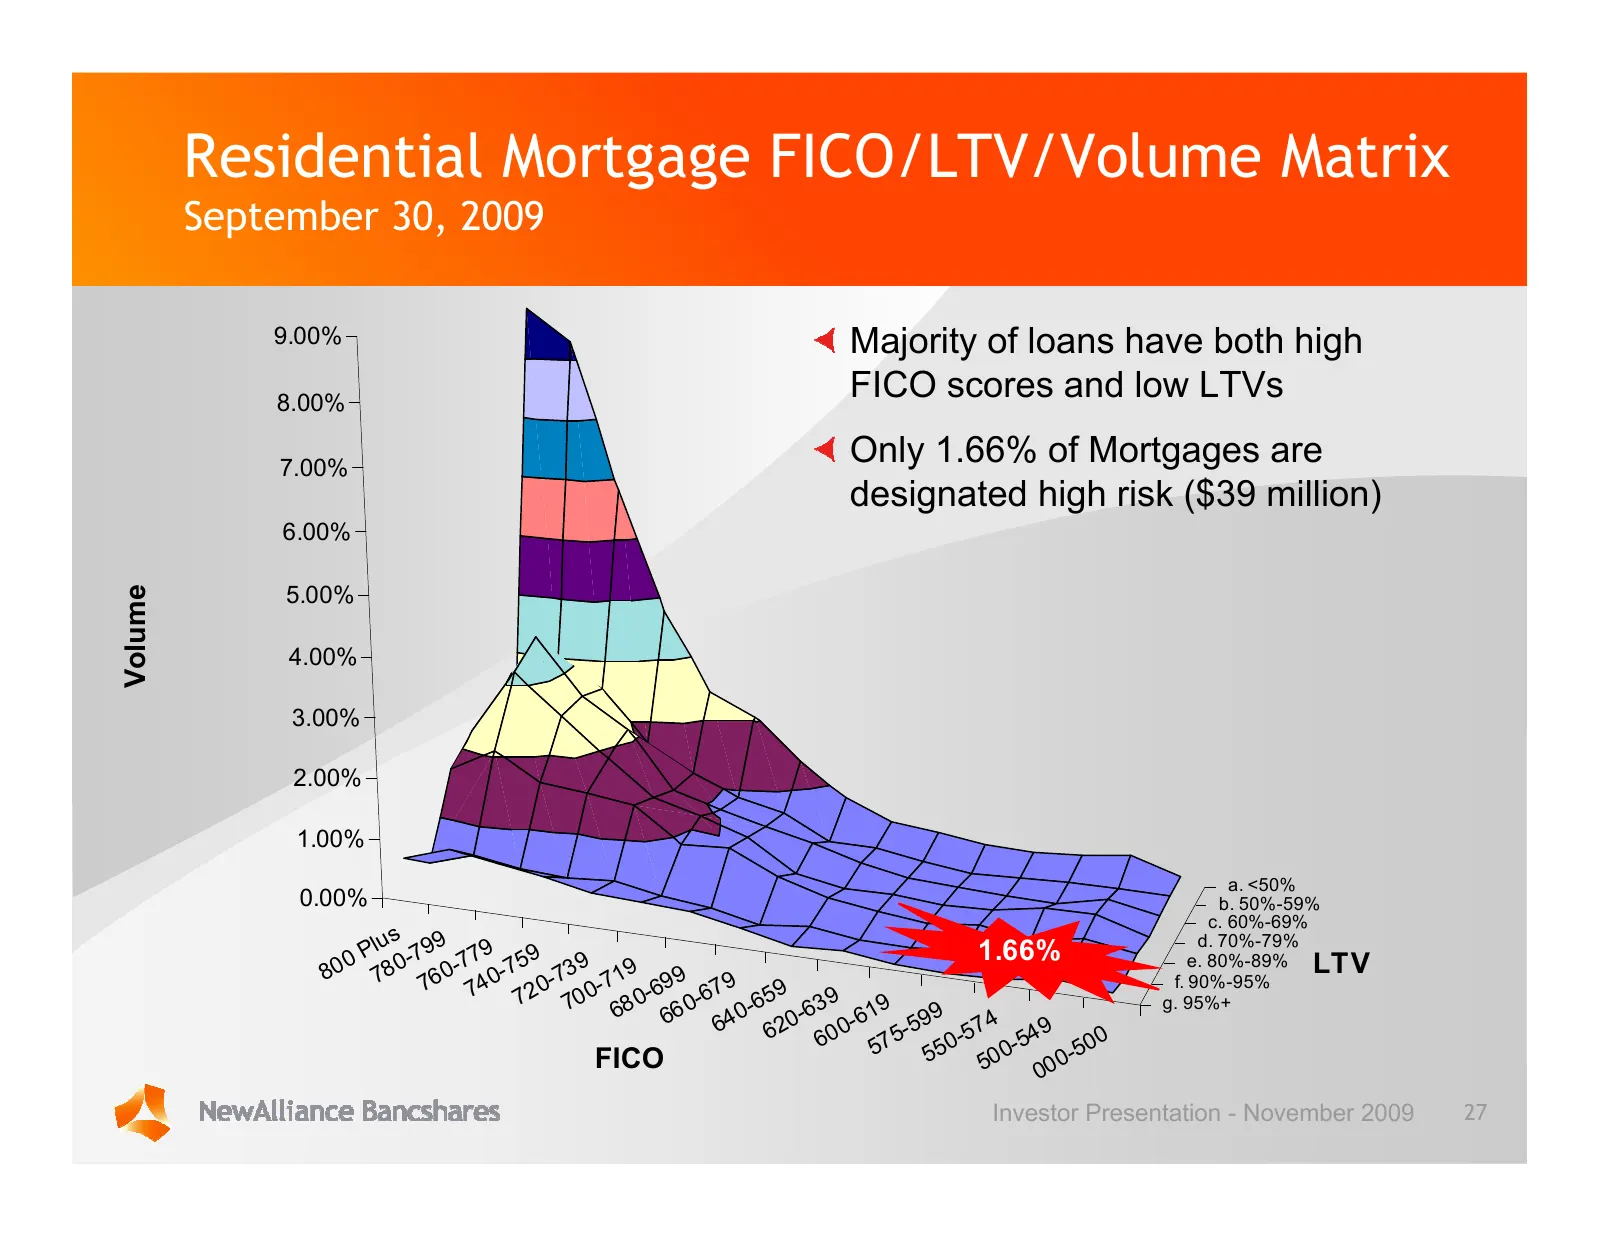
Residential Mortgage FICO/LTV/Volume Matrix September 30, 2009 9.00% Majority of loans have both high 8.00% FICO scores and low LTVs 7.00% Only 1.66% of Mortgages are designated high risk ($39 million) 6.00% 5.00% Volume 4.00% 3.00% 2.00% 1.00% a. <50% 0.00% b. 50%-59% c. 60%-69% s Plu -799 779 59 d
Slide 28: Home Equity Portfolio Snapshot
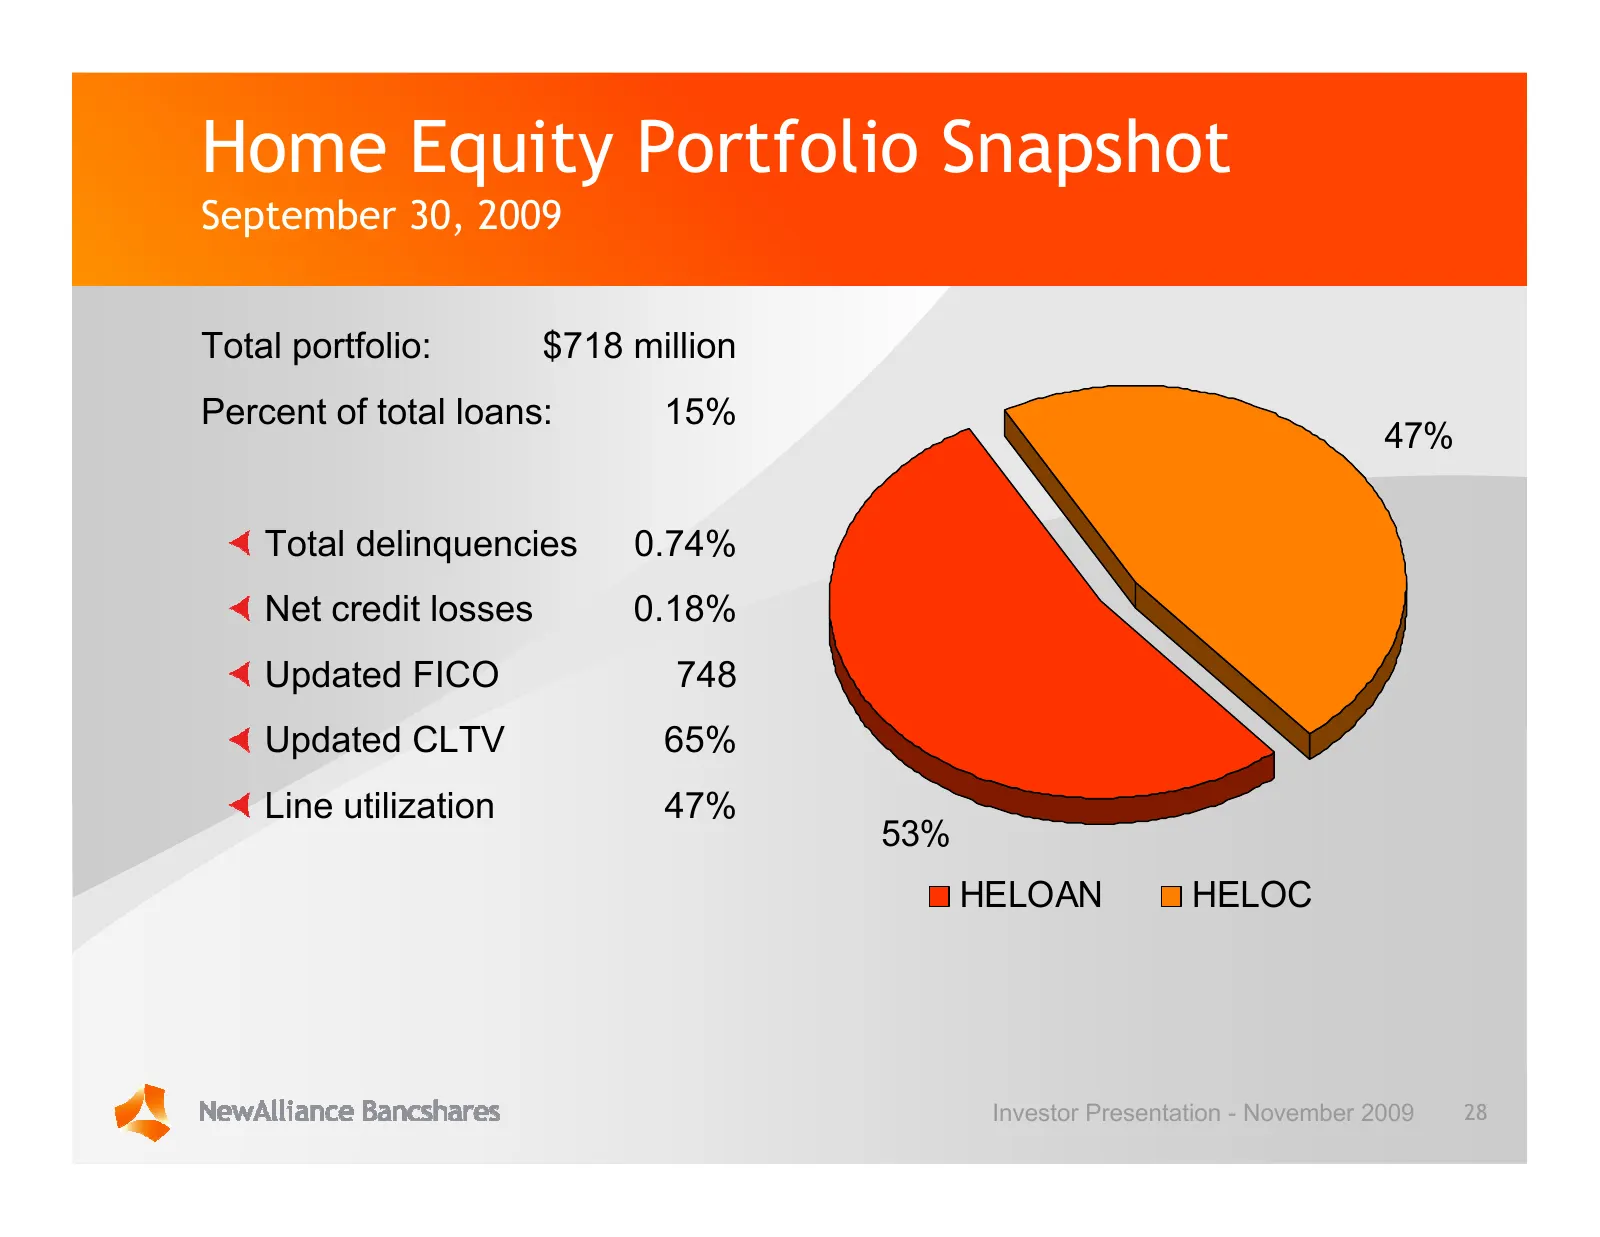
Home Equity Portfolio Snapshot September 30, 2009 Total portfolio: $718 million Percent of total loans: 15% 47% Total delinquencies 0.74% Net credit losses 0.18% Updated FICO 748 Updated CLTV 65% Line utilization 47% 53% HELOAN HELOC Investor Presentation - November 2009 28
Slide 29: Total CRE Portfolio Snapshot
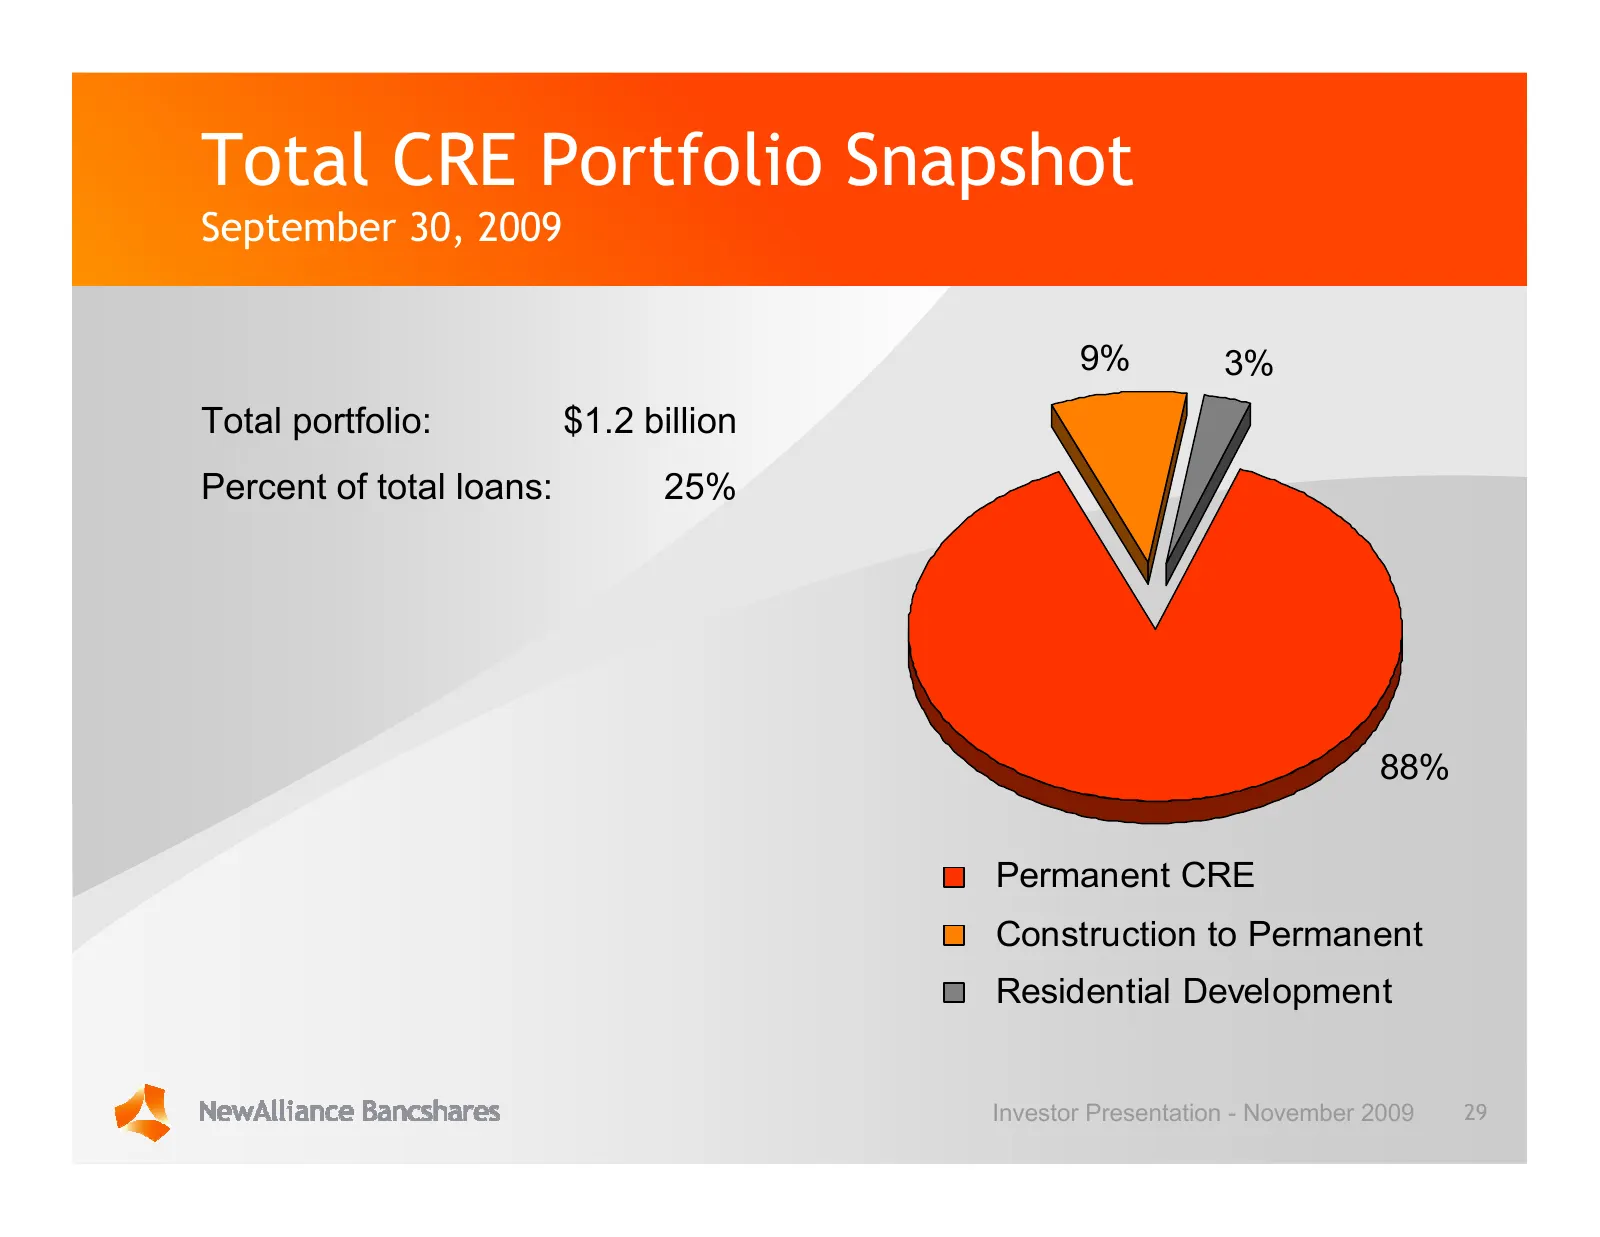
Total CRE Portfolio Snapshot September 30, 2009 9% 3% Total portfolio: $1.2 billion Percent of total loans: 25% 88% Permanent CRE Construction to Permanent Residential Development Investor Presentation - November 2009 29
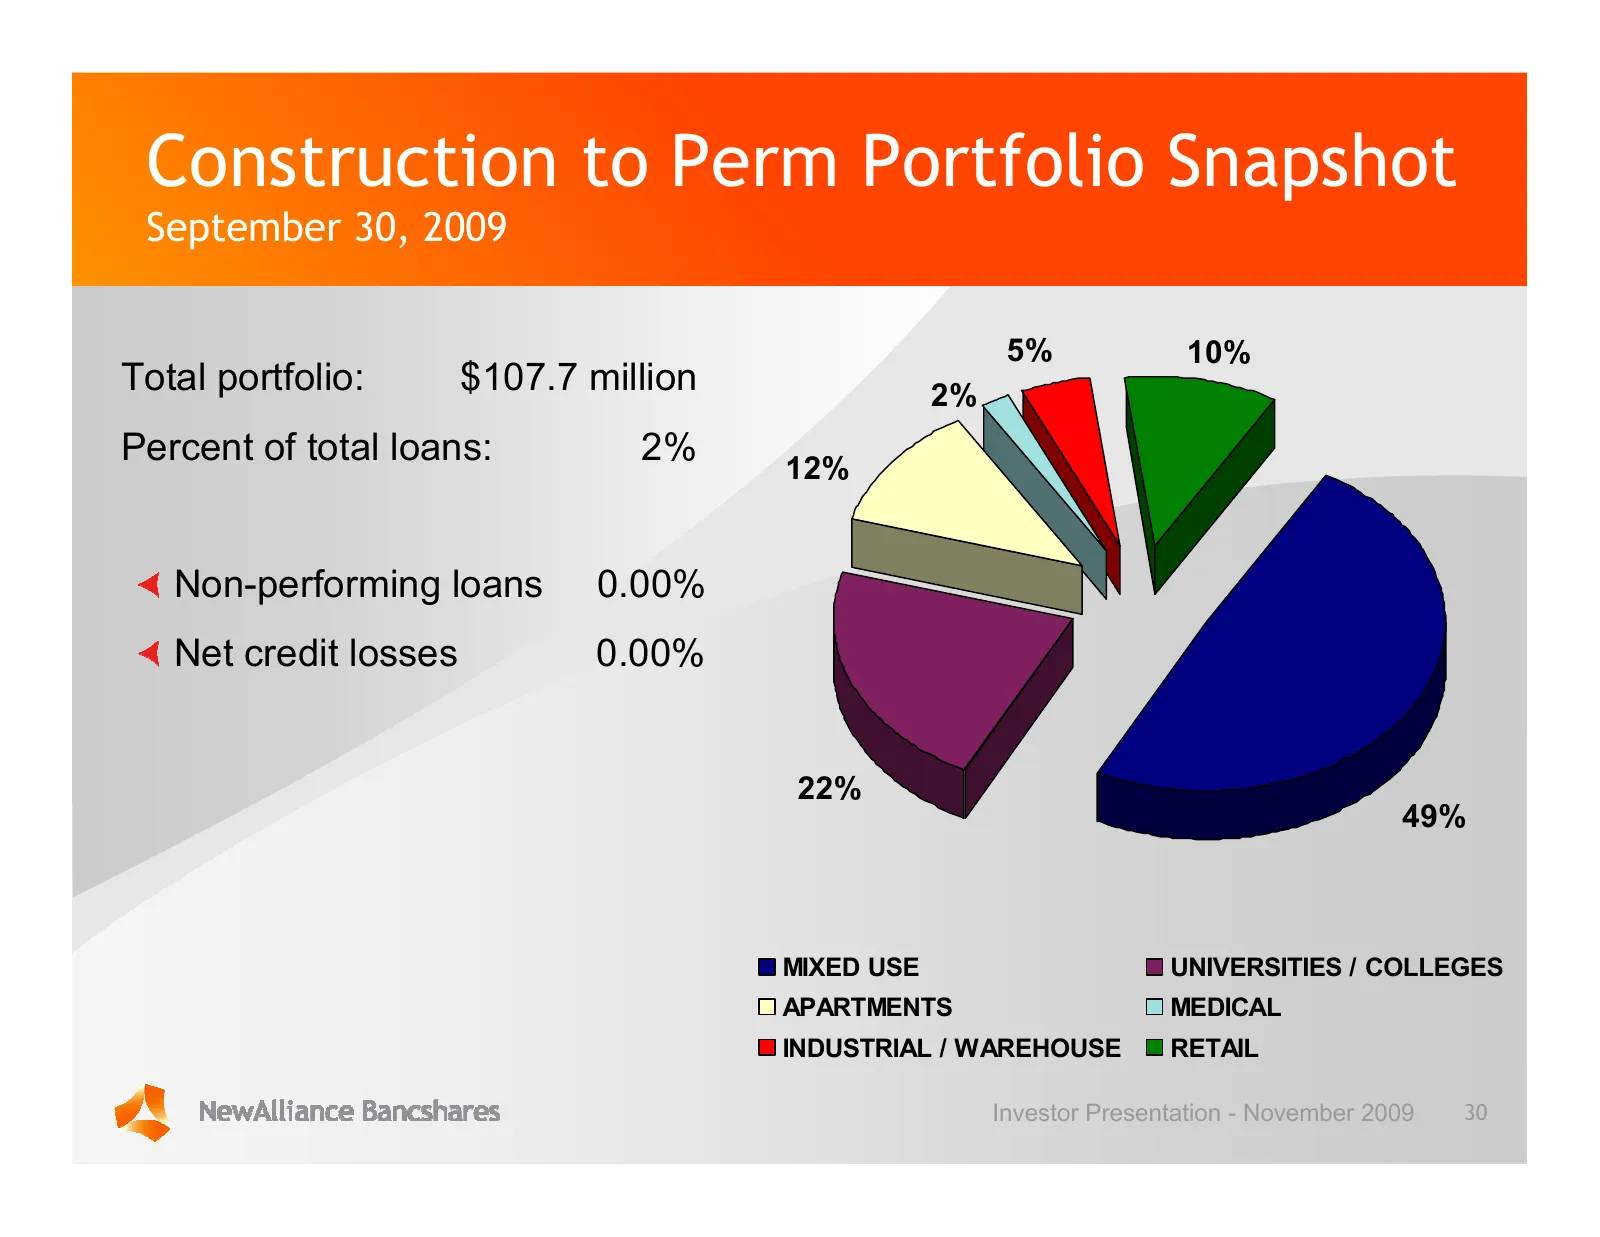
Slide 30: Construction to Perm Portfolio Snapshot
Construction to Perm Portfolio Snapshot September 30, 2009 5% 10% Total portfolio: $107.7 million 2% Percent of total loans: 2% 12% Non-performing loans 0.00% Net credit losses 0.00% 22% 49% MIXED USE UNIVERSITIES / COLLEGES APARTMENTS MEDICAL INDUSTRIAL / WAREHOUSE RETAIL Investor Presentation - No
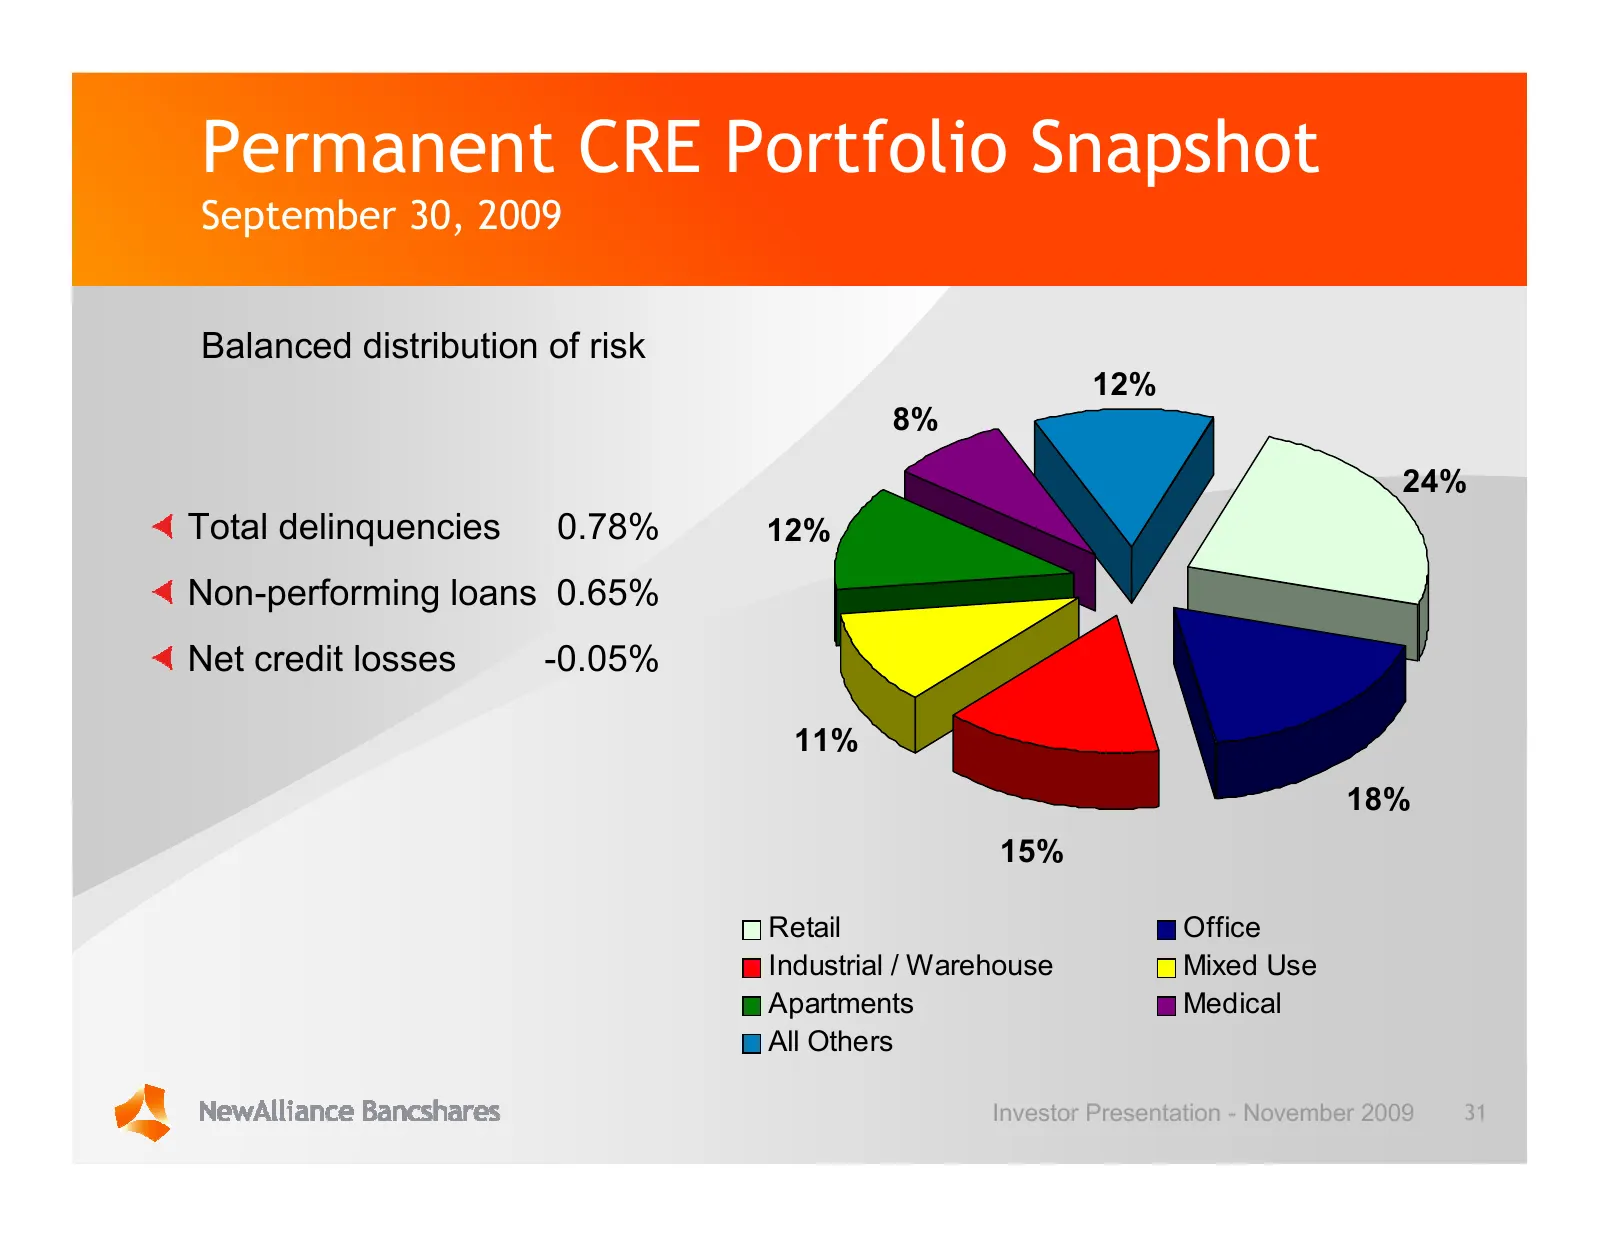
Slide 31: Permanent CRE Portfolio Snapshot
Permanent CRE Portfolio Snapshot September 30, 2009 Balanced distribution of risk 12% 8% 24% Total delinquencies 0.78% 12% Non-performing loans 0.65% Net credit losses -0.05% 11% 18% 15% Retail Office Industrial / Warehouse Mixed Use Apartments Medical All Others Investor Presentation - November 200
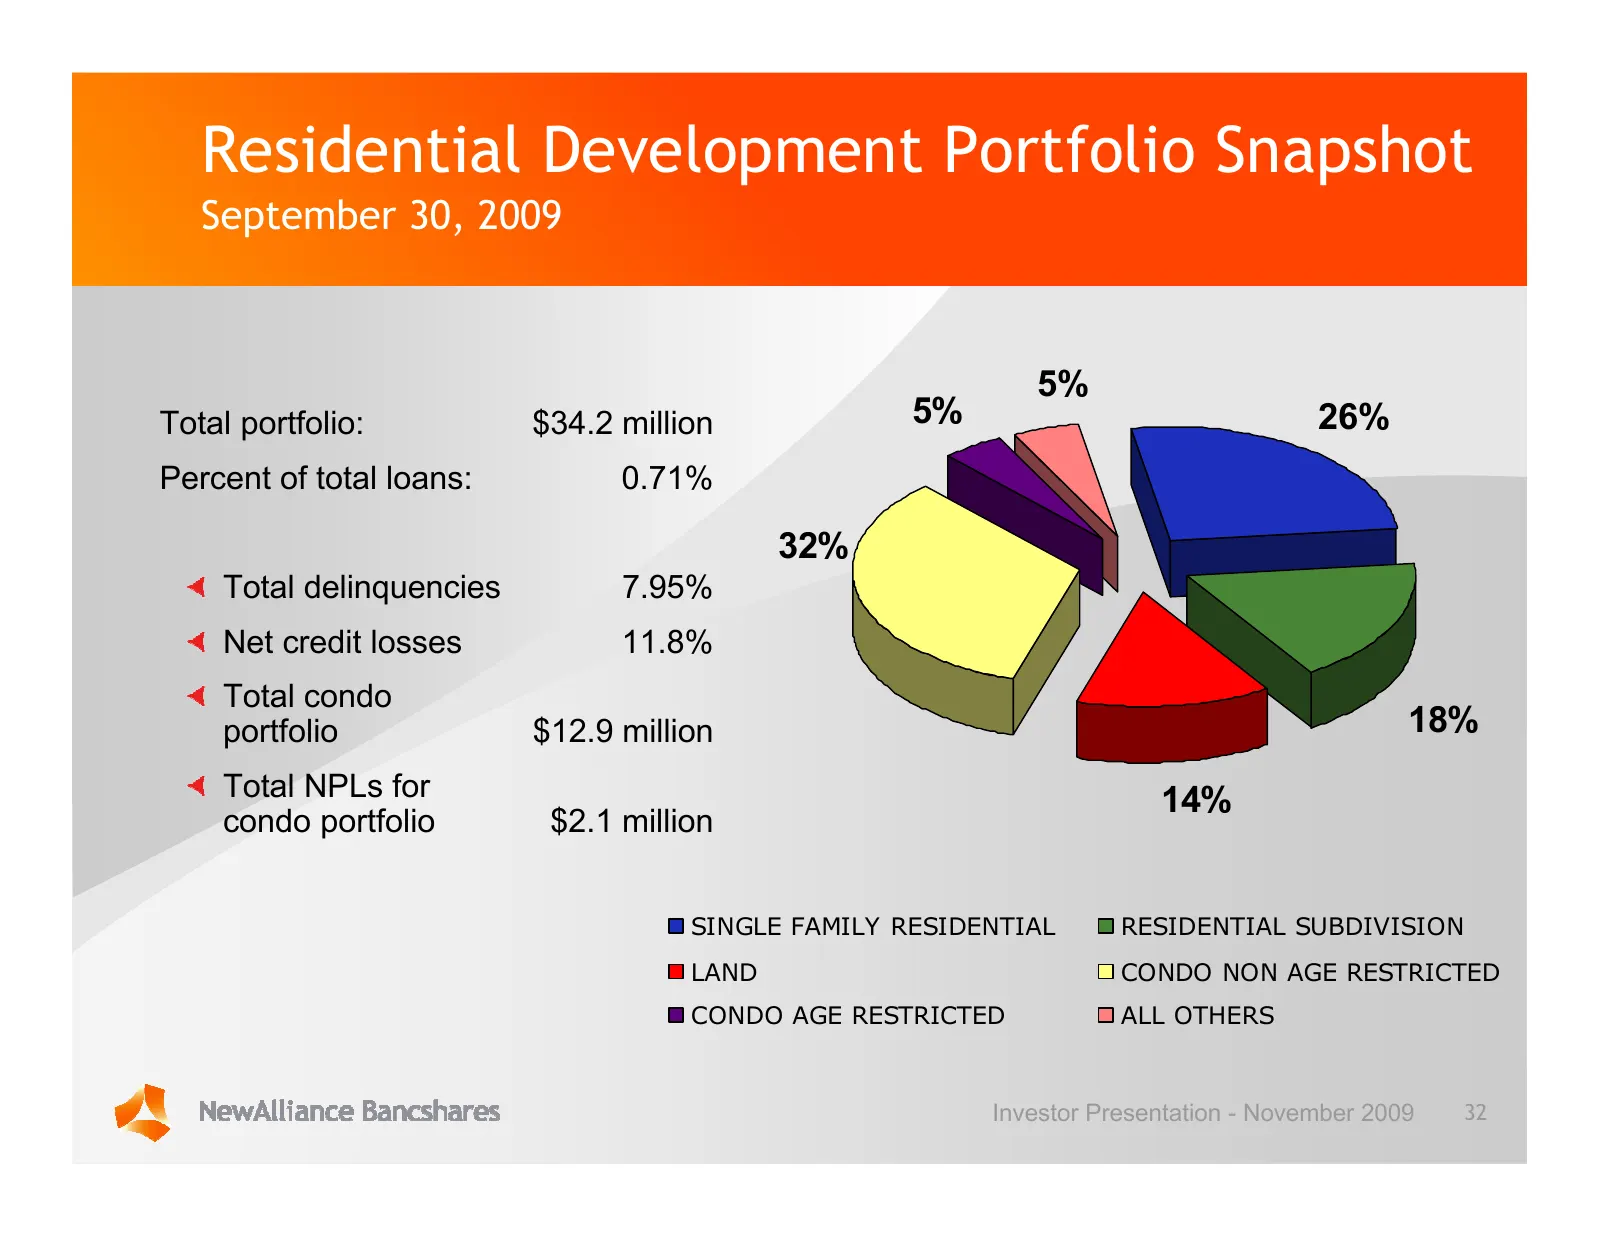
Slide 32: Residential Development Portfolio Snapshot
Residential Development Portfolio Snapshot September 30, 2009 5% Total portfolio: $34.2 million 5% 26% Percent of total loans: 0.71% 32% Total delinquencies 7.95% Net credit losses 11.8% Total condo portfolio $12.9 million 18% Total NPLs for 14% condo portfolio $2.1 million SINGLE FAMILY RESIDENTIAL
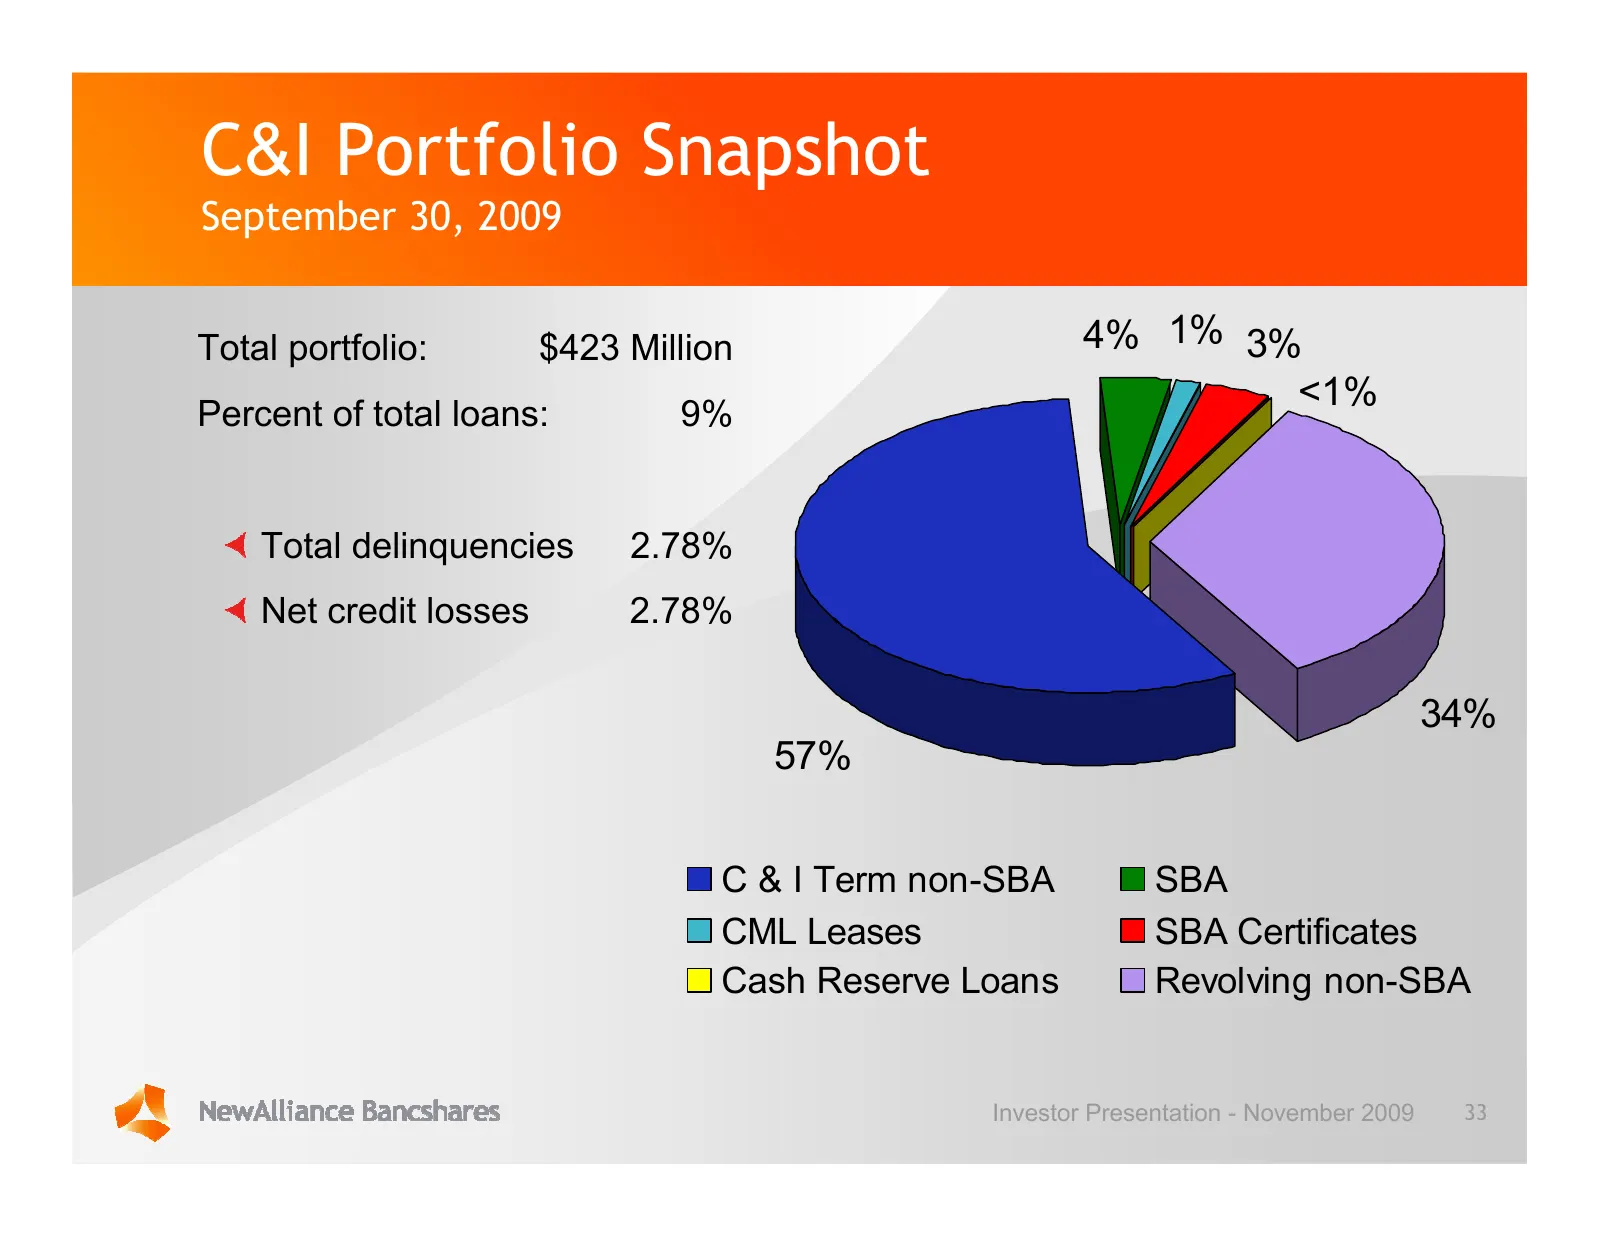
Slide 33: C&I Portfolio Snapshot
C&I Portfolio Snapshot September 30, 2009 Total portfolio: $423 Million 4% 1% 3% <1% Percent of total loans: 9% Total delinquencies 2.78% Net credit losses 2.78% 34% 57% C & I Term non-SBA SBA CML Leases SBA Certificates Cash Reserve Loans Revolving non-SBA Investor Presentation - November 2009 33
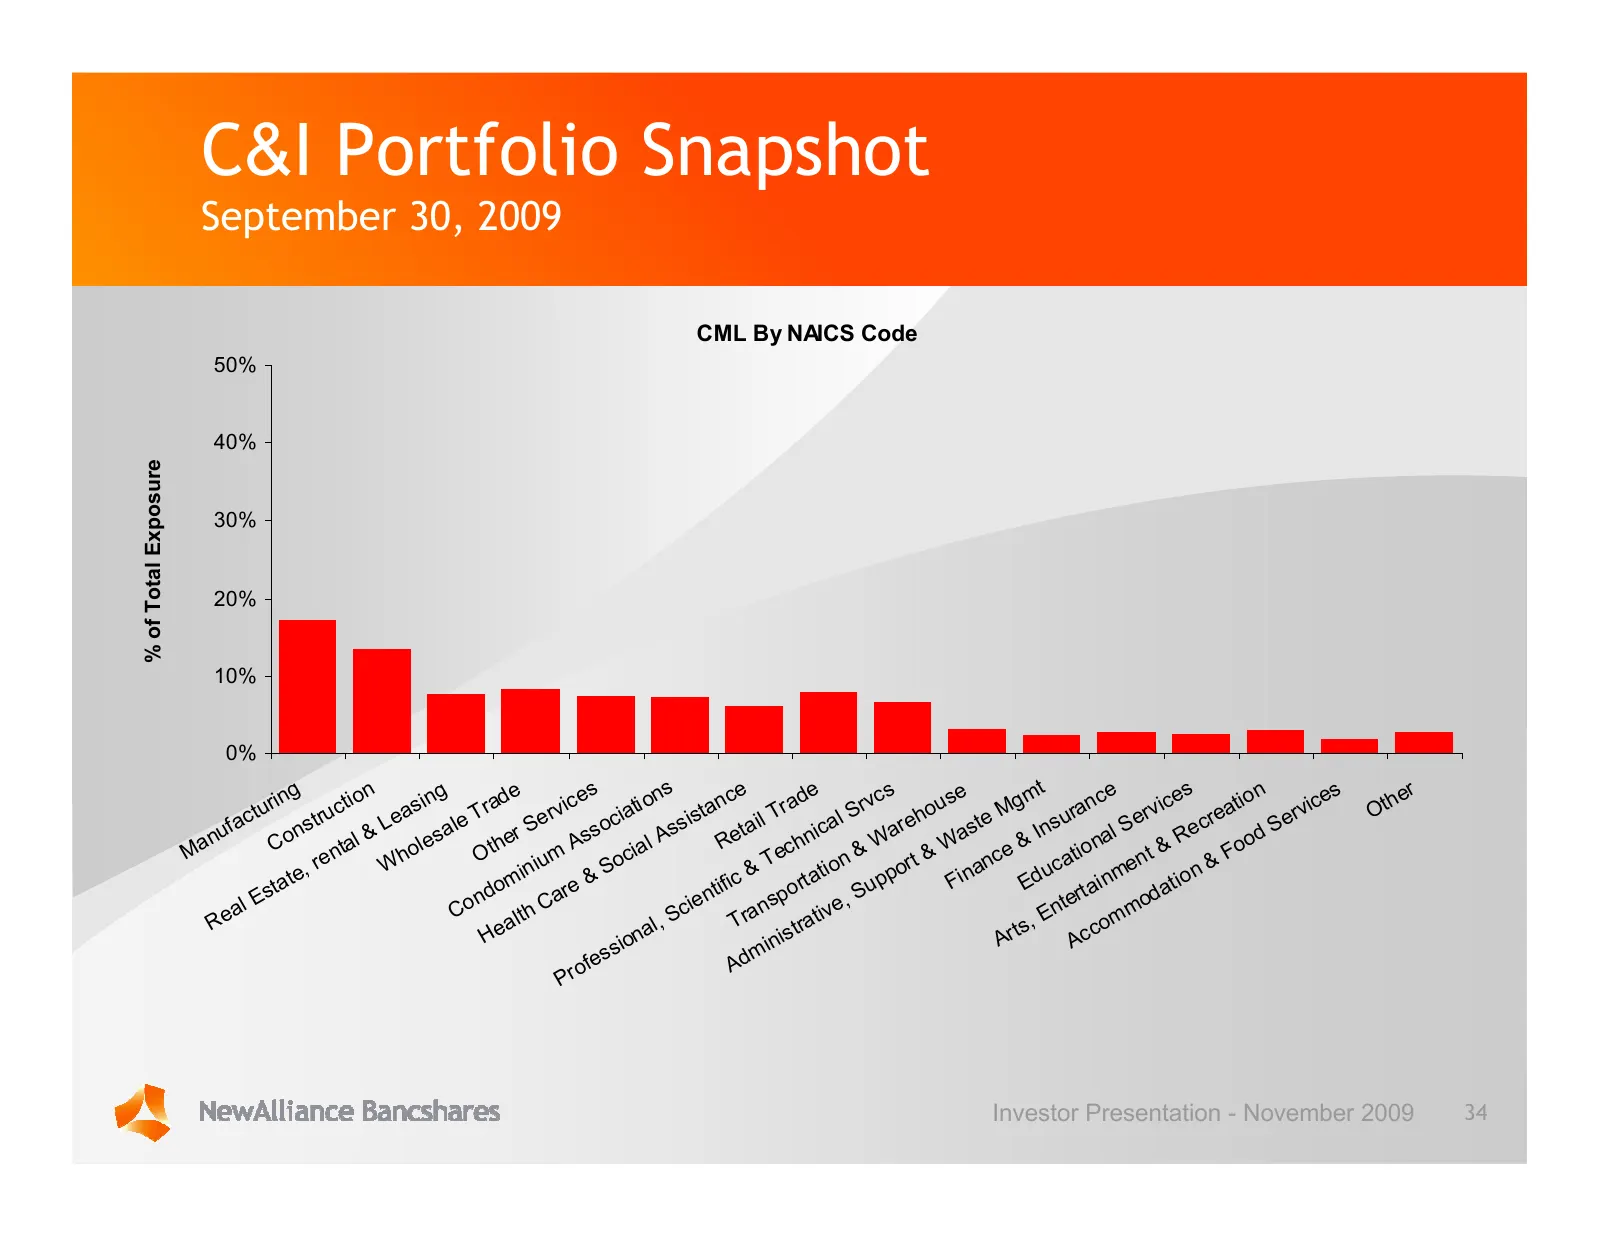
Slide 34: C&I Portfolio Snapshot: CML by NAICS Code
C&I Portfolio Snapshot September 30, 2009 CML By NAICS Code 50% 40% % of Total Exposure 30% 20% 10% 0% g n g e s ns e e s e t e s n s r rin tio sin ad ice ti o nc ad rvc us gm nc ice tio ice he t u u c a T r r v i a s t a T r S h o M ra r v ea rv Ot fac str Le le Se oc si eta il al are as te Ins u S
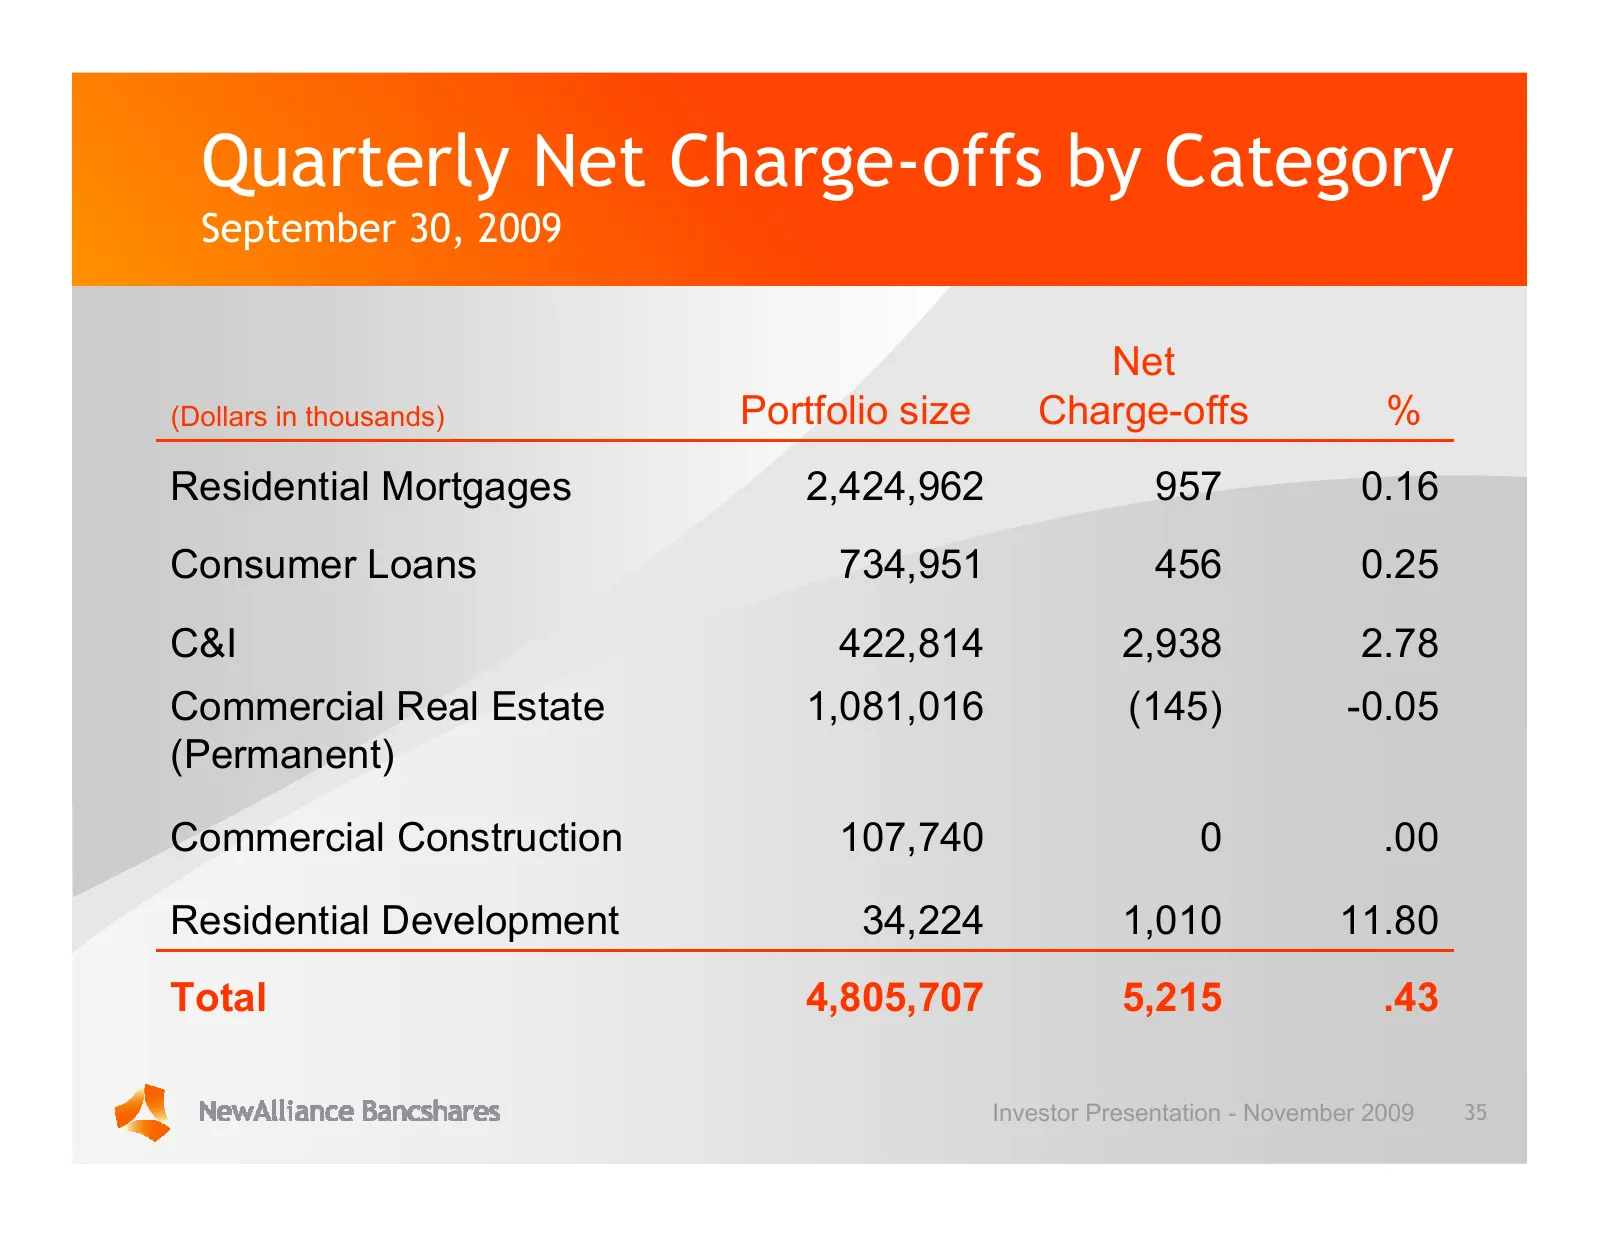
Slide 35: Quarterly Net Charge-offs by Category
Quarterly Net Charge-offs by Category September 30, 2009 Net (Dollars in thousands) Portfolio size Charge-offs % Residential Mortgages 2,424,962 957 0.16 Consumer Loans 734,951 456 0.25 C&I 422,814 2,938 2.78 Commercial Real Estate 1,081,016 (145) -0.05 (Permanent) Commercial Construction 107,740 0
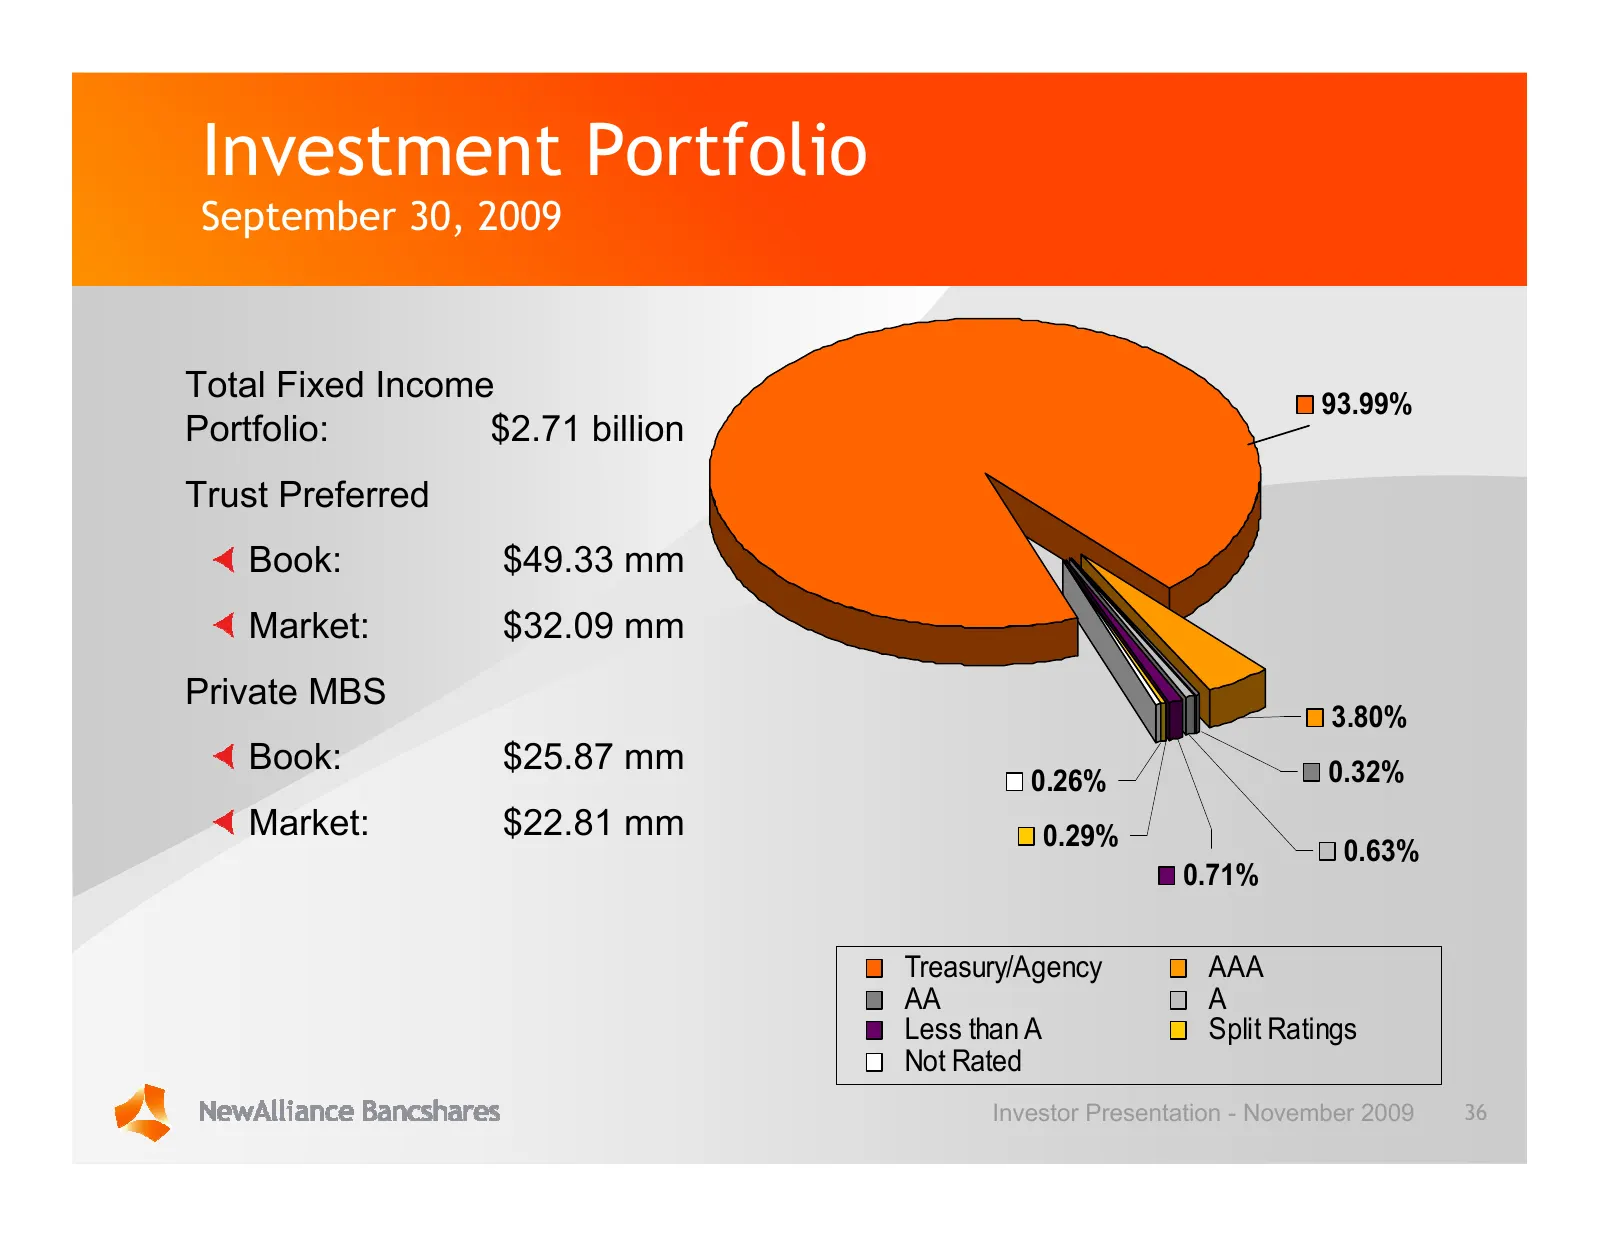
Slide 36: Investment Portfolio
Investment Portfolio September 30, 2009 Total Fixed Income 93.99% Portfolio: $2.71 billion Trust Preferred Book: $49.33 mm Market: $32.09 mm Private MBS 3.80% Book: $25.87 mm 0.32% 0.26% Market: $22.81 mm 0.29% 0.63% 0.71% Treasury/Agency AAA AA A Less than A Split Ratings Not Rated Investor Present
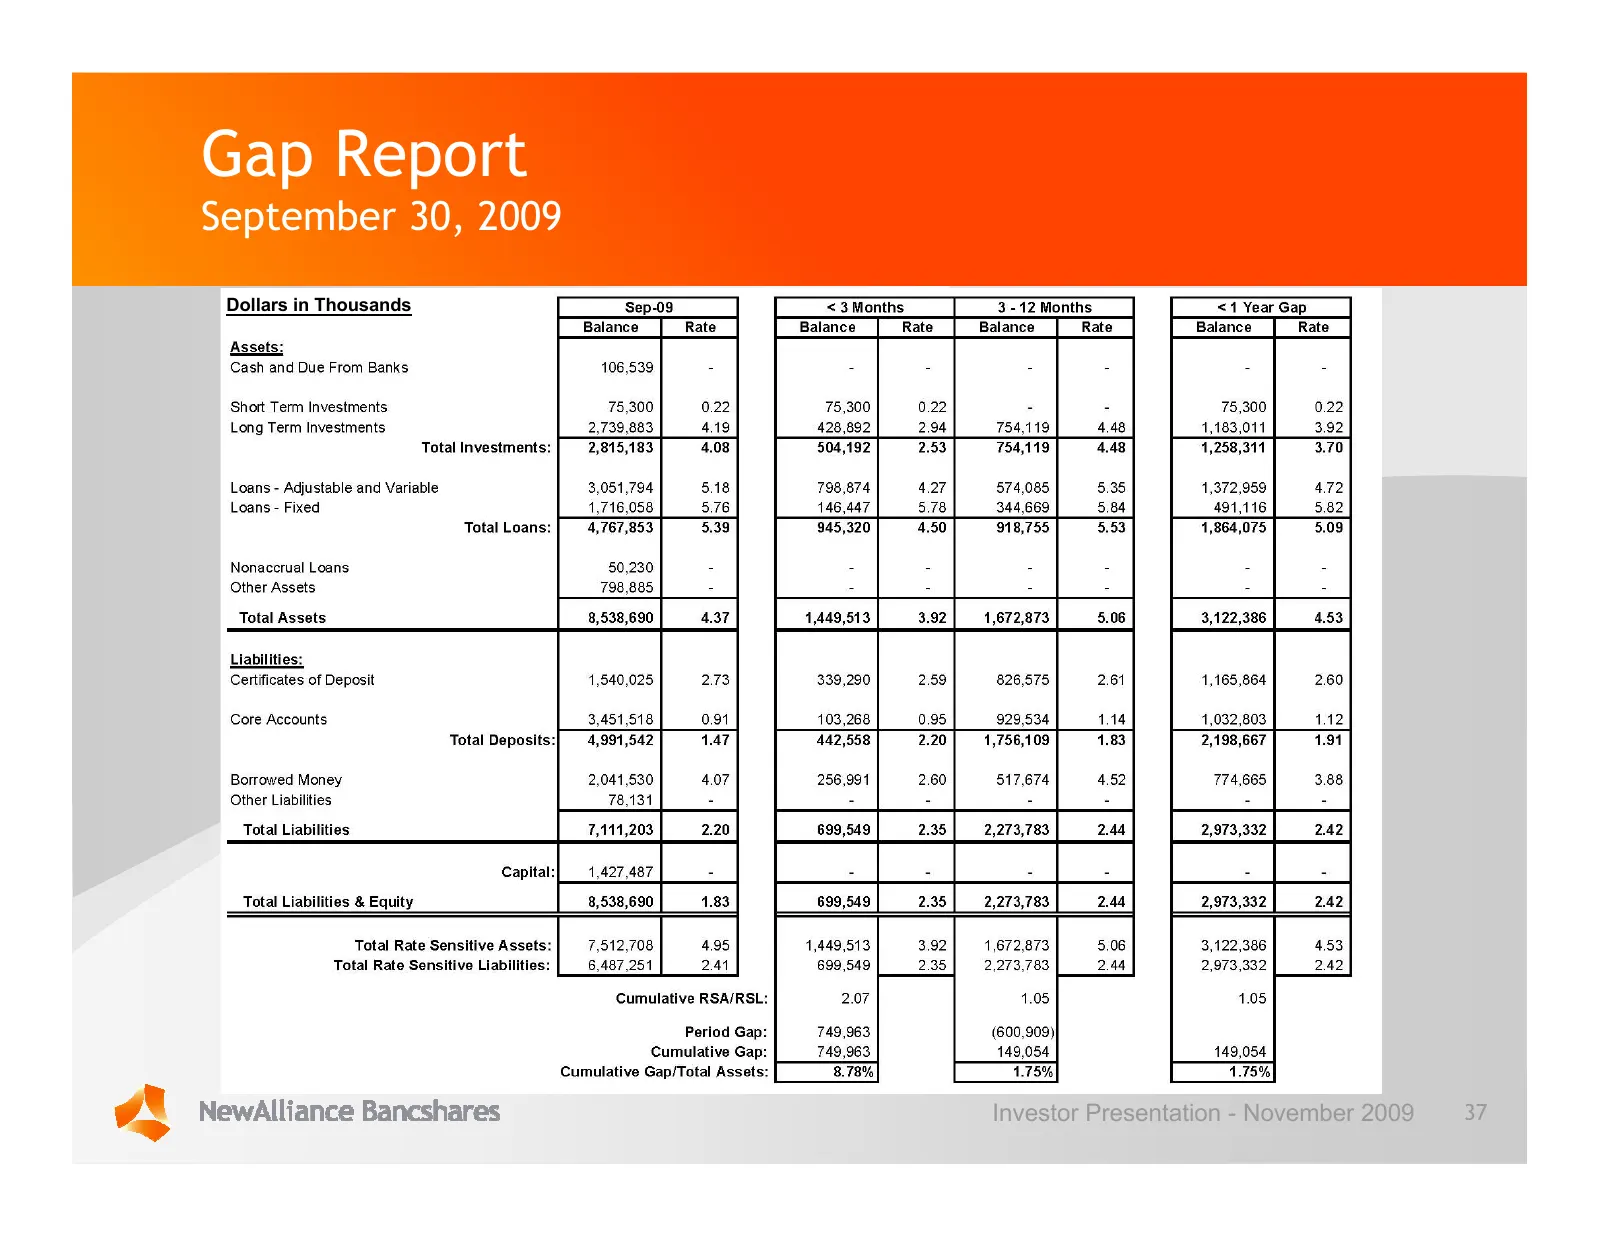
Slide 37: Gap Report
Gap Report September 30, 2009 Dollars in Thousands Investor Presentation - November 2009 37

Slide 38: Outlook for 2009
. q Outlook for 2009
Slide 39: Key 2009 Business Priorities
Key 2009 Business Priorities Priorities: 1. Strengthen the margin 2. Build “core” fee income momentum 3. Maintain flat expenses 4. Aggressively manage credit quality 5. Seize opportunities to grow the franchise Investor Presentation - November 2009 39
Slide 40: Organizational Strengths
Organizational Strengths Management depth Strong sales culture Risk management; Strong asset quality Regulatory compliance Disciplined acquirer and integrator Capital management Investor Presentation - November 2009 40

Slide 41: NewAlliance Bancshares
! q NewaAlliance Bancsharé
Source: SEC EDGAR · 8-K filed Nov 4, 2009
More decks from Newalliance Bancshares Inc
 Merger or Acquisition (November 2010)45 slides · Nov 18, 2010
 Stifel, Nicolaus & Company, Inc. Bank and Thrift Conference 201037 slides · Nov 3, 2010
 Merger or Acquisition (August 2010)25 slides · Aug 25, 2010
 Merger or Acquisition (August 2010)24 slides · Aug 19, 2010
 Merger or Acquisition (August 2010)23 slides · Aug 19, 2010
 Q2 2010 Earnings Presentation31 slides · Jul 28, 2010