Commercial Capital Bancorp Inc
Commercial Capital Bancorp — Investor Presentation (November 2003)
9 slides from Commercial Capital Bancorp's investor presentation, Nov 13, 2003

Slide 1: Forward-looking statements
This presentation may include forward-looking statements (related to the plans, beliefs and goals of CCBI and its subsidiaries), which involve certain risks and uncertainties that could cause actual results to differ materially from those in the forward-looking statements. Such risks and uncertainti
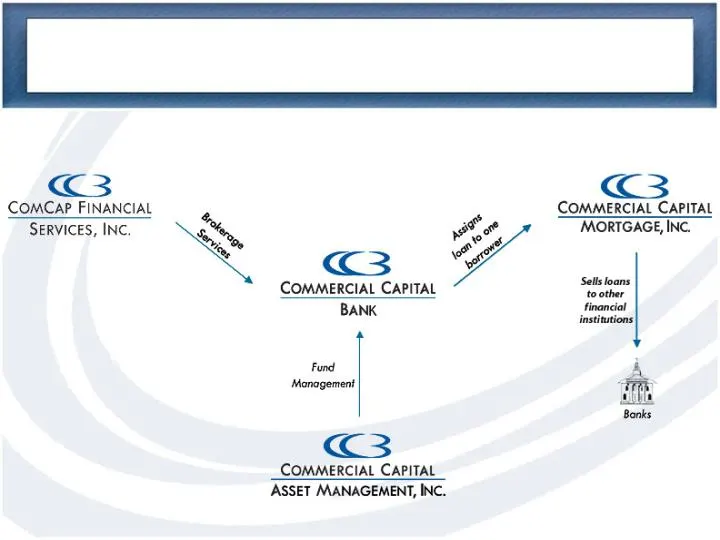
Slide 2: CCBI corporate structure
C3 COMCAP FINANCIAL "SERVICES, INC. sy COMMERCIAL CAPITAL MORTGAGE, INC. or Sells loans COMMERCIAL CAPITAL eae financial BANK Pes Fund ‘Management Giiicl COMMERCIAL CAPITAL ASSET MANAGEMENT, INC.

Slide 3: CCBI Overview
CCBI Overview Diversified Financial Services Company Based in Irvine, California Uniquely focused business strategy Attractive client base Strong organic growth Pristine asset quality

Slide 4: Business Strategy
Business Strategy Focused on financial needs of income property investors, middle-market businesses, high net-worth individuals and professionals Integrate borrower and depositor, expand relationship banking: Income property real estate investors 1031 exchange accommodators Title / escrow companies

Slide 5: Attractive Multi-family Market
Attractive Multi-family Market California is the largest multi-family market in the U.S., with over 2.5 million units Los Angeles 2 nd highest & San Diego 3 rd highest percentage of renters behind New York City* 6 of the top 10 U.S. markets are in California ** Los Angeles, San Francisco, San Diego,

Slide 6: Portfolio LTV and DCR
Portfolio LTV and DCR Multi-Family Loan to Value 68.5% Debt Coverage Ratio 1.29:1 Commercial RE Loan to Value 65.2% Debt Coverage Ratio 1.40:1 Values are weighted average ratios, at origination, for the Company’s Sept. 30, 2003 loan portfolio.
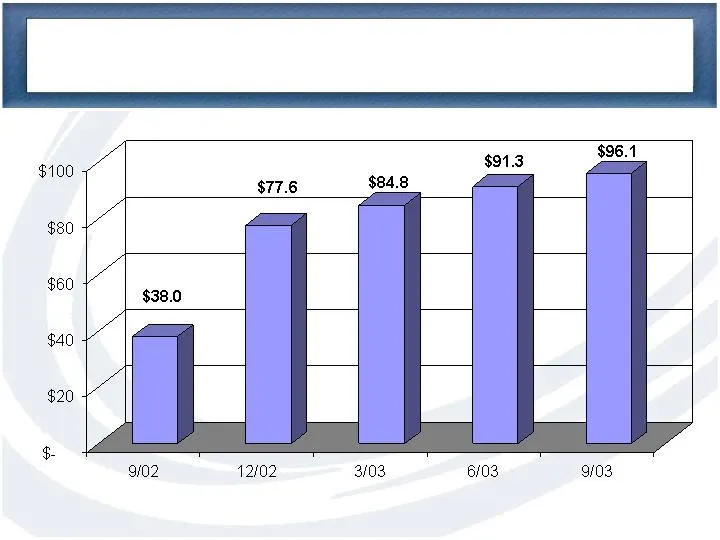
Slide 7: $100 $80 $60 $40 9/02 412102 3/03 6/03, 9/03
$100 $80 $60 $40 9/02 412102 3/03 6/03, 9/03
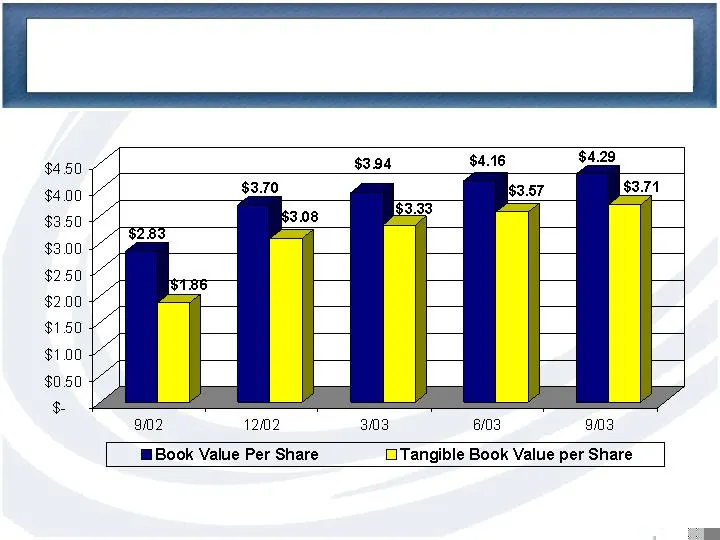
Slide 8: Book Value Per Share and Tangible Book Value per Share
$450 $3.94 $4.16 $4.29 902 1202 303 03 903 Book Value Per Share OTangible Book Value per Share
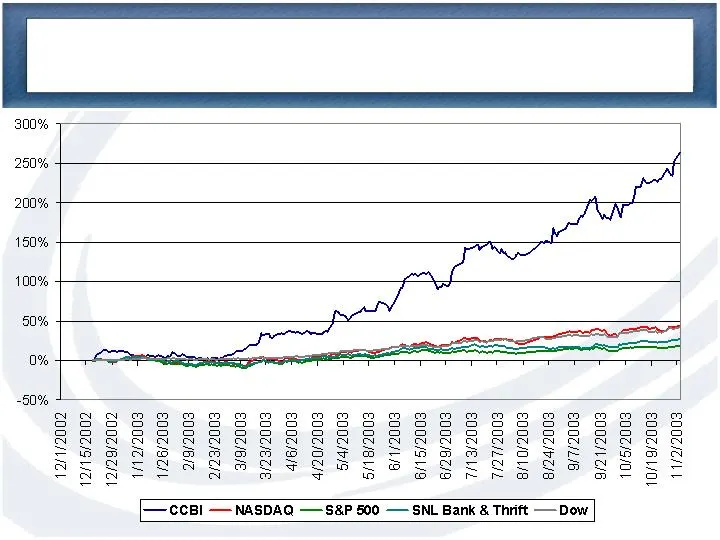
Slide 9: Stock Performance
Stock Performance Dec. 18, 2002 – Nov. 4, 2003
Source: SEC EDGAR · 8-K filed Nov 13, 2003
More decks from Commercial Capital Bancorp Inc
 Investor Presentation (February 2006)36 slides · Feb 23, 2006
 Q4 2005 Earnings Presentation31 slides · Jan 23, 2006
 Q3 2005 Earnings Presentation29 slides · Oct 24, 2005
 Q1 2005 Earnings Presentation33 slides · Apr 25, 2005
 Merger or Acquisition (February 2005)11 slides · Feb 7, 2005
 Q3 2004 Earnings Presentation34 slides · Oct 25, 2004