Altra Industrial Motion — Q4 2019 Earnings Presentation
15 slides from Altra Industrial Motion's earnings presentation, Feb 13, 2020
Slide 1: Fourth-Quarter 2019 Results
Fourth-Quarter 2019 Results February 13, 2020 Exhibit 99.2
Slide 2: Q4 2019 Conference Call Details
Q4 2019 Conference Call Details Live Webcast February 13, 2020 10:00 AM ET Dial-In Number (866) 209-9085 Domestic (647) 689-5687 International Webcast at www.altramotion.com Replay Through February 27, 2020 (800) 585-8367 Domestic (416) 621-4642 International Conference ID: 4765115 Webcast Replay at
Slide 3: Safe Harbor Statement
Safe Harbor Statement Forward-Looking Statements All statements, other than statements of historical fact included in this release are forward-looking statements, as that term is defined in the Private Securities Litigation Reform Act of 1995. These statements include, but are not limited to, any st

Slide 4: Agenda and Speakers
Agenda and Speakers Executive Overview Strategic Highlights Market Review Q4 Financial Review 2020 Guidance Strategic Priorities Q&A Carl Christenson Chairman & Chief Executive Officer Christian Storch Vice President & Chief Financial Officer
Slide 5: Q4 2019 Executive Overview
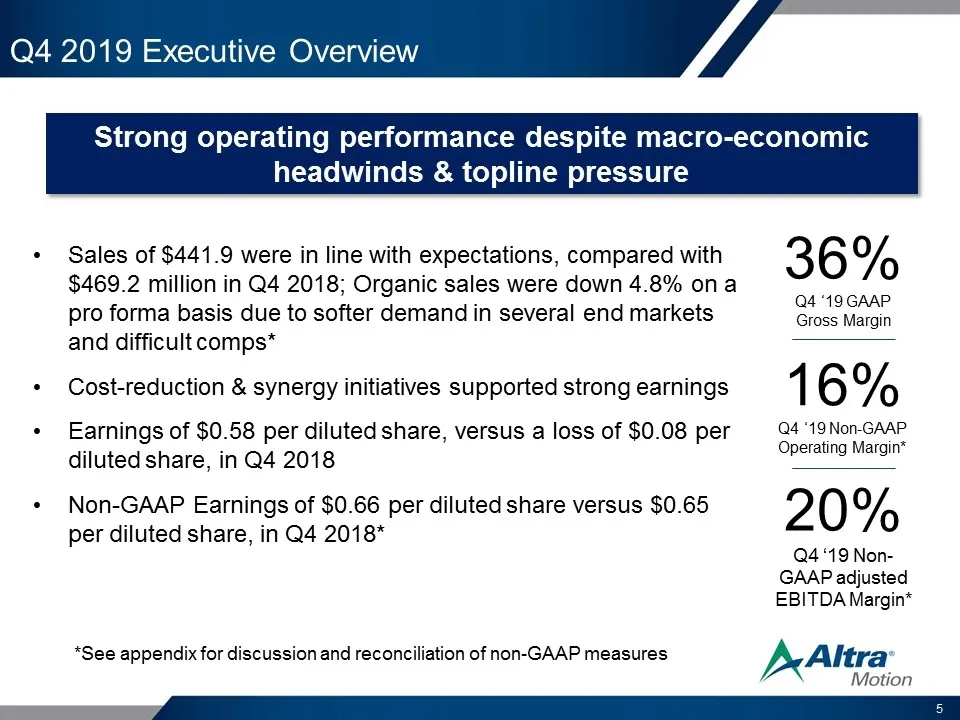
Q4 2019 Executive Overview Sales of $441.9 were in line with expectations, compared with $469.2 million in Q4 2018; Organic sales were down 4.8% on a pro forma basis due to softer demand in several end markets and difficult comps* Cost-reduction & synergy initiatives supported strong earnings Earnin
Slide 6: 2019 Strategic Highlights
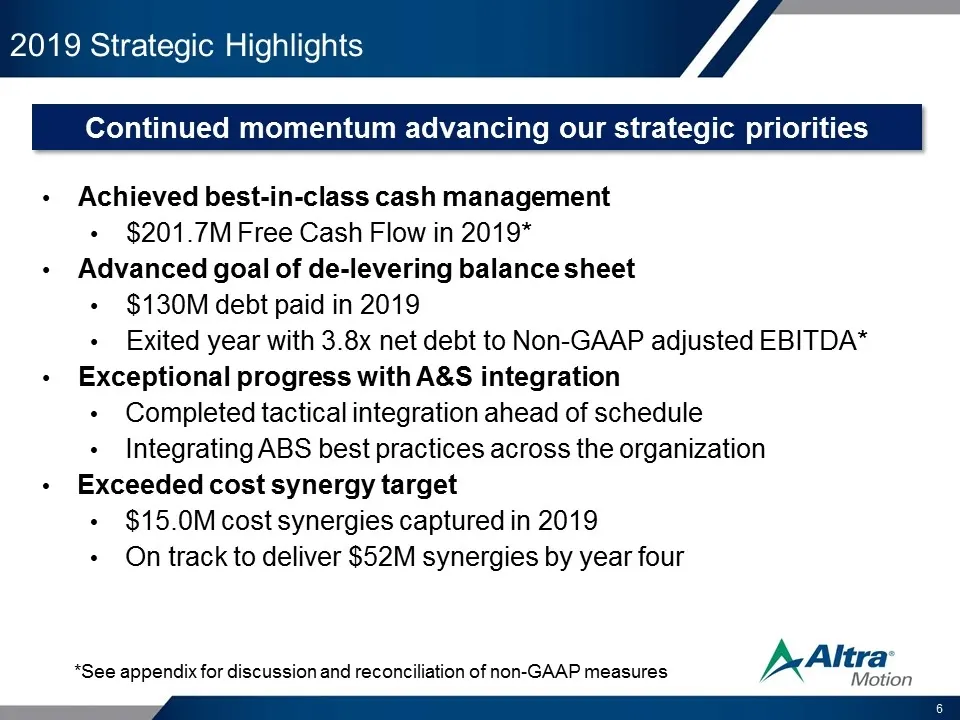
2019 Strategic Highlights Achieved best-in-class cash management $201.7M Free Cash Flow in 2019* Advanced goal of de-levering balance sheet $130M debt paid in 2019 Exited year with 3.8x net debt to Non-GAAP adjusted EBITDA* Exceptional progress with A&S integration Completed tactical integration ahe
Slide 7: Q4 2019 Key End-Market Drivers
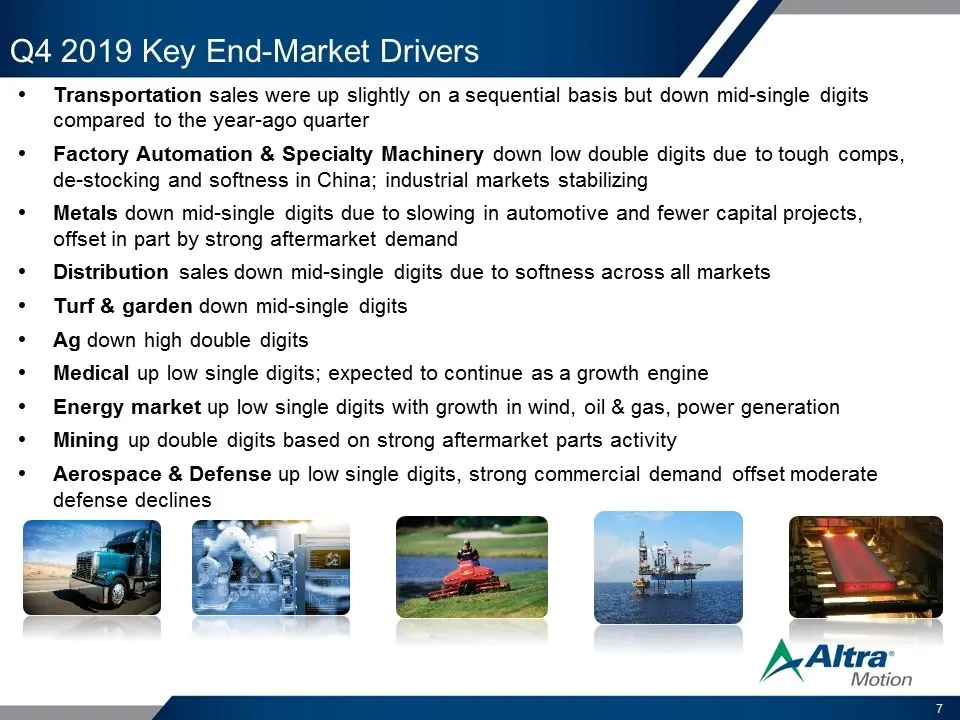
Q4 2019 Key End-Market Drivers Transportation sales were up slightly on a sequential basis but down mid-single digits compared to the year-ago quarter Factory Automation & Specialty Machinery down low double digits due to tough comps, de-stocking and softness in China; industrial markets stabilizing
Slide 8: Q4 2019 Financial Highlights
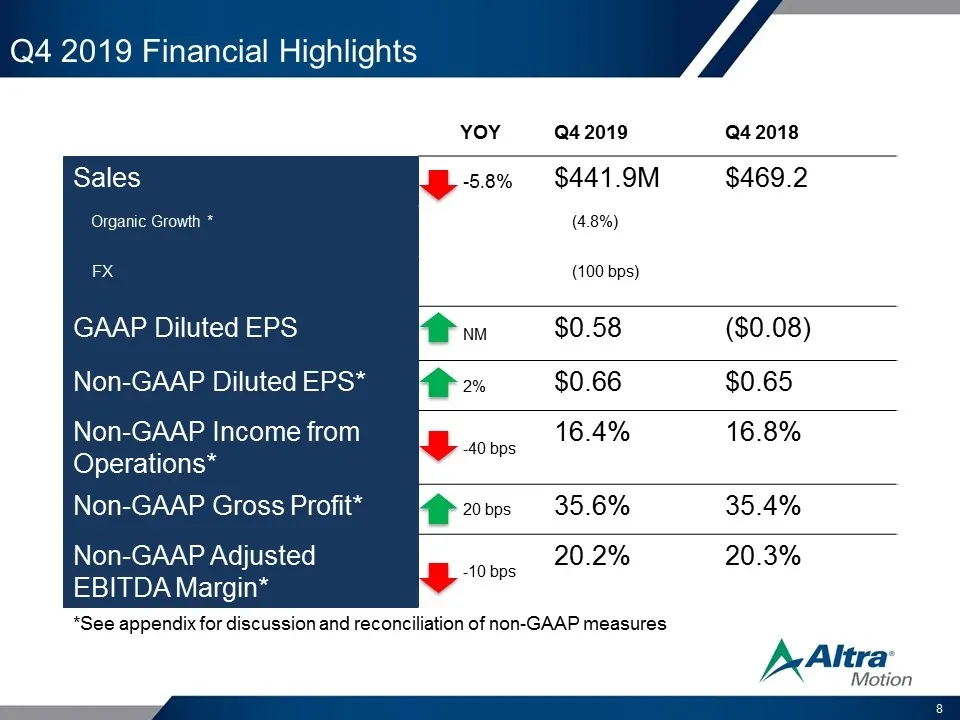
Q4 2019 Financial Highlights YOY Q4 2019 Q4 2018 Sales -5.8% $441.9M $469.2 Organic Growth * (4.8%) FX (100 bps) GAAP Diluted EPS NM $0.58 ($0.08) Non-GAAP Diluted EPS* 2% $0.66 $0.65 Non-GAAP Income from Operations* -40 bps 16.4% 16.8% Non-GAAP Gross Profit* 20 bps 35.6% 35.4% Non-GAAP Adjusted EBI
Slide 9: Balance Sheet Highlights
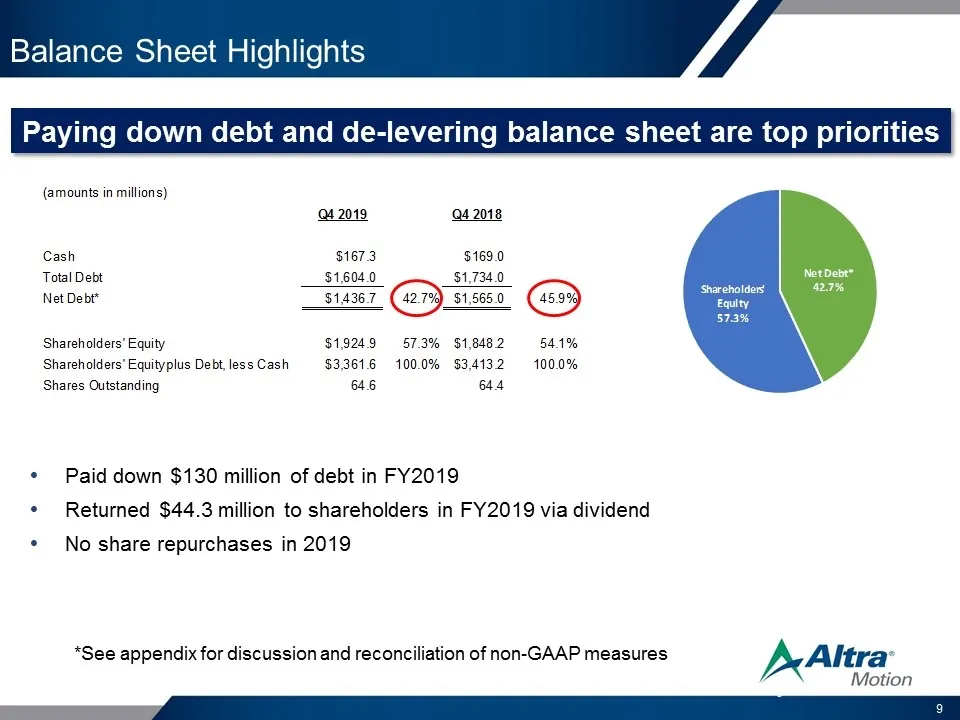
Balance Sheet Highlights Paid down $130 million of debt in FY2019 Returned $44.3 million to shareholders in FY2019 via dividend No share repurchases in 2019 Paying down debt and de-levering balance sheet are top priorities *See appendix for discussion and reconciliation of non-GAAP measures
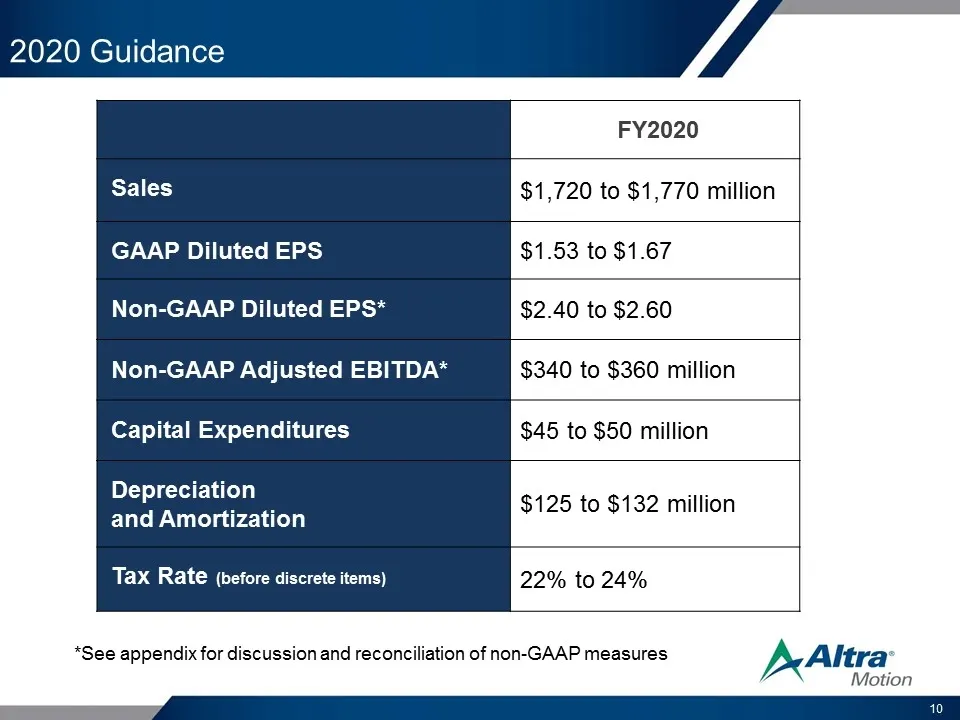
Slide 10: 2020 Guidance
2020 Guidance FY2020 Sales $1,720 to $1,770 million GAAP Diluted EPS $1.53 to $1.67 Non-GAAP Diluted EPS* $2.40 to $2.60 Non-GAAP Adjusted EBITDA* $340 to $360 million Capital Expenditures $45 to $50 million Depreciation and Amortization $125 to $132 million Tax Rate (before discrete items) 22% to 2
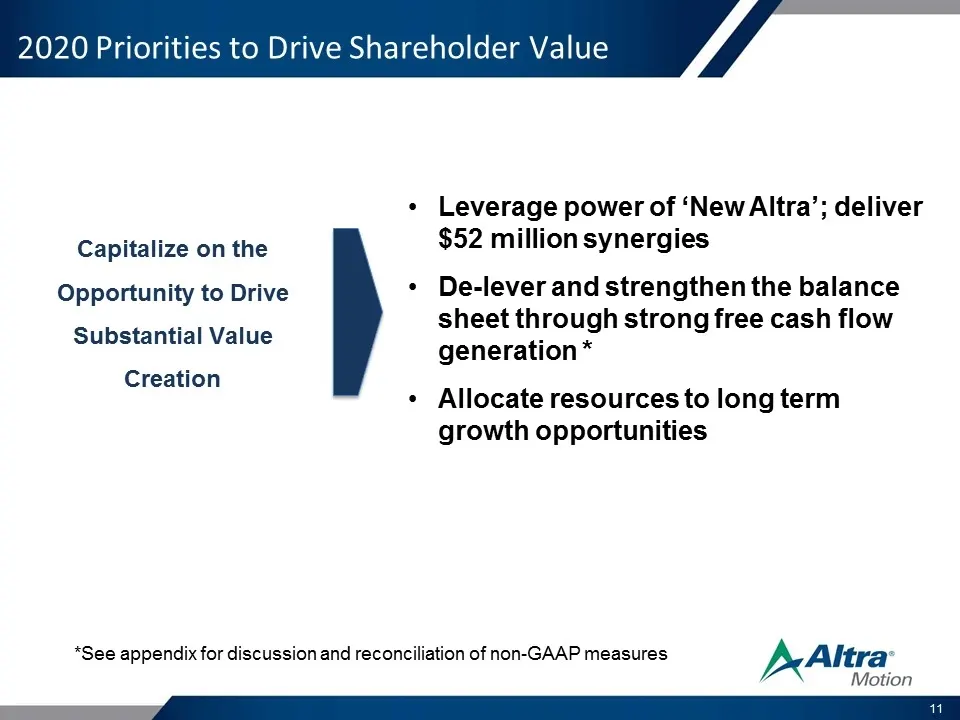
Slide 11: 2020 Priorities to Drive Shareholder Value
2020 Priorities to Drive Shareholder Value Capitalize on the Opportunity to Drive Substantial Value Creation Leverage power of ‘New Altra’; deliver $52 million synergies De-lever and strengthen the balance sheet through strong free cash flow generation * Allocate resources to long term growth opport
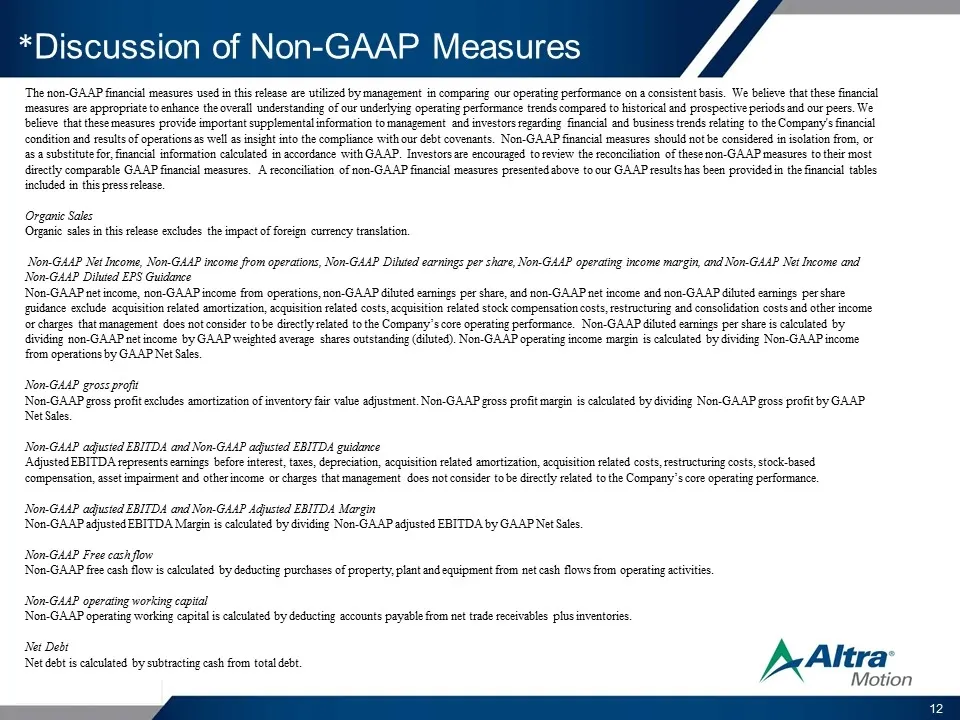
Slide 12: Discussion of Non-GAAP Measures
*Discussion of Non-GAAP Measures The non-GAAP financial measures used in this release are utilized by management in comparing our operating performance on a consistent basis. We believe that these financial measures are appropriate to enhance the overall understanding of our underlying operating per
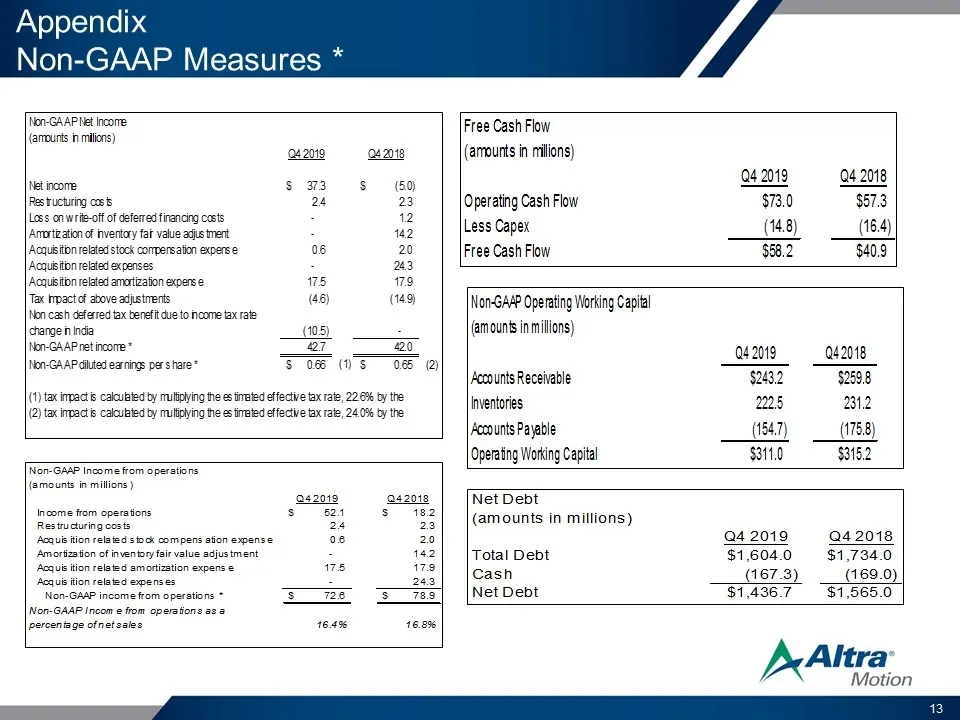
Slide 13: Appendix Non-GAAP Measures
Appendix Non-GAAP Measures *
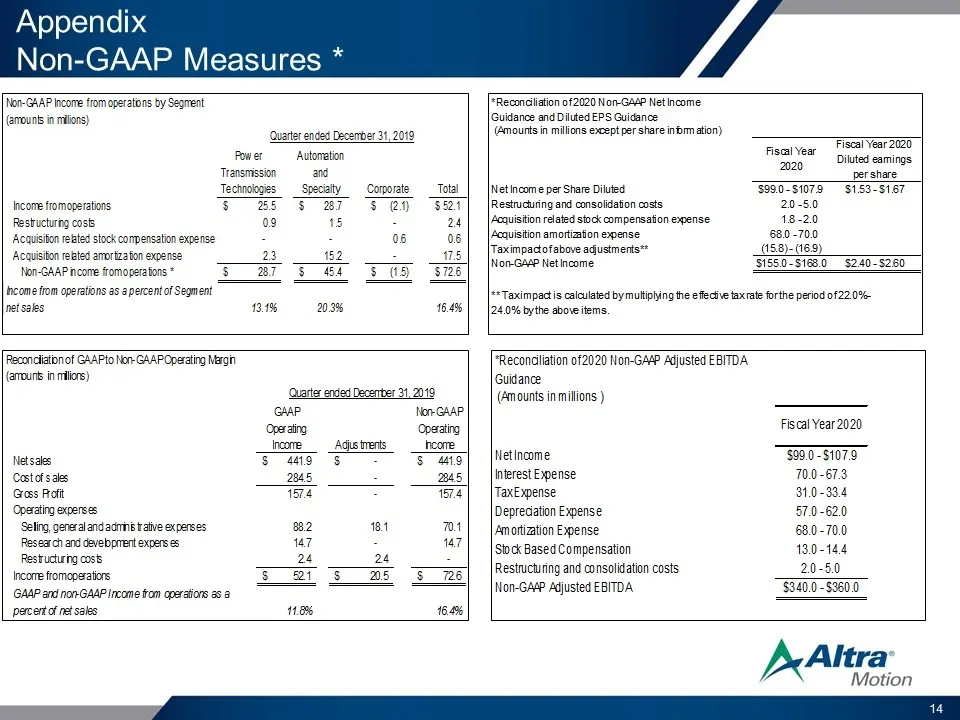
Slide 14: Appendix Non-GAAP Measures
Appendix Non-GAAP Measures *
Slide 15: Non-GAAP Adjusted EBITDA
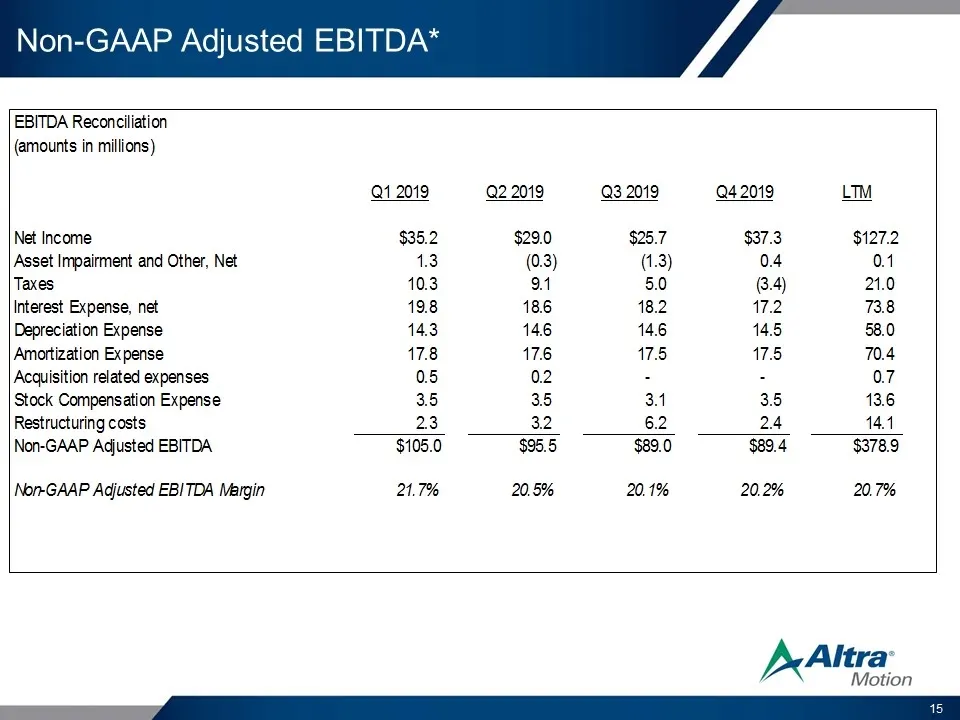
Non-GAAP Adjusted EBITDA* EBITDA Reconciliation (amounts in millions) Q1 2019 Q2 2019 Q3 2019 Q4 2019 L™ Income $35.2 $29.0 $25.7 $37.3 $127.2 Asset Impairment and Other, Net . (0.3) (1.3) F . Taxes 10.3 91 5.0 (3.4) 21.0 Interest Expense, net 19.8 186 18.2 17.2 73.8 Depreciation Expense 14.3 146 14
Source: SEC EDGAR · 8-K filed Feb 13, 2020
More decks from Altra Industrial Motion Corp
 Q2 2022 Earnings Presentation25 slides · Jul 28, 2022
 Q1 2022 Earnings Presentation25 slides · Apr 28, 2022
 Investor Day (March 2022)135 slides · Mar 11, 2022
 Q4 2021 Earnings Presentation17 slides · Feb 16, 2022
 Q3 2021 Earnings Presentation16 slides · Oct 22, 2021
 Q2 2021 Earnings Presentation16 slides · Jul 23, 2021