Stonegate Mortgage — Investor Presentation (December 2014)
9 slides from Stonegate Mortgage's investor presentation, Dec 1, 2014

Slide 1: Investor Presentation
Investor Presentation December 2014
Slide 2: Forward Looking Statements
Forward Looking Statements Various statements used in this presentation, including those that express a belief, expectation or intention, as well as those that are not statements of historical fact, are forward-looking statements. These forward-looking statements may include projections and estimate
Slide 3: Integrated Business Model Characteristics
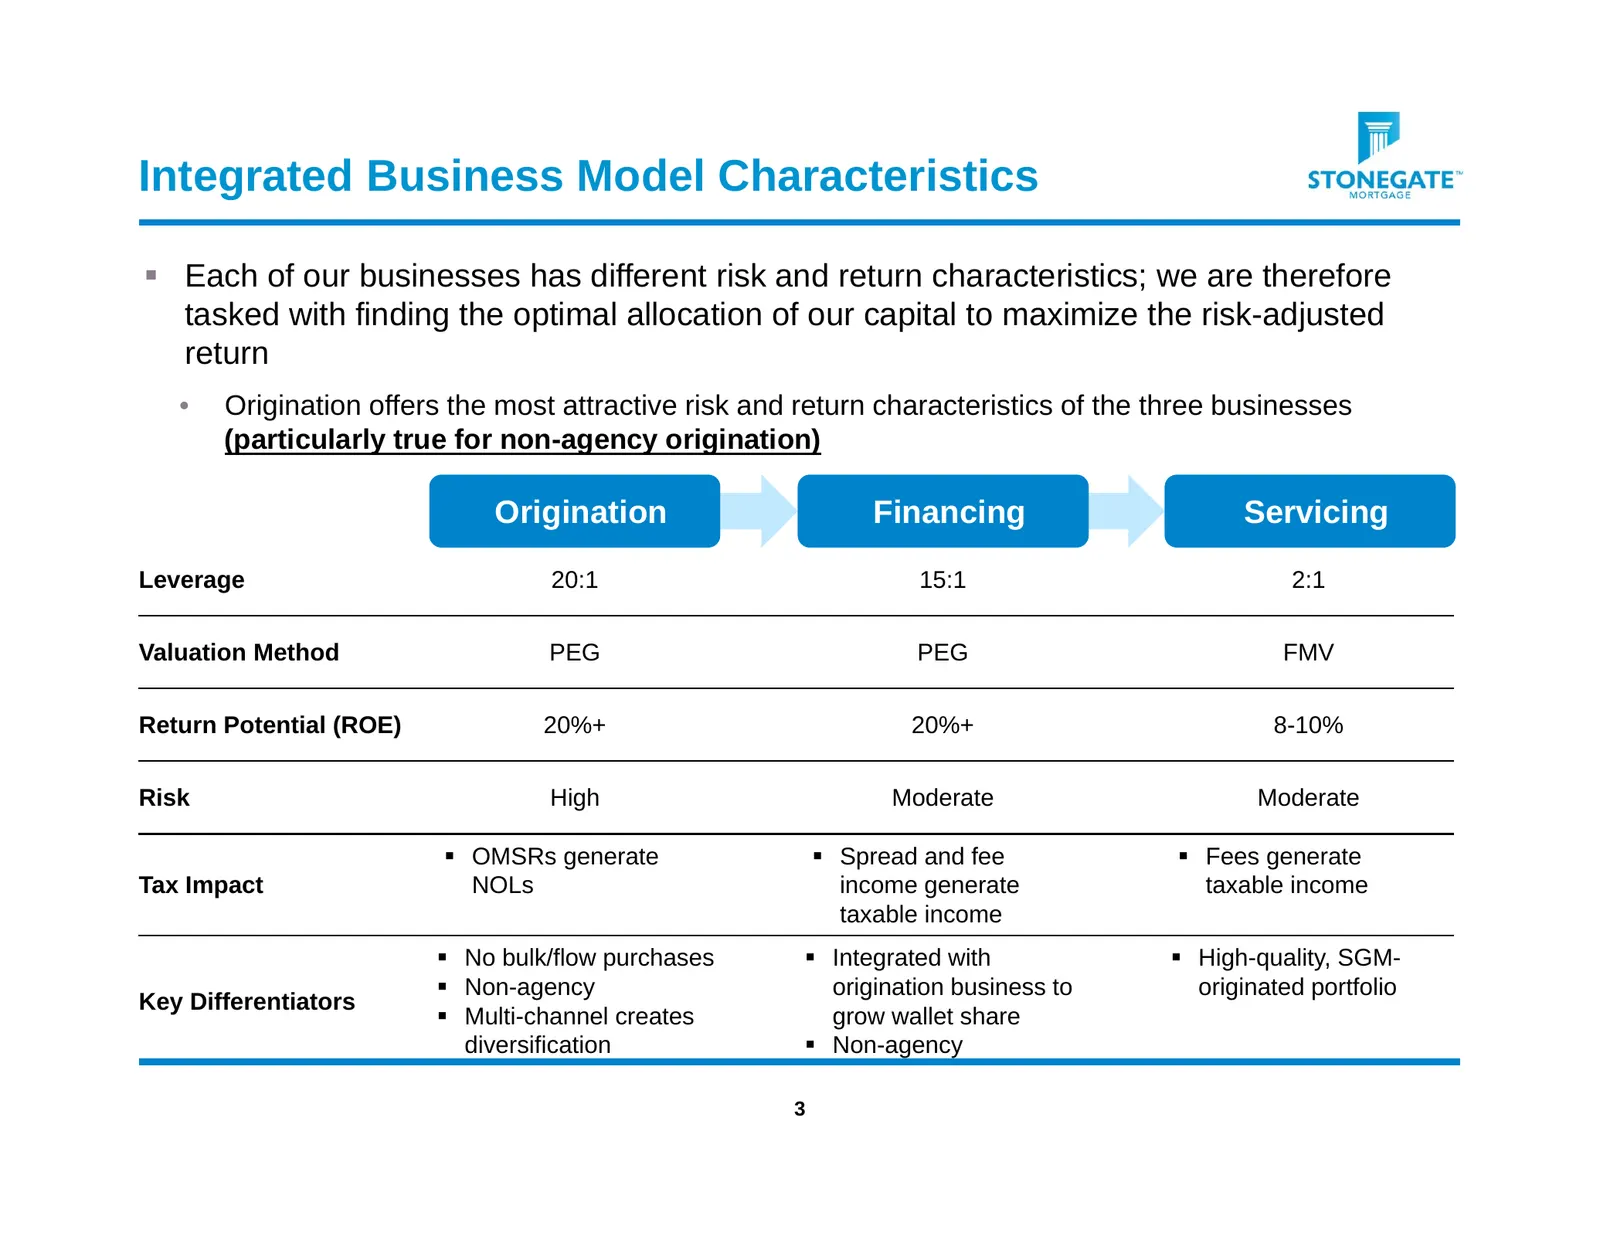
Integrated Business Model Characteristics Each of our businesses has different risk and return characteristics; we are therefore tasked with finding the optimal allocation of our capital to maximize the risk-adjusted return • Origination offers the most attractive risk and return characteristics o
Slide 4: Cash Economics of Origination Business
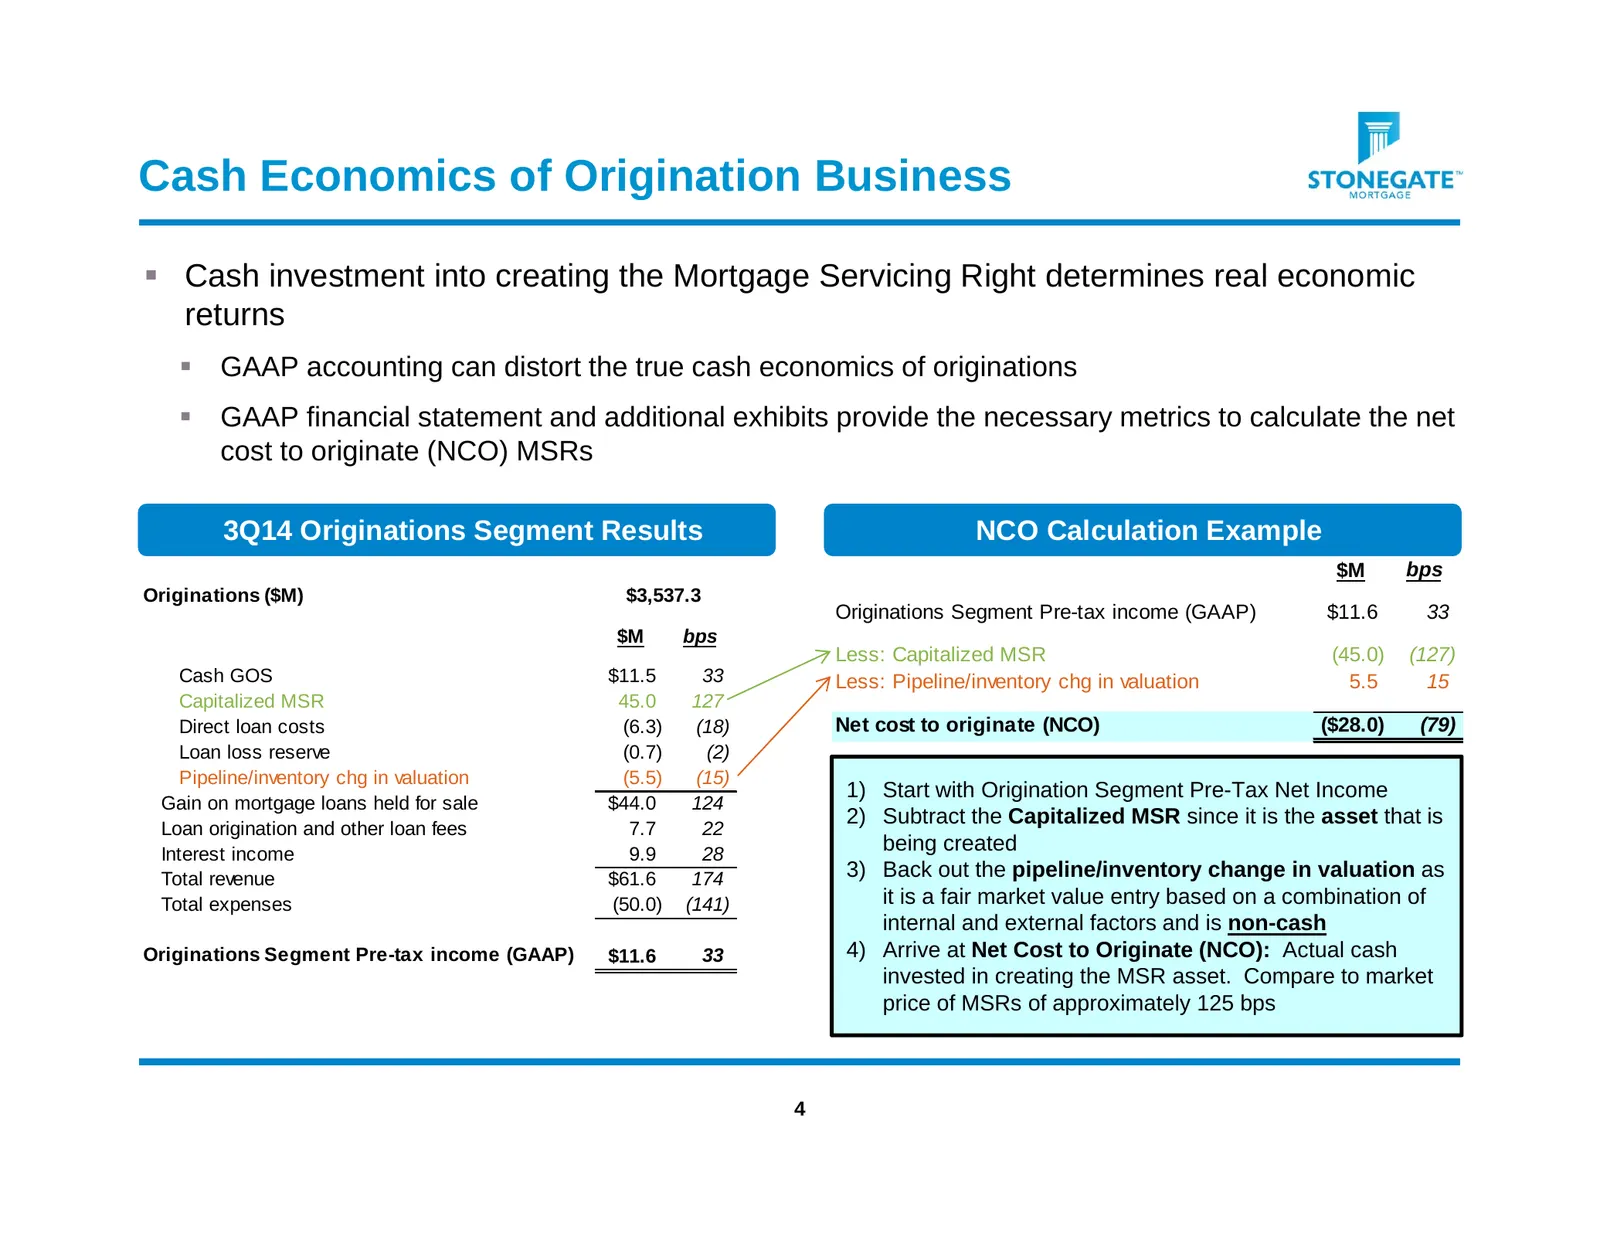
Cash Economics of Origination Business Cash investment into creating the Mortgage Servicing Right determines real economic returns GAAP accounting can distort the true cash economics of originations GAAP financial statement and additional exhibits provide the necessary metrics to calculate the
Slide 5: Driving Lower Net Cost to Originate
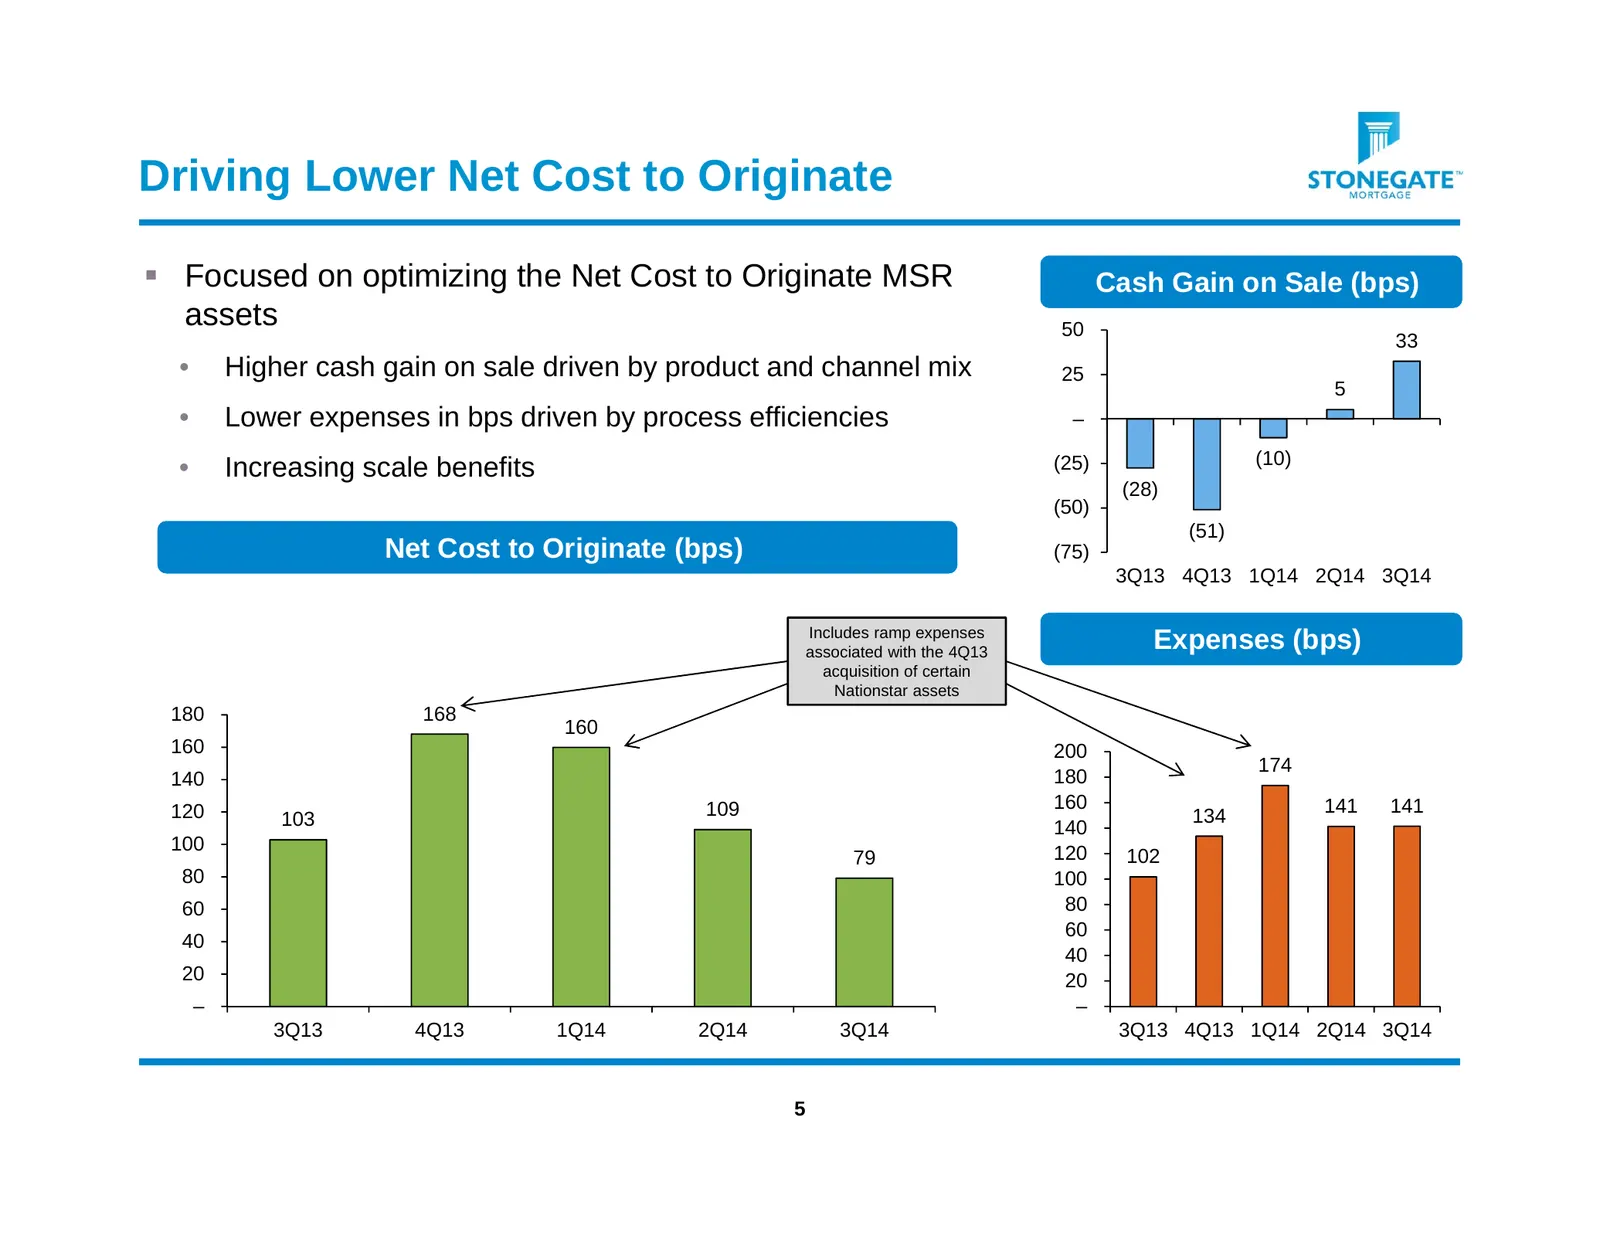
Driving Lower Net Cost to Originate Focused on optimizing the Net Cost to Originate MSR Cash Gain on Sale (bps) assets 50 33 • Higher cash gain on sale driven by product and channel mix 25 5 • Lower expenses in bps driven by process efficiencies – (25) (10) • Increasing scale benefits (28) (50) (5
Slide 6: Economic Value Creation from Origination
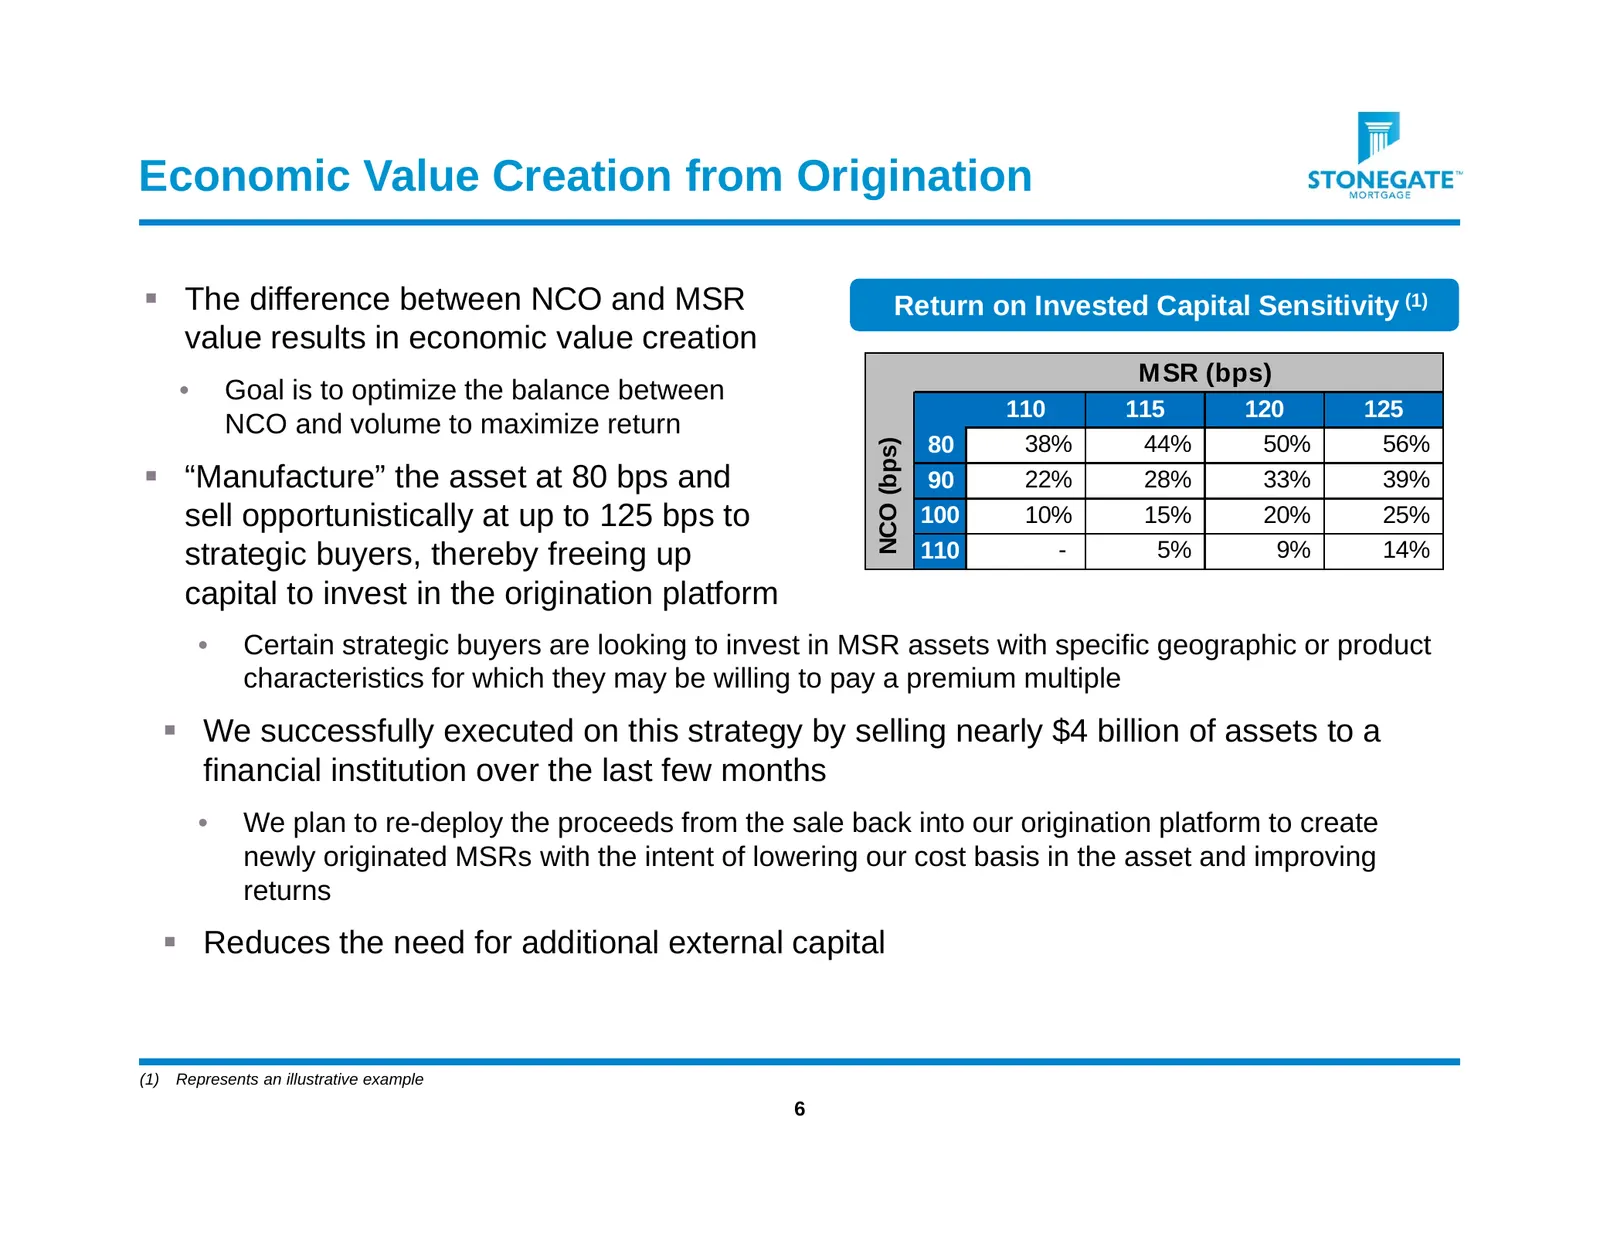
Economic Value Creation from Origination The difference between NCO and MSR Return on Invested Capital Sensitivity (1) value results in economic value creation MSR (bps) • Goal is to optimize the balance between 110 115 120 125 NCO and volume to maximize return 80 38% 44% 50% 56% NCO (bps) “Manu
Slide 7: Origination Growth through Geographic Expansion
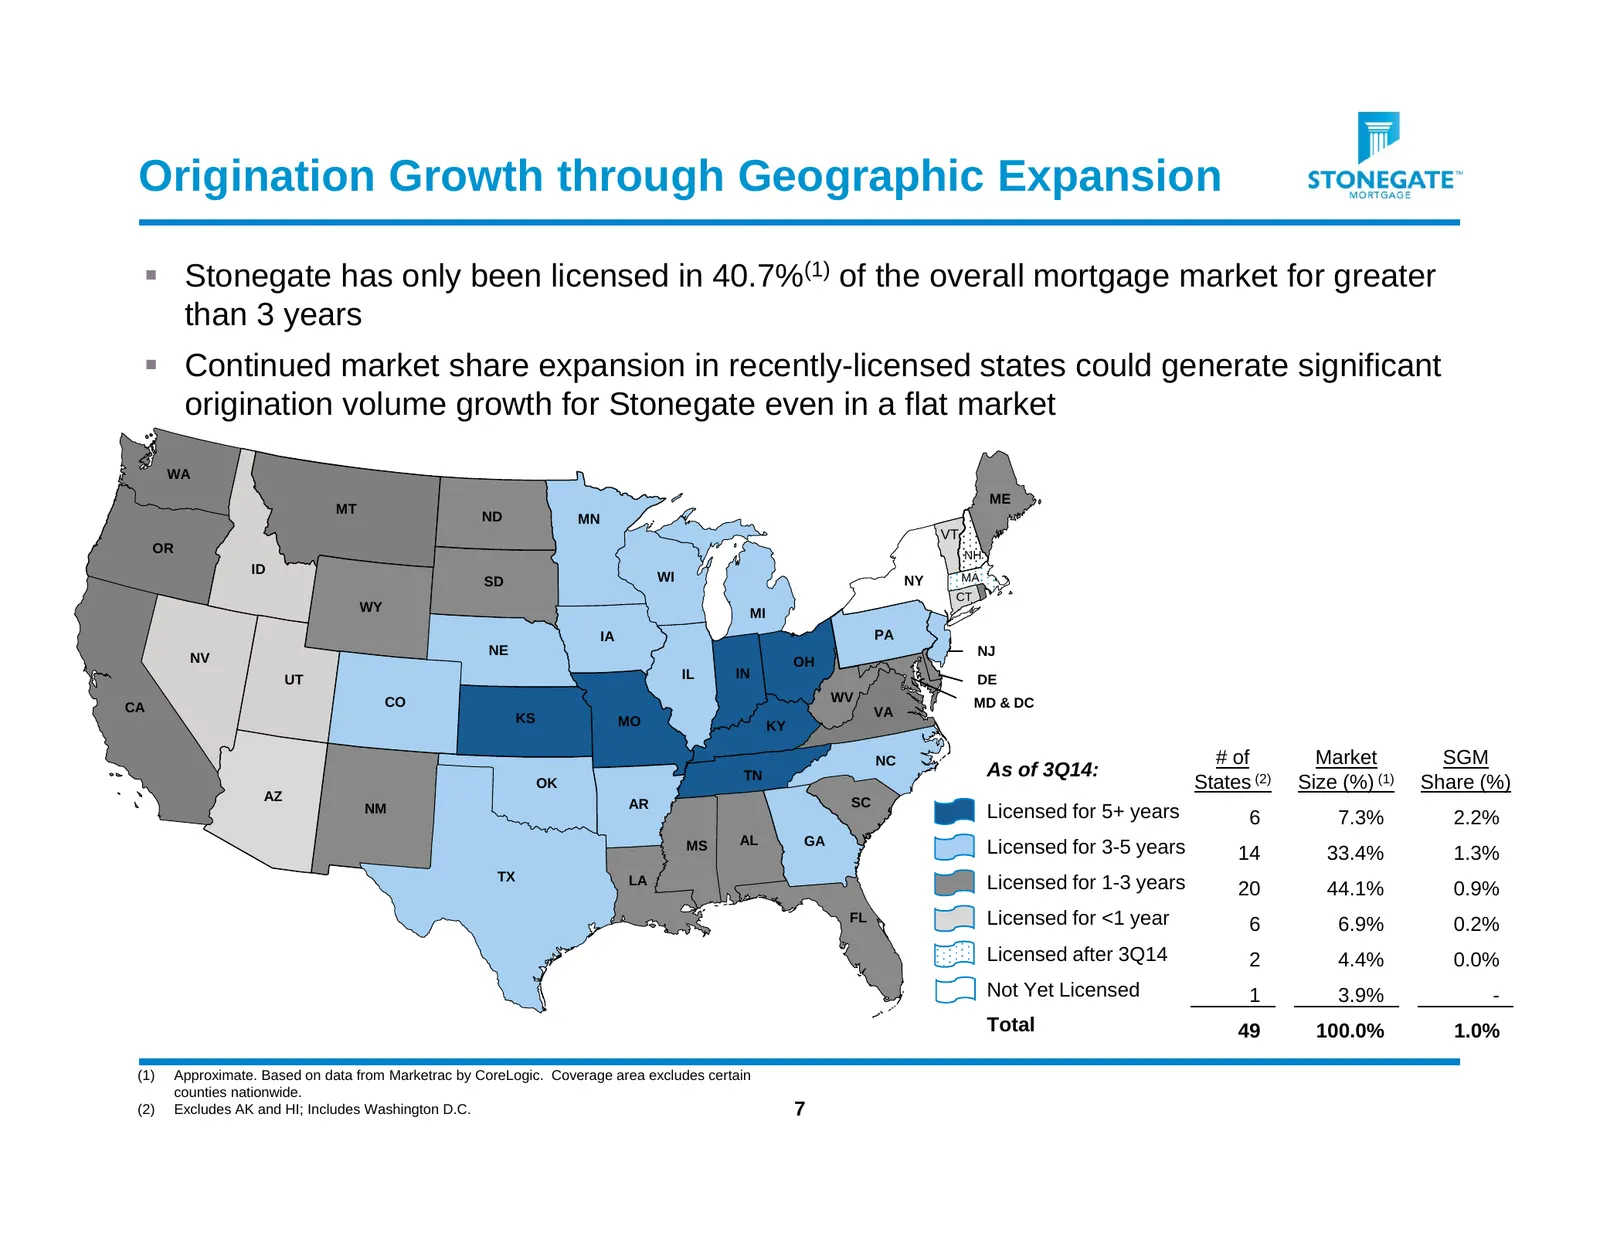
Origination Growth through Geographic Expansion Stonegate has only been licensed in 40.7%(1) of the overall mortgage market for greater than 3 years Continued market share expansion in recently-licensed states could generate significant origination volume growth for Stonegate even in a flat mark
Slide 8: Summary of Growth Opportunities
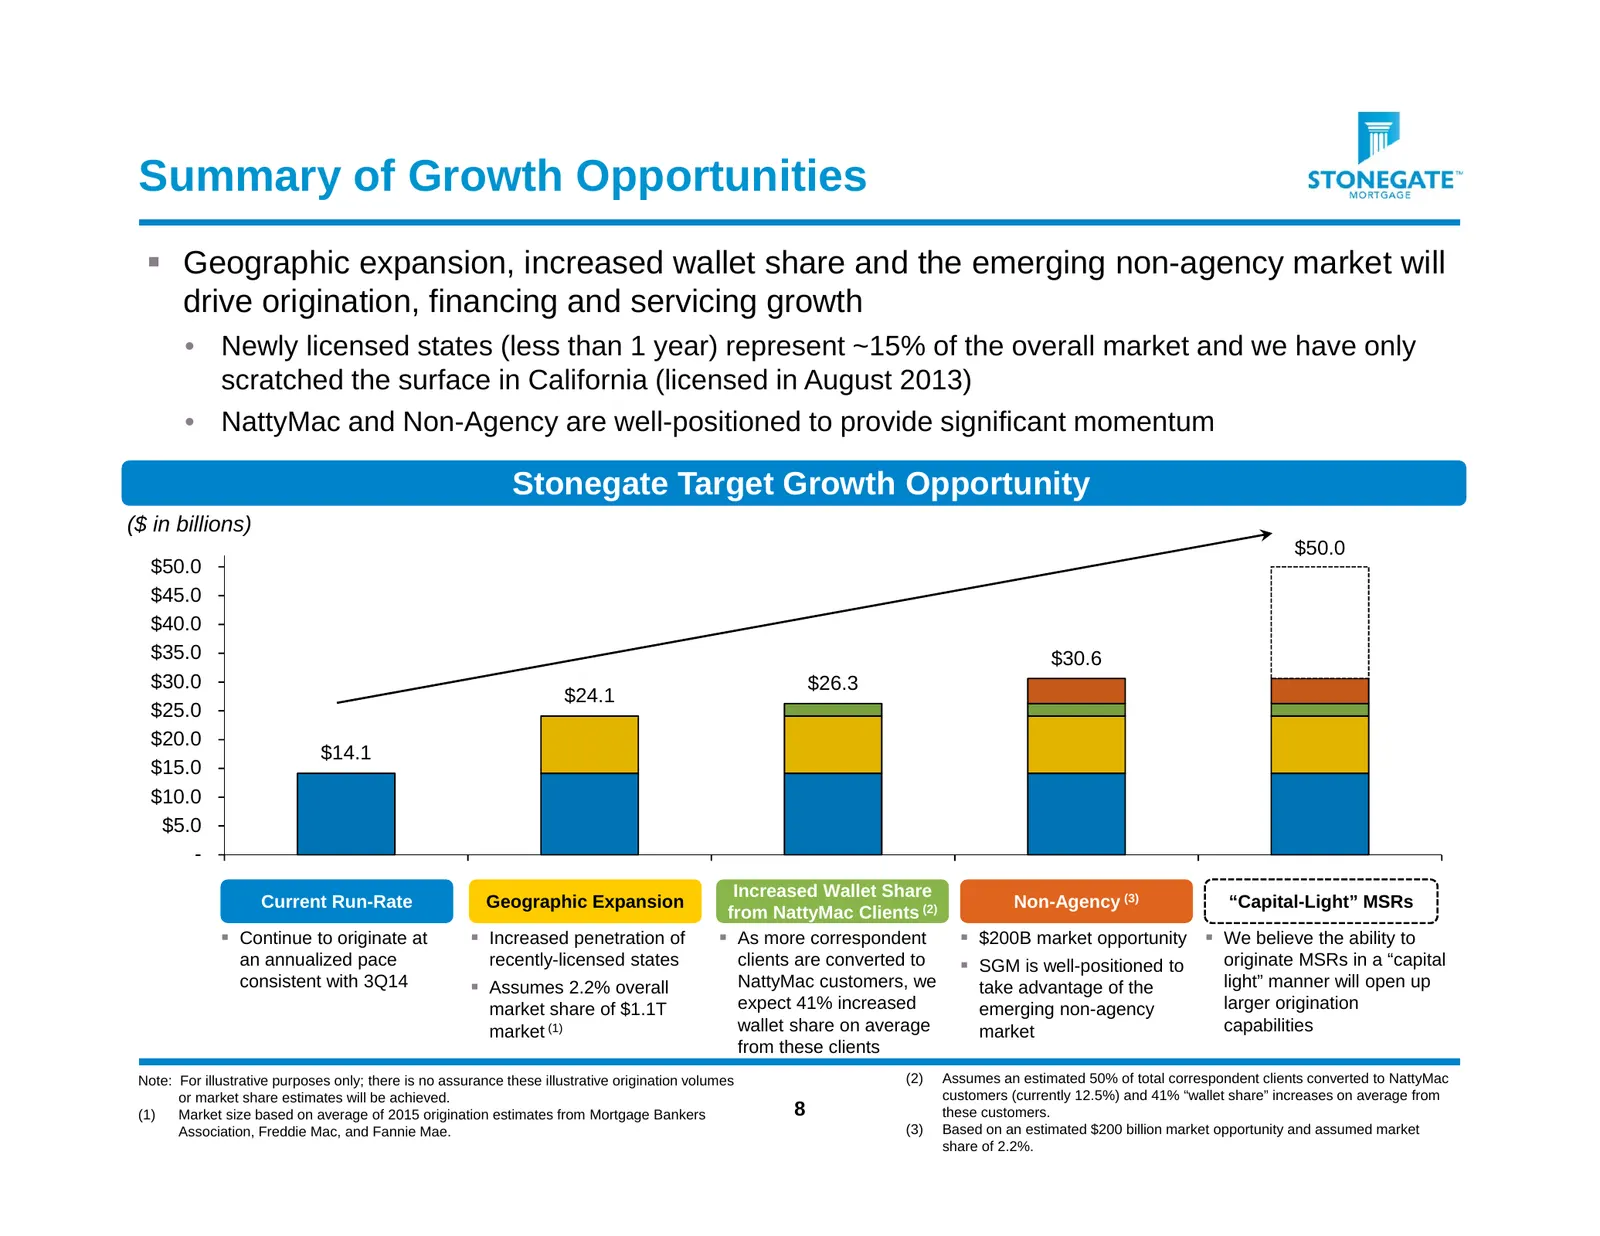
Summary of Growth Opportunities Geographic expansion, increased wallet share and the emerging non-agency market will drive origination, financing and servicing growth • Newly licensed states (less than 1 year) represent ~15% of the overall market and we have only scratched the surface in Californi
Slide 9: Contact Information
Contact Information Jim Cutillo Michael McFadden Chief Executive Officer Chief of Staff Stonegate Mortgage Stonegate Mortgage P: (317) 663-5100 P: (317) 663-5904 [email protected] [email protected] 9
Source: SEC EDGAR · 8-K filed Dec 1, 2014
More decks from Stonegate Mortgage Corp
 Keefe, Bruyette & Woods 2015 Mortgage Finance Conference11 slides · Jun 1, 2015
 Investor Presentation (September 2014)13 slides · Sep 18, 2014
 Barclays Global Financial Services Conference 201411 slides · Sep 8, 2014
 Keefe, Bruyette & Woods 2014 Mortgage Finance Conference18 slides · Jun 2, 2014
 Investor Presentation (February 2014)16 slides · Feb 25, 2014
 Investor Presentation (November 2013)30 slides · Nov 19, 2013