VEREIT — American Realty Capital Properties — IPO Roadshow (July 2013)
87 slides from VEREIT's IPO roadshow presentation, Jul 24, 2013
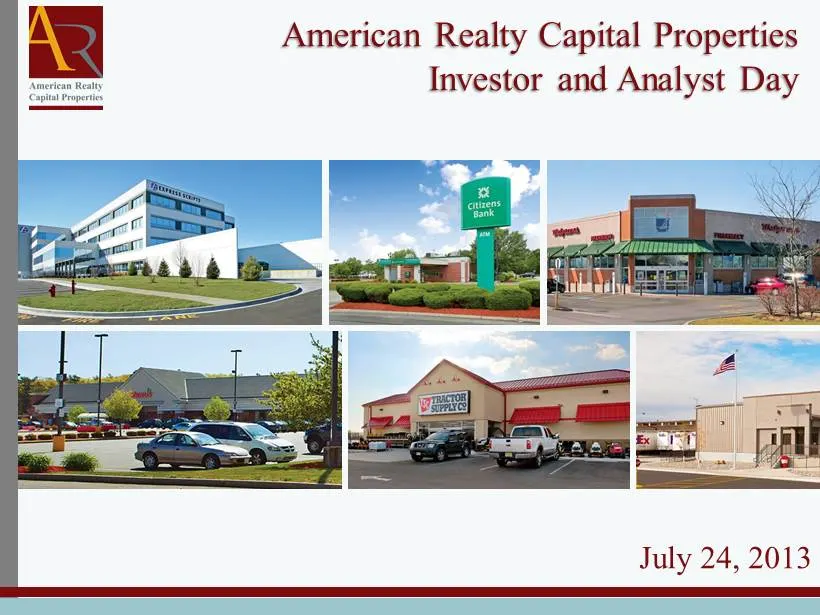
Slide 1: Investor and Analyst Day July 24, 2013
February 2013 American Realty Capital Properties Investor and Analyst Day July 24, 2013
Slide 2: Additional Information about the Proposed CapLease Transaction
Additional Information Additional Information about the Proposed CapLease Transaction and Where to Find It This communication does not constitute an offer to sell or the solicitation of an offer to buy any securities or a solicitation of any vote or approval. In connection with the proposed transact
Slide 3: Additional Information about the Proposed ARCT IV Transaction
Additional Information Additional Information about the Proposed ARCT IV Transaction and Where to Find It This communication does not constitute an offer to sell or the solicitation of an offer to buy any securities or a solicitation of any vote or approval. In connection with the proposed transacti
Slide 4: Additional Information about the Proposed Transaction and Where to Find It
Additional Information about the Proposed Transaction and Where to Find It This communication does not constitute an offer to sell or the solicitation of an offer to buy any securities. In connection with the proposed transaction, American Realty Capital Properties, Inc. (“ARCP”) has filed a registr
Slide 5: Forward-Looking Statements
Forward - Looking Statements Information set forth herein (including information included or incorporated by reference herein) contains “forward - looking statements” (as defined in Section 21 E of the Securities Exchange Act of 1934 , as amended), which reflect ARCP's expectations regarding future
Slide 6: FFO and AFFO definitions
6 ARCP considers funds from operations (“FFO”) and AFFO, which is FFO as adjusted to exclude acquisition - related fees and expenses, amortization of above - market lease assets and liabilities, amortization of deferred financing costs, straight - line ren t, non - cash mark - to - market adjustment
Slide 7: Agenda
7 Agenda • Leadership in the Net Lease Sector Nicholas S. Schorsch, Chairman & CEO • Capital Markets Update Brian S. Block, CFO • State of the Net Lease Market Neill Wessell , Director, Eastdil Secured • Recent Acquisitions and Forward Pipeline Michael Weil, President • Underwriting, Due Diligence &
Slide 8: Proven Management Team
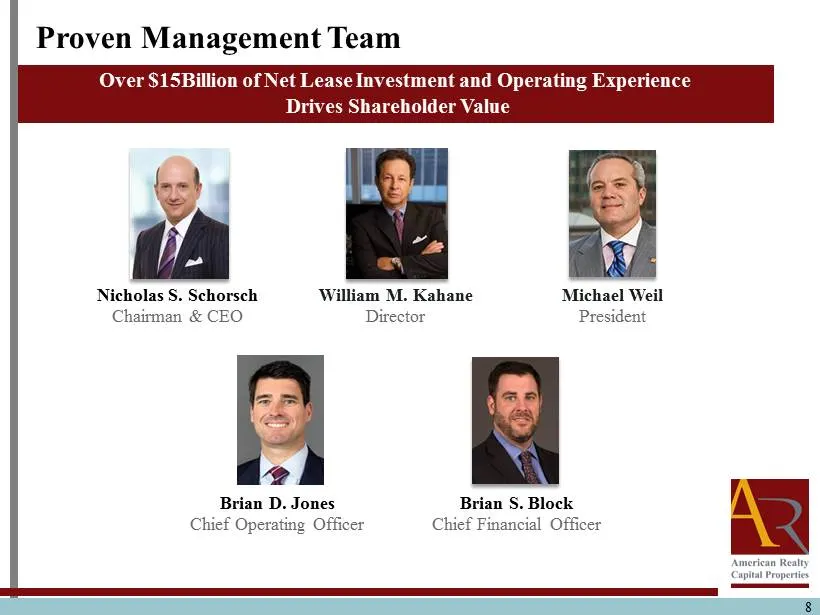
8 Proven Management Team Over $15Billion of Net Lease Investment and Operating Experience Drives Shareholder Value Nicholas S. Schorsch Chairman & CEO Brian S. Block Chief Financial Officer Michael Weil President Brian D. Jones Chief Operating Officer William M. Kahane Director
Slide 9: Leadership in the Net Lease Sector
Leadership in the Net Lease Sector Nicholas S. Schorsch Chairman and CEO 9
Slide 10: Compelling Value Proposition
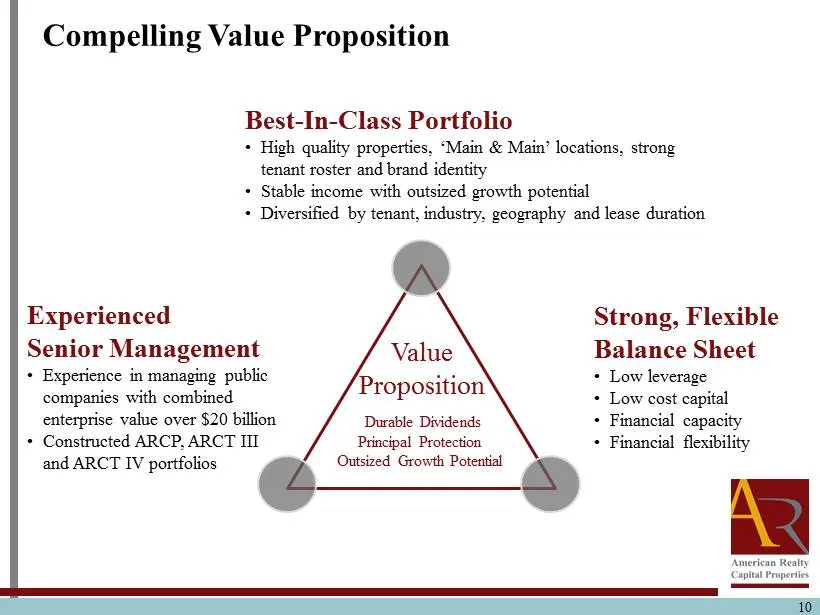
10 Experienced Senior Management • Experience in managing public companies with combined enterprise value over $20 billion • Constructed ARCP, ARCT III and ARCT IV portfolios Best - In - Class Portfolio • High quality properties, ‘Main & Main’ locations, strong tenant roster and brand identity • Sta
Slide 11: Unique Investment Strategy
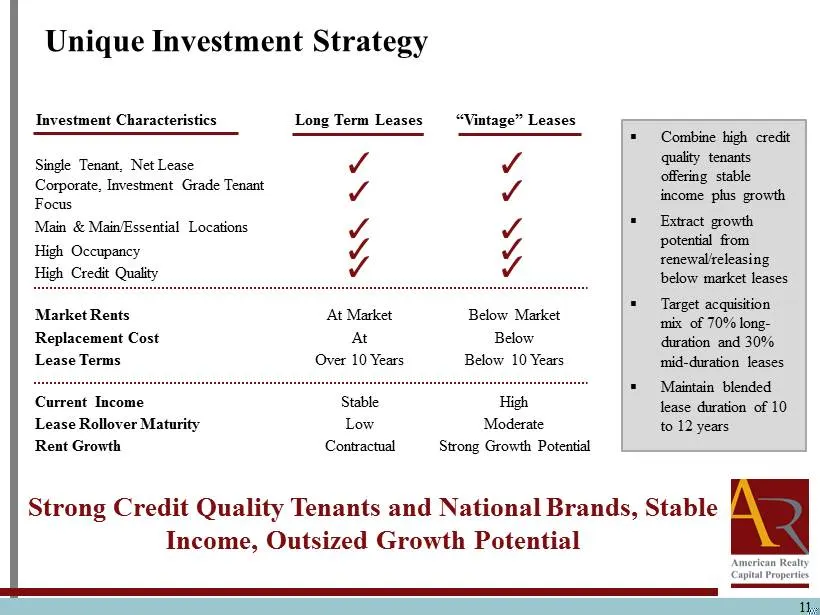
Long Term Leases 11 Unique Investment Strategy Strong Credit Quality Tenants and National Brands, Stable Income, Outsized Growth Potential Single Tenant, Net Lease Corporate, Investment Grade Tenant Focus Main & Main/Essential Locations High Occupancy High Credit Quality Market Rents At Market Below
Slide 12: ARCP Timeline and Market Capitalization
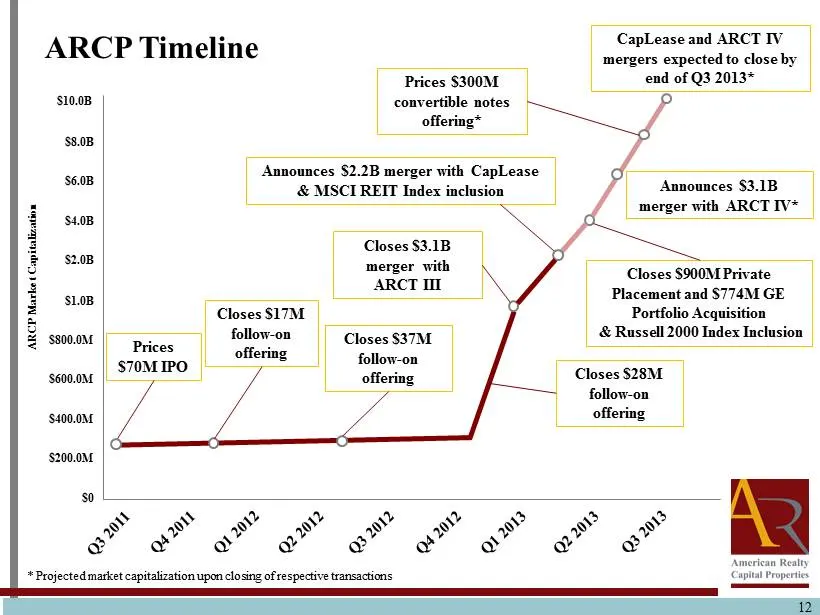
Closes $900M Private Placement and $774M GE Portfolio Acquisition & Russell 2000 Index Inclusion Closes $3.1B merger with ARCT III 12 ARCP Timeline $10.0B Closes $17M follow - on offering Closes $37M follow - on offering $8.0B $6.0B $4.0B $2.0B Announces $2.2B merger with CapLease & MSCI REIT Index
Slide 13: Growth Strategy Spans Deal Landscape
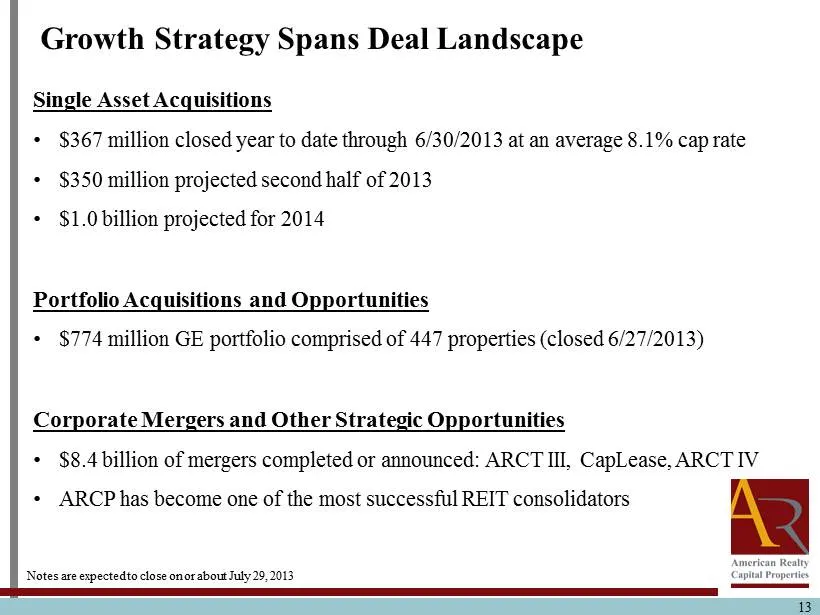
13 Single Asset Acquisitions • $ 367 million closed year to date through 6/30/2013 at an average 8.1 % cap rate • $ 350 million projected second half of 2013 • $1.0 billion projected for 2014 Portfolio Acquisitions and Opportunities • $774 million GE portfolio comprised of 447 properties (closed 6/2
Slide 14: Capital Markets Activity
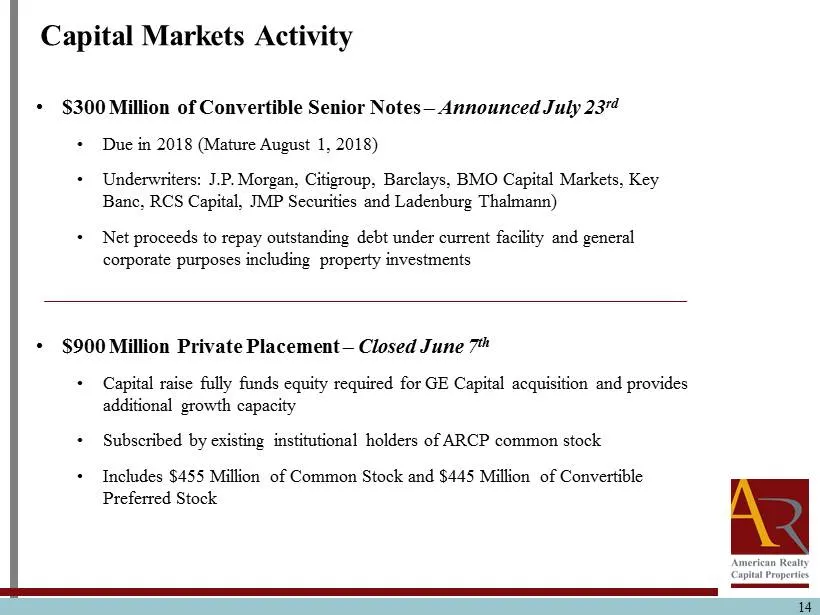
14 • $300 Million of Convertible Senior Notes – Announced July 23 rd • D ue in 2018 (Mature August 1, 2018) • Underwriters: J.P . Morgan, Citigroup, Barclays, BMO Capital Markets, Key Banc, RCS Capital, JMP Securities and Ladenburg Thalmann ) • Net proceeds to repay outstanding debt under current fa
Slide 15: $367 Million Asset Acquisitions YTD
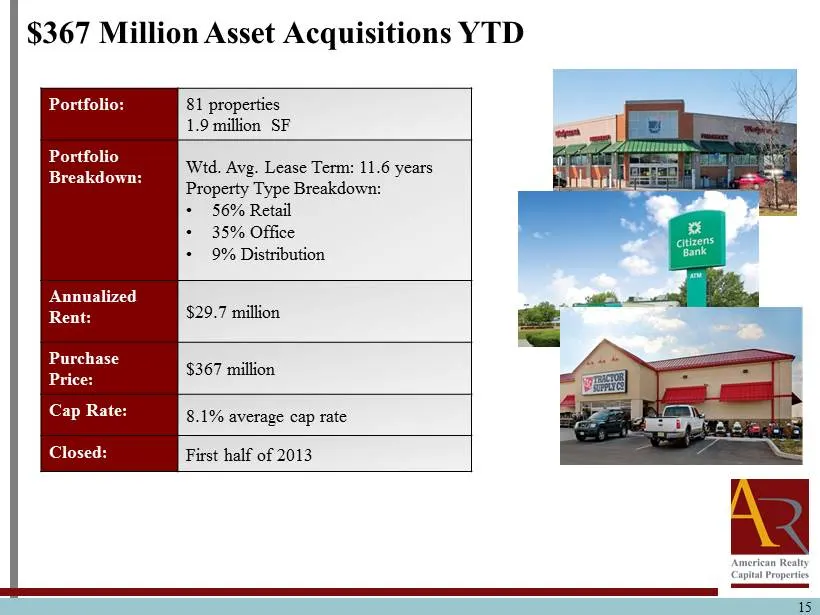
15 $367 Million Asset Acquisitions YTD Portfolio: 81 properties 1.9 million SF Portfolio Breakdown: Wtd . Avg. Lease Term: 11.6 years Property Type Breakdown: • 56% Retail • 35% Office • 9% Distribution Annualized Rent : $29.7 million Purchase Price: $367 million Cap Rate: 8.1% average cap rate Clos
Slide 16: GE Capital Portfolio Acquisition
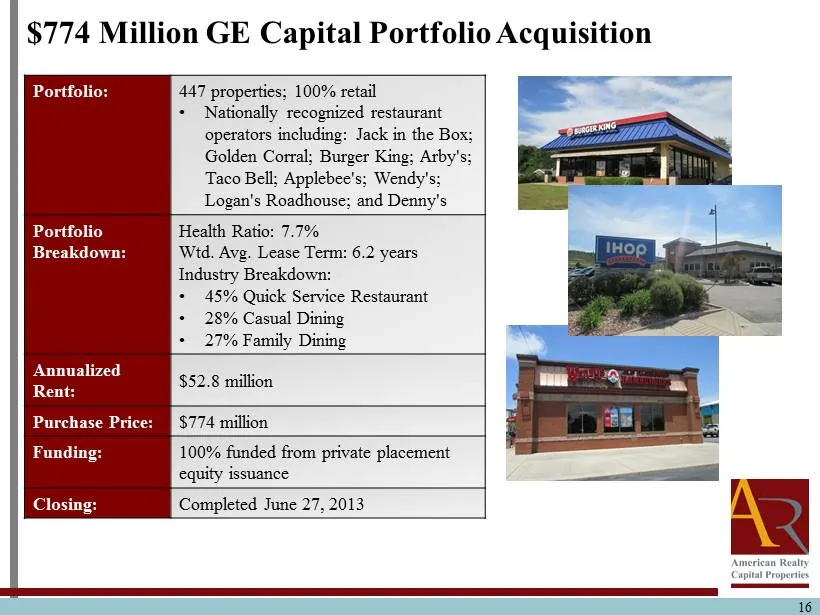
16 $ 774 Million GE Capital Portfolio Acquisition Portfolio: 447 properties; 100% retail • Nationally recognized restaurant operators including: Jack in the Box; Golden Corral; Burger King; Arby's; Taco Bell; Applebee's; Wendy's; Logan's Roadhouse; and Denny's Portfolio Breakdown: Health Ratio: 7.7%
Slide 17: $2.2 Billion Acquisition of CapLease
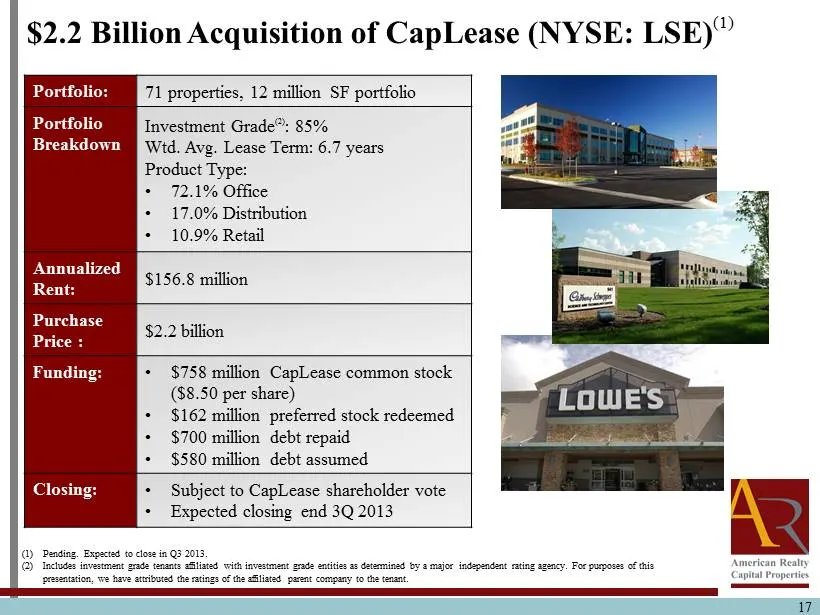
17 $2.2 Billion Acquisition of CapLease (NYSE: LSE) (1) Portfolio: 71 properties, 12 million SF portfolio Portfolio Breakdown Investment Grade (2) : 85% Wtd . Avg. Lease Term: 6.7 years Product Type : • 72.1% Office • 17.0% Distribution • 10.9% Retail Annualized Rent : $156.8 million Purchase Price
Slide 18: Build-to-Suit Capabilities
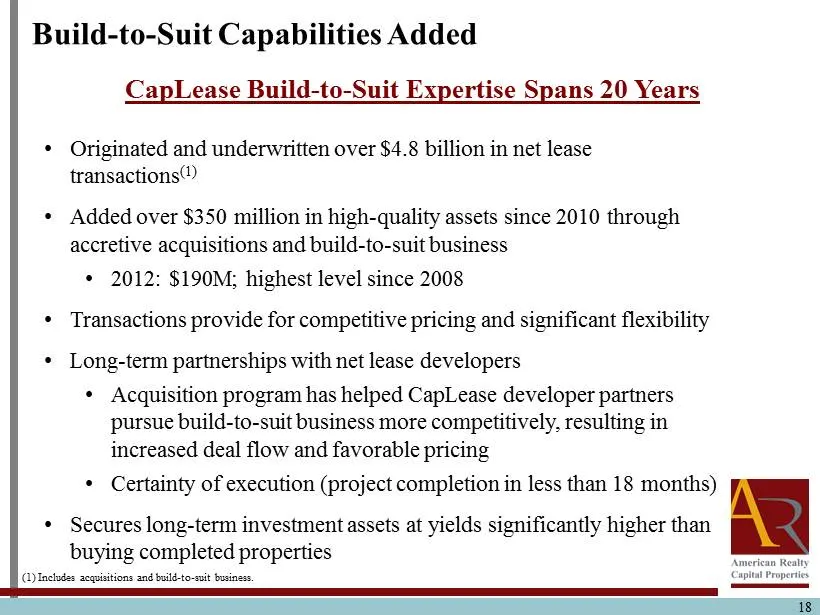
• Originated and underwritten over $4.8 billion in net lease transactions (1) • Added over $350 million in high - quality assets since 2010 through accretive acquisitions and build - to - suit business • 2012: $190M; highest level since 2008 • Transactions provide for competitive pricing and signifi
Slide 19: CapLease Management Expected to Add Depth
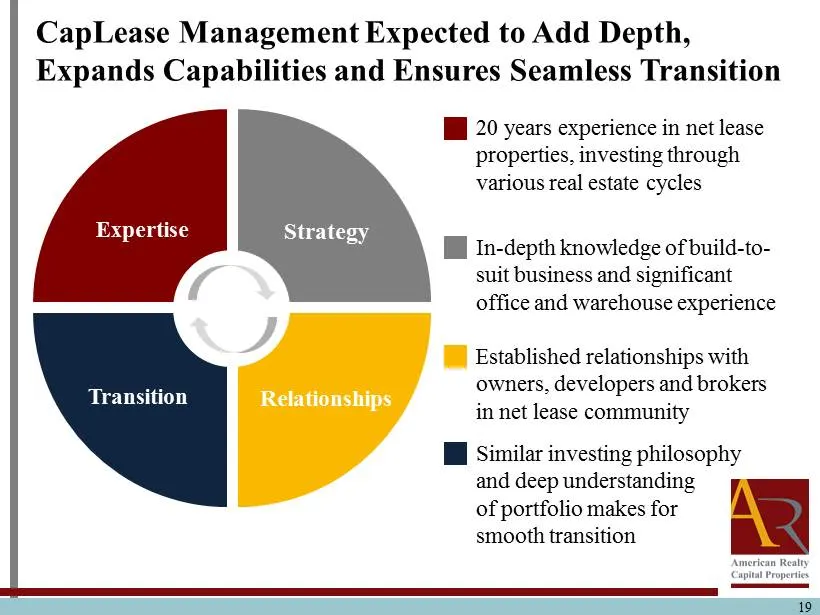
19 2013 Highlights CapLease Management Expected to Add Depth, Expands Capabilities and Ensures Seamless Transition Strategy Expertise Transition Relationships 20 years experience in net lease properties, investing through various real estate cycles In - depth knowledge of build - to - suit business
Slide 20: $3.1 Billion Acquisition of ARCT IV
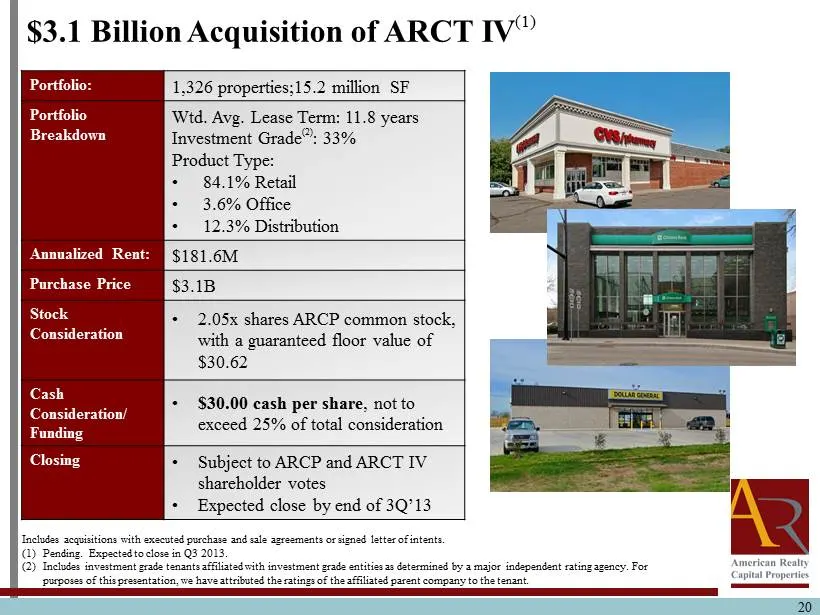
20 $ 3.1 Billion Acquisition of ARCT IV (1) Portfolio: 1,326 properties;15.2 million SF Portfolio Breakdown Wtd . Avg. Lease Term: 11.8 years Investment Grade (2) : 33% Product Type: • 84.1% Retail • 3.6% Office • 12.3% Distribution Annualized Rent : $181.6M Purchase Price $3.1B Stock Consideration

Slide 21: Questions & Answers
Questions & Answers 21
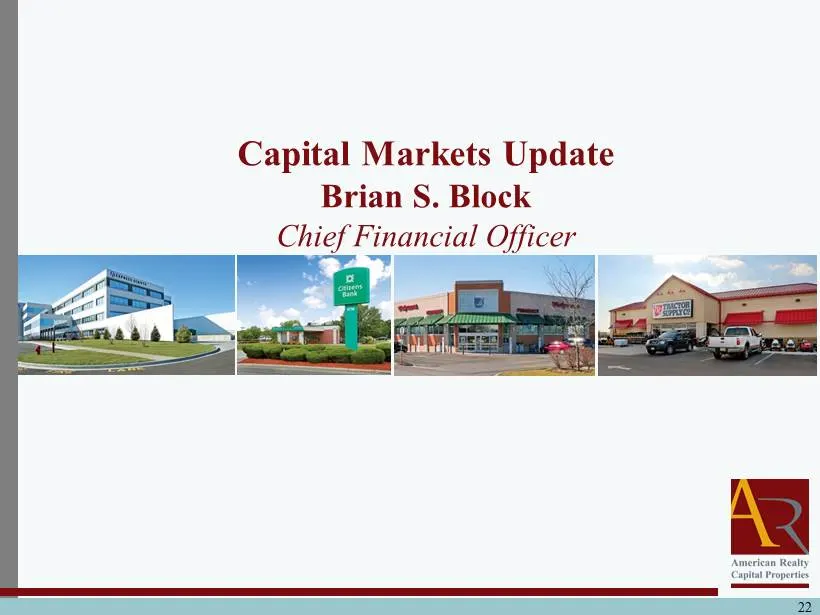
Slide 22: Capital Markets Update
Capital Markets Update Brian S. Block Chief Financial Officer 22
Slide 23: $300 Million Convertible Senior Notes
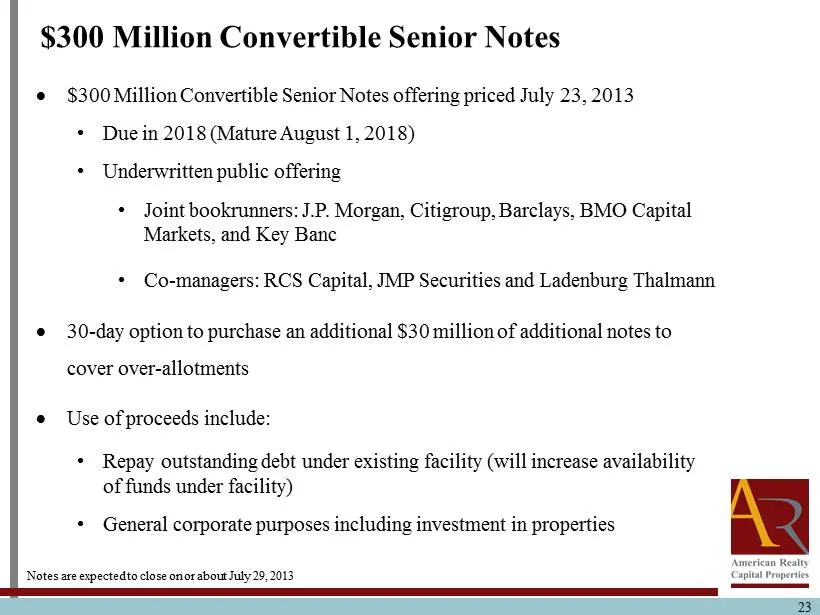
23 $300 M illion Convertible Senior Notes offering priced July 23, 2013 • Due in 2018 (Mature August 1, 2018) • Underwritten public offering • Joint bookrunners : J.P. Morgan, Citigroup, Barclays, BMO Capital Markets, and Key Banc • Co - managers: RCS Capital, JMP Securities and Ladenburg Thalmann
Slide 24: $900 Million Private Placement
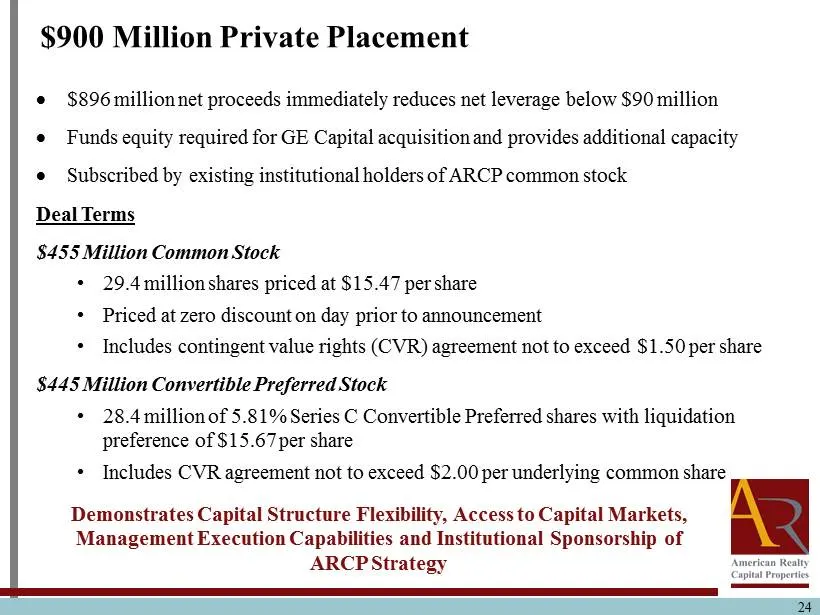
24 $896 million net proceeds immediately reduces net leverage below $90 million Funds equity required for GE Capital acquisition and provides additional capacity Subscribed by existing institutional holders of ARCP common stock Deal Terms $455 Million Common Stock • 29.4 million shares priced
Slide 25: Capitalization as of June 30, 2013
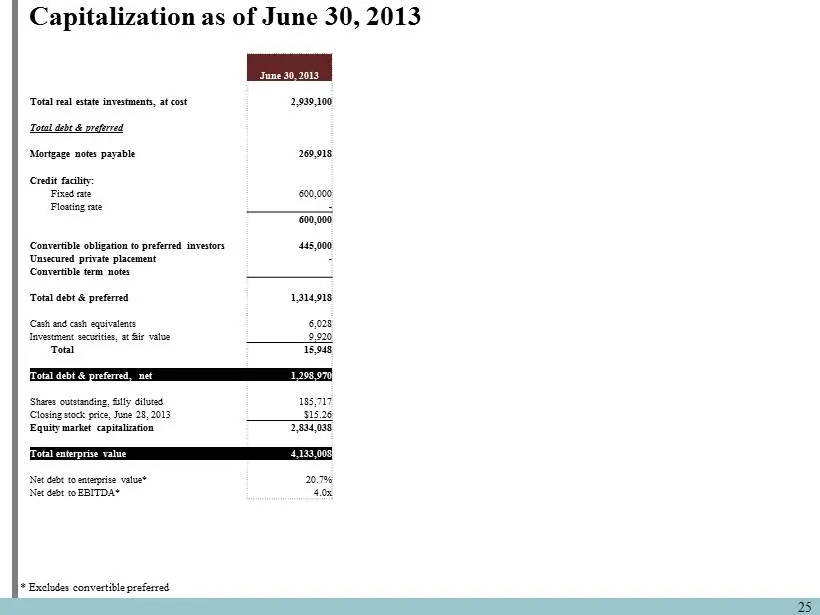
25 Capitalization as of June 30, 2013 June 30 , 2013 Total real estate investments, at cost 2,939,100 Total debt & preferred Mortgage notes payable 269,918 Credit facility: Fixed rate 600,000 Floating rate - 600,000 Convertible obligation to preferred investors 445,000 Unsecured private placement -
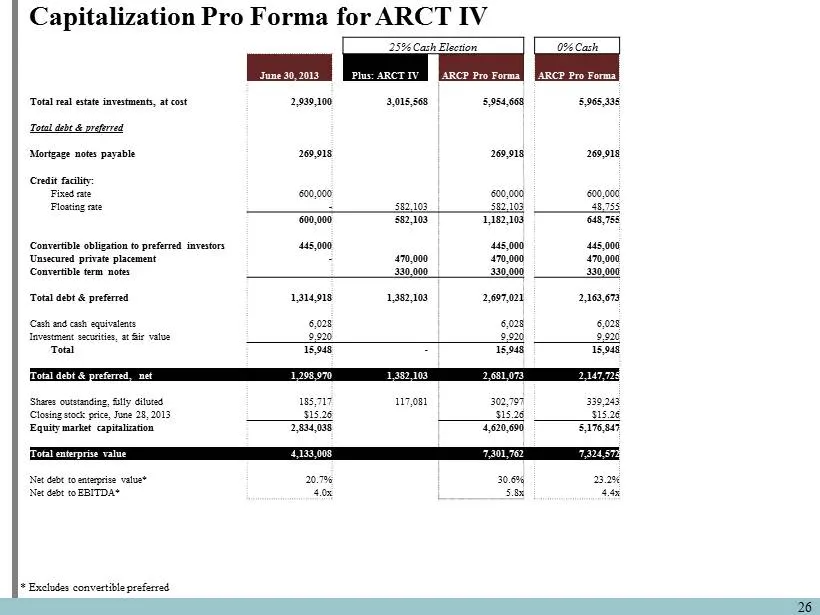
Slide 26: Capitalization Pro Forma for ARCT IV
26 Capitalization Pro Forma for ARCT IV 25 % Cash Election 0% Cash June 30, 2013 Plus: ARCT IV ARCP Pro Forma ARCP Pro Forma Total real estate investments, at cost 2,939,100 3,015,568 5,954,668 5,965,335 Total debt & preferred Mortgage notes payable 269,918 269,918 269,918 Credit facility: Fixed rat
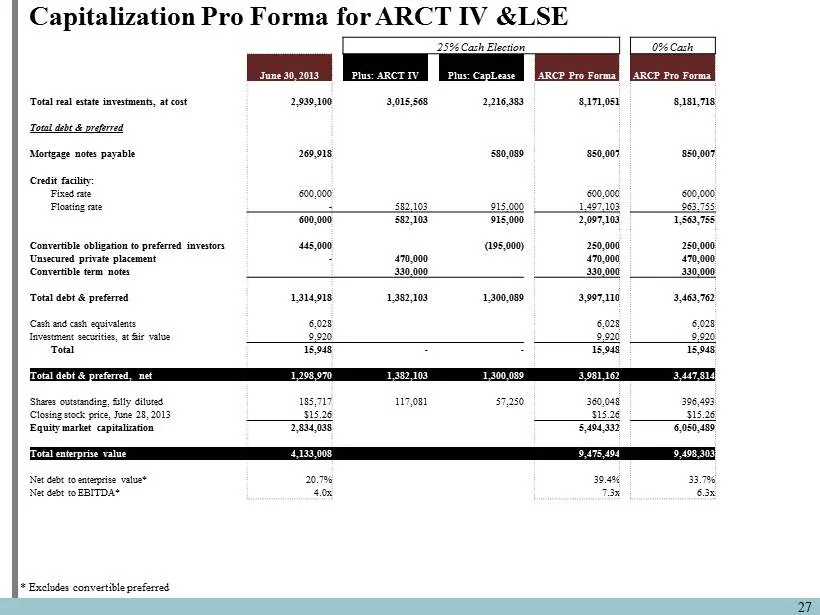
Slide 27: Capitalization Pro Forma for ARCT IV & LSE
27 Capitalization Pro Forma for ARCT IV &LSE 25 % Cash Election 0% Cash June 30, 2013 Plus: ARCT IV Plus: CapLease ARCP Pro Forma ARCP Pro Forma Total real estate investments, at cost 2,939,100 3,015,568 2,216,383 8,171,051 8,181,718 Total debt & preferred Mortgage notes payable 269,918 580,089 850,
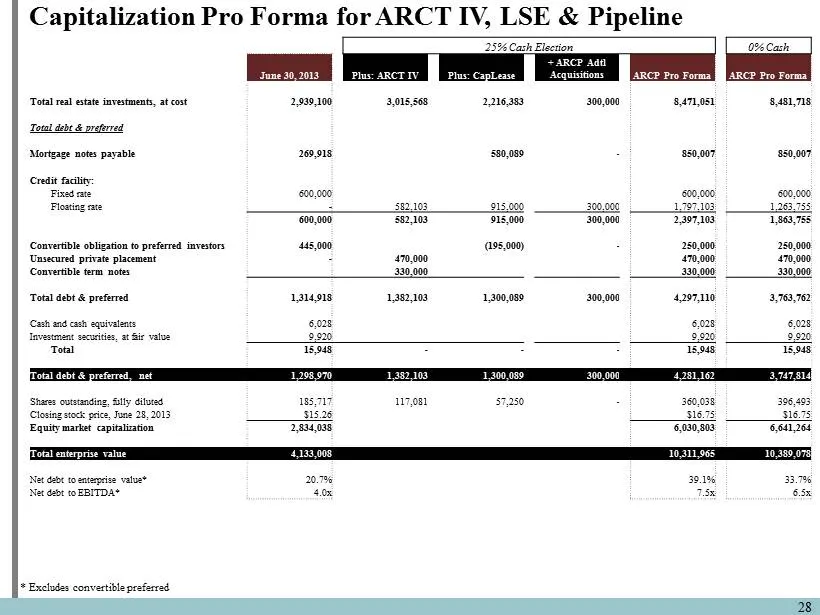
Slide 28: Capitalization Pro Forma for ARCT IV, LSE & Pipeline
28 Capitalization Pro Forma for ARCT IV, LSE & Pipeline 25 % Cash Election 0% Cash June 30, 2013 Plus: ARCT IV Plus: CapLease + ARCP Adtl Acquisitions ARCP Pro Forma ARCP Pro Forma Total real estate investments, at cost 2,939,100 3,015,568 2,216,383 300,000 8,471,051 8,481,718 Total debt & preferred
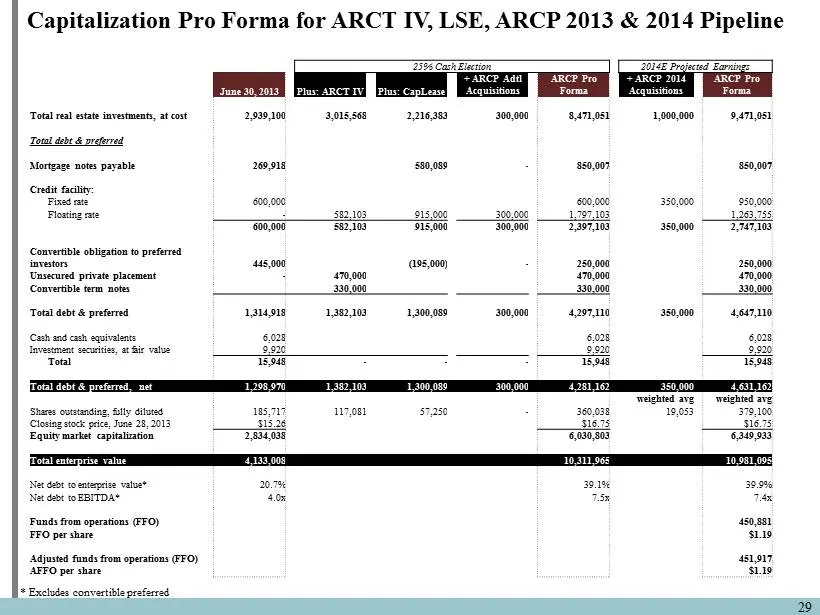
Slide 29: Capitalization Pro Forma with 2013 & 14 Pipeline
29 Capitalization Pro Forma for ARCT IV, LSE, ARCP 2013 & 2014 Pipeline 25 % Cash Election 2014E Projected Earnings June 30, 2013 Plus: ARCT IV Plus: CapLease + ARCP Adtl Acquisitions ARCP Pro Forma + ARCP 2014 Acquisitions ARCP Pro Forma Total real estate investments, at cost 2,939,100 3,015,568 2,
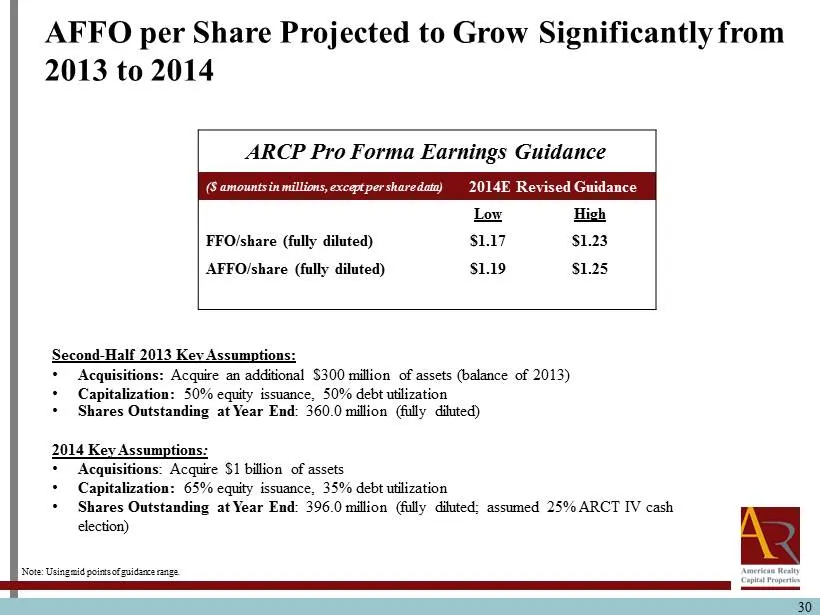
Slide 30: AFFO per Share Projected to Grow Significantly
30 AFFO per Share Projected to Grow S ignificantly from 2013 to 2014 ARCP Pro Forma Earnings Guidance ($ amounts in millions, except per share data) 2014E Revised Guidance Low High FFO/share (fully diluted) $1.17 $1.23 AFFO/share (fully diluted) $1.19 $1.25 Note: Using mid points of guidance range.
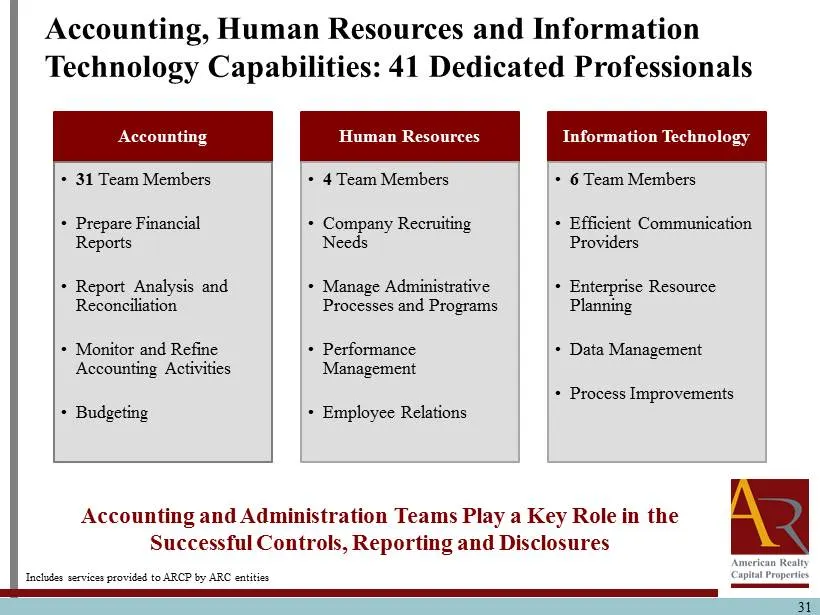
Slide 31: Accounting, HR and IT Capabilities
31 Accounting, Human Resources and Information Technology Capabilities : 41 Dedicated Professionals Accounting • 31 Team Members • Prepare Financial Reports • Report Analysis and Reconciliation • Monitor and Refine Accounting Activities • Budgeting Human Resources • 4 Team Members • Company Recruiti

Slide 32: Questions & Answers
Questions & Answers 32
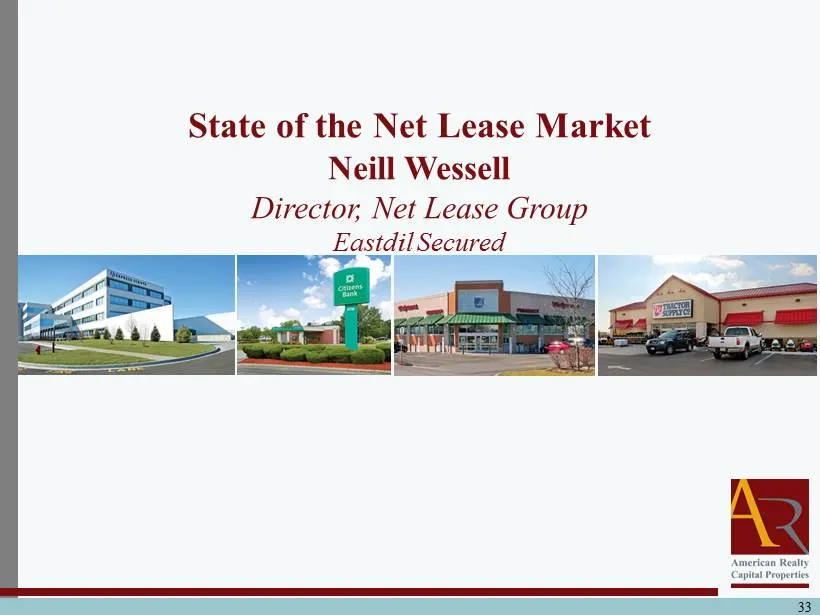
Slide 33: State of the Net Lease Market
State of the Net Lease Market Neill Wessell Director, Net Lease Group Eastdil Secured 33
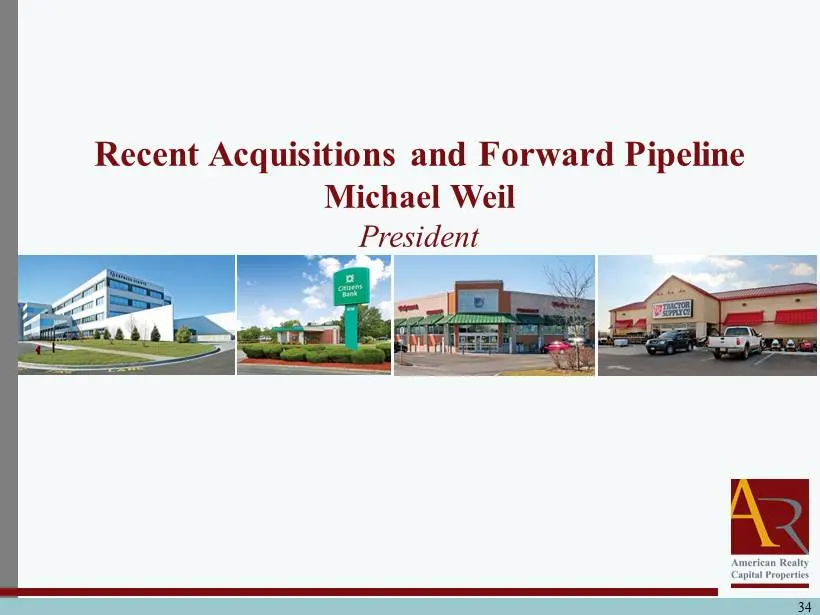
Slide 34: Recent Acquisitions and Forward Pipeline
Recent Acquisitions and Forward Pipeline Michael Weil President 34
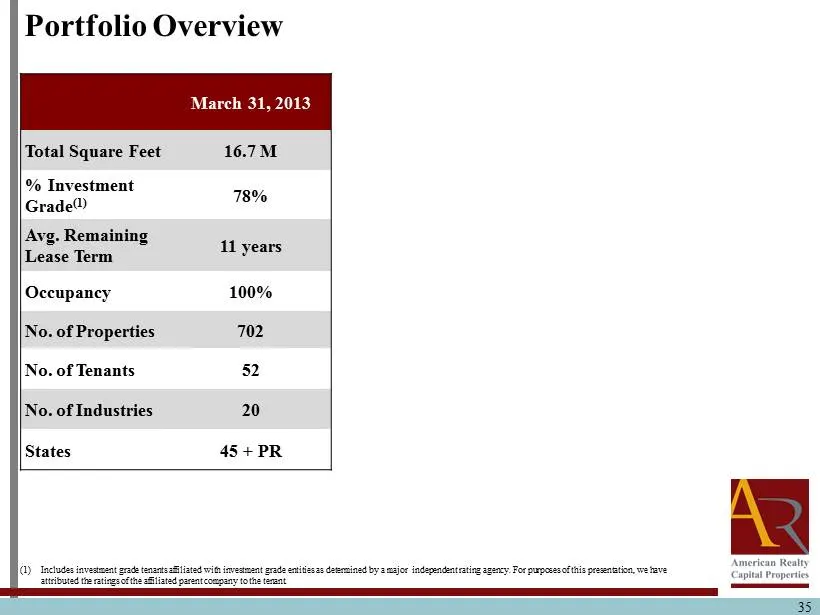
Slide 35: Portfolio Overview
Portfolio Overview 35 (1) Includes investment grade tenants affiliated with investment grade entities as determined by a major independent rating agen cy. For purposes of this presentation, we have attributed the ratings of the affiliated parent company to the tenant. March 31, 2013 Total Square Fee
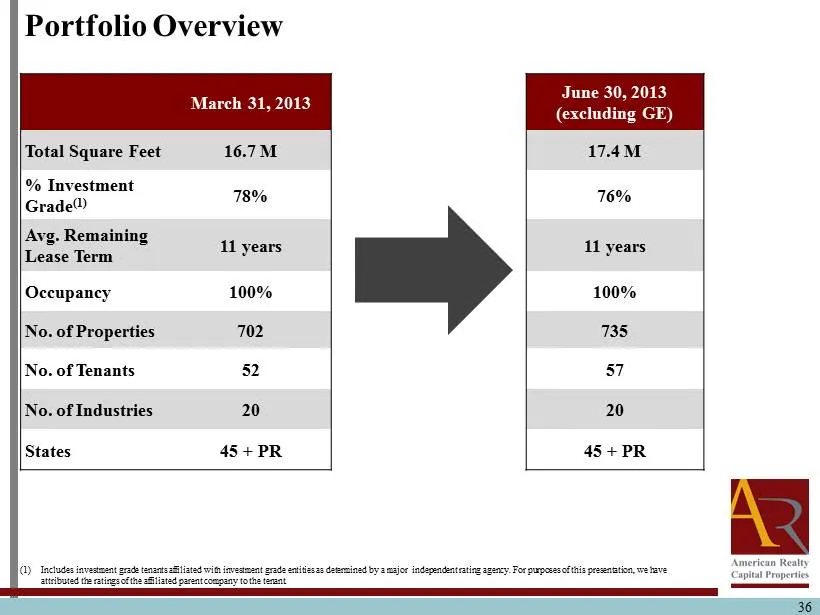
Slide 36: Portfolio Overview (excluding GE)
36 March 31, 2013 June 30, 2013 (excluding GE) Total Square Feet 16.7 M 17.4 M % Investment Grade (1) 78% 76% Avg. Remaining Lease Term 11 years 11 years Occupancy 100% 100% No. of Properties 702 735 No. of Tenants 52 57 No. of Industries 20 20 States 45 + PR 45 + PR (1) Includes investment grade te
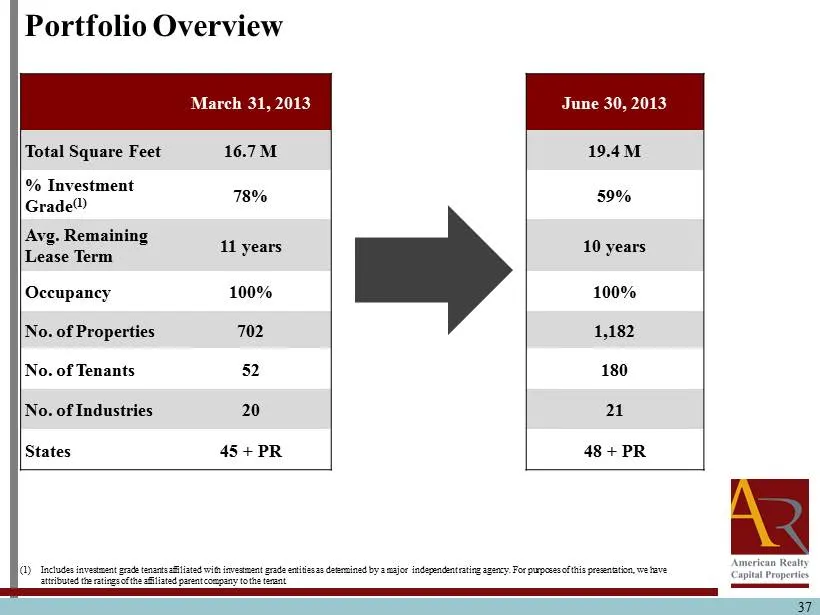
Slide 37: Portfolio Overview
37 March 31, 2013 June 30, 2013 Total Square Feet 16.7 M 19.4 M % Investment Grade (1) 78% 59% Avg. Remaining Lease Term 11 years 10 years Occupancy 100% 100% No. of Properties 702 1,182 No. of Tenants 52 180 No. of Industries 20 21 States 45 + PR 48 + PR (1) Includes investment grade tenants affili
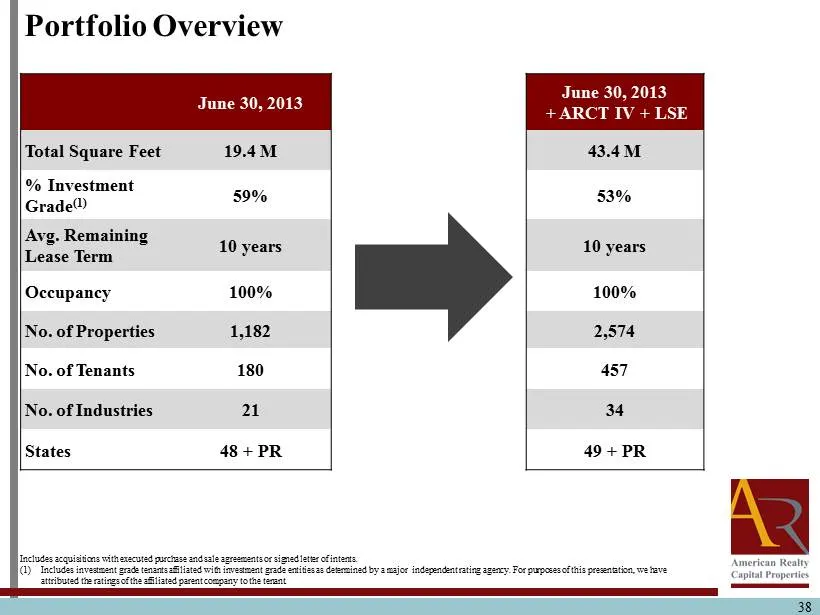
Slide 38: Portfolio Overview Pro Forma
38 June 30, 2013 June 30, 2013 + ARCT IV + LSE Total Square Feet 19.4 M 43.4 M % Investment Grade (1) 59% 53% Avg. Remaining Lease Term 10 years 10 years Occupancy 100% 100% No. of Properties 1,182 2,574 No. of Tenants 180 457 No. of Industries 21 34 States 48 + PR 49 + PR Includes acquisitions with
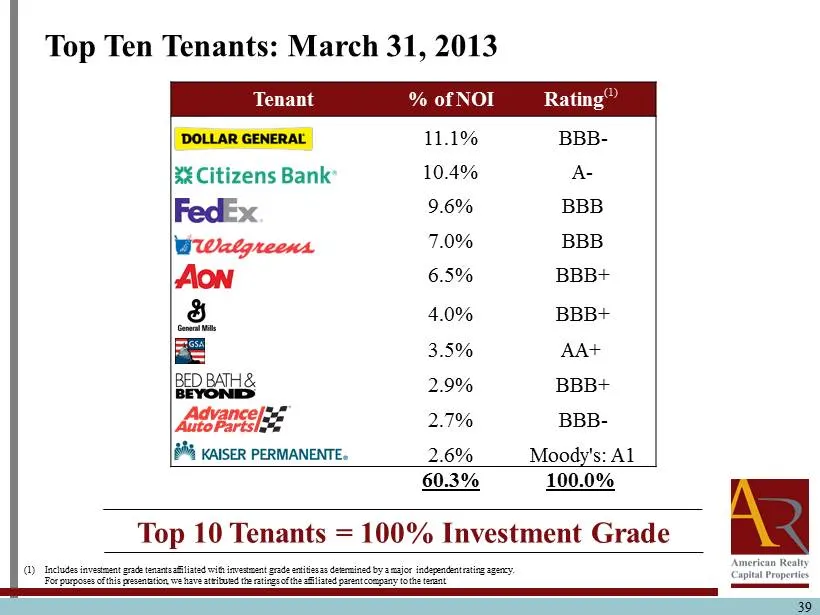
Slide 39: Top Ten Tenants: March 31, 2013
Tenant % of NOI Rating (1) 11.1% BBB - 10.4% A - 9.6% BBB 7.0% BBB 6.5% BBB+ 4.0% BBB+ 3.5% AA+ 2.9% BBB+ 2.7% BBB - 2.6% Moody's: A1 60.3% 100.0% 39 39 Top Ten Tenants: March 31, 2013 (1) Includes investment grade tenants affiliated with investment grade entities as determined by a major independen
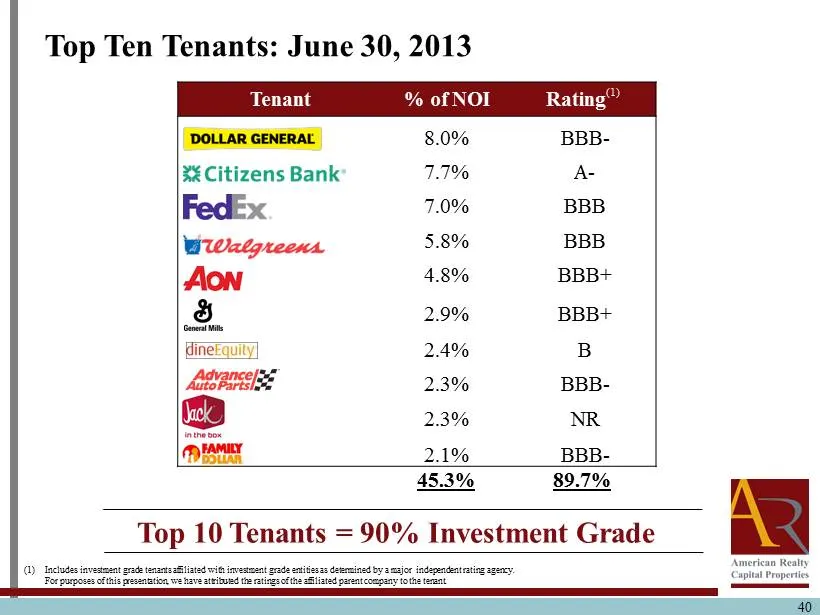
Slide 40: Top Ten Tenants: June 30, 2013
40 40 Top Ten Tenants: June 30, 2013 (1) Includes investment grade tenants affiliated with investment grade entities as determined by a major independent rating agency. For purposes of this presentation, we have attributed the ratings of the affiliated parent company to the tenant. Top 10 Tenants =
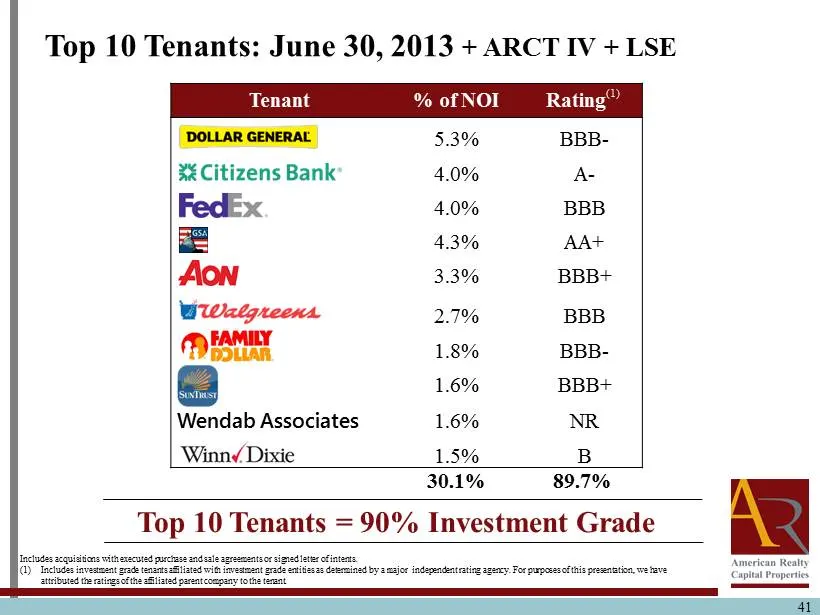
Slide 41: Top 10 Tenants: June 30, 2013 + ARCT IV + LSE
41 Tenant % of NOI Rating (1) 5.3% BBB - 4.0% A - 4.0% BBB 4.3% AA+ 3.3% BBB+ 2.7% BBB 1.8% BBB - 1.6% BBB+ Wendab Associates 1.6% NR 1.5% B 30.1% 89.7% Top 10 Tenants: June 30, 2013 + ARCT IV + LSE Top 10 Tenants = 90% Investment Grade Includes acquisitions with executed purchase and sale agreement
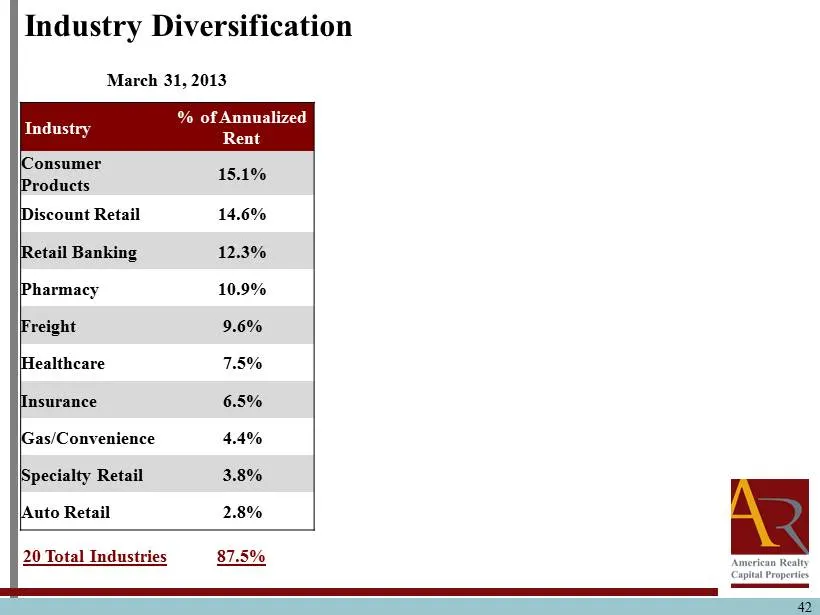
Slide 42: Industry Diversification March 31, 2013
Industry Diversification 42 March 31, 2013 Industry % of Annualized Rent Consumer Products 15.1% Discount Retail 14.6% Retail Banking 12.3% Pharmacy 10.9% Freight 9.6% Healthcare 7.5% Insurance 6.5% Gas/Convenience 4.4% Specialty Retail 3.8% Auto Retail 2.8% 20 Total Industries 87.5%
Slide 43: Industry Diversification
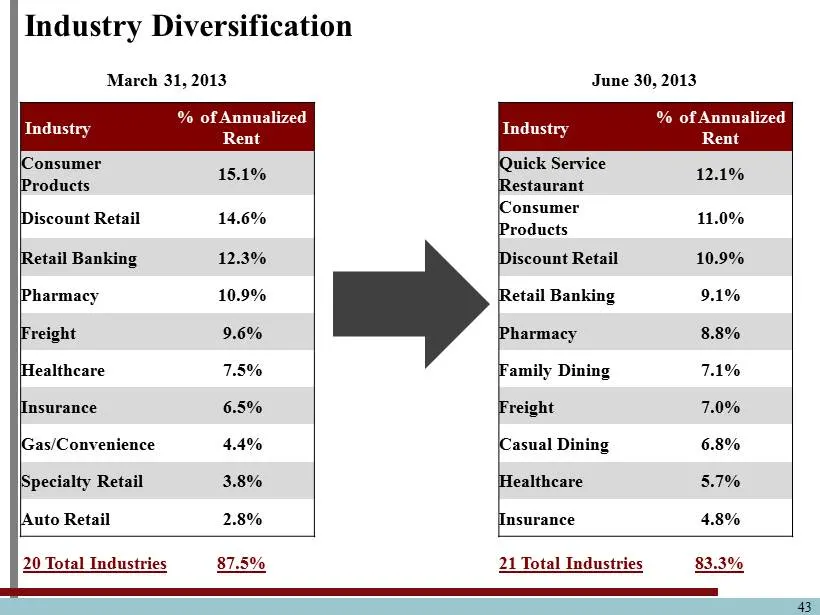
Industry Diversification 43 March 31, 2013 June 30, 2013 Industry % of Annualized Rent Industry % of Annualized Rent Consumer Products 15.1% Quick Service Restaurant 12.1% Discount Retail 14.6% Consumer Products 11.0% Retail Banking 12.3% Discount Retail 10.9% Pharmacy 10.9% Retail Banking 9.1% Frei
Slide 44: Industry Diversification Pro Forma
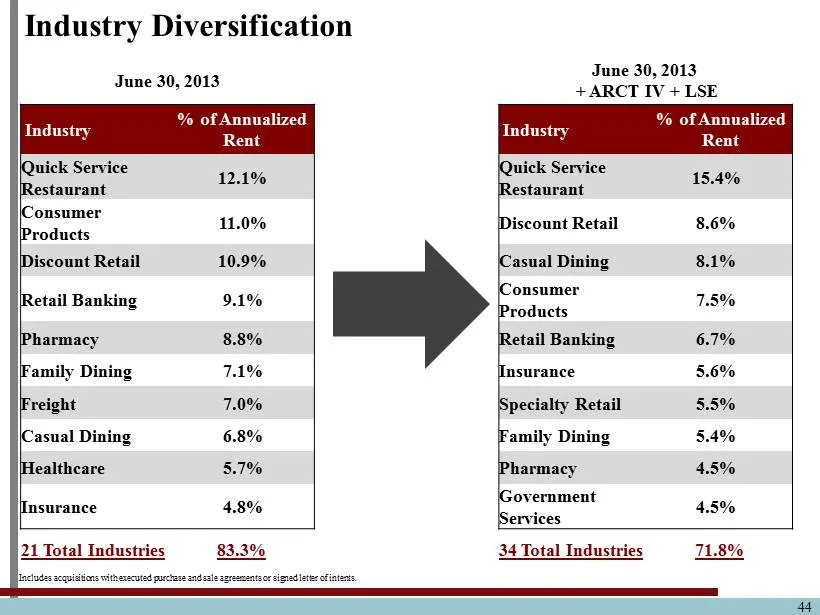
Industry Diversification 44 June 30, 2013 June 30, 2013 + ARCT IV + LSE Industry % of Annualized Rent Industry % of Annualized Rent Quick Service Restaurant 12.1% Quick Service Restaurant 15.4% Consumer Products 11.0% Discount Retail 8.6% Discount Retail 10.9% Casual Dining 8.1% Retail Banking 9.1%
Slide 45: Geographic Diversification March 31, 2013
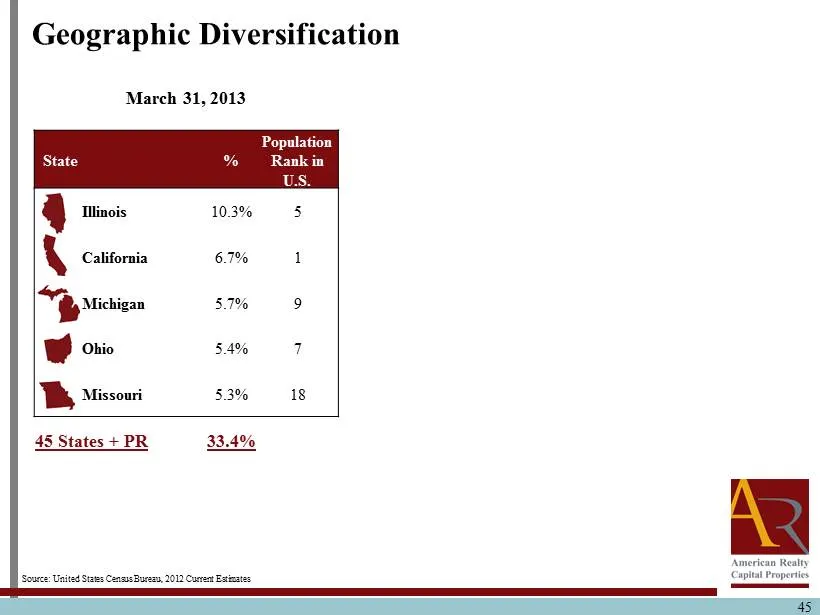
45 Geographic Diversification March 31, 2013 State % Population Rank in U.S. Illinois 10.3% 5 California 6.7% 1 Michigan 5.7% 9 Ohio 5.4% 7 Missouri 5.3% 18 45 States + PR 33.4% Source: United States Census Bureau, 2012 Current Estimates
Slide 46: Geographic Diversification
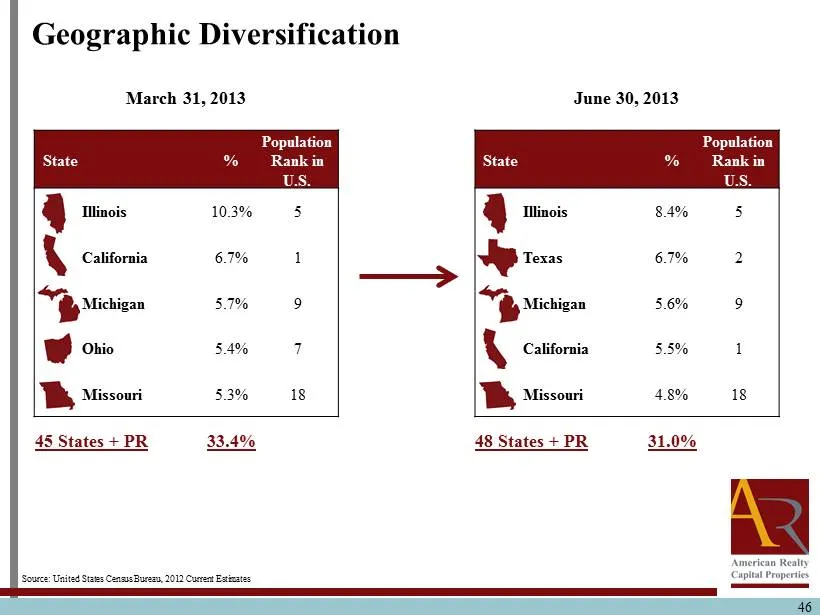
46 Source: United States Census Bureau, 2012 Current Estimates March 31, 2013 State % Population Rank in U.S. Illinois 10.3% 5 California 6.7% 1 Michigan 5.7% 9 Ohio 5.4% 7 Missouri 5.3% 18 45 States + PR 33.4% June 30, 2013 State % Population Rank in U.S. Illinois 8.4% 5 Texas 6.7% 2 Michigan 5.6%
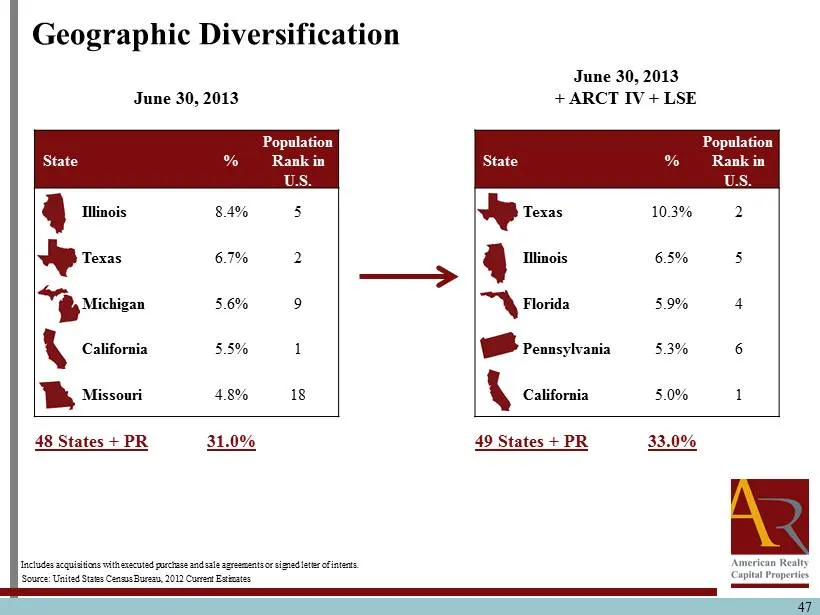
Slide 47: Geographic Diversification Pro Forma
47 Source: United States Census Bureau, 2012 Current Estimates June 30, 2013 + ARCT IV + LSE State % Population Rank in U.S. Texas 10.3% 2 Illinois 6.5% 5 Florida 5.9% 4 Pennsylvania 5.3% 6 California 5.0% 1 49 States + PR 33.0% June 30, 2013 State % Population Rank in U.S. Illinois 8.4% 5 Texas 6.7
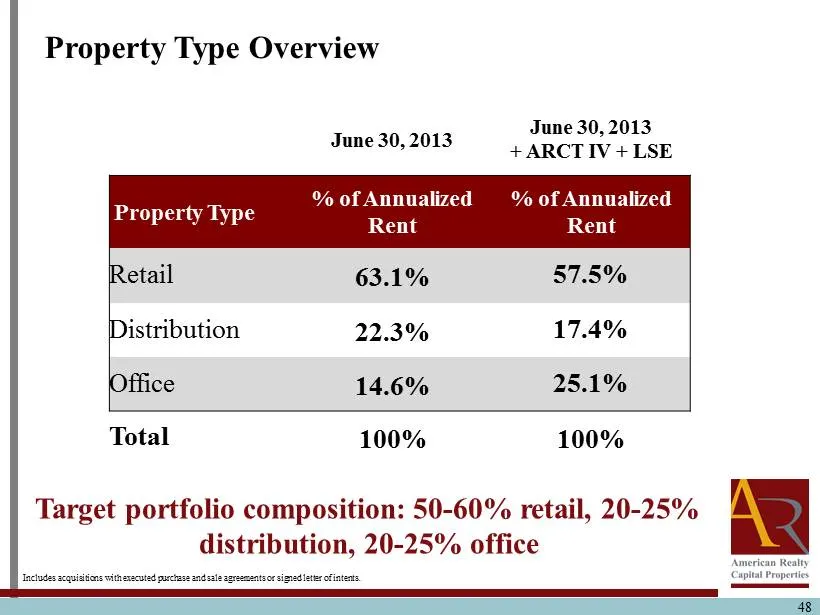
Slide 48: Property Type Overview
48 Property Type Overview June 30, 2013 June 30, 2013 + ARCT IV + LSE Property Type % of Annualized Rent % of Annualized Rent Retail 63.1% 57.5% Distribution 22.3% 17.4% Office 14.6% 25.1% Total 100% 100% Target portfolio composition: 50 - 60% retail, 20 - 25% distribution, 20 - 25 % office Includes
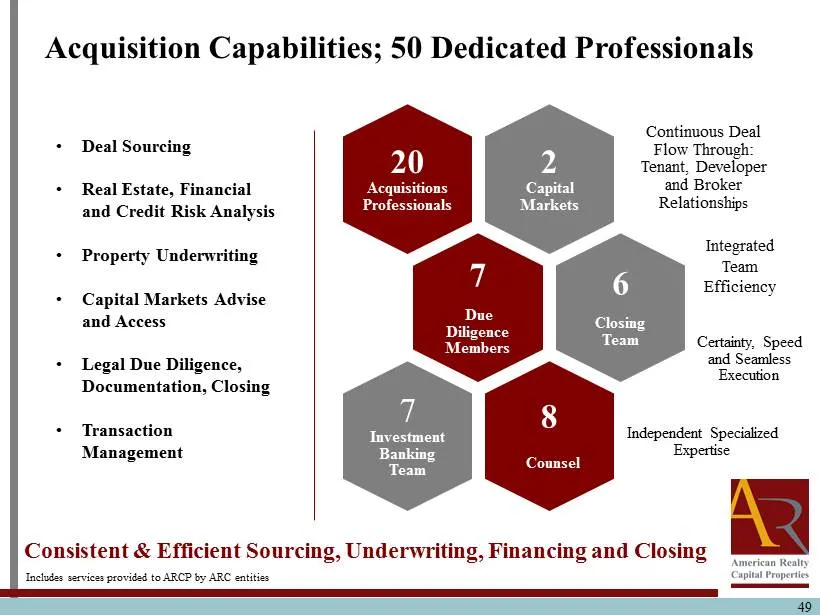
Slide 49: Acquisition Capabilities; Dedicated Professionals
49 Acquisition Capabilities; 50 Dedicated Professionals 2 Capital Markets Continuous Deal Flow Through: Tenant, Developer and Broker Relationsh ips 20 Acquisitions Professionals 7 Due Diligence Members Certainty, Speed and Seamless Execution 6 Closing Team 8 Counsel Independent Specialized Expertise
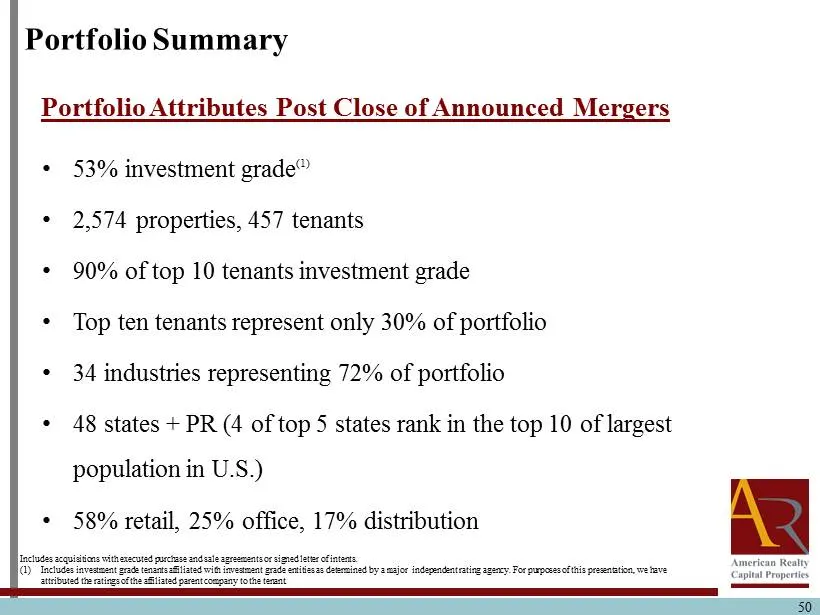
Slide 50: Portfolio Attributes Post Close of Announced Mergers
Portfolio Summary • 53% investment grade (1) • 2,574 properties, 457 tenants • 90% of top 10 tenants investment grade • Top ten tenants represent only 30% of portfolio • 34 industries representing 72% of portfolio • 48 states + PR (4 of top 5 states rank in the top 10 of largest population in U.S.)

Slide 51: Questions & Answers
Questions & Answers 51
Slide 52: Break
Break 52
Slide 53: Underwriting, Due Diligence and Portfolio Diversification
Underwriting, Due Diligence and Portfolio Diversification Brian D. Jones Chief Operating Officer 53
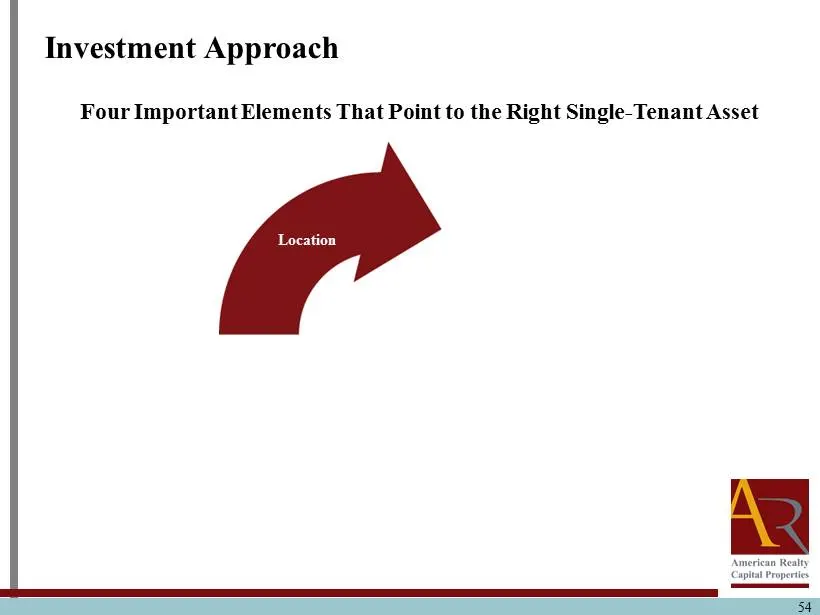
Slide 54: Investment Approach
54 Investment Approach Four Important Elements That Point to the Right Single - Tenant Asset Location
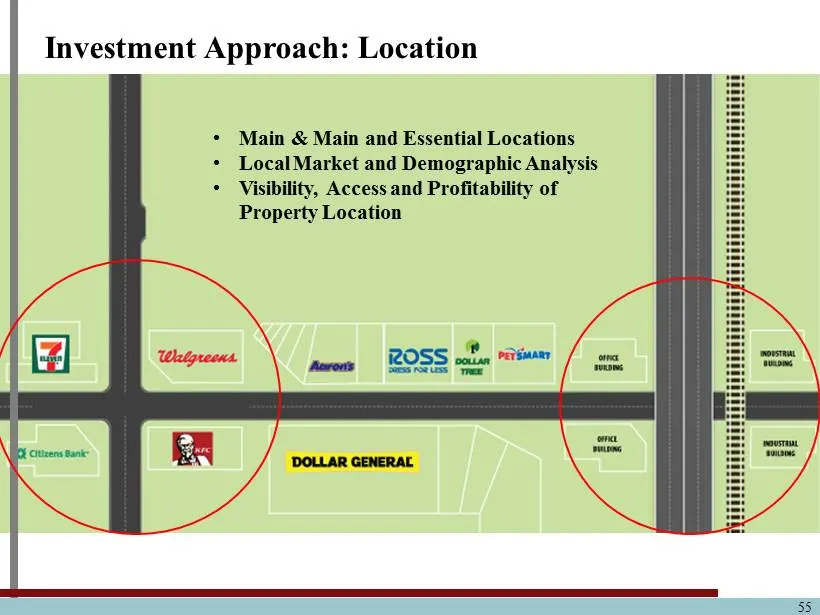
Slide 55: Investment Approach: Location
55 Investment Approach: Location • Main & Main and Essential Locations • Local Market and Demographic Analysis • Visibility, Access and Profitability of Property Location
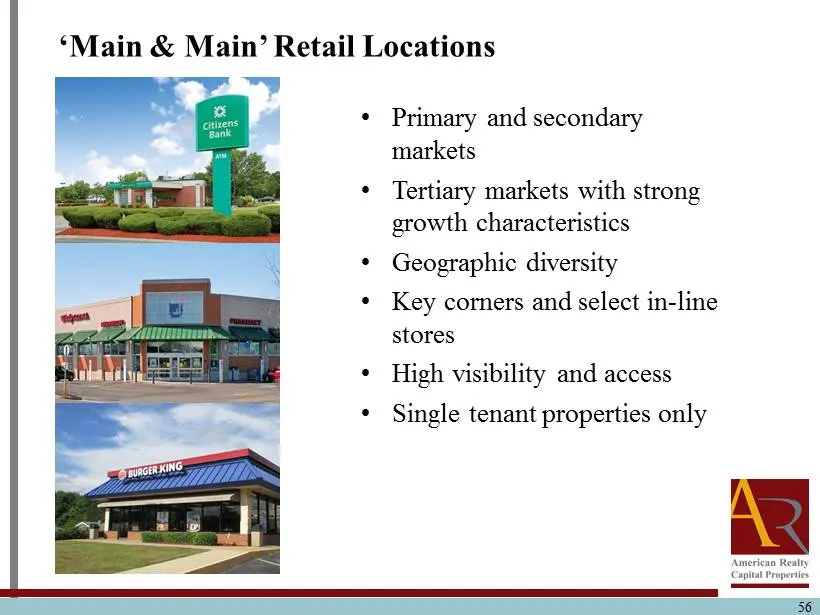
Slide 56: 'Main & Main' Retail Locations
• Primary and s econdary markets • Tertiary markets with strong growth characteristics • Geographic diversity • Key corners and select in - line stores • High visibility and access • Single tenant properties only ‘Main & Main’ Retail Locations 56
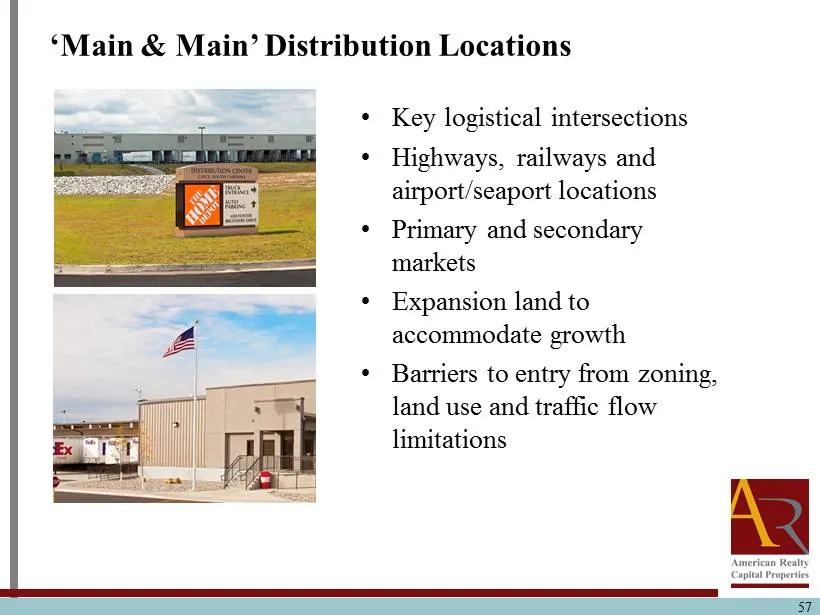
Slide 57: 'Main & Main' Distribution Locations
• Key logistical intersections • Highways, railways and airport /seaport locations • Primary and secondary markets • Expansion land to accommodate growth • Barriers to entry from zoning, land use and traffic flow limitations ‘Main & Main’ Distribution Locations 57
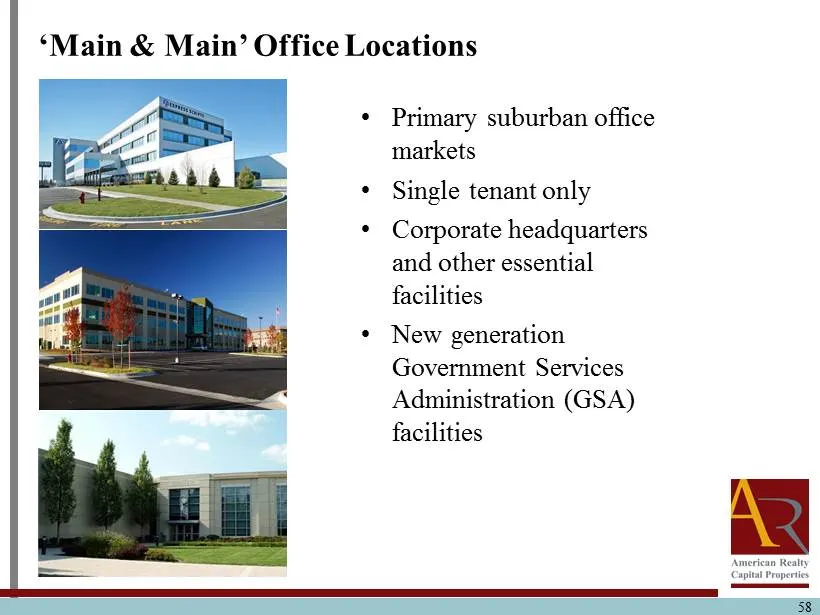
Slide 58: 'Main & Main' Office Locations
• Primary suburban office markets • Single tenant only • Corporate headquarters and other essential facilities • New generation Government Services Administration (GSA) facilities ‘Main & Main’ Office Locations 58
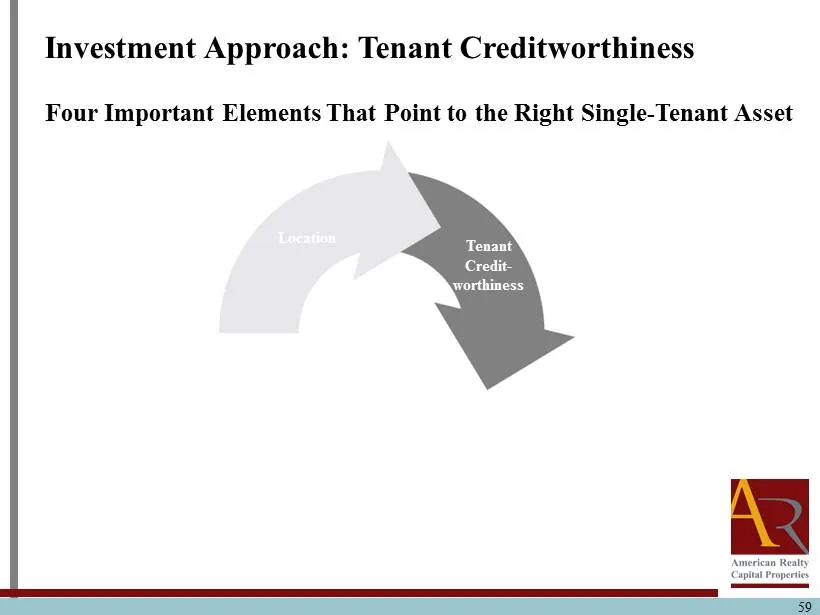
Slide 59: Investment Approach: Tenant Creditworthiness
59 Investment Approach: Tenant Creditworthiness Four Important Elements That Point to the Right Single - Tenant Asset Tenant Credit - worthiness Location
Slide 60: Investment Approach: Tenant Creditworthiness
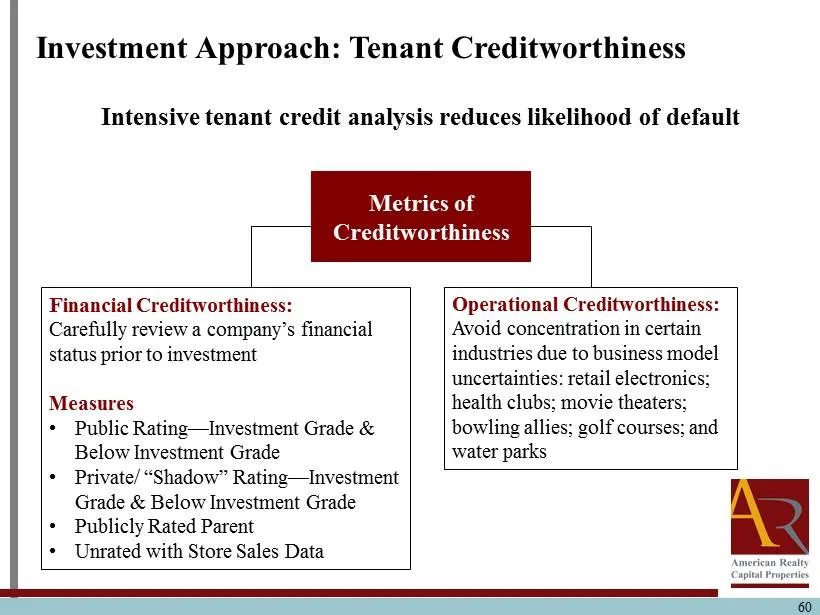
Intensive tenant credit analysis reduces likelihood of default Investment Approach: Tenant Creditworthiness 60 Metrics of Creditworthiness Operational Creditworthiness: Avoid concentration in certain industries due to business model uncertainties: retail electronics; health clubs; movie theaters; bo
Slide 61: Tenant Credit Analysis
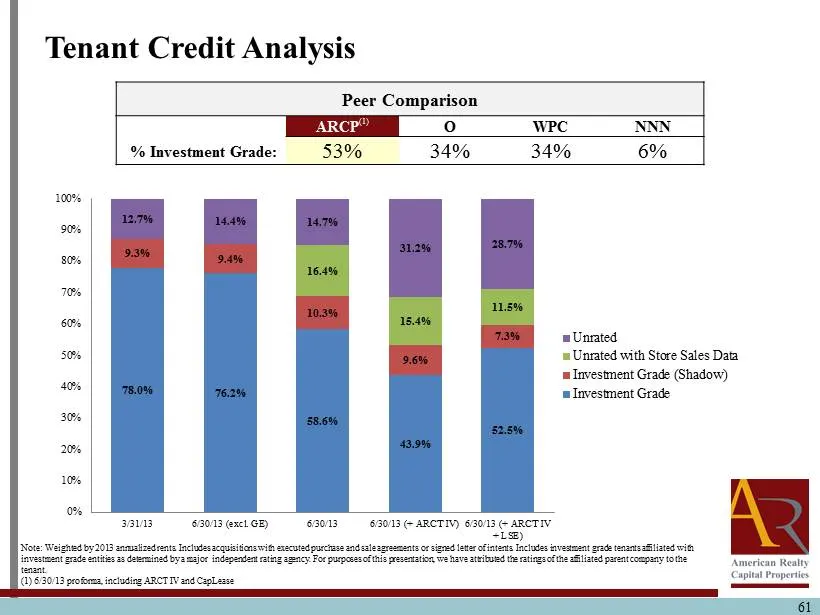
61 Tenant Credit Analysis Note: Weighted by 2013 annualized rents. Includes acquisitions with executed purchase and sale agreements or signed letter of intents. Includes investment grade tenan ts affiliated with investment grade entities as determined by a major independent rating agency. For purpos
Slide 62: Tenant Health Ratio Analysis
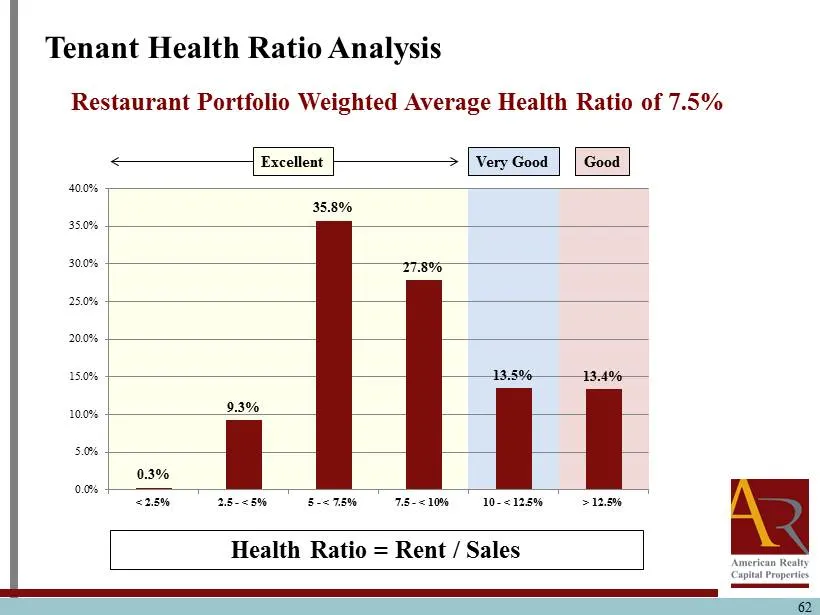
0.3% 9.3% 35.8% 27.8% 13.5% 13.4% 0.0% 5.0% 10.0% 15.0% 20.0% 25.0% 30.0% 35.0% 40.0% < 2.5% 2.5 - < 5% 5 - < 7.5% 7.5 - < 10% 10 - < 12.5% > 12.5% 62 Tenant Health Ratio Analysis Health Ratio = Rent / Sales Restaurant Portfolio W eighted Average Health Ratio of 7.5% Excellent Very Good Good
Slide 63: Investment Approach: Alternative Uses
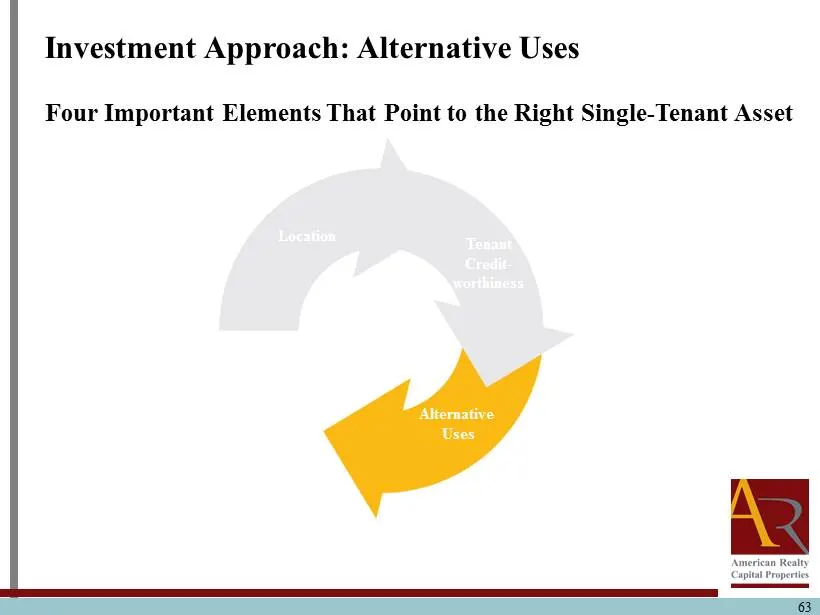
63 Investment Approach: Alternative Uses Four Important Elements That Point to the Right Single - Tenant Asset Tenant Credit - worthiness Location Alternative Uses
Slide 64: Investment Approach: Alternative Uses
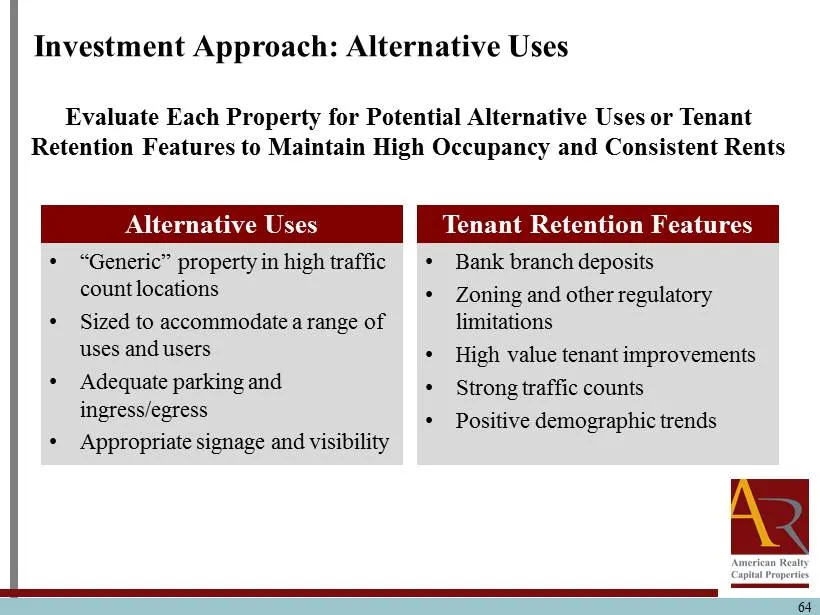
Evaluate Each Property for Potential Alternative Uses or Tenant Retention Features to Maintain High Occupancy and Consistent Rents • “Generic” property in high traffic count locations • Sized to accommodate a range of uses and users • Adequate parking and ingress/egress • Appropriate signage and vis
Slide 65: Investment Approach: Pricing and Terms
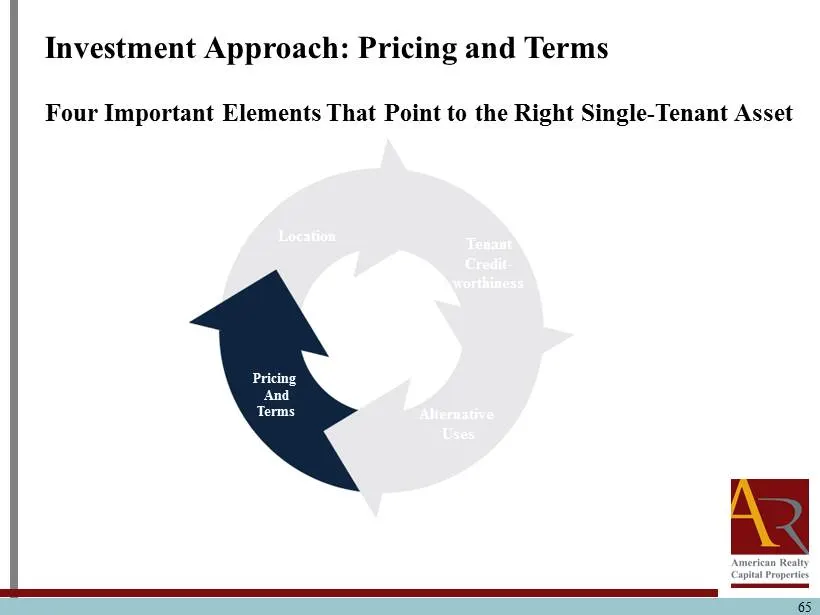
65 Investment Approach: Pricing and Terms Four Important Elements That Point to the Right Single - Tenant Asset Pricing And Terms Alternative Uses Tenant Credit - worthiness Location
Slide 66: 'Vintage' Lease Strategy Overview
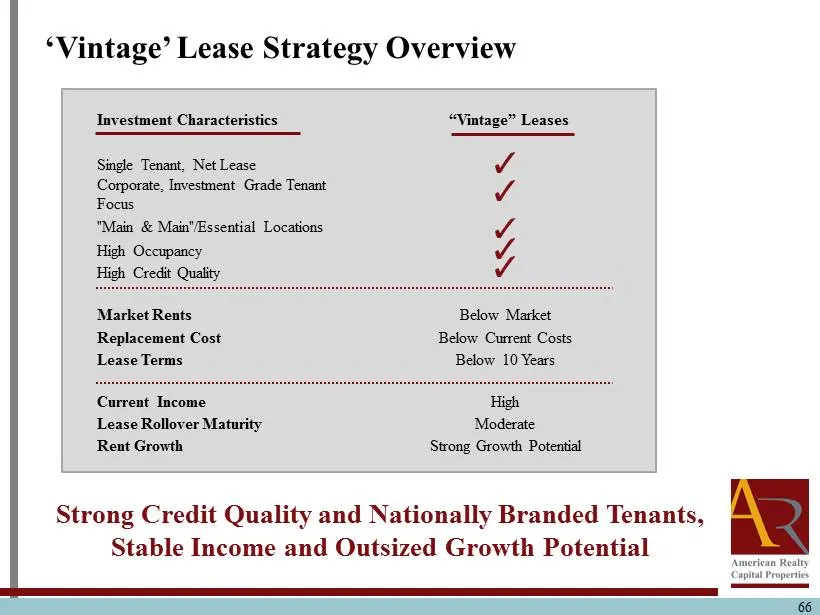
66 Strong Credit Quality and Nationally Branded Tenants, Stable Income and Outsized Growth Potential Single Tenant, Net Lease Corporate, Investment Grade Tenant Focus "Main & Main"/Essential Locations High Occupancy High Credit Quality Market Rents Below Market Replacement Cost Below Current Costs L
Slide 67: Investment Approach: Pricing and Terms
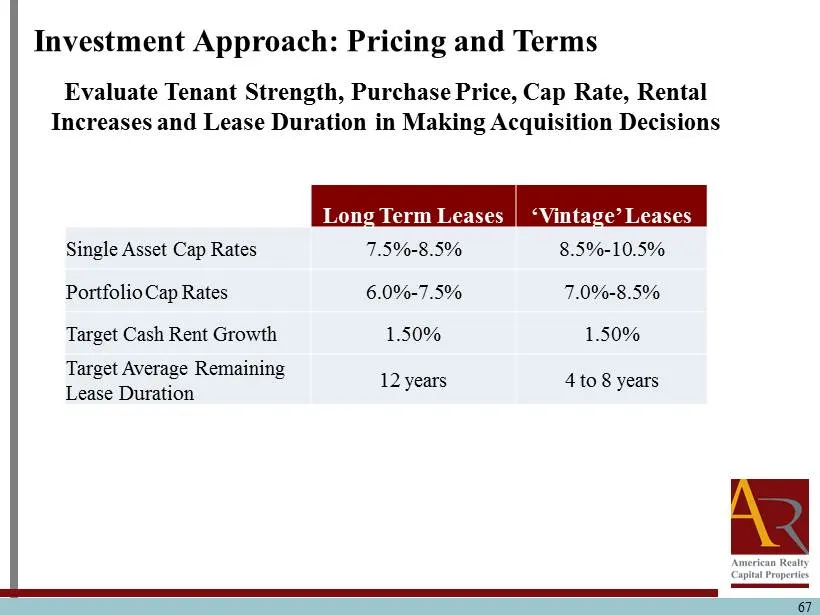
67 Investment Approach: Pricing and Terms Evaluate Tenant Strength, Purchase Price, Cap Rate, Rental Increases and Lease Duration in Making Acquisition Decisions Long Term Leases ‘Vintage’ Leases Single Asset Cap Rates 7.5% - 8.5% 8.5% - 10.5% Portfolio Cap Rates 6.0% - 7.5% 7.0% - 8.5% Target Cash
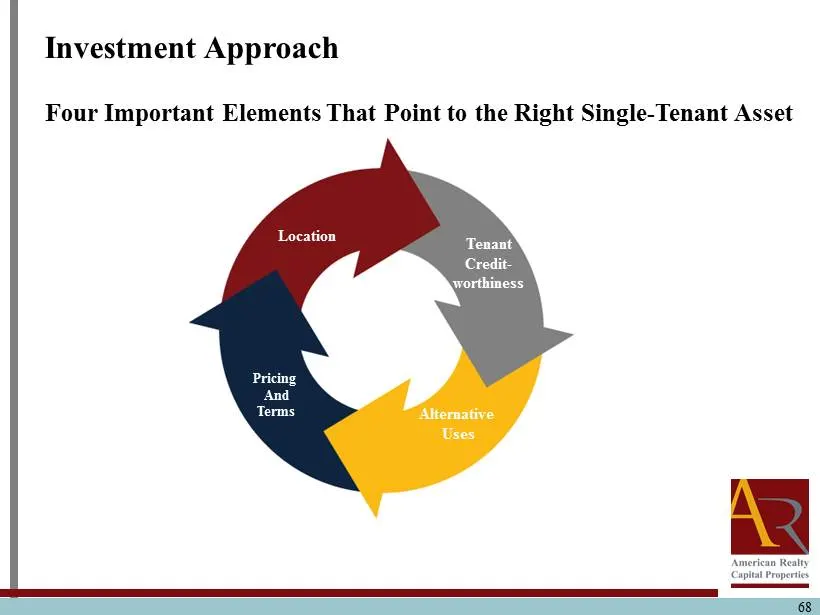
Slide 68: Investment Approach
68 Investment Approach Four Important Elements That Point to the Right Single - Tenant Asset Pricing And Terms Alternative Uses Tenant Credit - worthiness Location
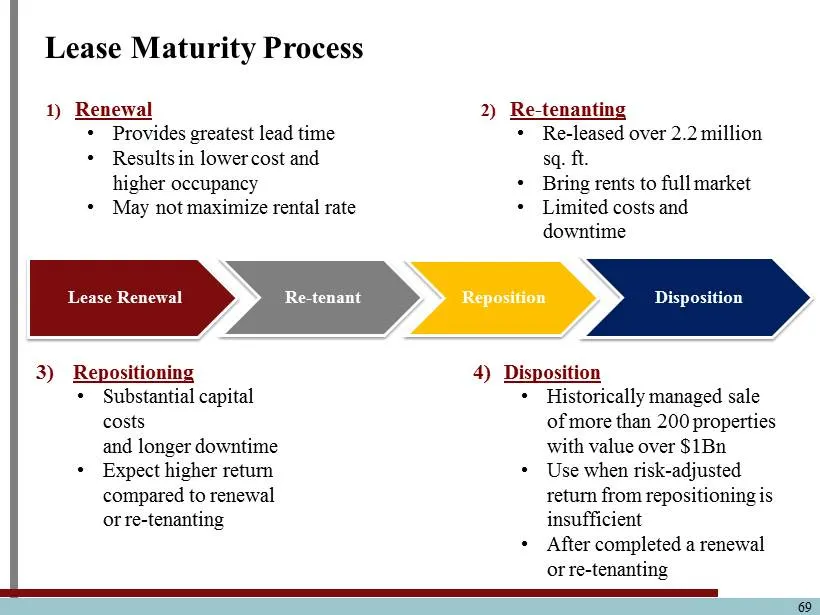
Slide 69: Lease Maturity Process
Lease Maturity Process 69 1) Renewal • Provides greatest lead time • Results in lower cost and higher occupancy • May not maximize rental rate 2) Re - tenanting • Re - leased over 2.2 million sq. ft. • Bring rents to full market • Limited costs and downtime 3) Repositioning • Substantial capital cos
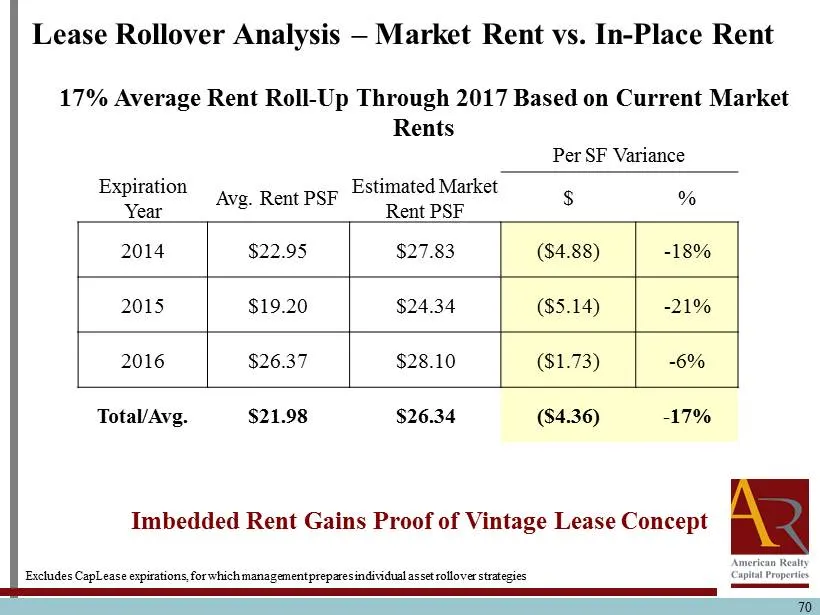
Slide 70: Lease Rollover Analysis – Market vs. In-Place Rent
70 Lease Rollover Analysis – Market Rent vs. In - Place Rent Per SF Variance Expiration Year Avg. Rent PSF Estimated Market Rent PSF $ % 2014 $22.95 $27.83 ($4.88) - 18% 2015 $19.20 $24.34 ($5.14) - 21% 2016 $26.37 $28.10 ($1.73) - 6% Total/Avg. $21.98 $26.34 ($4.36) - 17% Excludes CapLease expirati
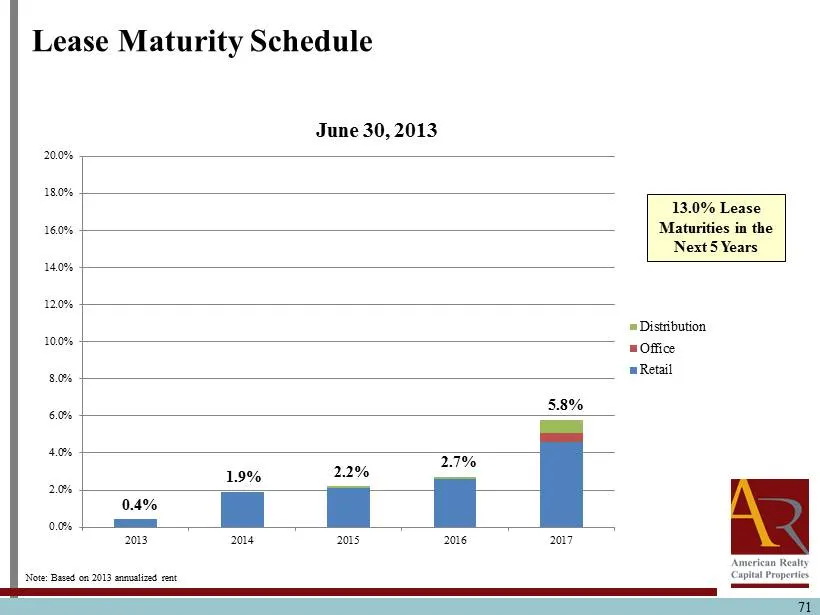
Slide 71: Lease Maturity Schedule
0.0% 2.0% 4.0% 6.0% 8.0% 10.0% 12.0% 14.0% 16.0% 18.0% 20.0% 2013 2014 2015 2016 2017 June 30, 2013 Distribution Office Retail 71 Note: Based on 2013 annualized rent Lease Maturity Schedule 1.9% 2.2% 2.7% 5.8% 0.4% 13.0% Lease Maturities in the Next 5 Years
Slide 72: Lease Maturity Schedule Pro Forma
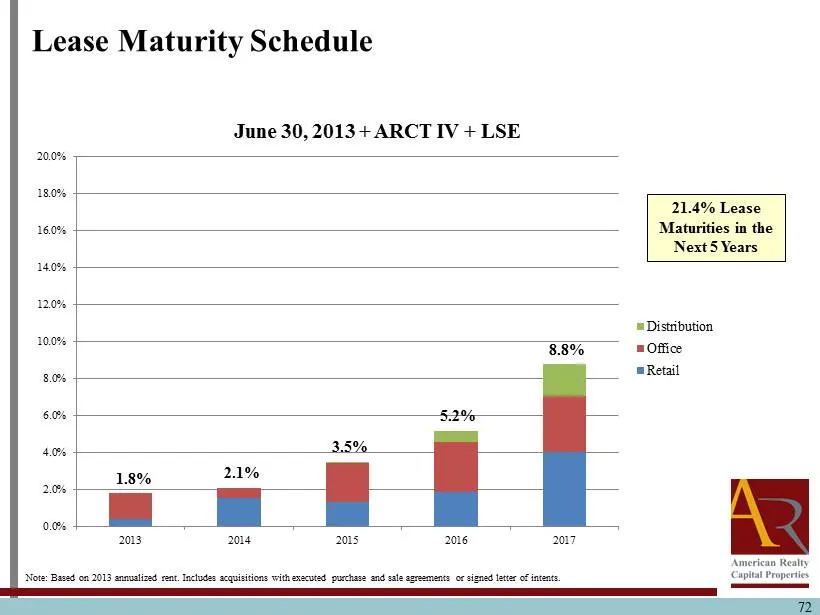
0.0% 2.0% 4.0% 6.0% 8.0% 10.0% 12.0% 14.0% 16.0% 18.0% 20.0% 2013 2014 2015 2016 2017 June 30, 2013 + ARCT IV + LSE Distribution Office Retail 72 Note: Based on 2013 annualized rent . Includes acquisitions with executed purchase and sale agreements or signed letter of intents. Lease Maturity Schedul
Slide 73: Asset and Property Management Team Capabilities
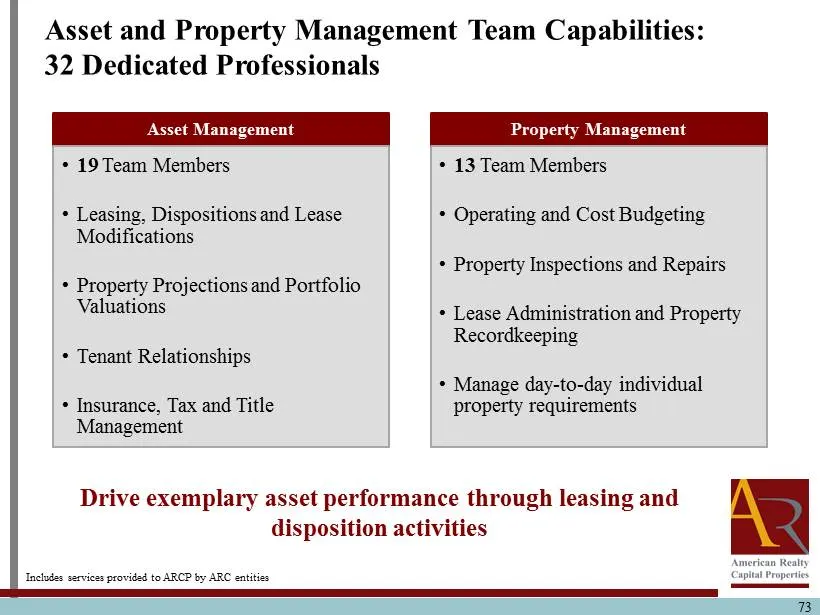
73 Asset and Property Management Team Capabilities: 32 Dedicated Professionals Asset Management • 19 Team Members • Leasing, Dispositions and Lease Modifications • Property Projections and Portfolio Valuations • Tenant Relationships • Insurance, Tax and Title Management Property Management • 13 Team

Slide 74: Questions & Answers
Questions & Answers 74
Slide 75: Shareholder Value Creation: Internalization & Enterprise Building
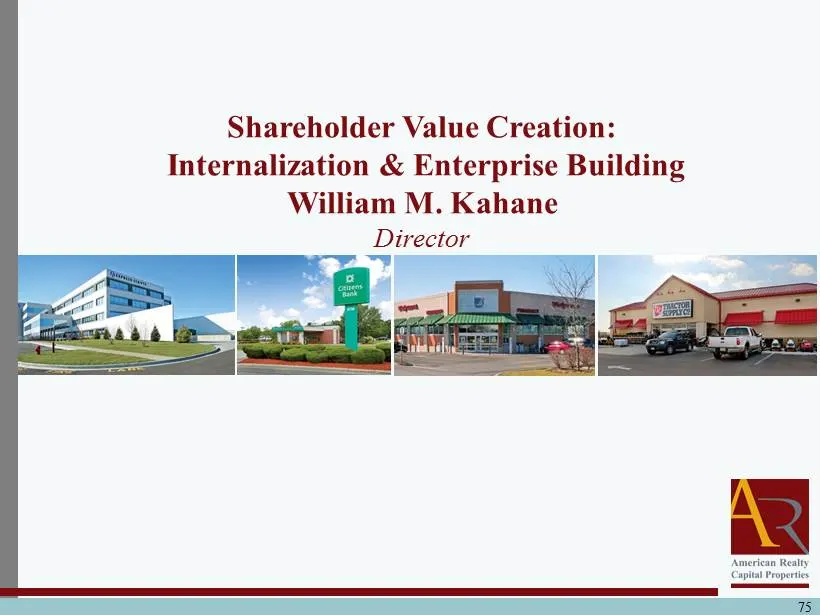
Shareholder Value Creation: Internalization & Enterprise Building William M. Kahane Director 75
Slide 76: ARCP Proven Management Team
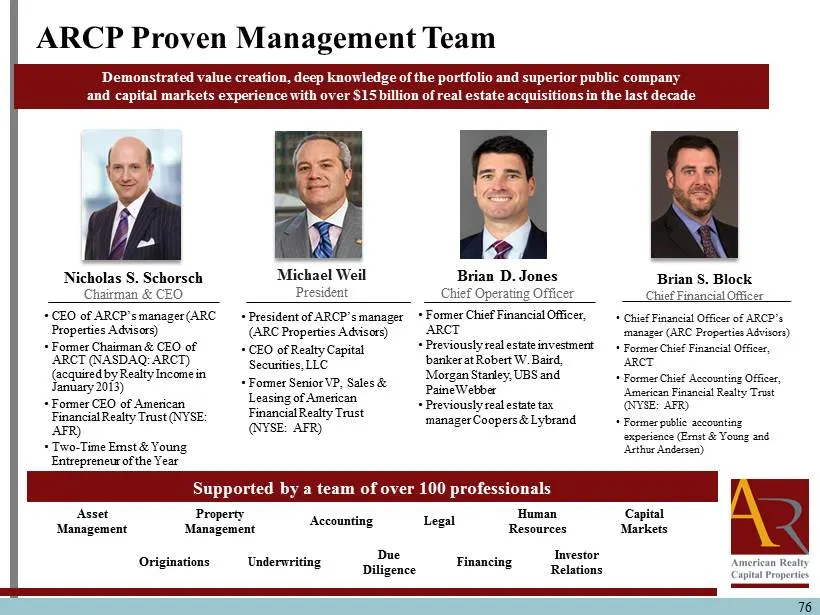
76 ARCP Proven Management Team Demonstrated value creation, deep knowledge of the portfolio and superior public company and capital markets experience with over $15 billion of real estate acquisitions in the last decade Supported by a team of over 100 professionals Asset Management Property Manageme
Slide 77: ARCP Management Structure Benefits
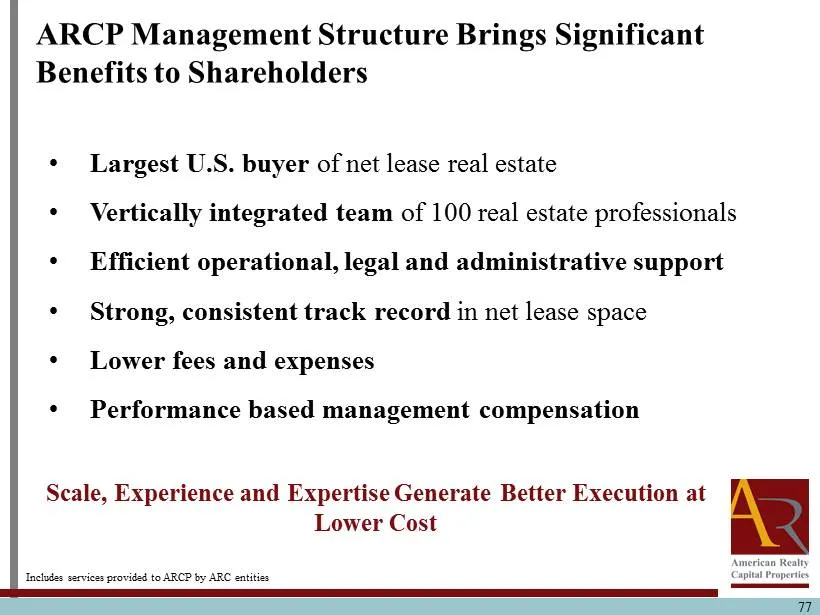
77 • Largest U.S. buyer of net lease real estate • Vertically integrated team of 100 real estate professionals • Efficient operational, legal and administrative support • Strong, consistent track record in net lease space • Lower fees and expenses • Performance based management compensation Scale, E
Slide 78: ARCP G&A Less Than Half of REIT Average
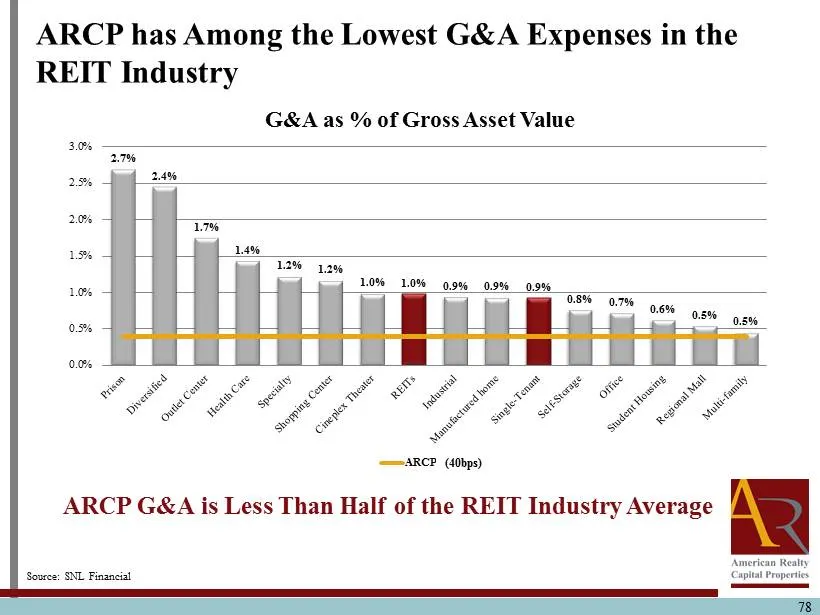
78 ARCP G&A is Less Than Half of the REIT Industry Average Source: SNL Financial 2.7% 2.4% 1.7% 1.4% 1.2% 1.2% 1.0% 1.0% 0.9% 0.9% 0.9% 0.8% 0.7% 0.6% 0.5% 0.5% 0.0% 0.5% 1.0% 1.5% 2.0% 2.5% 3.0% G&A as % of Gross Asset Value ARCP (3bp) (40bps) ARCP has Among the Lowest G&A Expenses in the REIT Indu
Slide 79: Internalization Analysis – Board Considerations
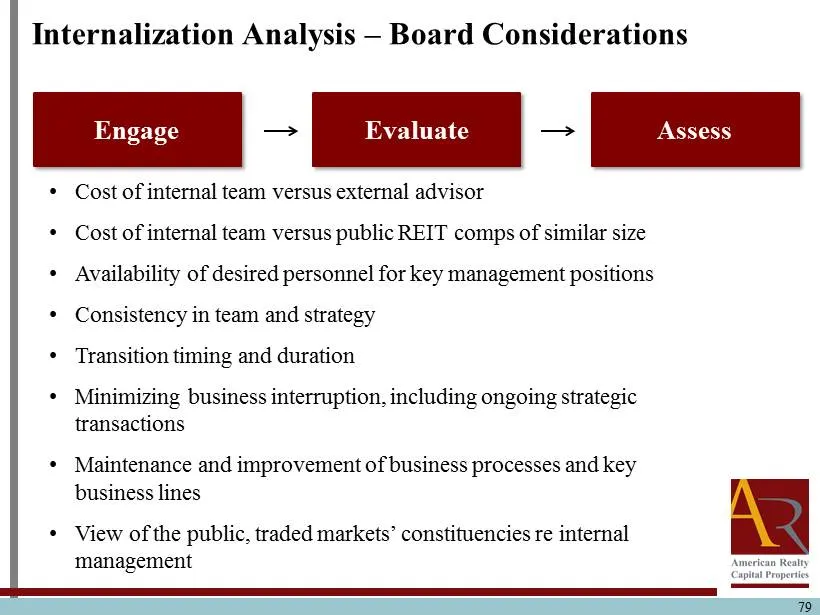
79 Internalization Analysis – Board Considerations • Cost of internal team versus external advisor • Cost of internal team versus public REIT comps of similar size • Availability of desired personnel for key management positions • Consistency in team and strategy • Transition timing and duration • M

Slide 80: Questions & Answers
Questions & Answers 80

Slide 81: Shareholder Value Creation: Opportunities & Initiatives
Shareholder Value Creation: Opportunities & Initiatives Nicholas S. Schorsch Chairman & CEO 81
Slide 82: Internal and External Growth Opportunities
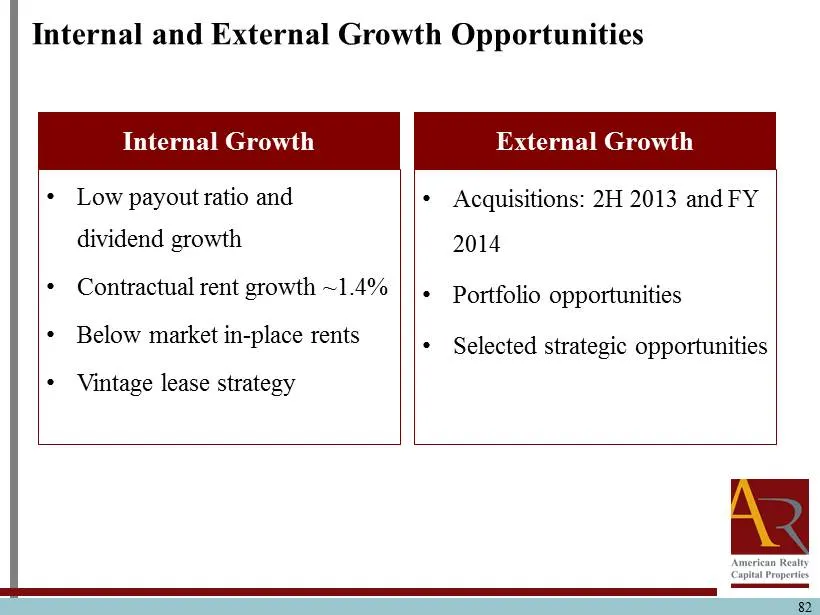
82 Internal and External Growth Opportunities Internal Growth • Low payout ratio and dividend growth • Contractual rent growth ~1.4 % • Below market in - place rents • Vintage lease strategy External Growth • Acquisitions: 2H 2013 and FY 2014 • Portfolio opportunities • Selected strategic opportunit
Slide 83: Balance Sheet – Investment Grade Rating
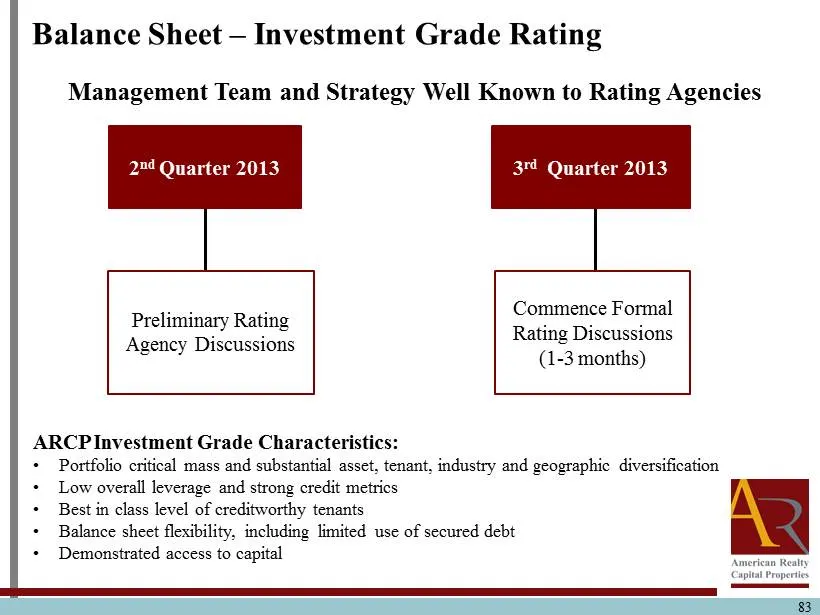
83 Balance Sheet – Investment Grade Rating ARCP Investment Grade Characteristics: • Portfolio critical mass and substantial asset, tenant, industry and geographic diversification • Low overall leverage and strong credit metrics • Best in class level of creditworthy tenants • Balance sheet flexibilit
Slide 84: Transparency and Sell Side Coverage
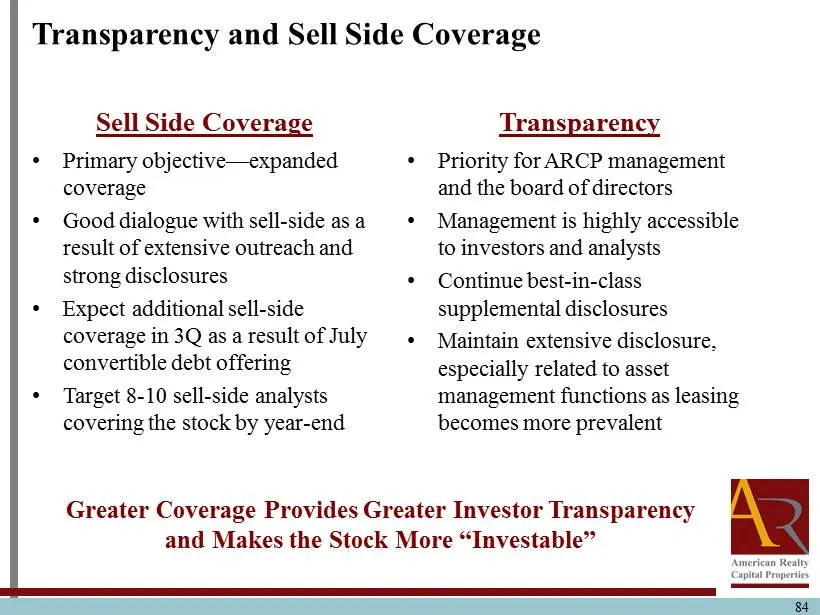
84 Transparency and Sell Side Coverage Sell Side Coverage • Primary objective — expanded coverage • Good dialogue with sell - side as a result of extensive outreach and strong disclosures • Expect additional sell - side coverage in 3Q as a result of July convertible debt offering • Target 8 - 10 sel
Slide 85: ARCP Offers Investors Significant Benefits
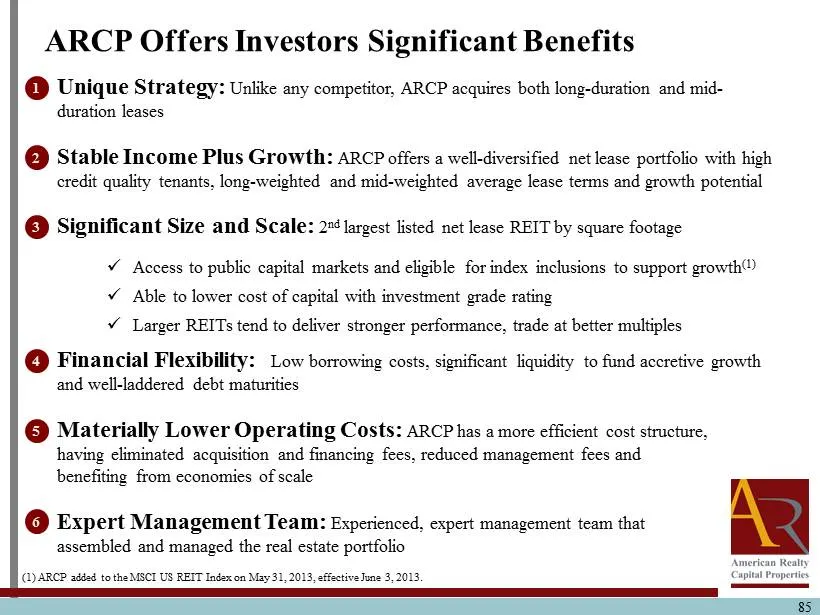
85 ARCP Offers Investors Significant Benefits Unique Strategy: Unlike any competitor, ARCP acquires both long - duration and mid - duration leases Stable Income Plus Growth: ARCP offers a well - diversified net lease portfolio with high credit quality tenants, long - weighted and mid - weighted aver
Slide 86: ARCP Offers a Compelling Value Proposition
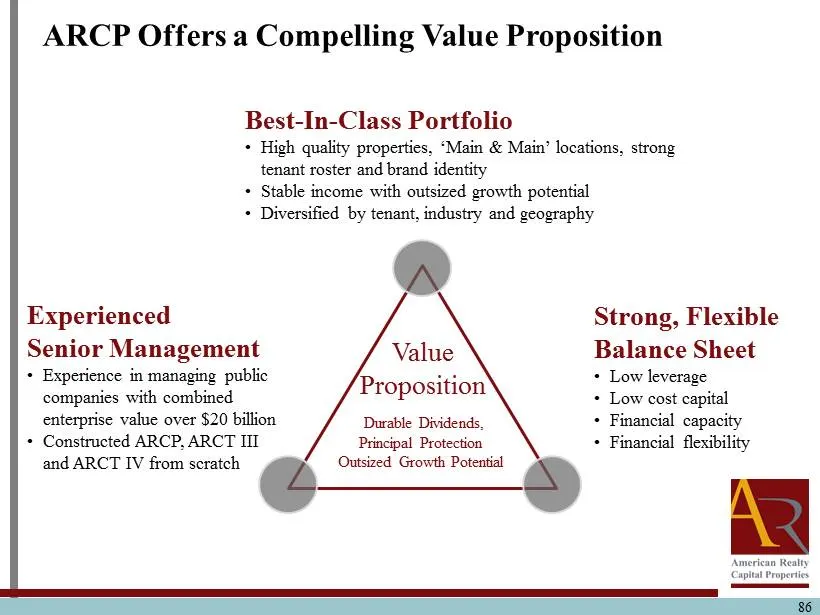
86 Experienced Senior Management • Experience in managing public companies with combined enterprise value over $20 billion • Constructed ARCP, ARCT III and ARCT IV from scratch Best - In - Class Portfolio • High quality properties, ‘Main & Main’ locations, strong tenant roster and brand identity • S

Slide 87: Questions & Answers
Questions & Answers 87
Source: SEC EDGAR · FWP filed Jul 24, 2013
More decks from VEREIT Inc
 Q3 2021 Earnings Presentation35 slides · Oct 29, 2021
 Q2 2021 Earnings Presentation35 slides · Aug 5, 2021
 Q1 2021 Earnings Presentation35 slides · May 6, 2021
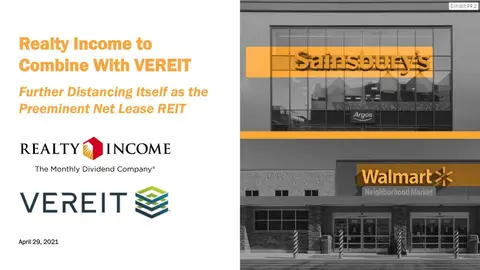 Merger or Acquisition (April 2021)16 slides · Apr 29, 2021
 Q4 2020 Earnings Presentation44 slides · Feb 24, 2021
 Q1 2021 Earnings Presentation39 slides · 2021