Consolidated Communications — Citigroup 2007 Entertainment, Media & Telecom Conference
28 slides from Consolidated Communications's conference presentation, Jan 10, 2007
Slide 1: Citigroup 2007 Entertainment, Media & Telecom Conference
O Consolidated Steve Childers — Chief Financial Officer Citigroup 2007 Entertainment, Media & Telecom Conference January 10, 2007
Slide 2: Regulation G and Safe Harbor
Regulation G and Safe Harbor Regulation G This presentation contains disclosures regarding aur “adjusted EBIDTA", "cash available ta pay dividends" and “total net debt to last 12-month Adjusted EBITDA ratio" (which we refer to as leverage), al of which are non-GAAP financial measures as derined by R
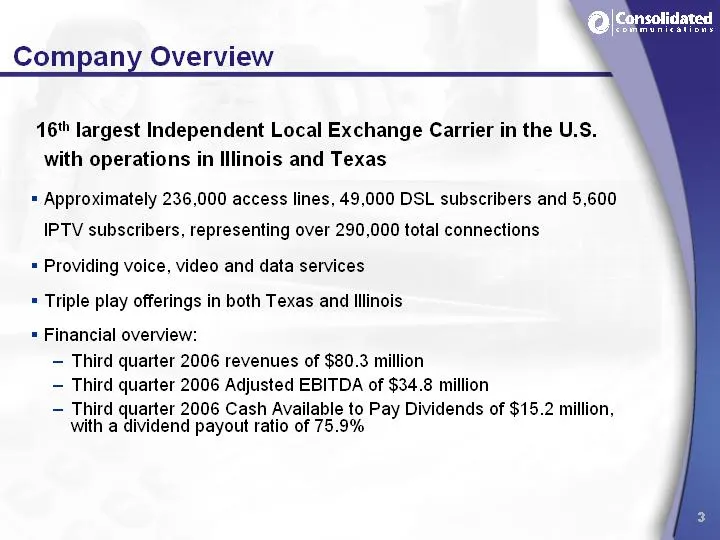
Slide 3: Company Overview
Company Overview \ 16" largest Independent Local Exchange Carrier in the U.S. with operations in Illinois and Texas = Approximately 236,000 access lines, 49,000 DSL subscribers and 5,600 IPTV subscribers, representing over 290,000 total connections = Providing voice, video and data services = Triple
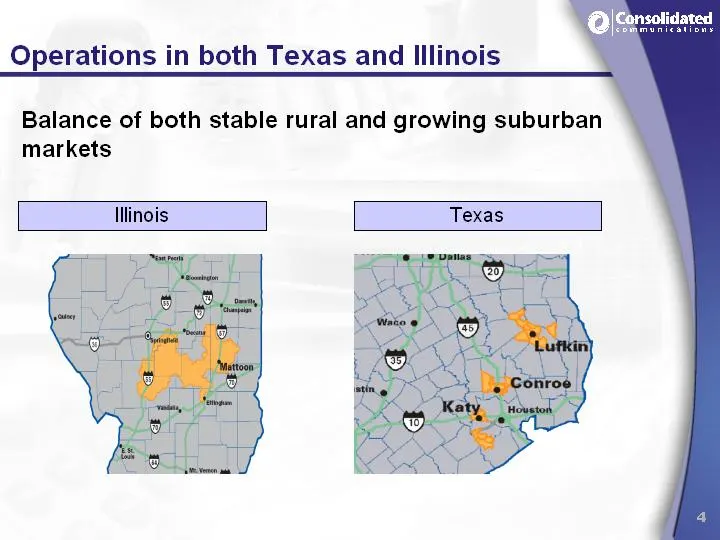
Slide 4: Illinois
Illinois Balance of both stable rural and growing suburban markets Operations in both Texas and Illinois
Slide 5: Managing Competition
Managing Competition CNSL’s strategy has been to minimize competition from cable and wireless companies by providing “sticky” bundled service — offerings and exemplary customer service ' = Marketing, customer service and technology initiatives have been designed to minimize competitive traction = Th
Slide 6: Favorable Regulatory Environment
Favorable Regulatory Environment Stable to improving regulatory environment = Rate of return regulated at the federal level in both states = Elected incentive regulation at the state level in Texas and rate of return in Illinois = Strong working relationships with the FCC and both state commissions
Slide 7: Experienced & Operations-Focused Management Team
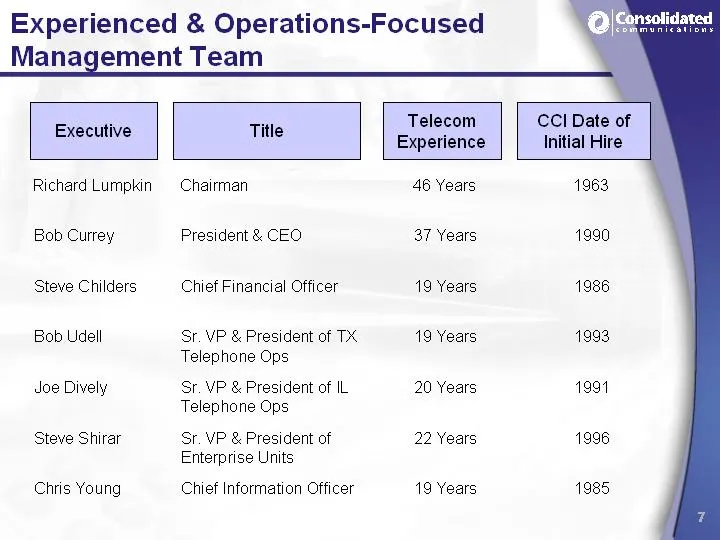
Experienced & Operations-Focused Management Team Executive Title Reecom Se Date oy Experience Initial Hire Richard Lumpkin = Chairman 46 Years 1963 Bob Currey President & CEO. 37 Years 1990 Steve Childers Chief Financial Officer 19 Years 1986 Bob Udell Sr. VP & President of TX 19 Years 1993 Telephon
Slide 8: Executing on our Strategy
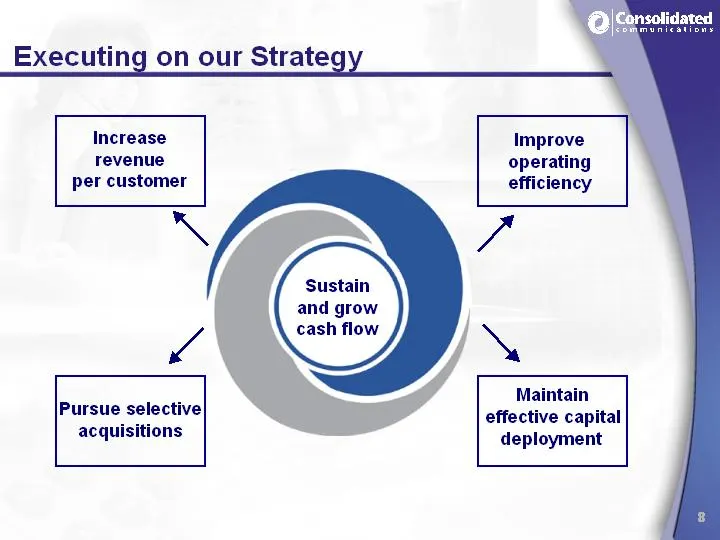
Executing on our Strate Increase revenue per customer \ Sustain and grow cash flow ‘4 Pursue selective acquisitions Improve operating efficiency ra “ Maintain effective capital deployment
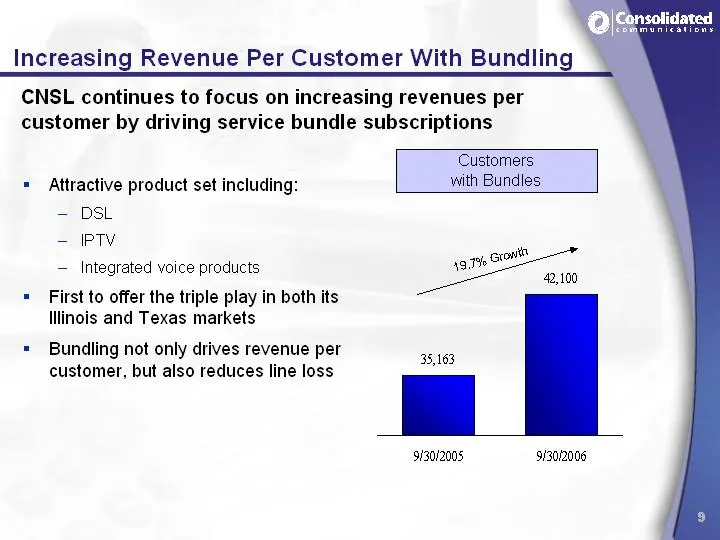
Slide 9: Increasing Revenue Per Customer With Bundling
Increasing Revenue Per Customer With Bundling XY CNSL continues to focus on increasing revenues per customer by driving service bundle subscriptions Customers = Attractive product set including: with Bundles - DSL - IPTV — Integrated voice products yg.tte growth 100 = First to offer the triple play
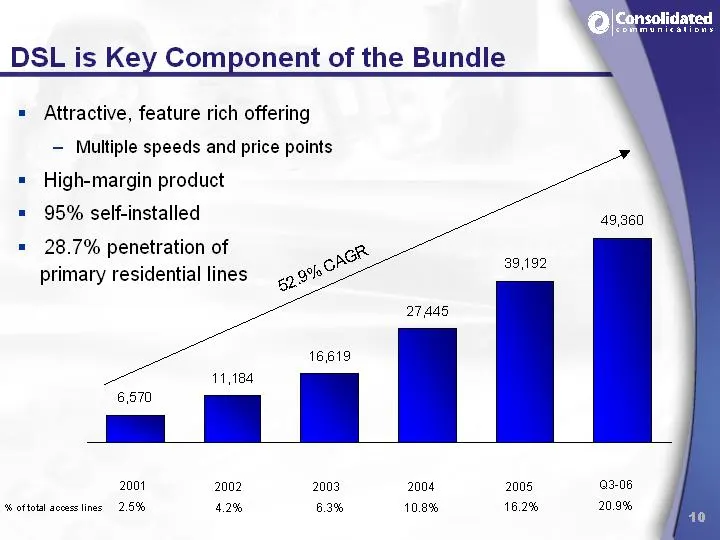
Slide 10: DSL is Key Component of the Bundle
DSL is Key Component of the Bundle Attractive, feature rich offering — Multiple speeds and price points High-margin product 95% self-installed 28.7% penetration of primary residential lines 2001 2002 2003 2004 2008 % oftotal access ines 2.5% 4.2% 6.3% 10.8% 16.2%
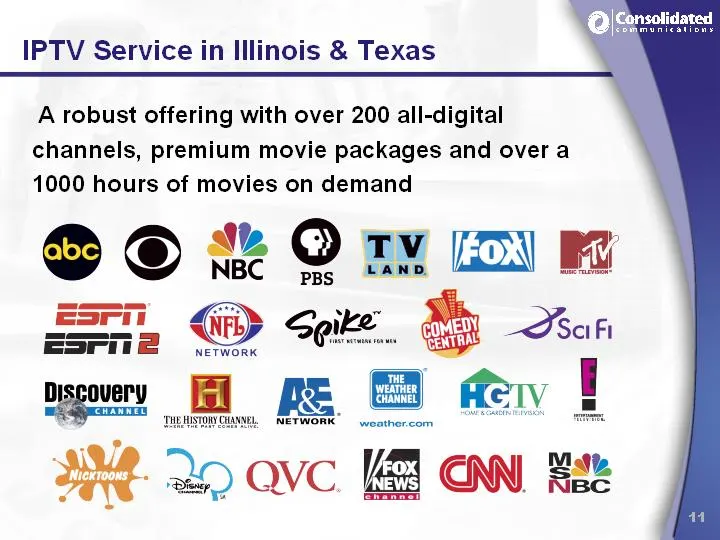
Slide 11: IPTV Service in Illinois & Texas
IPTV Service in Illinois & Texas A robust offering with over 200 all-digital channels, premium movie packages and over a 1000 hours of movies on demand aa Gi Seike.. + = a ol neg mM Re & fey ! THEAISTO > 44
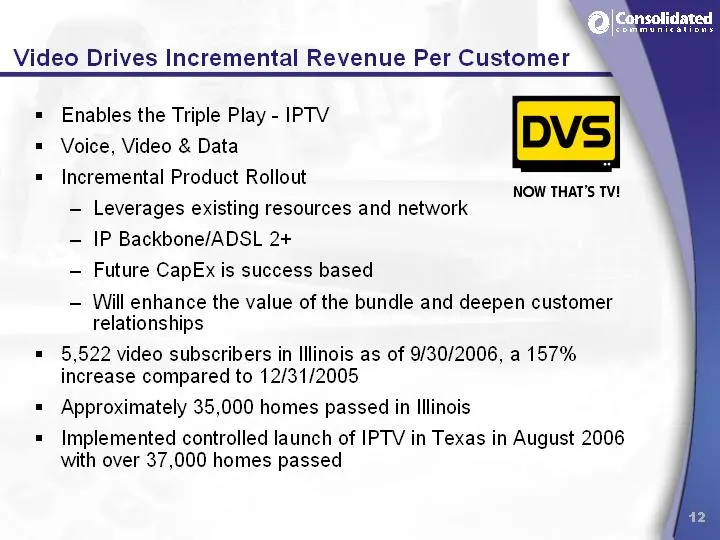
Slide 12: Video Drives Incremental Revenue Per Customer
Video Drives Incremental Revenue Per Customer = Enables the Triple Play - IPTV = Voice, Video & Data = Incremental Product Rollout a NOW THAT'S TV! — Leverages existing resources and network — IP Backbone/ADSL 2+ — Future CapEx is success based — Will enhance the value of the bundle and deepen custo
Slide 13: Stable Customer Base
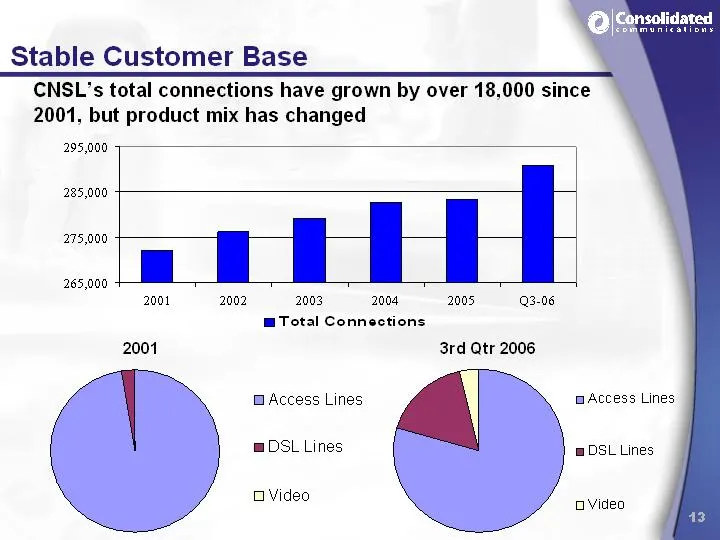
Stable Customer Base CNSL’s total connections have grown by over 18,000 since 2001, but product mix has changed 295,000 285,000 275,000 265,000 2001 2001 2002 2003 2004 mTotal Connections BAccess Lines m DSL Lines O Video 2005 3.06 3rd Qtr 2006 Access Lines @ DSL Lines aVideo
Slide 14: Employees
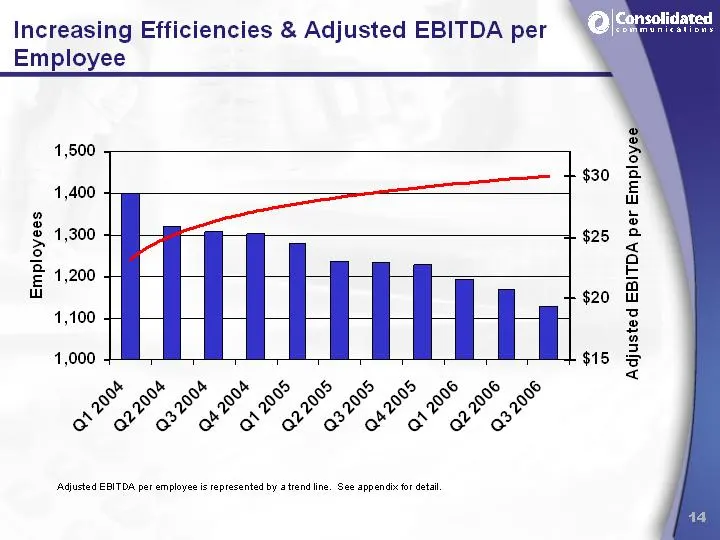
Employees Adjusted EBITDA per Employee ‘Adjusted EBITDA per employee is represented by attendline. See appendix tor detal
Slide 15: Effective Capital Deployment
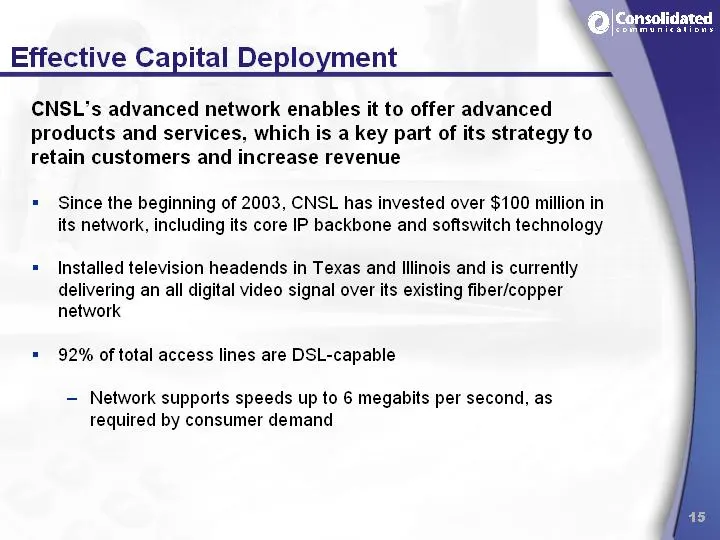
Effective Capital Deployment \ CNSL’s advanced network enables it to offer advanced products and services, which is a key part of its strategy to retain customers and increase revenue = Since the beginning of 2003, CNSL has invested over $100 million in its network, including its core IP backbone an
Slide 16: Acquisition Philosophy
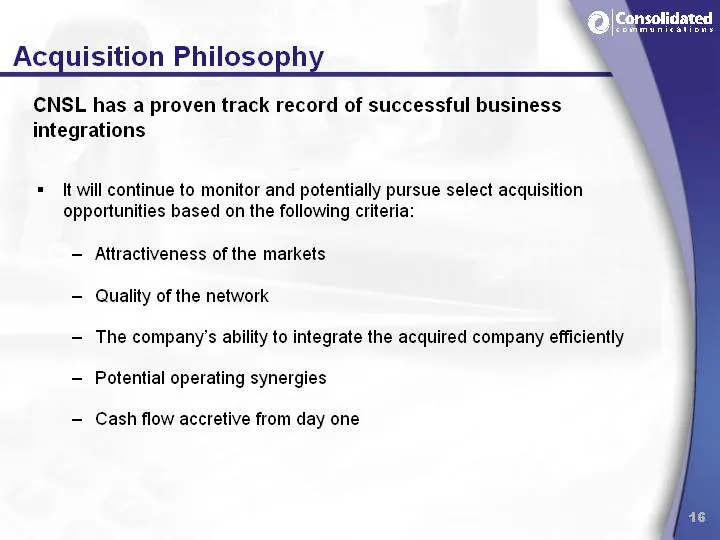
ta] [Consolidated Acquisition Philosop CNSL has a proven track record of successful business integrations = It will continue to monitor and potentially pursue select acquisition opportunities based on the following criteria: — Attractiveness of the markets Quality of the network - The company’s abil
Slide 17: Financial summary
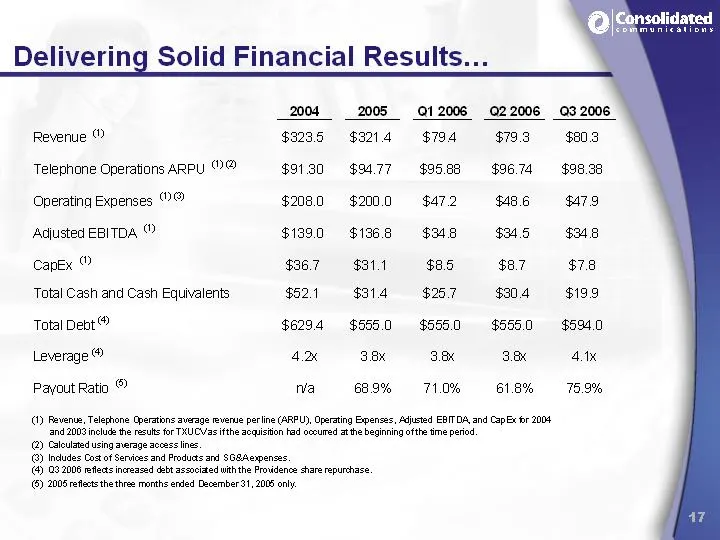
2004 _ _2005_ 012006 022006 032006 Revenue © ganas $94 $794 $79.80 SNS Telephone Operations ARPU (0) $9130 $94.77 $95.88 $96.74 $98.98 Operating Expenses $2080 $2000 $472 $486 $479 Agjusted EBITDA © $1390 $1988 8 86$u8 $45 SMB Capex © $36.7 9 $31.1 $8.5 $87 $78 Total Cash and Cash Equivalents $521 $
Slide 18: Investment Highlights
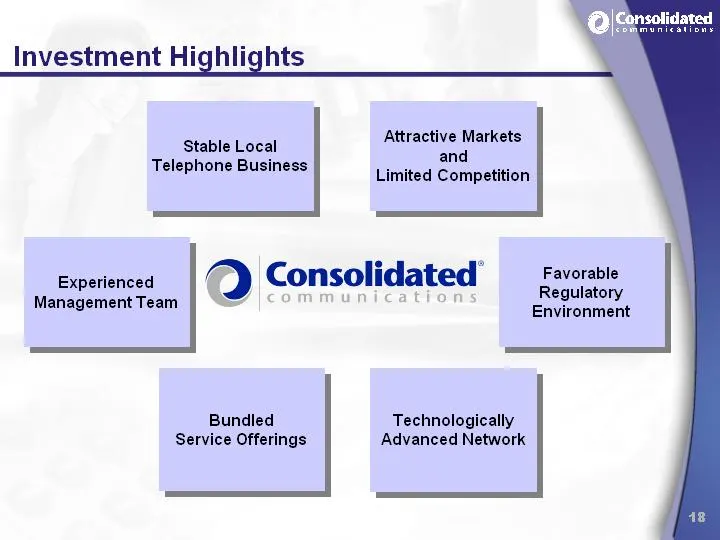
O)eersolidated Investment Highlights Attractive Markets and Limited Competition Stable Local Telephone Business Experienced Q Consolidated’ — Favorable Management Team communications | Regulatory Environment Bundled Technologically Service Offerings Advanced Network 48

Slide 19: Appendix
Appendix
Slide 20: GAAP Reconciliation
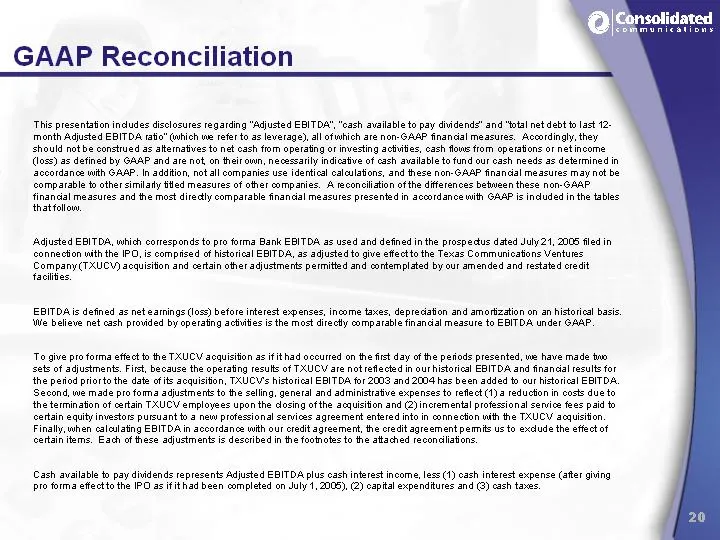
GAAP Reconciliation This presentation includes disclosures regarding "Adjusted EBITDA’, "cash available to pay didends” and “wal net debt to last 12 month Adjusted EBITDA ratio" (which we refer to as leverage, all ofwhich are non-GAAP Snandal measures. Accordingly, they should net be constiued as at
Slide 21: GAAP Reconciliation
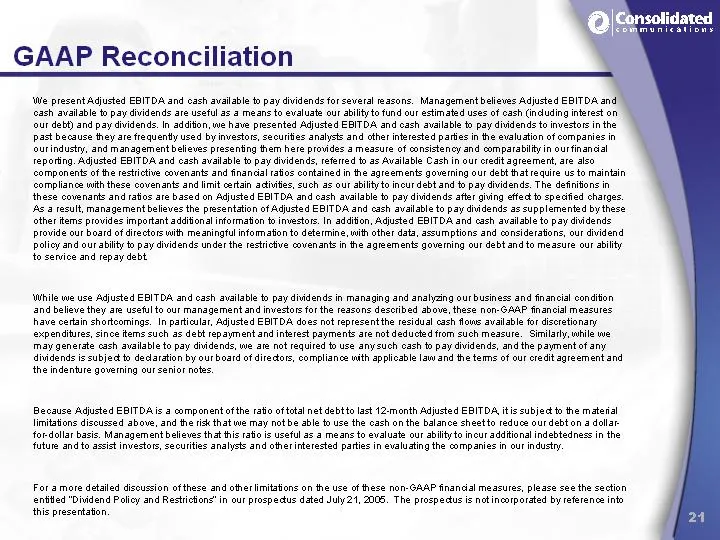
GAAP Reconciliation ‘Wea present Adjusted EBITDA and oath avaliable te pay dividends for several wazons. Management believes Adjusted EBITDA and cash avaliable te pay dividends ae useful as a means to evaluate cut ably to fund our estimated uses of cash (incuding interest on Cur debt) and pay divide
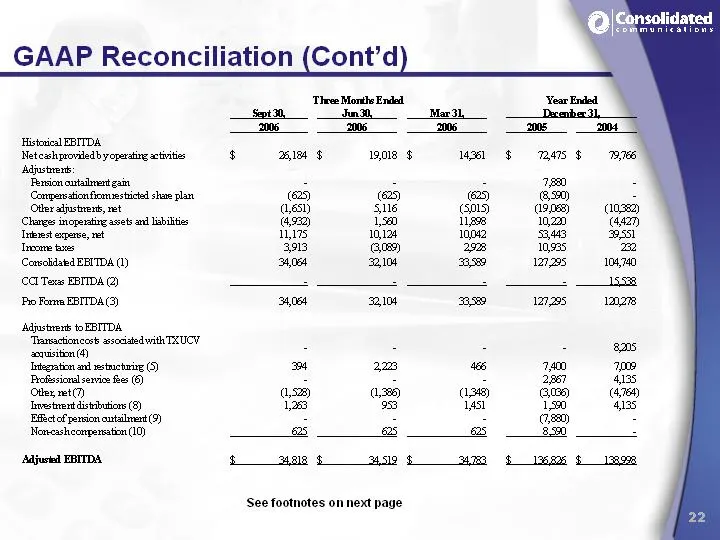
Slide 22: Historical EBITDA
Hist EBITDA Neteashproviled’ y parting setts Adjutant: Panvicn onan gain Compensation iowesbictd shane plan Otler austen, net (Changes inoperaing assets al Lnbiltis Ines expanse, net Tene te CConecidated EBITDA (1) (CCI Texas EBITDA @) Pro Fanta EBITDA(3) Adjusteen toEBITDA ‘Trnacticncorts seociated
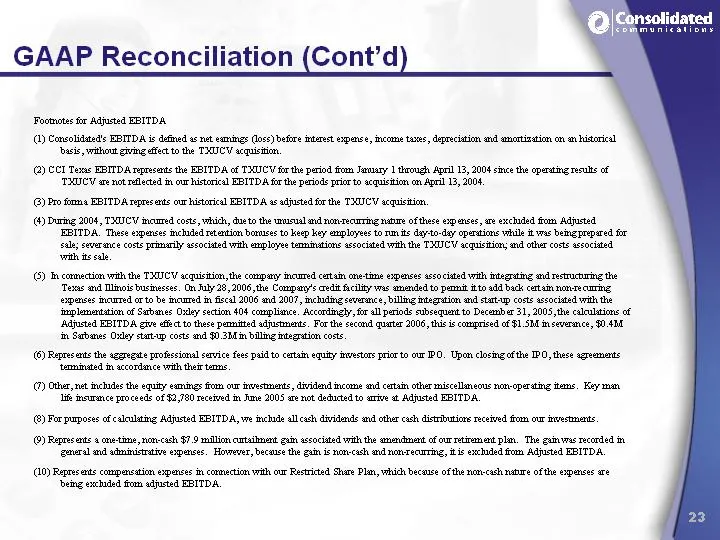
Slide 23: GAAP Reconciliation (Cont'd)
GAAP Reconciliation (Cont'd) Foomots for Adjusted EBITDA (0) Concolidate's EBITDA is dened taut eimings Qoee)bafre beet expen, cme Done, dapeciion and amerinton on toc ‘basis, without ging ecto the THCY acquisition (@) CCL Tens EBITDA represents the EBITDA af TXIUCY fer the period fom Jamary 1 ough
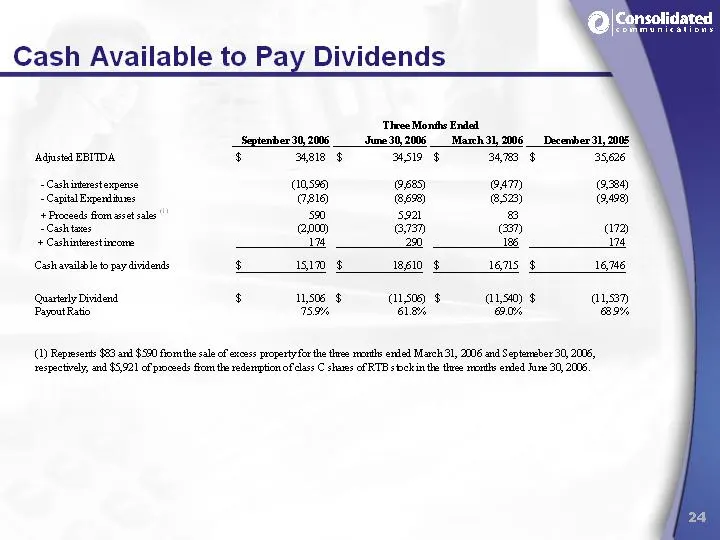
Slide 24: Cash Available to Pay Dividends
Olcorset idated Cash Available to Pay Dividends ‘Three Monte Ended Septenber30,2006 June 30,2005 __March31, 2006 __Decenber‘31, 2005 Adjusted EBITDA 8 age $ aS § 3478 § 35626 -Cashinmestexpense ags95) G85) eam O39 + Capital Eipendianes 7816) G98) G52) (9498) ++ Procesds fiom set ale | 590 sai B = Ca
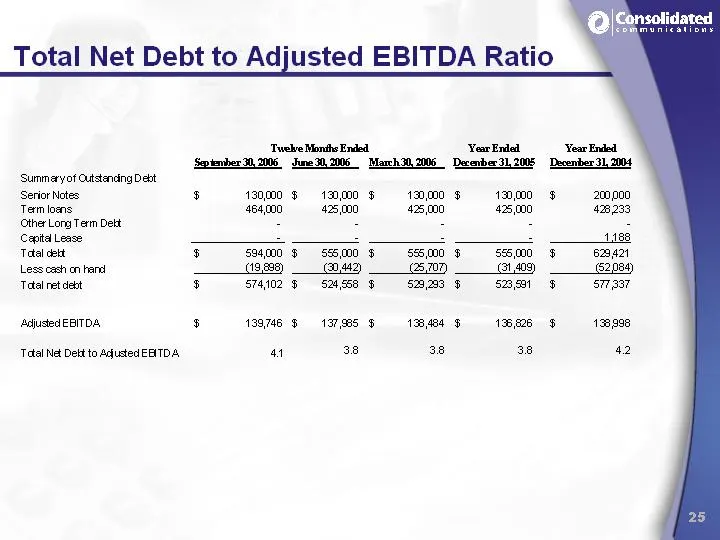
Slide 25: Total Net Debt to Adjusted EBITDA Ratio
Olcorset idated Total Net Debt to Adjusted EBITDA Ratio Twele Manfie Ended ‘Year Ended ‘Year Ended September, 2006 June 30,2005 Maxch3,2005_ Decenber31,2005 Decenber 31,2004 ‘Summeryof Cutstancing Debt Serior Notes 8 1soq0 $ 1000 $ = amo $= 1,000 § «=e OD Term lens 4e4o00 «425.000 425,000 45000 4782
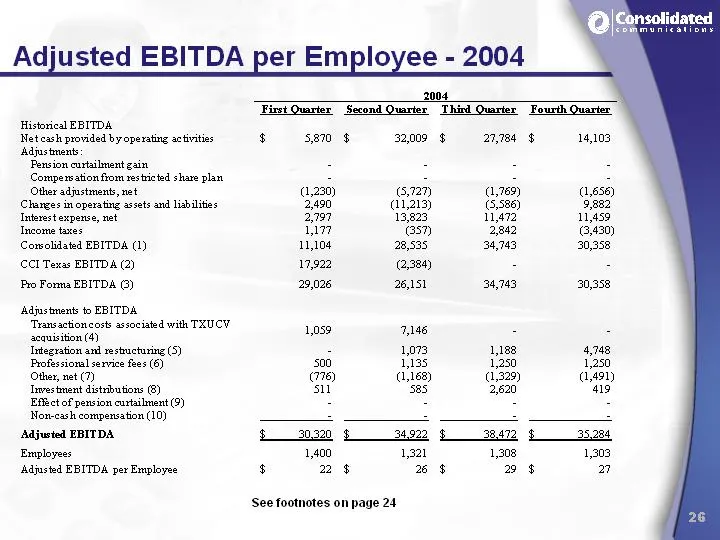
Slide 26: Adjusted EBITDA per Employee - 2004
Adjusted EBITDA per Employee - 2004 2004 Fini Queries Second Ovaries, Thin Quarter Fourth Quarter Historical EBITDA Net cash provided by operating activities Adjustments Pension curtailment gain CCompers ation fiom restricted shane plan Other adjustments, net (Changes in operating assets and Lisilit
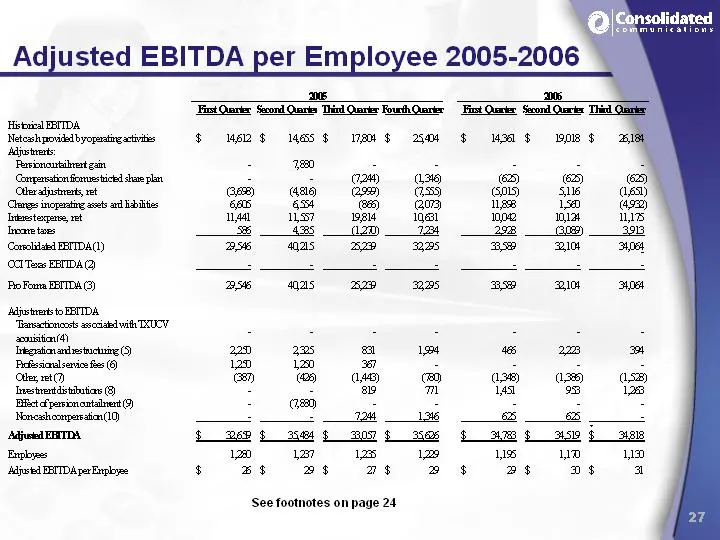
Slide 27: Adjusted EBITDA per Employee 2005-2006
Adjusted EBITDA per Employee 2005-2006 . mE 6 : Hitaca TDA ‘ Necehpoiddbyopntiecintis «=» « § «MAR $ MGS $ AMS OM $M SO Sh pete Reve a) z = : 2 A, (Compersation fiomuesticted shane plan ce ce C2) 38). (63) (63) (6) Cteradastrents, ret Bee) (4818, (298) fees) ols) Sue 6s) (Cheages inoperating assets
![Slide 28: ta] Consolidated](https://6ix-events-pro.s3.amazonaws.com/decks/p/5x8deazg/28.webp)
Slide 28: ta] Consolidated
ta] Consolidated Tekphore Qpaatiois FU 3 ERS HS me F oT § 1D § wm
Source: SEC EDGAR · 8-K filed Jan 10, 2007
More decks from Consolidated Communications
 Proxy Contest (January 2024)34 slides · Jan 11, 2024
 Merger or Acquisition (October 2023)7 slides · Oct 16, 2023
 Q2 2023 Earnings Presentation27 slides · Aug 8, 2023
 Q1 2023 Earnings Presentation28 slides · May 2, 2023
 Shareholder Meeting (May 2023)15 slides · May 1, 2023
 J.P. Morgan Global High Yield & Leveraged Finance Conference 202317 slides · Mar 7, 2023