Meredith — 2010 Citi Entertainment, Media & Telecommunications Conference
37 slides from Meredith's conference presentation, Jan 6, 2010

Slide 1: 2010 Citi Entertainment, Media & Telecommunications Conference
2010 Citi Entertainment, Media & Telecommunications Conference San Francisco, Jan. 5-7, 2010

Slide 2: Safe Harbor
Safe Harbor This presentation and management’s public commentary contain certain forward-looking statements that are subject to risks and uncertainties. These statements are based on management’s current knowledge and estimates of factors affecting the Company’s operations. Statements in this presen

Slide 3: Agenda
Agenda § Meredith Overview § Advertising Overview § Performance Improvement Plan § Financial Overview
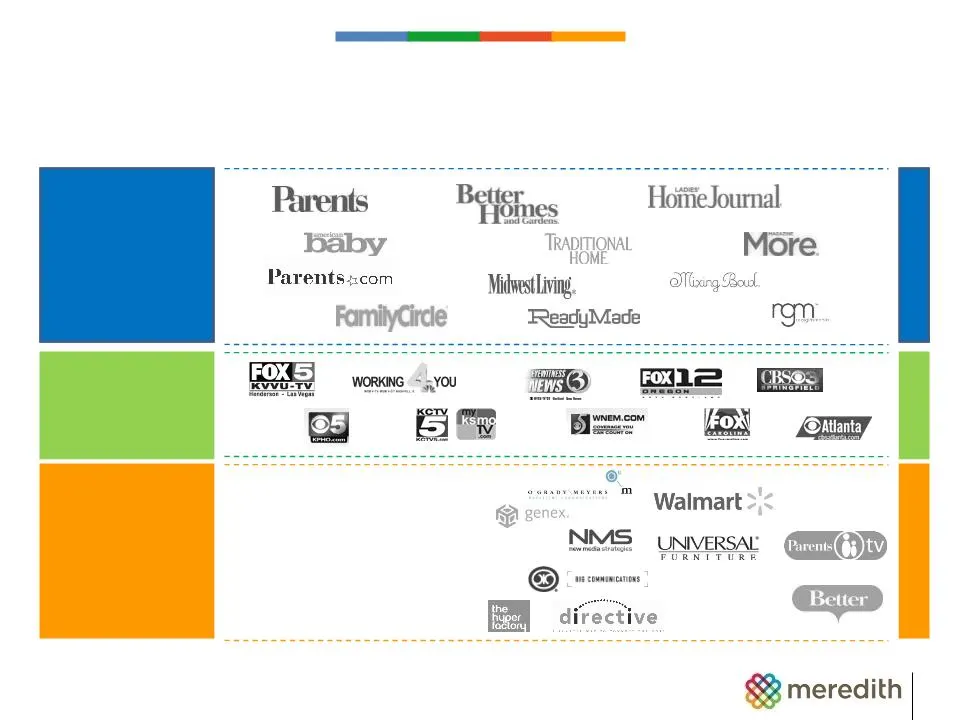
Slide 4: Broad Media and Marketing Footprint
National Media Brands Marketing Solutions Local Media Brands Revenues: $900 million Revenues: $240 million Revenues: $270 million Broad Media and Marketing Footprint MEREDITH OVERVIEW Integrated marketing Brand licensing Retransmission fees Video studios

Slide 5: Powerful National Brands Across Life Stages
Powerful National Brands Across Life Stages Her Family Her Home Her Self MEREDITH OVERVIEW

Slide 6: National Media Brands Achievements
National Media Brands Achievements § Delivered highest-ever market share in magazine advertising § Achieved all-time high profit contribution from circulation § Increased newsstand market share § Eliminated 10% in expenses § Named “Publishing Company of the Year” MEREDITH OVERVIEW
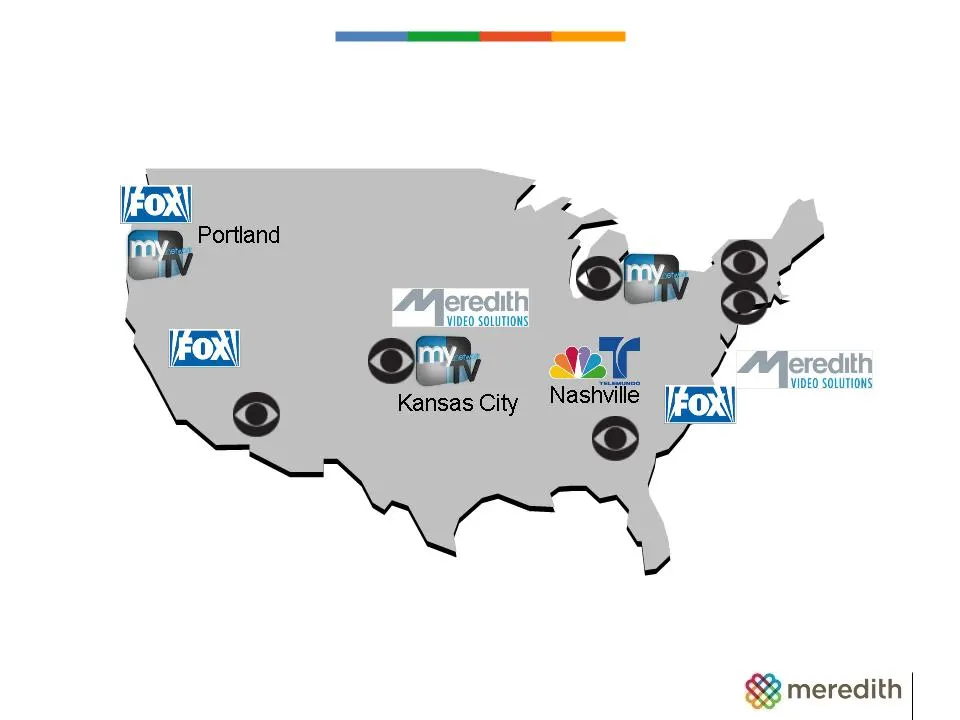
Slide 7: Diverse Local Media Portfolio Across Country
Diverse Local Media Portfolio Across Country MEREDITH OVERVIEW 12 network affiliates 10MM+ households 25+ websites 5MM unique visitors Mobile platforms Syndicated television Phoenix Flint-Saginaw Atlanta Hartford Las Vegas Greenville Springfield New York Des Moines

Slide 8: Local Media Brands Achievements
Local Media Brands Achievements § Grew morning news ratings across the group § Expanded number of markets airing Better show § Developed new sales and marketing programs § Initiated cost-saving plan to create hubs MEREDITH OVERVIEW
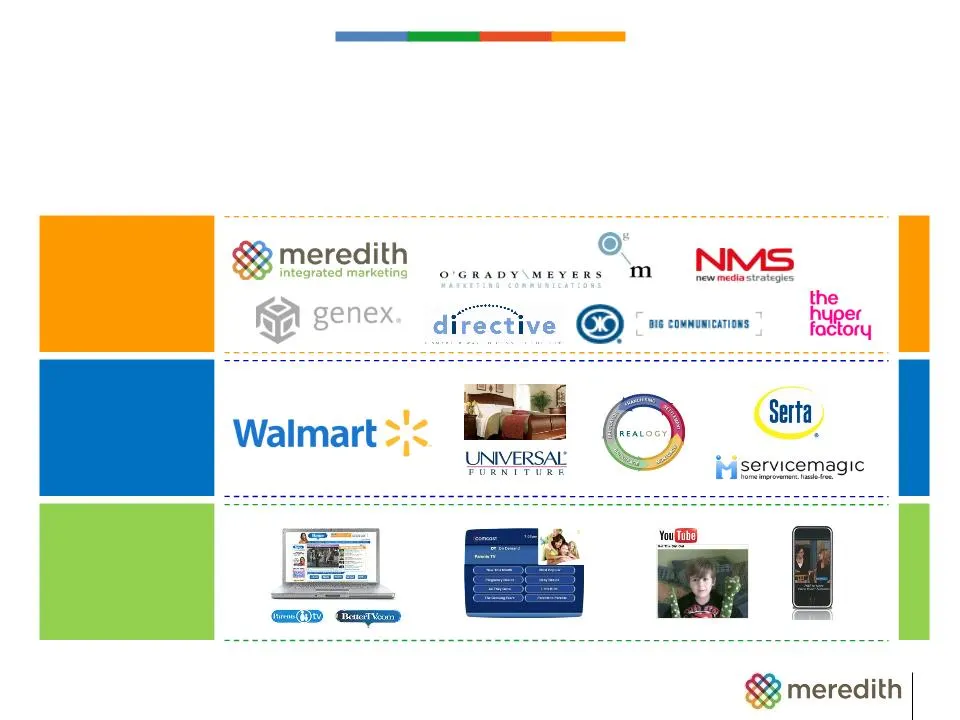
Slide 9: Growing Marketing Solutions and Diversified Businesses
Meredith Integrated Marketing Retransmission & Video Studios Brand Licensing MEREDITH OVERVIEW Growing Marketing Solutions and Diversified Businesses
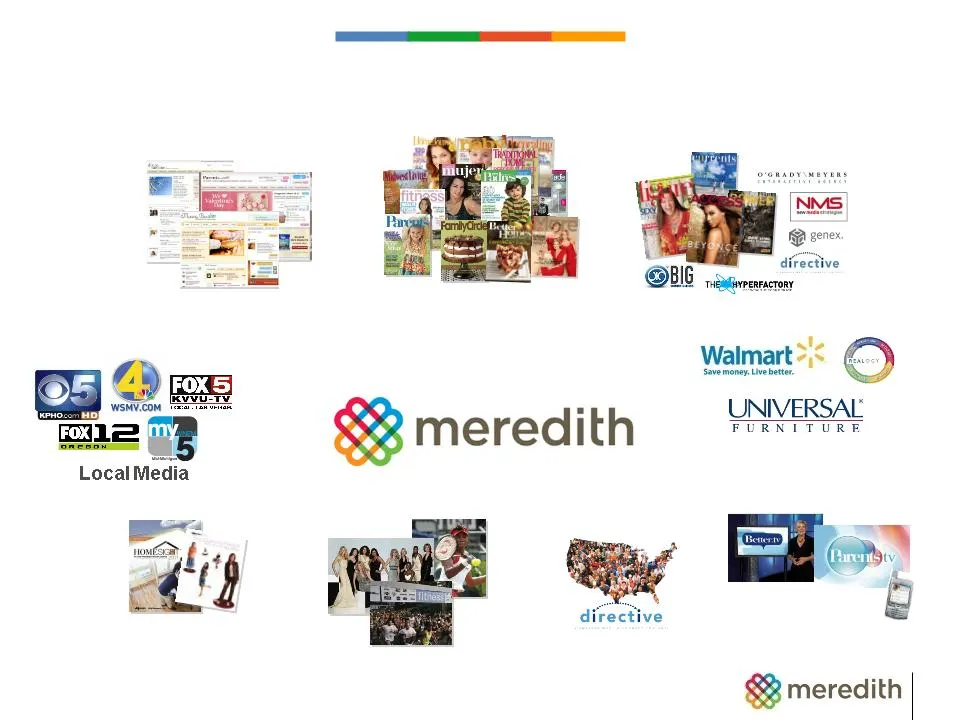
Slide 10: Broad Capabilities Across Media Platforms
Online: Meredith Women’s Network Magazines: Home, Family, Health & Well-being Consumer Events Custom Marketing Database Marketing Consumer Research Broad Capabilities Across Media Platforms Video Studios Brand Licensing MEREDITH OVERVIEW

Slide 11: Agenda
Agenda § Meredith Overview § Advertising Overview § Performance Improvement Plan § Financial Overview

Slide 12: Improving National Media Advertising Environment
Calendar 2009 Meredith Internal Industry PIB 1 st Qtr (13)% (22)% 2 nd Qtr (11)% (21)% 3 rd Qtr (5)% (18)% 4 th Qtr Down low single digits* N/A National Media Performance vs. Industry Improving National Media Advertising Environment ADVERTISING OVERVIEW *Forecast

Slide 13: Improving Local Media Advertising Environment
Calendar 2009 Meredith Internal Industry TVB 1 st Qtr (30)% (22)% 2 nd Qtr (25)% (25)% 3 rd Qtr (13)% (20)% 4 th Qtr +4-5%* N/A Local Media Performance vs. Industry (non-political) Improving Local Media Advertising Environment ADVERTISING OVERVIEW *Forecast

Slide 14: Advertising environment
§ Delivered improving results throughout calendar 2009 § However, still an uncertain advertising environment § Limited visibility into calendar 2010 advertising budgets Advertising environment ADVERTISING OVERVIEW

Slide 15: Strategic Overview
STRATEGIC OVERVIEW Agenda § Meredith Overview § Advertising Overview § Performance Improvement Plan – Gain market share in core businesses – Increase consumer connection – Develop new revenue streams – Exercise disciplined expense and cash management § Financial Overview
Slide 16: Growing National and Local Market Share
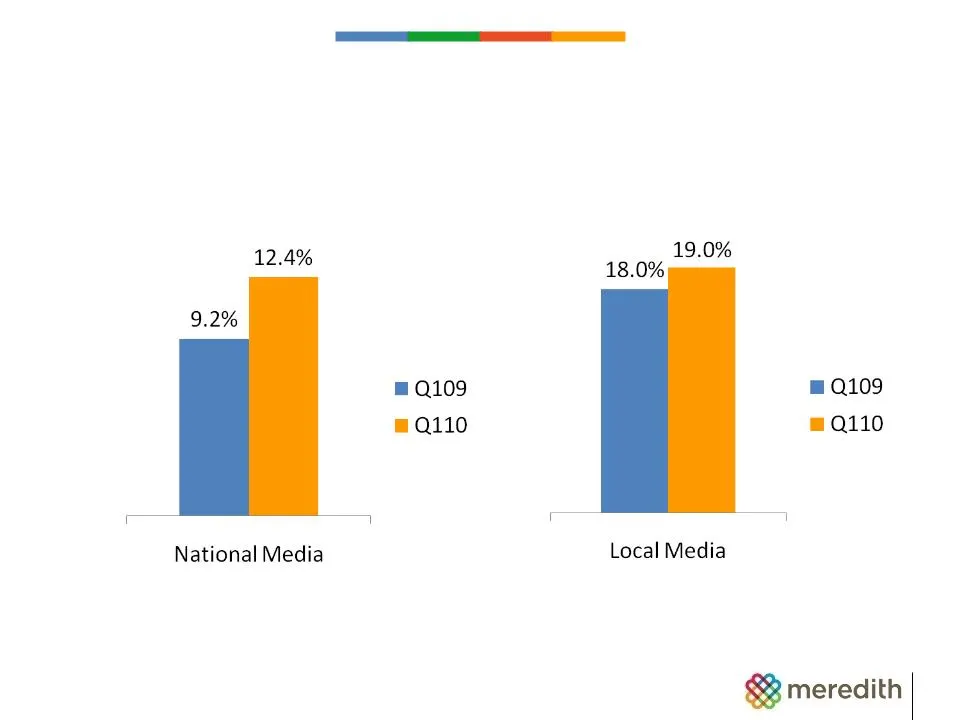
Growing National and Local Market Share Source: National: TNS Media Intelligence, 2009, Local: TvB GAIN MARKET SHARE

Slide 17: Strategic Overview
STRATEGIC OVERVIEW Agenda § Meredith Overview § Current Advertising Update § Performance Improvement Plan – Gain market share in core businesses – Increase consumer connection – Develop new revenue streams – Exercise disciplined expense and cash management § Financial Overview

Slide 18: Powerful National Consumer Connection
1999 2009 Better Homes and Gardens 33 39 Family Circle 22 20 Parents 12 15 Ladies’ Home Journal 15 12 Fitness 6 6 American Baby 5 7 More NA 2 Other* 4 8 TOTAL 97 109 +12% Powerful National Consumer Connection Source: Fall 1999 & 2009 MRI Reports * Traditional Home and Midwest Living Readership in Mi

Slide 19: Strong Subscription-Focused Circulation Model
Rate Base % of circulation from subscriptions Better Homes and Gardens 7.6M 97% Ladies’ Home Journal 3.8M 95% Family Circle 3.8M 81% Parents 2.2M 98% Fitness 1.5M 87% More 1.3M 87% Traditional Home 950,000 89% Strong Subscription-Focused Circulation Model • Direct Mail response rates strong – Both f

Slide 20: Increase Consumer Connection
§ November TV sweeps solid § Record traffic on Meredith Women’s Network § Wal-Mart licensing agreement expanded Increase Consumer Connection INCREASE CONSUMER CONNECTION

Slide 21: Strategic Overview
STRATEGIC OVERVIEW Agenda § Meredith Overview § Advertising Overview § Performance Improvement Plan – Gain market share in core businesses – Increase consumer connection – Develop new revenue streams – Exercise disciplined expense and cash management § Financial Overview
Slide 22: New Revenue Stream Development
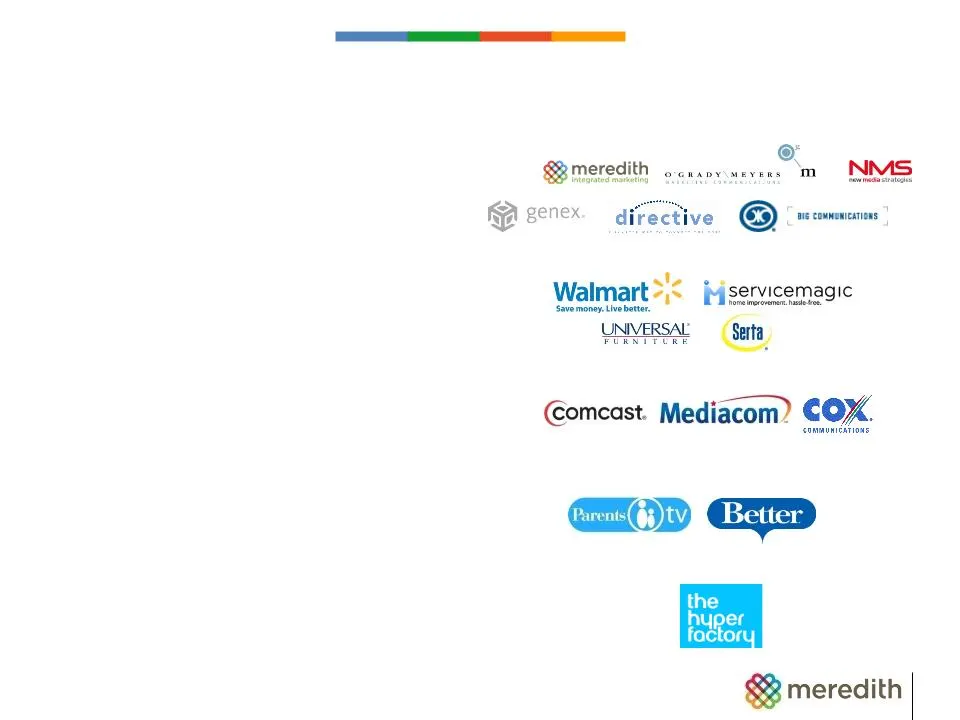
§ Integrated Marketing § Brand Licensing § Retransmission § Video Studios § Mobile Marketing Opportunity New Revenue Stream Development NEW REVENUE STREAMS
Slide 23: Meredith Integrated Marketing Update
Meredith Integrated Marketing Update § Client base of nearly 200 § Rich pipeline of requests for new business proposals § Clients focused on program expense and measurability § Great interest in new ways of taking brands to market – Social media NEW REVENUE STREAMS
Slide 24: Kraft CRM & Meredith Integrated Marketing
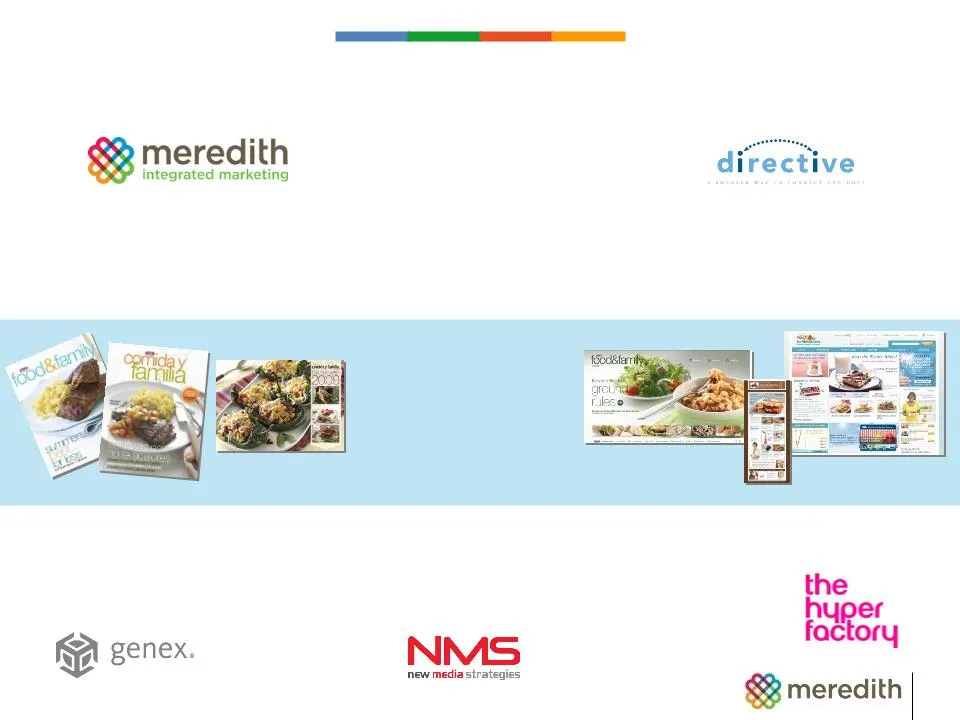
• Content strategy • Quarterly magazines • Multi-language e-mail campaigns • Food photography & videos in multiple languages • Database Marketing strategy • Campaign management • Business intelligence • Shopper purchase analytics • Digital magazine • iFood assistant • Digital design • Digital strate
Slide 25: Growing Presence in Brand Licensing
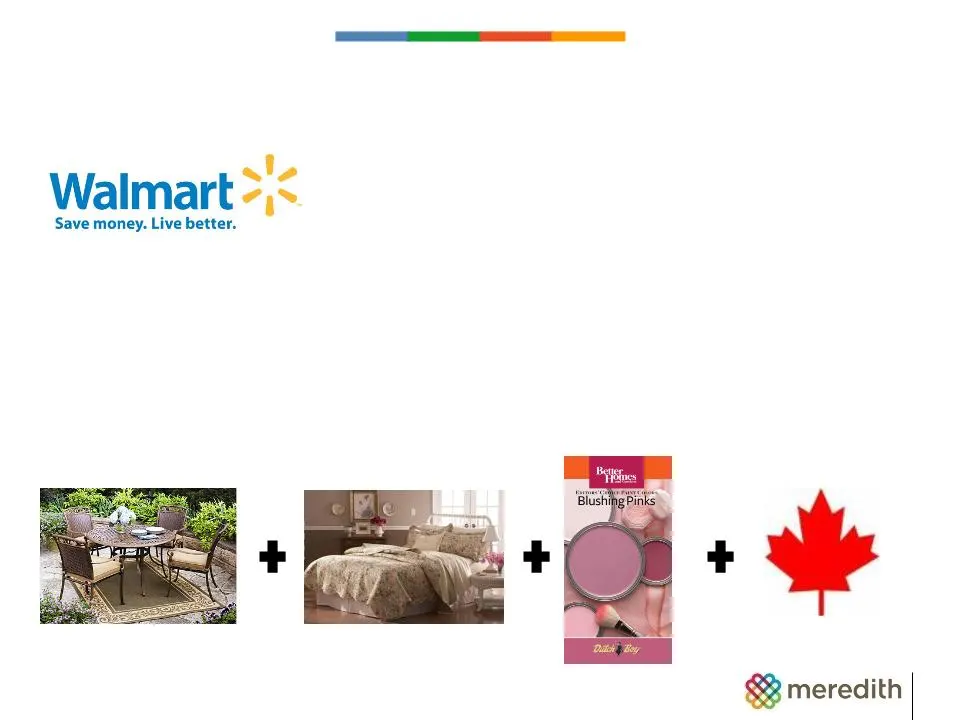
Growing Presence in Brand Licensing – Sales meeting expectations – SKUs tripled to more than 1,500 in 2009 – Expanded to Canada earlier this month – Ongoing national U.S. advertising campaign Garden Interior decor Paint Canada NEW REVENUE STREAMS
Slide 26: Increasing TV Retransmission Revenues
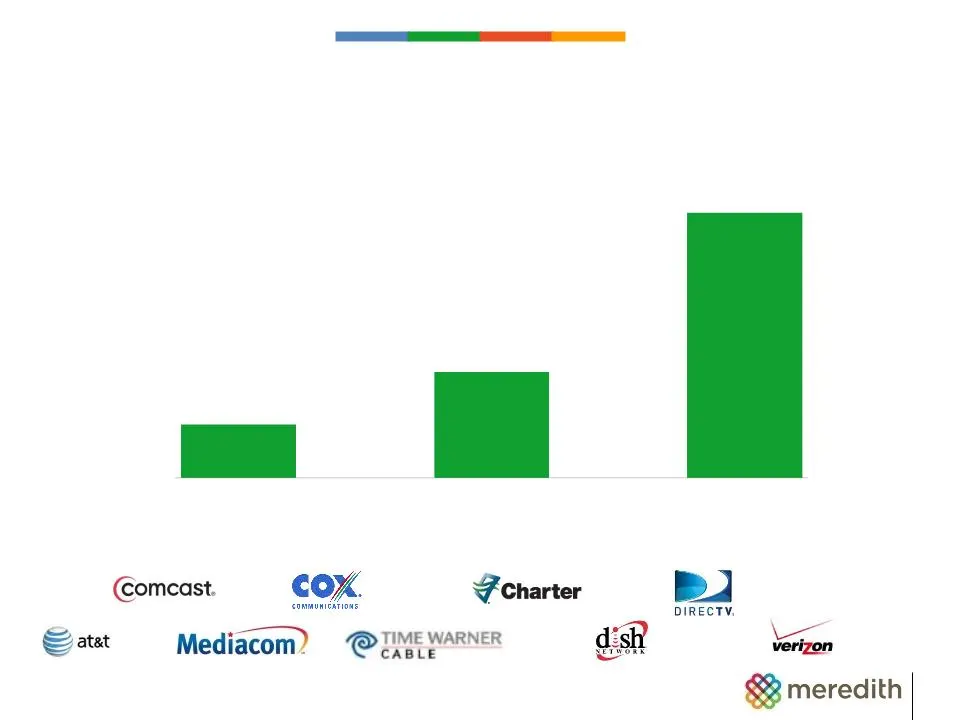
$ in millions Increasing TV Retransmission Revenues $4 $20+ $8 (Actual) (Actual) (Estimate) NEW REVENUE STREAMS

Slide 27: Mobile Opportunity
§ The next big distribution platform § Opportunities in: – Business to consumer – Business to business § Clients increasingly asking for mobile marketing solutions § Relationship with The Hyperfactory – Clients include Toyota, Coke, Blackberry, Nike, Vodafone, Disney – Offices in New York, Los Angel

Slide 28: Strategic Overview
STRATEGIC OVERVIEW Agenda § Meredith Overview § Advertising Overview § Performance Improvement Plan – Gain market share across businesses – Increase consumer connection – Develop new revenue streams – Exercise disciplined expense and cash management § Financial Overview

Slide 29: Actions Taken
Actions Taken § Departmental efficiencies § Reductions in workforce § Strategic vendor sourcing initiative § Reduced capital expenditures § Aggressive working capital management § Result: - Cut total operating expenses 8% in Q110 - Reduced $135 million in debt over 18 months DISCIPLINED EXPENSE MANA
Slide 30: Historical Cash Flow From Operations
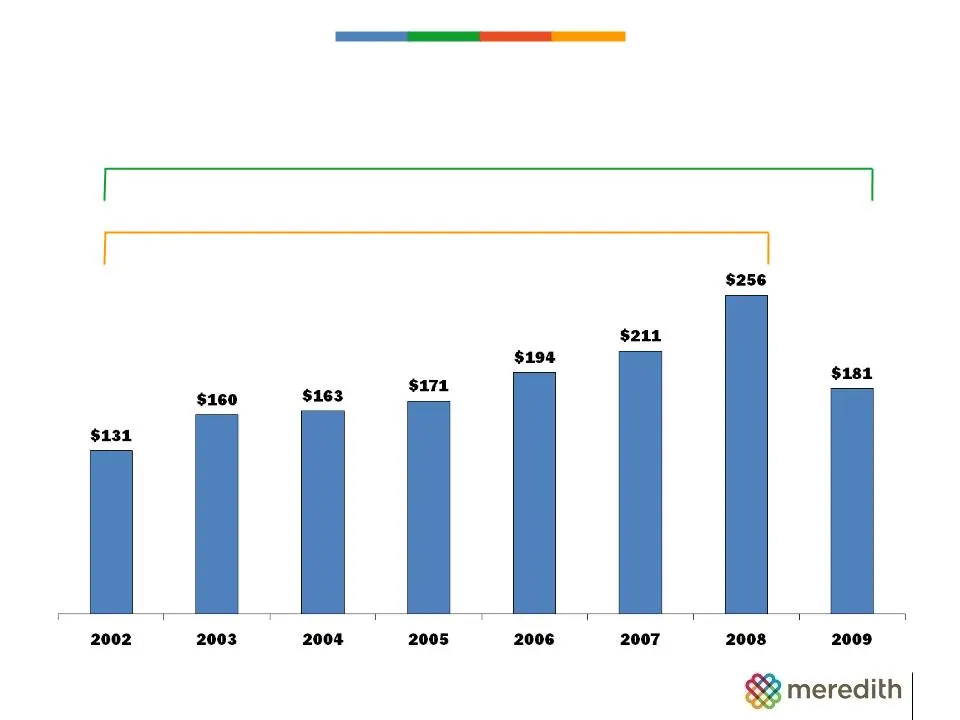
Historical Cash Flow From Operations 12% CAGR 5% CAGR $ in millions FINANCIAL OVERVIEW

Slide 31: Use of Cash: Fiscal 2000 through 2009
Use of Cash: Fiscal 2000 through 2009 Stock Option Exercises $2,000 Utilization of Cash Net Debt Capital Expenditures Acquisitions, Net of Dispositions $2,000 Available Cash $1,800 Operating Cash Flow Dividends $ in millions $700 Share Repurchases $1,000 SUBTOTAL FINANCIAL OVERVIEW
Slide 32: Calendar Year Dividends Per Share
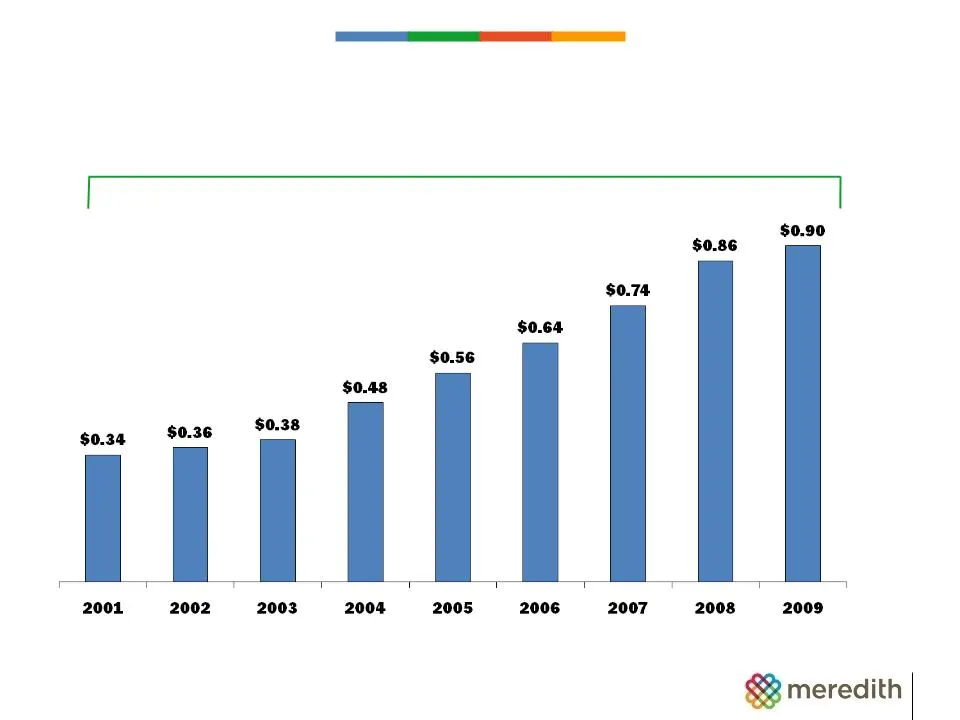
Calendar Year Dividends Per Share 13% CAGR FINANCIAL OVERVIEW

Slide 33: Financial Metrics
Current Capacity/Authorization Debt Level $350 million* Additional $470 million Debt-to-EBITDA Ratio 1.7x Less than 3.75x Interest Coverage Ratio 10.8x Greater than 2.75x Average Cost of Funds 5.6% * As of 12/31/09, other metrics are current as of 9/30/09 Financial Metrics FINANCIAL OVERVIEW

Slide 34: Current Valuation Metrics
$208 trailing 12 EBITDA $208 trailing 12 EBITDA $1.8B total cap $1.4B market cap § Current dividend yield § EPS multiple: § EBITDA multiple to market capitalization: § EBITDA multiple to total capitalization: $2.01 trailing 12 EPS $30.85 share price Current Valuation Metrics • As of Sept. 30 2009 us

Slide 35: Outlook: Second Quarter and Full Year 2010
Oct. 2009 E Dec. 2009 E National Media advertising revenue Down mid single digits Down low single digits Local Media advertising revenue (8)% +4-5% Q210 Earnings per share $0.33 - $0.38 $0.45- $0.47 FY10 Earnings per share $1.60 - $2.00 $1.75 - $2.00 Outlook: Second Quarter and Full Year 2010 E = Es

Slide 36: Summary
Summary § Vibrant and profitable media assets and brands § Growing market share § Wide array of new revenue stream development § Strong financial foundation

Slide 37: SR meredith
SR meredith Be Sines FamilyCircle HoifieJournal FoXh FJ Parents Baby ‘fitness mm. Smeredith oe —— Bmeredith GD genex. ocaroymeves m directive NMS GG) -wemnnm $& meredith |
Source: SEC EDGAR · 8-K filed Jan 6, 2010
More decks from Meredith Corporation
 Q4 FY2021 Earnings Presentation20 slides · Aug 12, 2021
 Investor Presentation (June 2021)17 slides · Jun 16, 2021
 Merger or Acquisition (May 2021)15 slides · May 3, 2021
 Citi 2021 Global TMT West Virtual Conference11 slides · Jan 6, 2021
 Q4 FY2020 Earnings Presentation19 slides · Aug 13, 2020
 Q3 FY2020 Earnings Presentation15 slides · May 14, 2020