Cardinal Financial — Raymond James 2015 U.S. Bank Conference
31 slides from Cardinal Financial's conference presentation, Sep 9, 2015
Slide 1: Raymond James 2015 U.S. Bank Conference
Raymond James 2015 U.S. Bank Conference September 9, 2015 CARDINAL FINANCIAL CORPORATION
Slide 2: Forward Looking Statements
Forward Looking Statements Statements contained in this presentation which are not historical facts are forward-looking statements as that item is defined in the Private Securities Litigation Reform Act of 1995. Such forward-looking statements are subject to risks and uncertainties which could cause
Slide 3: Our Operating Philosophy: Aggressive on Sales, Conservative on Risk
Our Operating Philosophy: Aggressive on Sales, CONSERVATIVE ON RISK
Slide 4: Business line profile
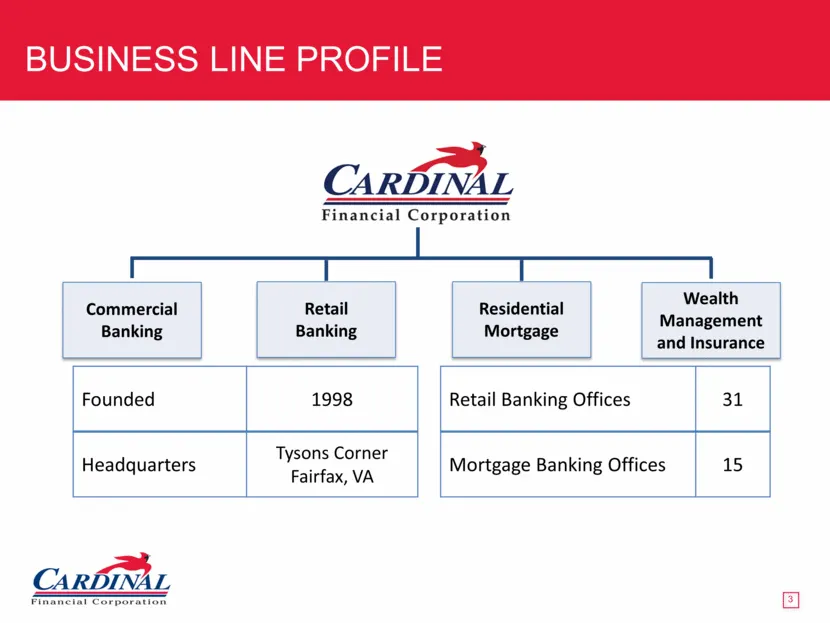
Business line profile Founded 1998 Retail Banking Offices 31 Headquarters Tysons Corner Fairfax, VA Mortgage Banking Offices 15 Commercial Banking Retail Banking Residential Mortgage Wealth Management and Insurance
Slide 5: Management Team
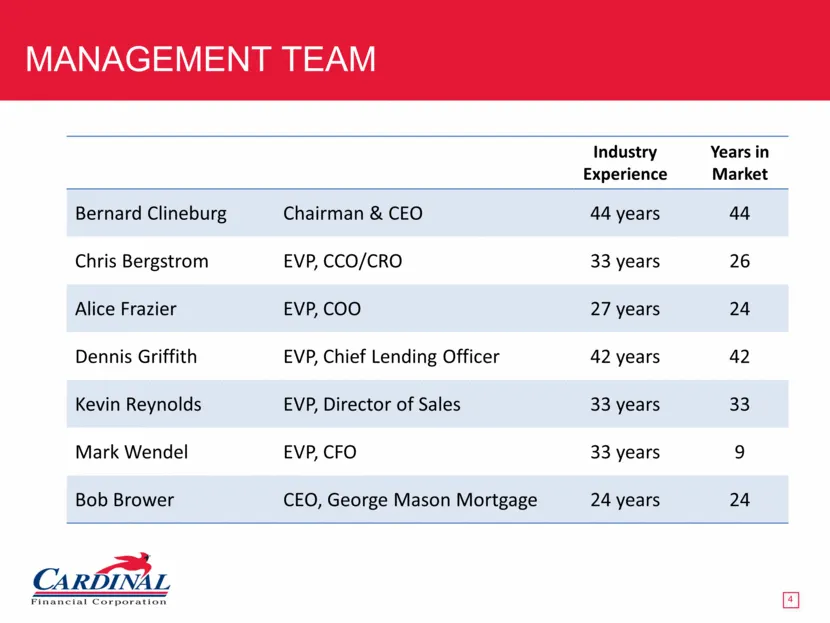
Management Team Industry Experience Years in Market Bernard Clineburg Chairman & CEO 44 years 44 Chris Bergstrom EVP, CCO/CRO 33 years 26 Alice Frazier EVP, COO 27 years 24 Dennis Griffith EVP, Chief Lending Officer 42 years 42 Kevin Reynolds EVP, Director of Sales 33 years 33 Mark Wendel EVP, CFO 3
Slide 6: Integrated Business Model
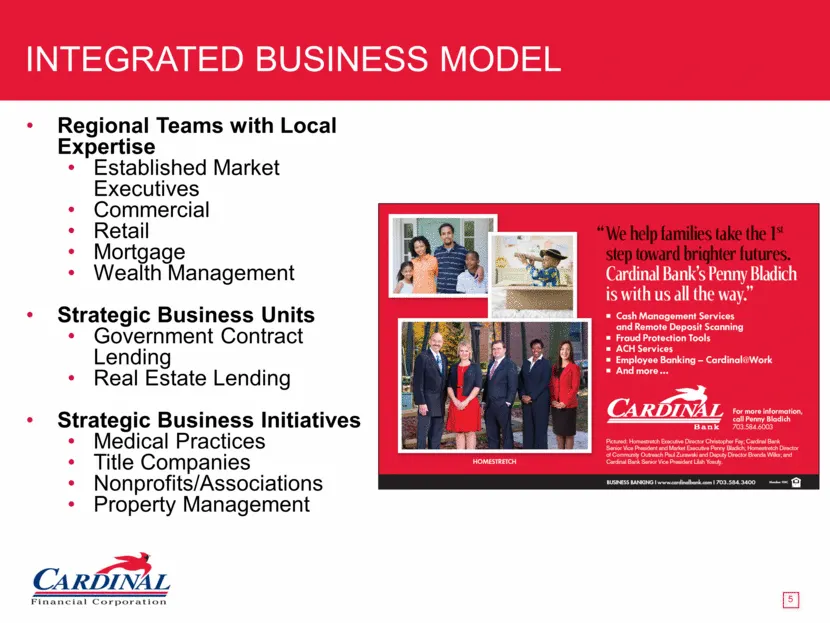
Integrated Business Model Regional Teams with Local Expertise Established Market Executives Commercial Retail Mortgage Wealth Management Strategic Business Units Government Contract Lending Real Estate Lending Strategic Business Initiatives Medical Practices Title Companies Nonprofits/Associations P
Slide 7: Office Locations
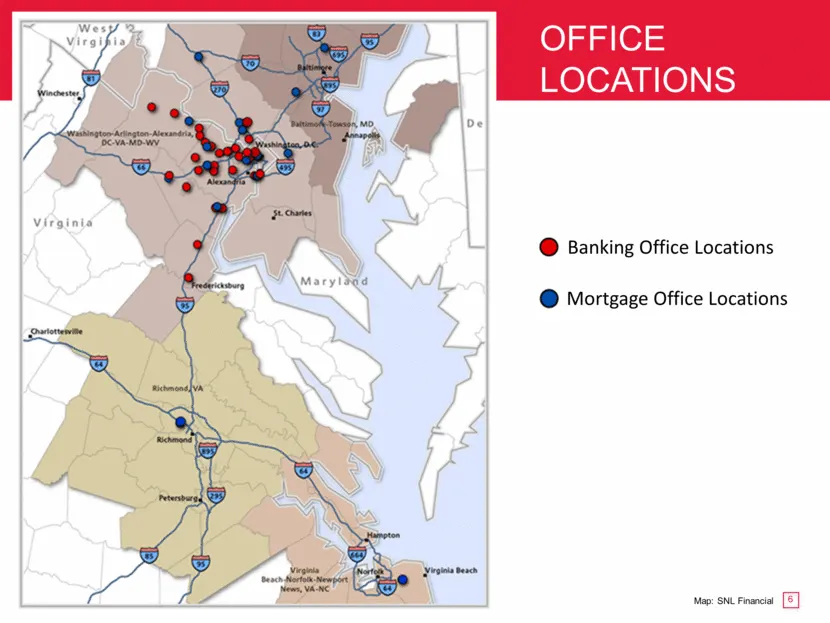
Office Locations Map: SNL Financial Banking Office Locations Mortgage Office Locations
Slide 8: Retail banking markets
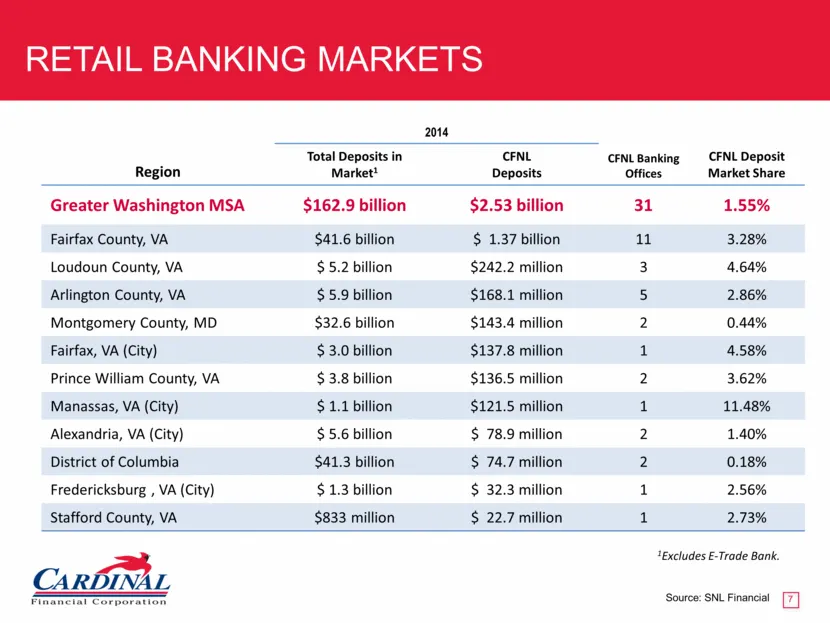
Retail banking markets Region 2014 CFNL Banking Offices CFNL Deposit Market Share Total Deposits in Market1 CFNL Deposits Greater Washington MSA $162.9 billion $2.53 billion 31 1.55% Fairfax County, VA $41.6 billion $ 1.37 billion 11 3.28% Loudoun County, VA $ 5.2 billion $242.2 million 3 4.64% Arli
Slide 9: Market presence in VA/MD/DC
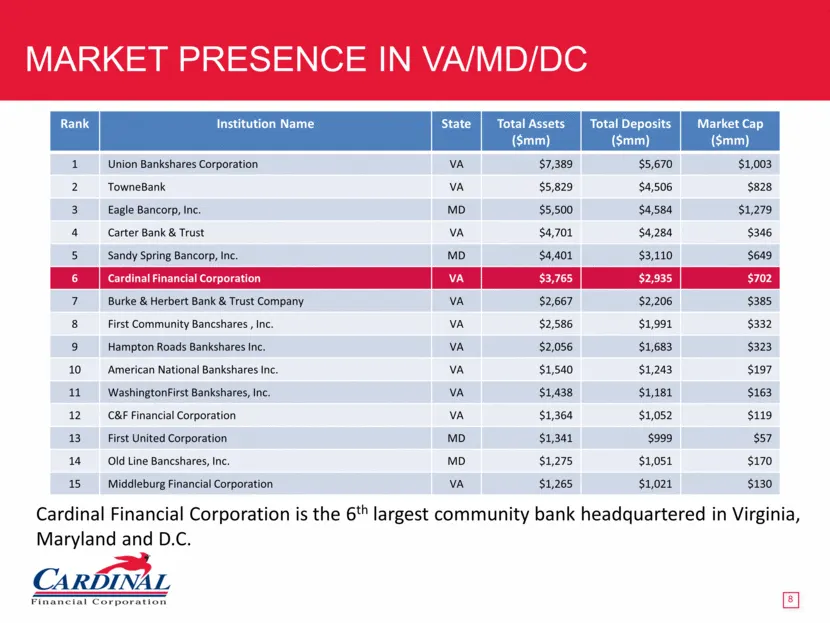
Market presence in VA/MD/DC Rank Institution Name State Total Assets ($mm) Total Deposits ($mm) Market Cap ($mm) 1 Union Bankshares Corporation VA $7,389 $5,670 $1,003 2 TowneBank VA $5,829 $4,506 $828 3 Eagle Bancorp, Inc. MD $5,500 $4,584 $1,279 4 Carter Bank & Trust VA $4,701 $4,284 $346 5 Sandy
Slide 10: Annual Growth
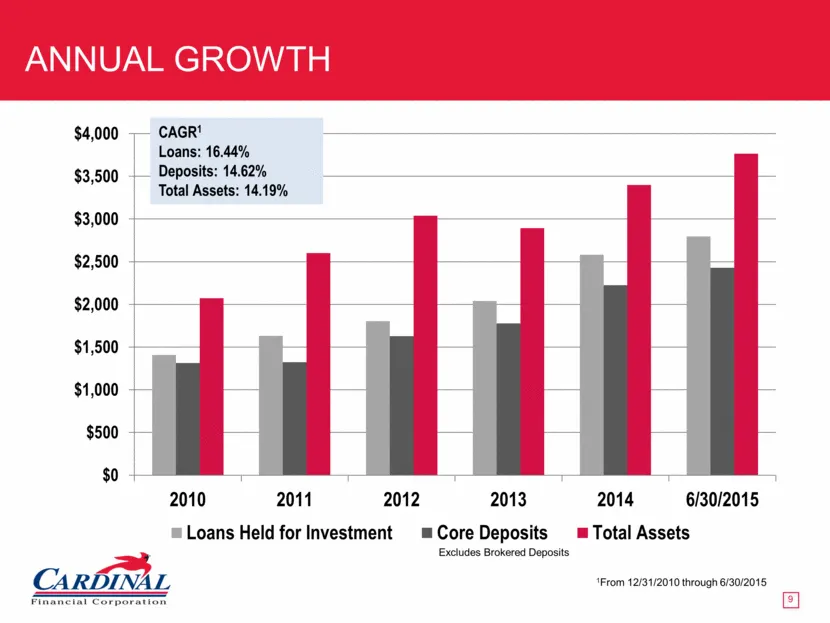
Annual Growth 1From 12/31/2010 through 6/30/2015 Excludes Brokered Deposits CAGR1 Loans: 16.44% Deposits: 14.62% Total Assets: 14.19%
Slide 11: Commercial Lending Profile
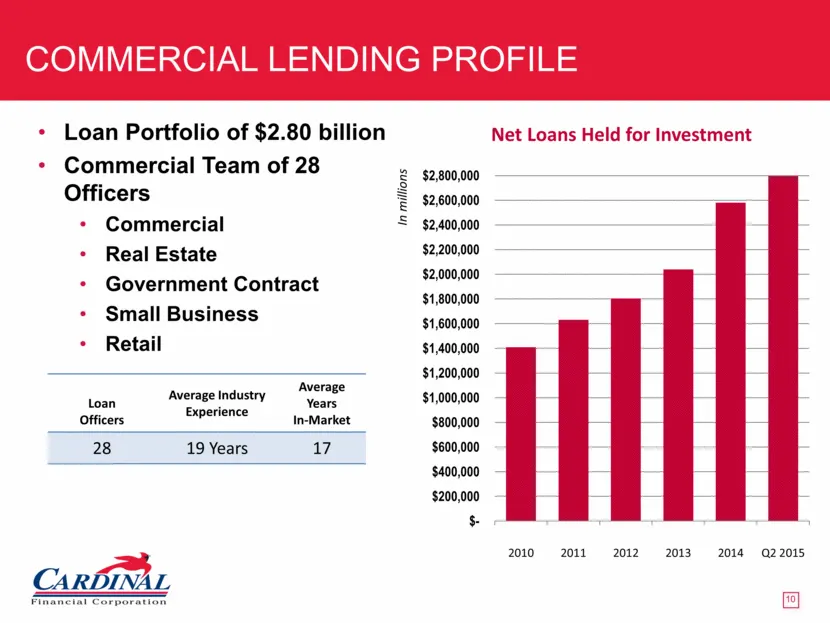
Commercial Lending Profile Loan Portfolio of $2.80 billion Commercial Team of 28 Officers Commercial Real Estate Government Contract Small Business Retail Net Loans Held for Investment Loan Officers Average Industry Experience Average Years In-Market 28 19 Years 17 $- $200,000 $400,000 $600,000 $800
Slide 12: Loan Portfolio Mix
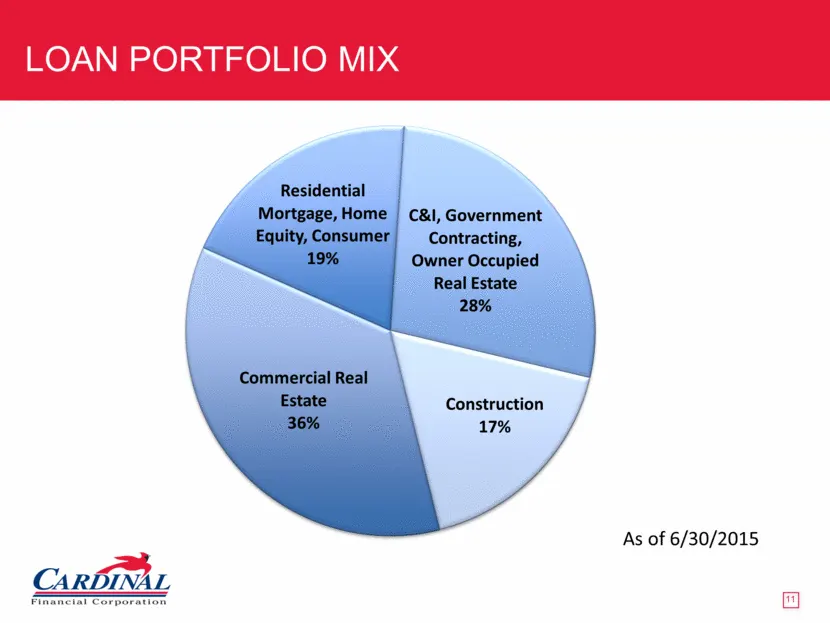
Loan Portfolio Mix As of 6/30/2015
Slide 13: Commercial Real Estate Portfolio
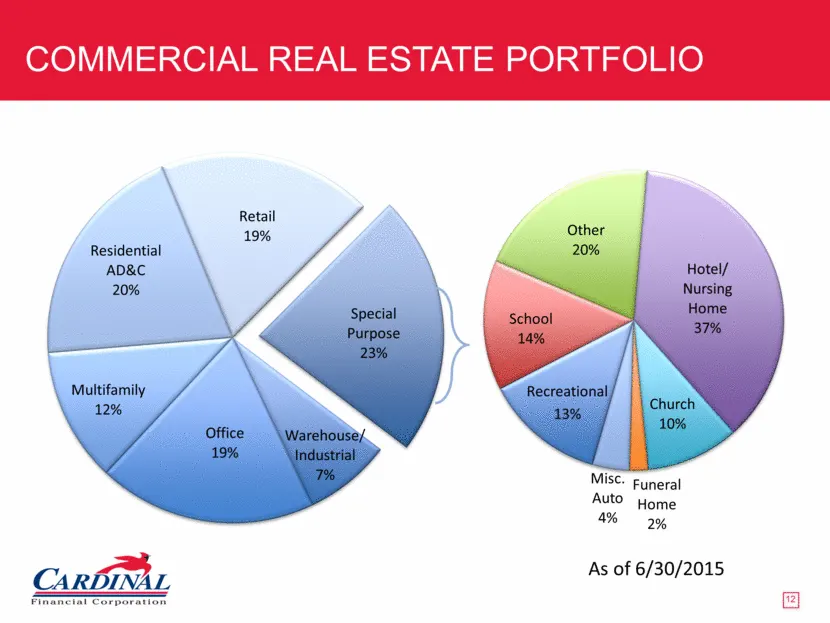
Commercial Real Estate Portfolio Recreational As of 6/30/2015
Slide 14: Strong Conservative Credit Culture
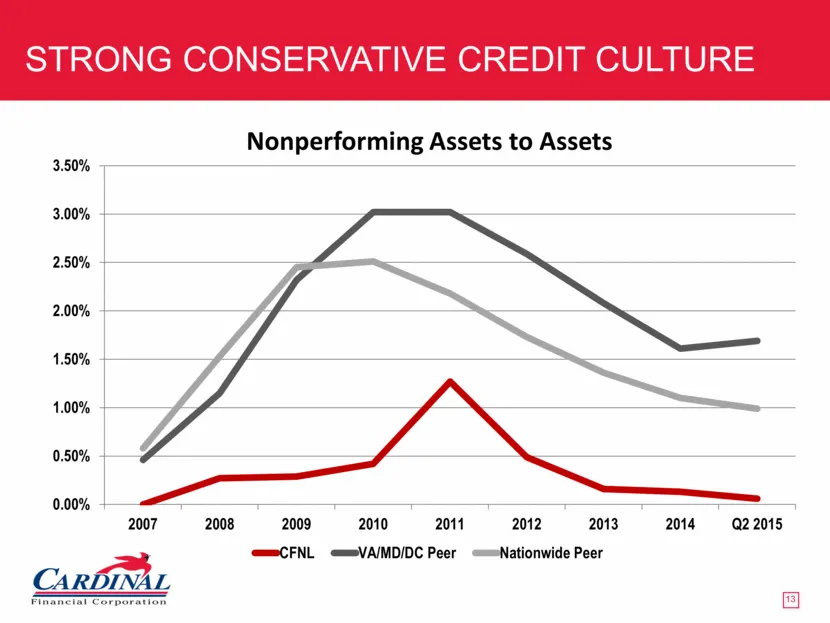
Strong Conservative Credit Culture Source: SNL Financial Complete Listing of Peer Group Used in Appendix Nonperforming Assets to Assets
Slide 15: Deposit Profile
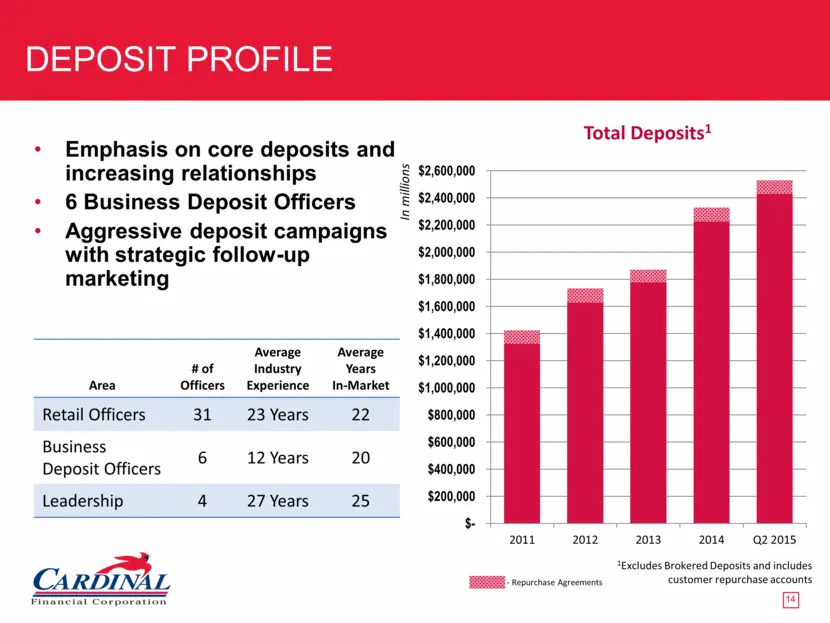
Deposit Profile Emphasis on core deposits and increasing relationships 6 Business Deposit Officers Aggressive deposit campaigns with strategic follow-up marketing Total Deposits1 Area # of Officers Average Industry Experience Average Years In-Market Retail Officers 31 23 Years 22 Business Deposit Of
Slide 16: Core Deposit Base & Non-interest bearing deposits
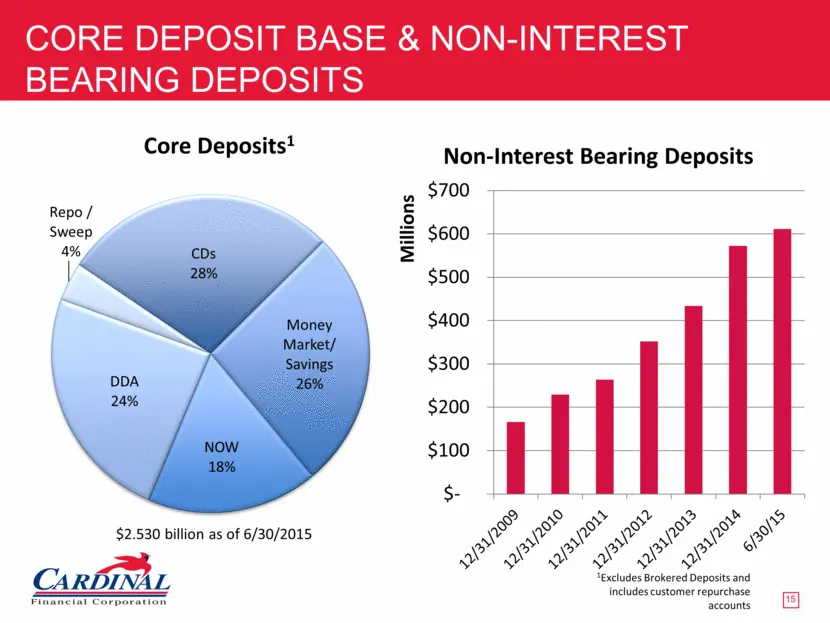
Core Deposit Base & Non-interest bearing deposits 1Excludes Brokered Deposits and includes customer repurchase accounts $2.530 billion as of 6/30/2015 $- $100 $200 $300 $400 $500 $600 $700 Millions Non - Interest Bearing Deposits Core Deposits 1 Repo / Sweep 4%
Slide 17: Cardinal is Well Capitalized
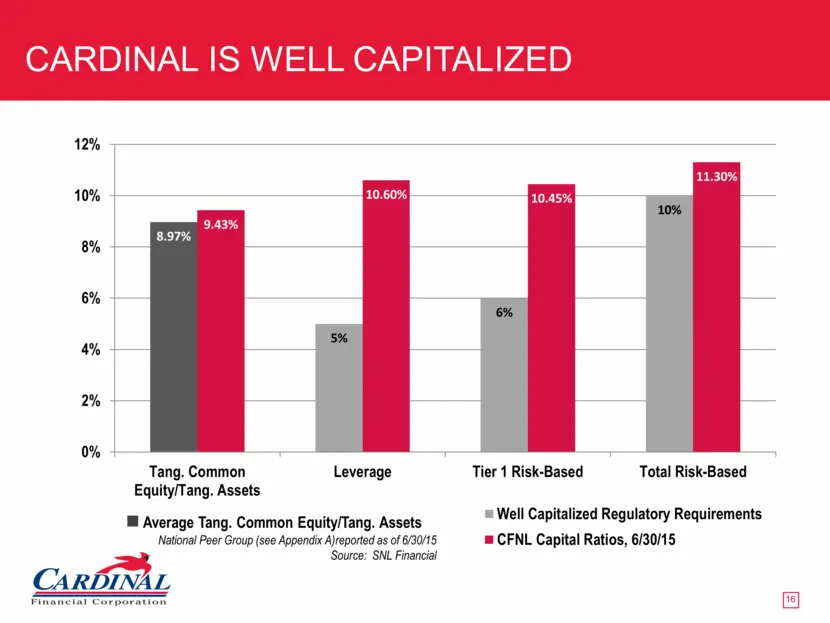
Cardinal is Well Capitalized Average Tang. Common Equity/Tang. Assets National Peer Group (see Appendix A)reported as of 6/30/15 Source: SNL Financial Well Capitalized Regulatory Requirements CFNL Capital Ratios, 6/30/15
Slide 18: Mortgage Banking Profile
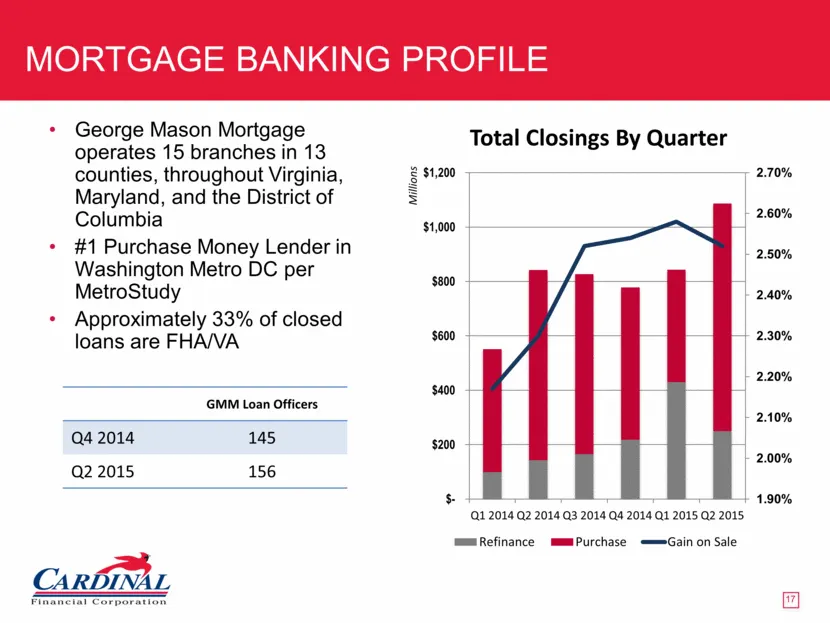
Mortgage Banking Profile George Mason Mortgage operates 15 branches in 13 counties, throughout Virginia, Maryland, and the District of Columbia #1 Purchase Money Lender in Washington Metro DC per MetroStudy Approximately 33% of closed loans are FHA/VA GMM Loan Officers Q4 2014 145 Q2 2015 156
Slide 19: Wealth Management/Insurance Profile
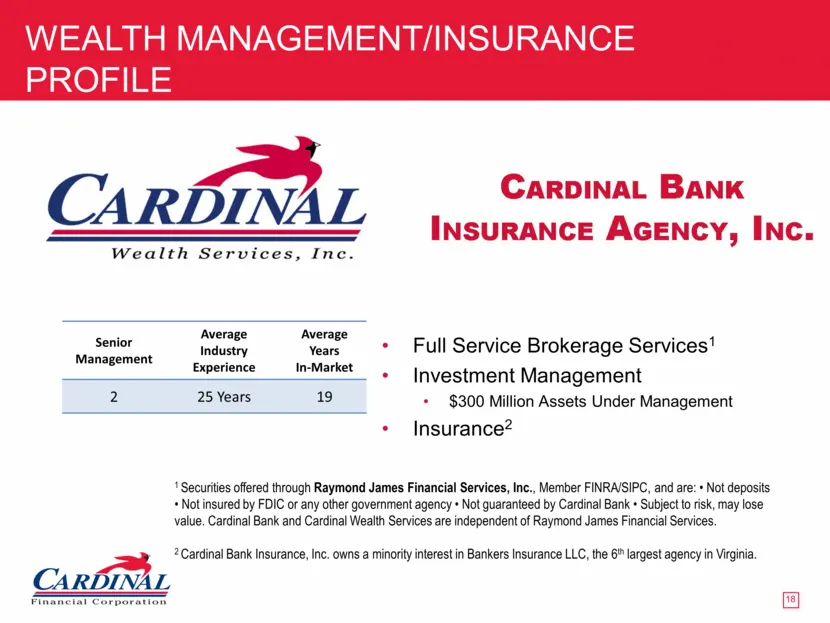
Full Service Brokerage Services1 Investment Management $300 Million Assets Under Management Insurance2 Wealth Management/Insurance Profile 1 Securities offered through Raymond James Financial Services, Inc., Member FINRA/SIPC, and are: • Not deposits • Not insured by FDIC or any other government age
Slide 20: Financial Highlights
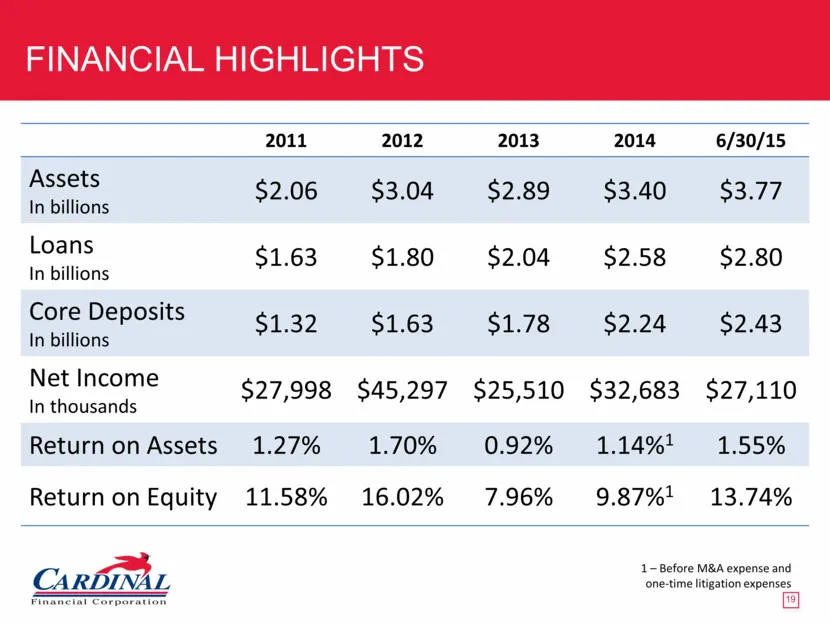
Financial Highlights 2011 2012 2013 2014 6/30/15 Assets In billions $2.06 $3.04 $2.89 $3.40 $3.77 Loans In billions $1.63 $1.80 $2.04 $2.58 $2.80 Core Deposits In billions $1.32 $1.63 $1.78 $2.24 $2.43 Net Income In thousands $27,998 $45,297 $25,510 $32,683 $27,110 Return on Assets 1.27% 1.70% 0.92%
Slide 21: Strategic Growth
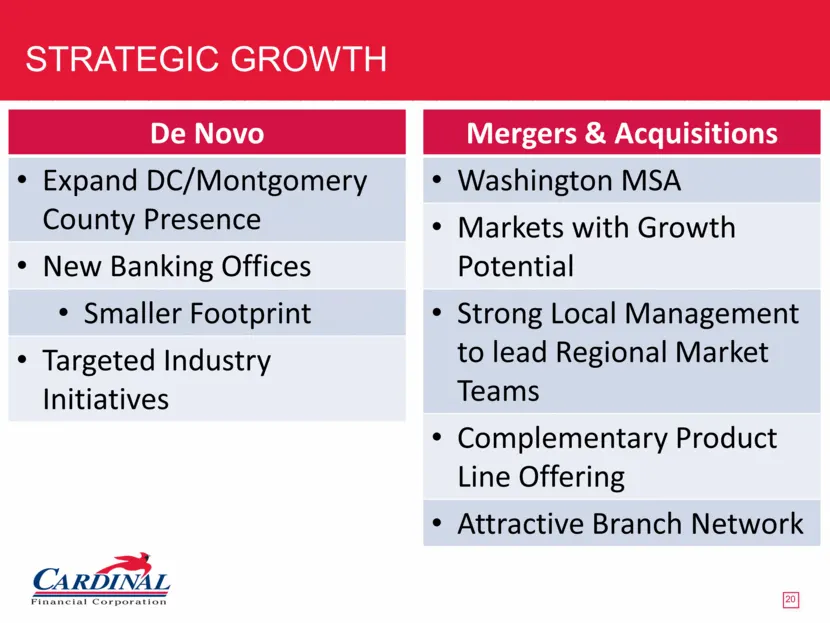
Strategic Growth De Novo Expand DC/Montgomery County Presence New Banking Offices Smaller Footprint Targeted Industry Initiatives Mergers & Acquisitions Washington MSA Markets with Growth Potential Strong Local Management to lead Regional Market Teams Complementary Product Line Offering Attractive B
Slide 22: Dividend Performance
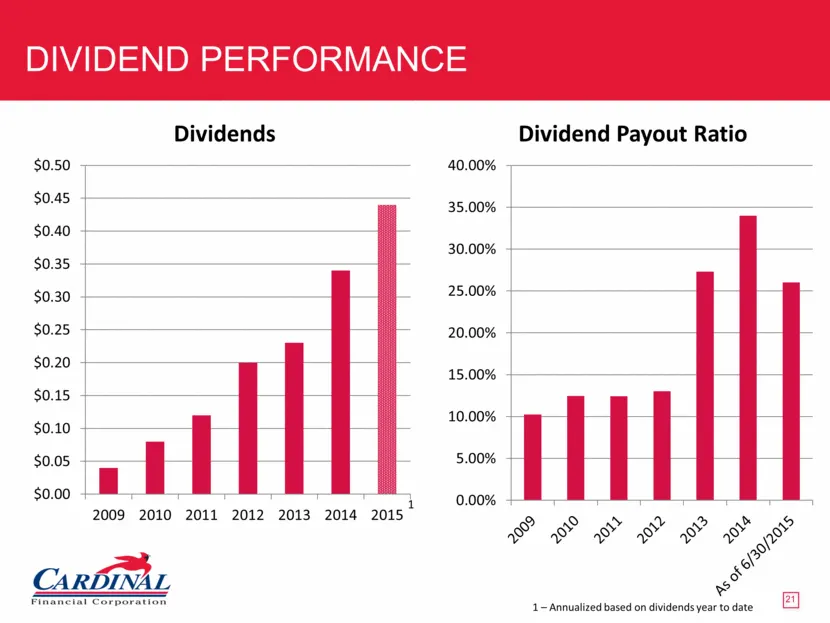
DIVIDEND PERFORMANCE 1 – Annualized based on dividends year to date 1 0.00% 5.00% 10.00% 15.00% 20.00% 25.00% 30.00% 35.00% 40.00% Dividend Payout Ratio
Slide 23: Total Return % Comparison
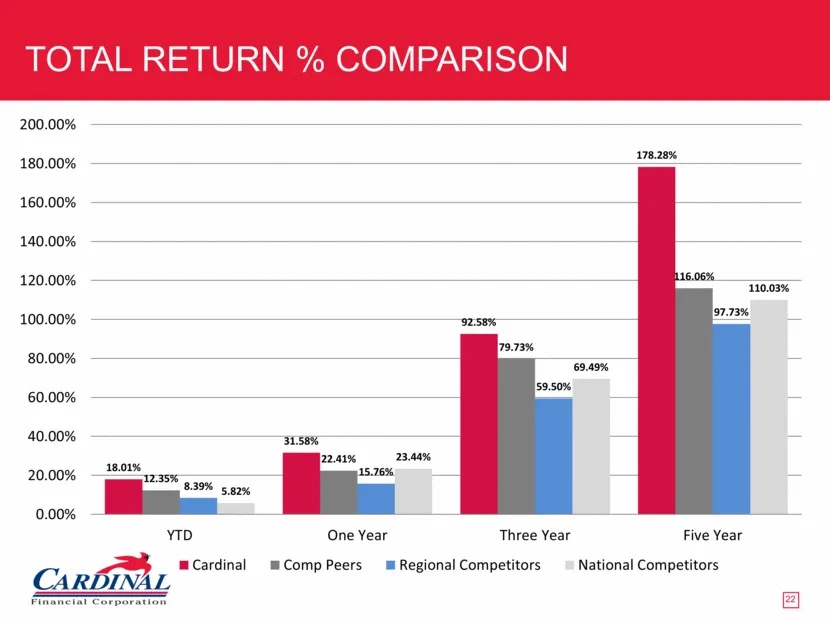
Total Return % COMPARISON 18.01% 31.58% 92.58% 178.28% 12.35% 22.41% 79.73% 116.06% 8.39% 15.76% 59.50% 97.73% 5.82% 23.44% 69.49% 110.03% 0.00% 20.00% 40.00% 60.00% 80.00% 100.00% 120.00% 140.00% 160.00% 180.00% 200.00% YTD One Year Three Year Five Year Cardinal Comp Peers Regional Competitors Nati
Slide 24: Investment Summary
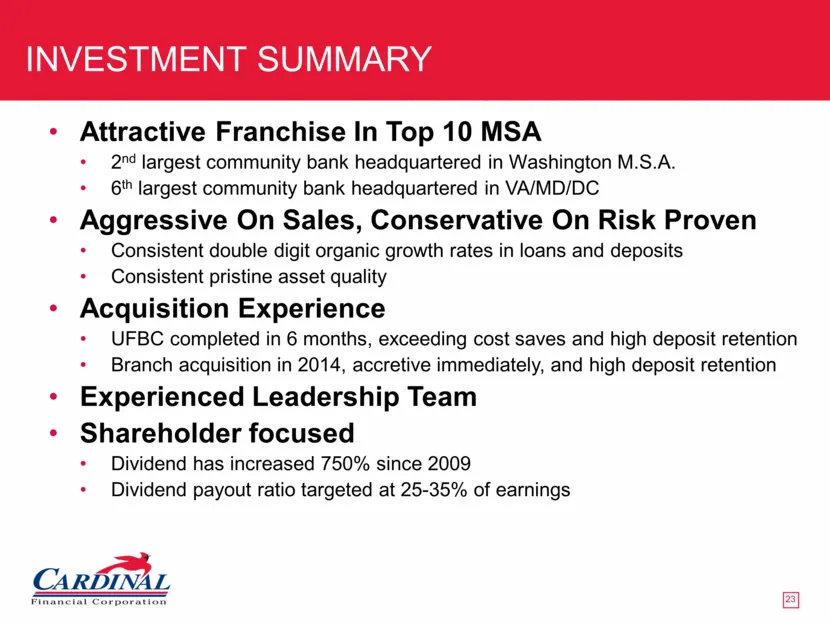
Investment Summary Attractive Franchise In Top 10 MSA 2nd largest community bank headquartered in Washington M.S.A. 6th largest community bank headquartered in VA/MD/DC Aggressive On Sales, Conservative On Risk Proven Consistent double digit organic growth rates in loans and deposits Consistent pris
Slide 25: Stock Profile: CFNL (NASDAQ)
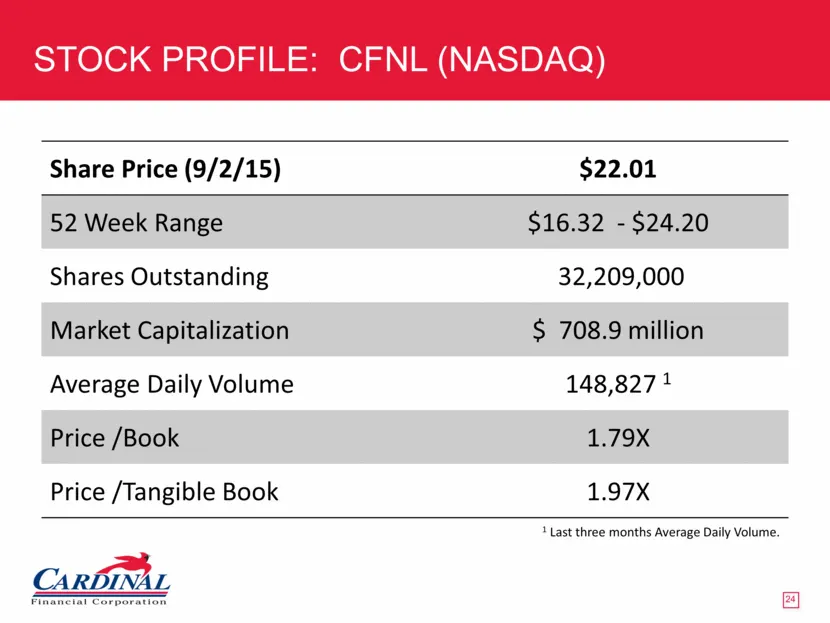
STOCK PROFILE: CFNL (NASDAQ) Share Price (9/2/15) $22.01 52 Week Range $16.32 - $24.20 Shares Outstanding 32,209,000 Market Capitalization $ 708.9 million Average Daily Volume 148,827 1 Price /Book 1.79X Price /Tangible Book 1.97X 1 Last three months Average Daily Volume.
Slide 26: Our Operating Philosophy: Aggressive on Sales, Conservative on Risk
Our Operating Philosophy: Aggressive on Sales, CONSERVATIVE ON RISK
Slide 27: Appendix A: Peer Comparisons
APPENDIX A Peer Comparisons
Slide 28: Regional Peer Group
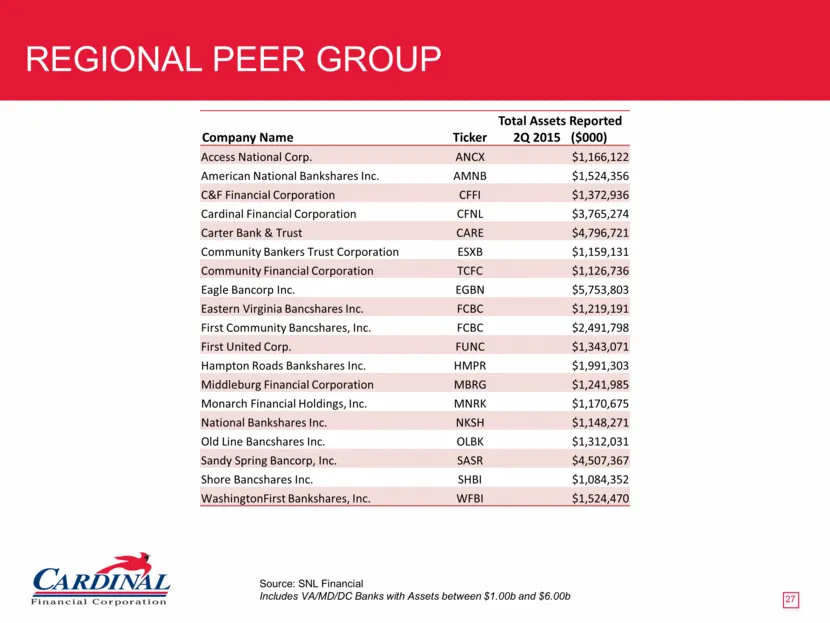
Regional Peer Group Company Name Ticker Total Assets Reported 2Q 2015 ($000) Access National Corp. ANCX $1,166,122 American National Bankshares Inc. AMNB $1,524,356 C&F Financial Corporation CFFI $1,372,936 Cardinal Financial Corporation CFNL $3,765,274 Carter Bank & Trust CARE $4,796,721 Community
Slide 29: National Peer Group
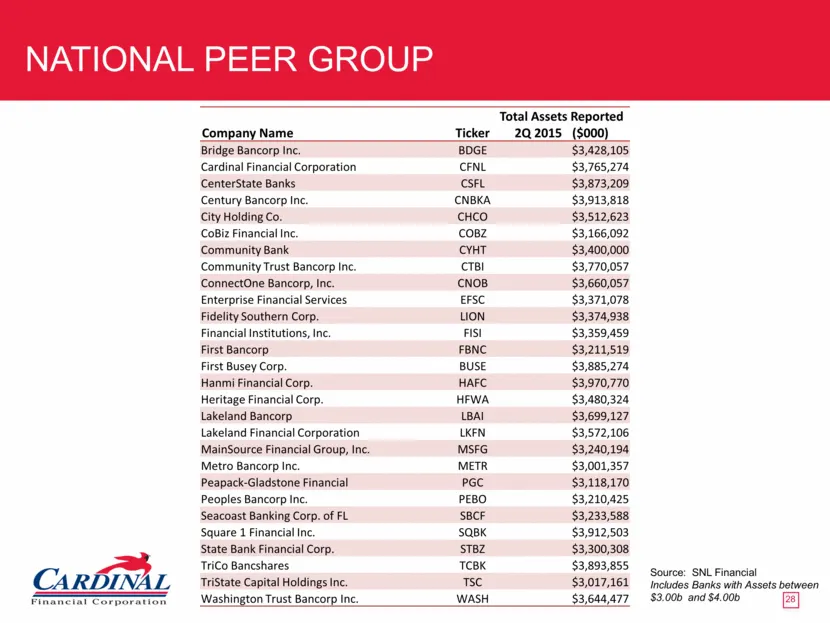
National Peer Group Company Name Ticker Total Assets Reported 2Q 2015 ($000) Bridge Bancorp Inc. BDGE $3,428,105 Cardinal Financial Corporation CFNL $3,765,274 CenterState Banks CSFL $3,873,209 Century Bancorp Inc. CNBKA $3,913,818 City Holding Co. CHCO $3,512,623 CoBiz Financial Inc. COBZ $3,166,09
Slide 30: Credit Quality Ranking
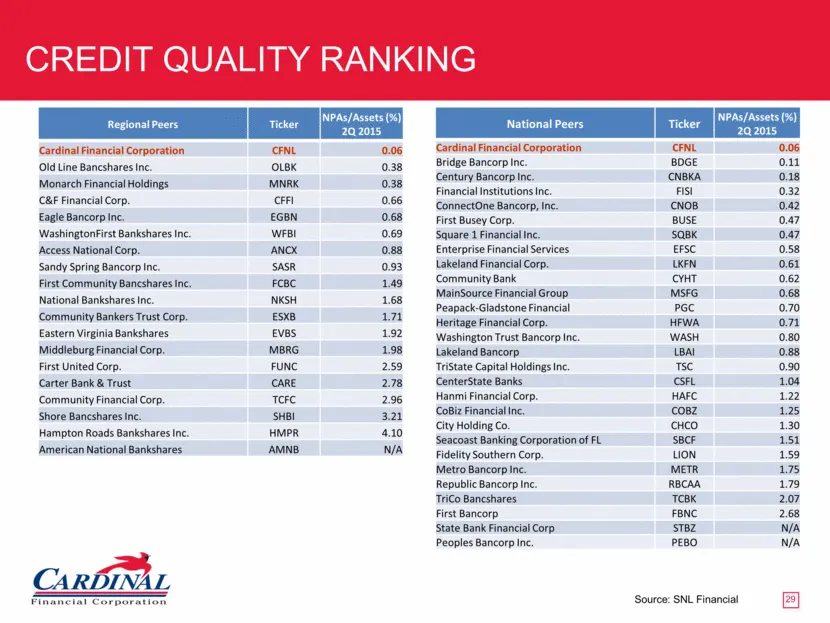
Credit Quality Ranking Source: SNL Financial National Peers Ticker NPAs/Assets (%) 2Q 2015 Cardinal Financial Corporation CFNL 0.06 Bridge Bancorp Inc. BDGE 0.11 Century Bancorp Inc. CNBKA 0.18 Financial Institutions Inc. FISI 0.32 ConnectOne Bancorp, Inc. CNOB 0.42 First Busey Corp. BUSE 0.47 Squar
Slide 31: Raymond James 2015 U.S. Bank Conference
Raymond James 2015 U.S. Bank Conference September 9, 2015 CARDINAL FINANCIAL CORPORATION
Source: SEC EDGAR · 8-K filed Sep 9, 2015
More decks from Cardinal Financial Corp
 Merger or Acquisition (August 2016)10 slides · Aug 18, 2016
 KBW Winter Financial Services Symposium 201633 slides · Feb 11, 2016
 Boenning & Scattergood Field Trip (November 2015)31 slides · Nov 2, 2015
 Keefe, Bruyette & Woods 2015 Community Bank Investor Conference31 slides · Jul 28, 2015
 34th Annual Raymond James Institutional Investors Conference 201529 slides · Mar 3, 2015
 Sandler O'Neill East Coast Financial Services Conference 201428 slides · Nov 13, 2014