WellCare Health Plans — Q4 2014 Earnings Presentation
10 slides from WellCare Health Plans's earnings presentation, Feb 11, 2015

Slide 1: Fourth Quarter 2014 Financial Results and Outlook Update
WAwellCare es Health Plans Fourth Quarter 2014 Financial Results and Outlook Update WellCare Health Plans, Inc. February 11, 2015
Slide 2: Cautionary Statement
Cautionary Statement This presentation contains “forward-looking” statements that are made pursuant to the safe harbor provisions of the Private Securities Litigation Reform Act of 1995. Statements that are predictive in nature, that depend upon or refer to future events or conditions, or that inclu
Slide 3: Basis of Presentation
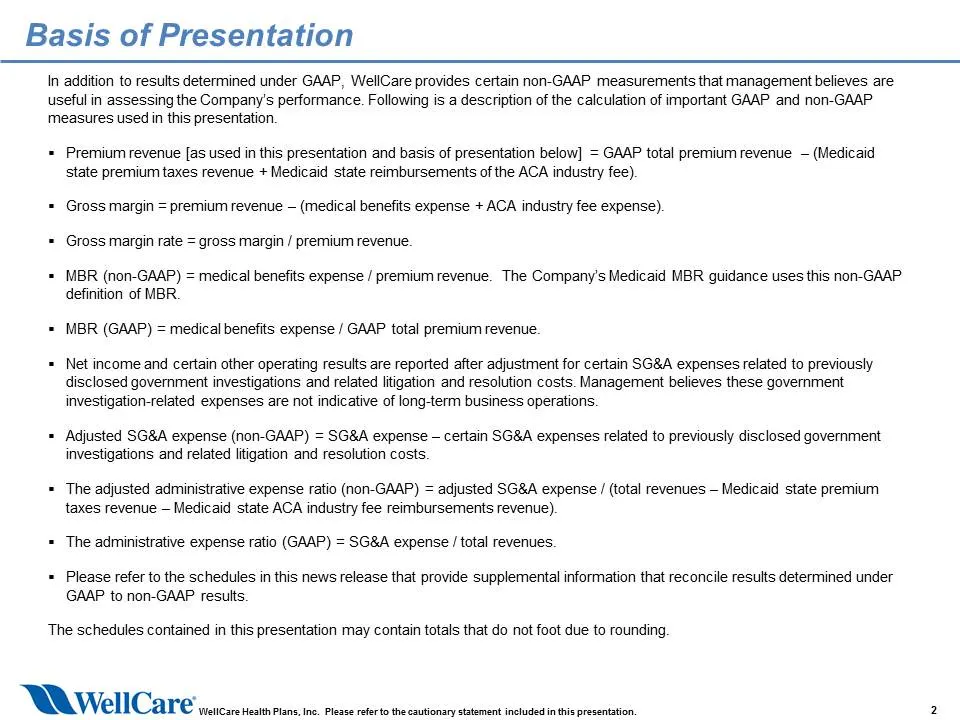
Basis of Presentation In addition to results determined under GAAP, WellCare provides certain non-GAAP measurements that management believes are useful in assessing the Company's performance. Following is a description of the calculation of important GAAP and non-GAAP measures used in this presentat
Slide 4: Fourth Quarter 2014 Results
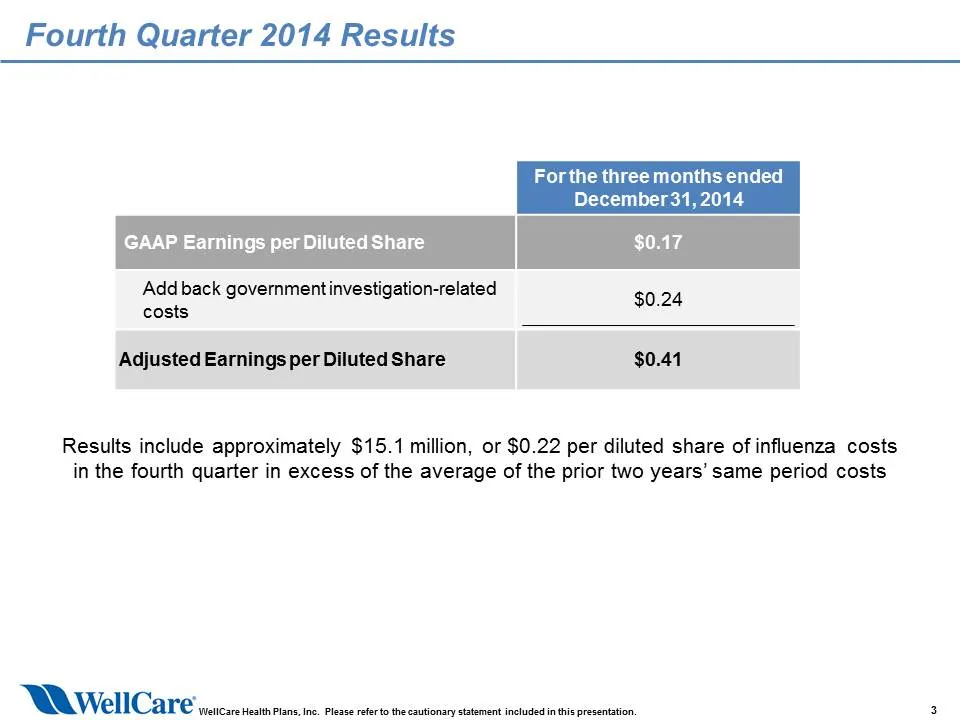
Fourth Quarter 2014 Results For the three months ended December 31,2014 $0.17 GAAP Earnings Add back governmentinvestigation-related $0.24 costs : Adjusted Earnings per Diluted Share $0.41 Results include approximately $15.1 million, or $0.22 per diluted share of influenza costs in the fourth quarte
Slide 5: 2014 Claims Reserves Development
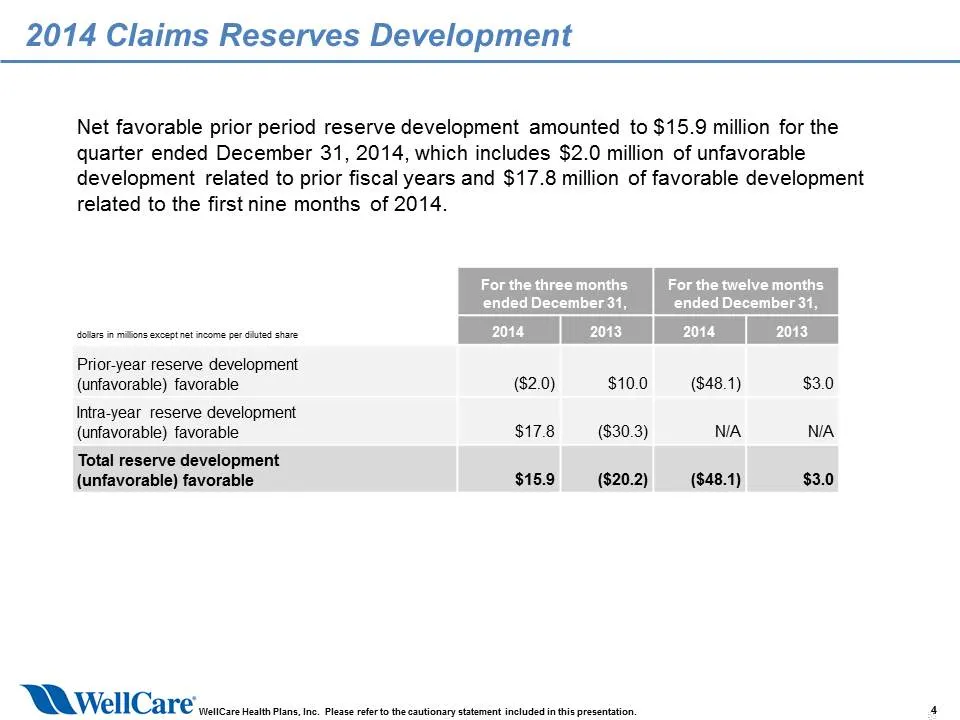
2014 Claims Reserves Development Net favorable prior period reserve development amounted to $15.9 million for the quarter ended December 31, 2014, which includes $2.0 million of unfavorable development related to prior fiscal years and $17.8 million of favorable development related to the first nine
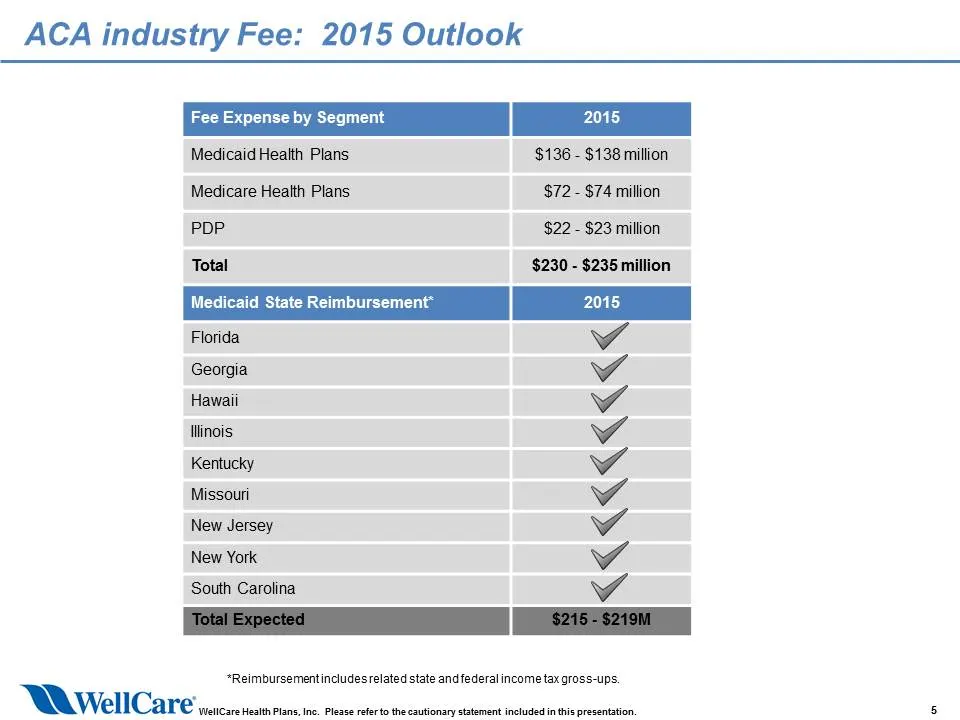
Slide 6: ACA Industry Fee: 2015 Outlook
ACA industry Fee: 2015 Outlook Fee Expense by Segment 2015 “Medicaid Health Plans $136 - $138 million Medicare Heath Plans $72- $74 millon PDP $22 - $23 million Total $230 - $235 million Florida Georgia Hawaii linois Kentucky Missouri 5 a fosssssss *Reimbursementincludes related state and federal in
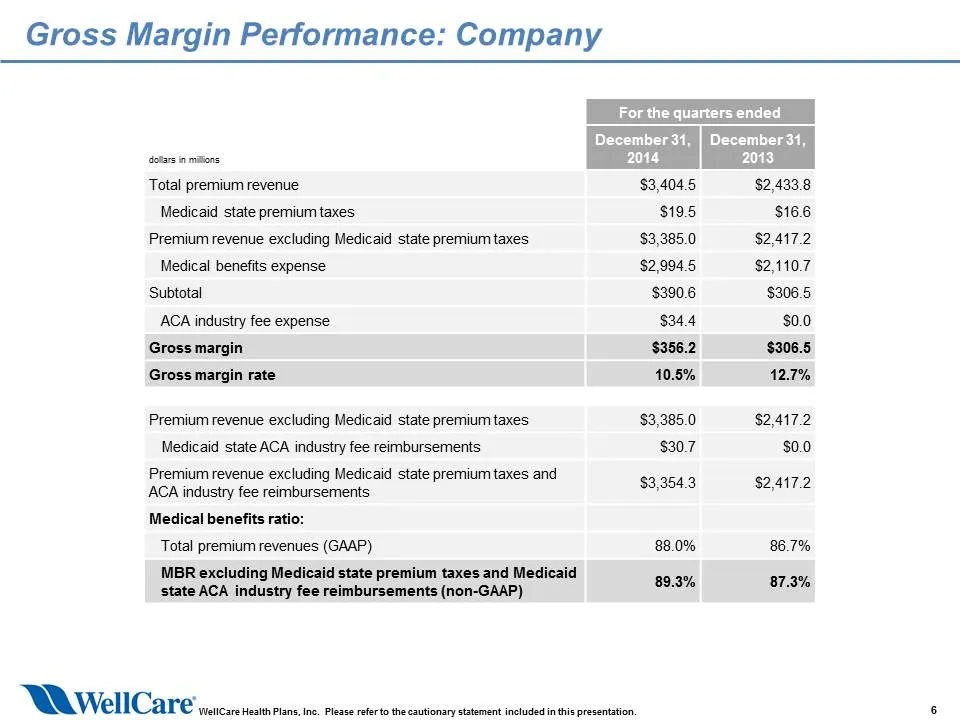
Slide 7: Gross Margin Performance: Company
Gross Margin Performance: Company December 31, | December 31, dollars in miions, 204: 2013 Total premium revenue Medicaid state premium taxes Premium revenue excluding Medicaid state premium taxes Medical benefits expense Subtotal ACA industry fee expense Gross margin Gross margin rate Premium reven
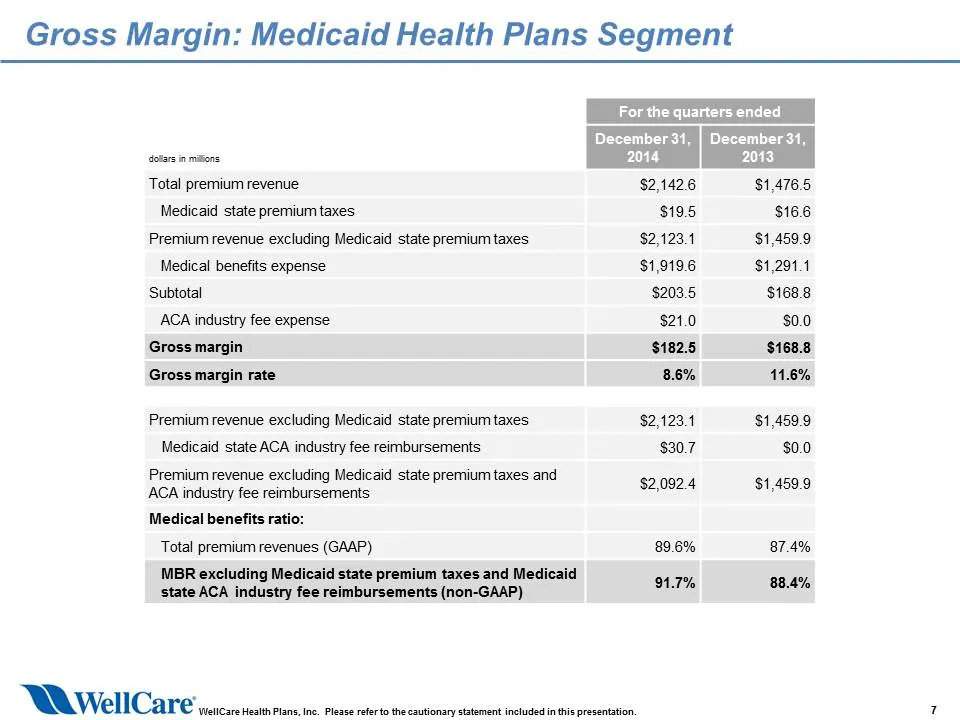
Slide 8: Gross Margin: Medicaid Health Plans Segment
Gross Margin: Medicaid Health Plans Segment ended dota a igons 2014 2013 Total premium revenue $2,1426 $1,476.5 Medicaid state premium taxes $195 $16.6 Premium revenue excluding Medicaid state premium taxes $2,123.41 $1,459.9 Medical benefits expense $1,919.6 $1,291.41 Subtotal $203.5 $1688 ACA indu
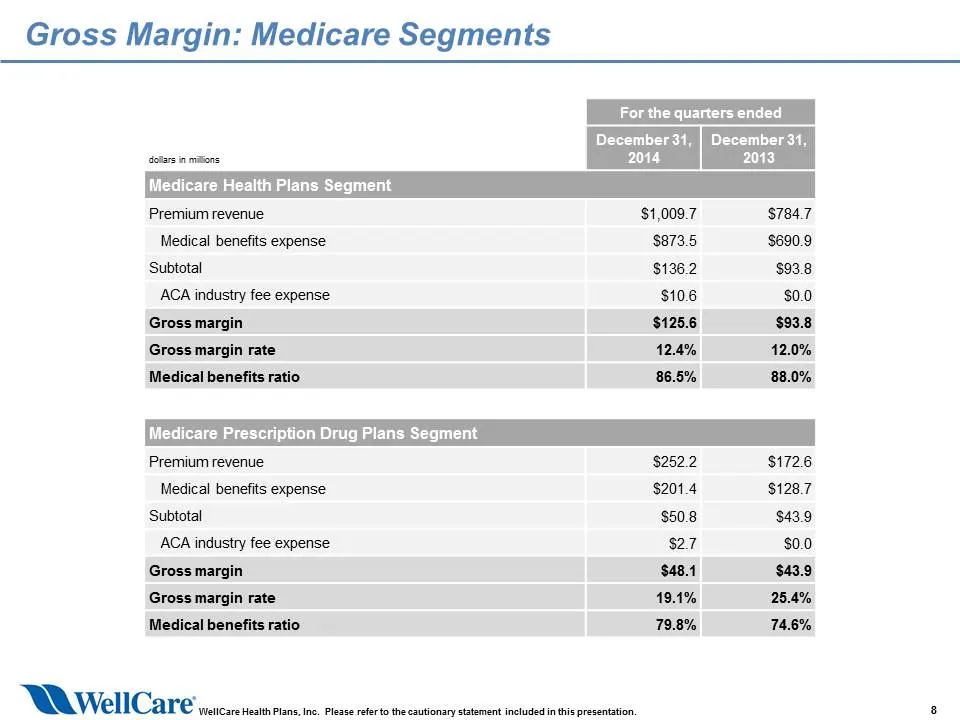
Slide 9: Gross Margin: Medicare Segments
Gross Margin: Medicare Segments For the quarters ended December 31, | December3 dot in itlons 2014 2013 Medicare Health Plans Segment Premium revenue $1,009.7 $784.7 Medical benefits expense $873.5 $690.9 ‘Subtotal, $136.2 $93.8 ACA industry fee expense $10.6 $0.0 Gross margin $125.6 $93.8 Gross mar
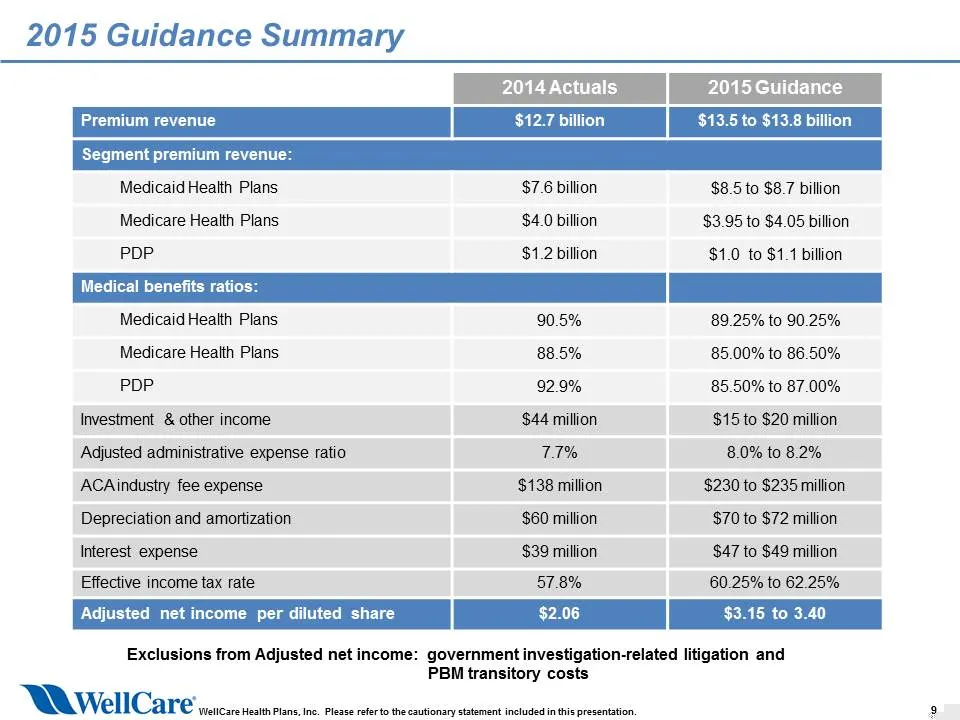
Slide 10: 2015 Guidance Summary
2015 Guidance Summary 2014 Actuals 2015 Guidance Segment premium revenue: Medicaid Health Plans $7.6 billion $8.5 to $87 billion Medicare Health Plans $4.0 billion $3.95 to $4.05 billion PDP $1.2 billion $1.0 to $1.1 billion Medical benefits ratios: | Medicaid Health Plans 89.25% to 90.25% Medicare
Source: SEC EDGAR · 8-K filed Feb 11, 2015
More decks from WellCare Health Plans Inc
 Wellcare — Investor Presentation (2026)13 slides · Oct 29, 2026
 WellCare of Kentucky — Provider Summit 202618 slides · Apr 3, 2026
 Wellcare — Investor Presentation (September 2025)13 slides · September 2025
 Wellcare — Investor Presentation (2025)78 slides · Jun 12, 2025
 Wellcare — Investor Presentation (2025)13 slides · Feb 8, 2025
 Wellcare — Investor Presentation (2025)13 slides · 2025