Emergent Metals Corp · TSXV:EMR
Emergent Metals — Investor Presentation (March 2022)
56 slides from Emergent Metals's investor presentation, March 2022

Slide 1: Creating Value Through Strategic Acquisitions and Exploration in Nevada & Quebec
CREATING VALUE THROUGH STRATEGIC ACQUISITIONS AND EXPLORATION IN NEVADA & QUEBEC MARCH 2022
Slide 2: Forward-Looking Statements
FORWARD-LOOKING STATEMENTS Forward-looking statements relate to future events or the anticipated performance of the Company and reflect management’s expectations or beliefs regarding such future events and anticipated performance. In certain cases, forward-looking statements can be identified by the
Slide 3: A&D Business Model
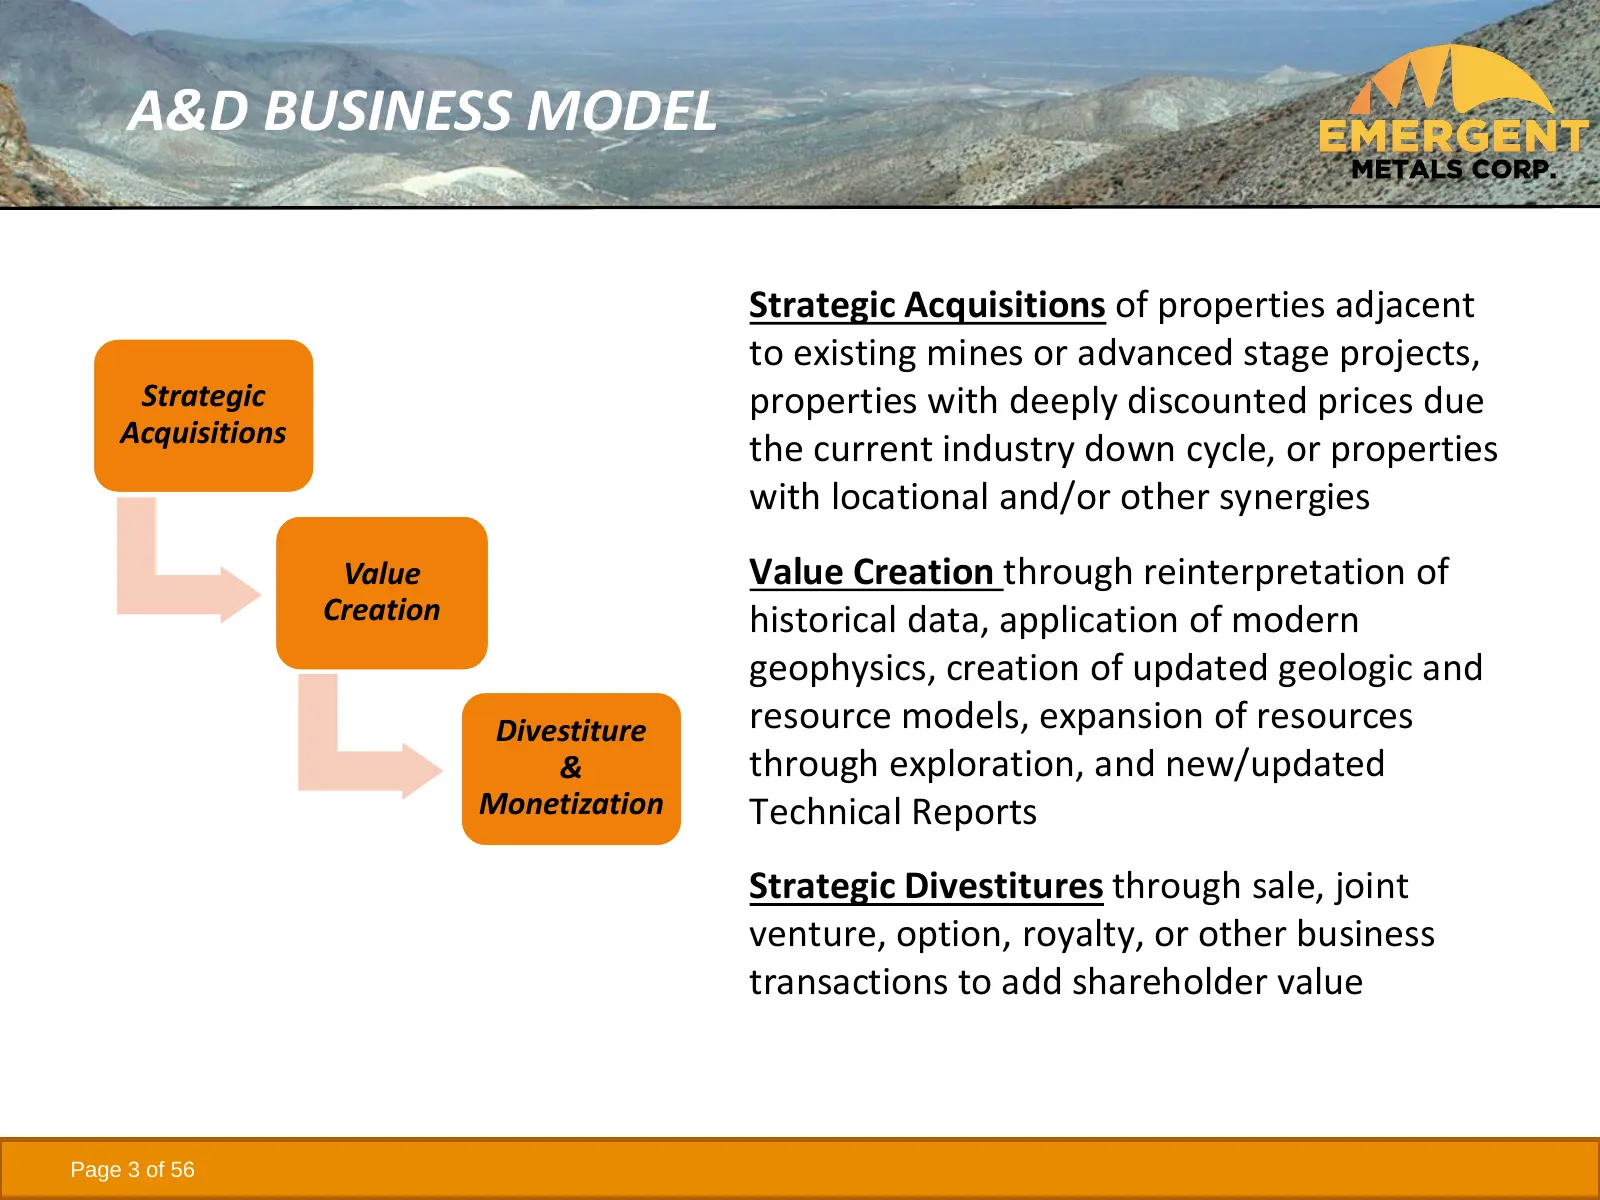
A&D BUSINESS MODEL Strategic Acquisitions of properties adjacent to existing mines or advanced stage projects, Strategic properties with deeply discounted prices due Acquisitions the current industry down cycle, or properties with locational and/or other synergies Value Value Creation through reinte
Slide 4: Singles, Doubles, Triples & Home Runs
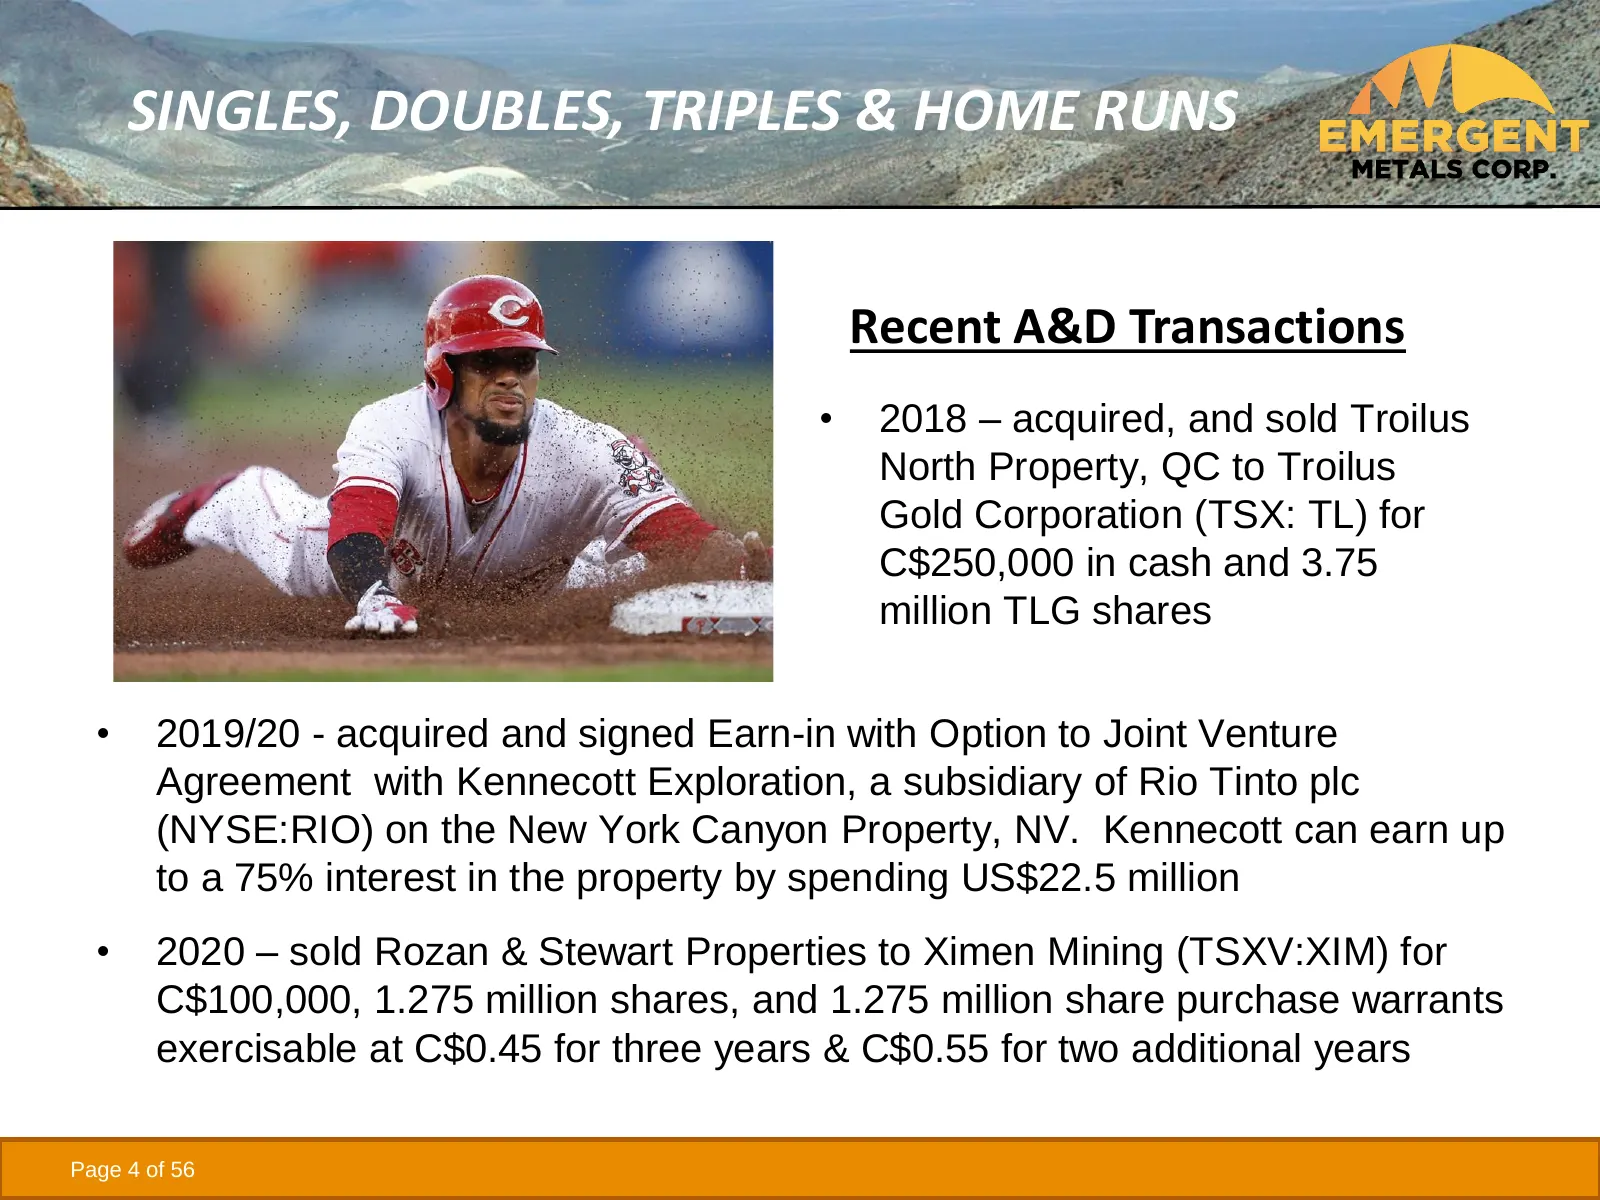
SINGLES, DOUBLES, TRIPLES & HOME RUNS Recent A&D Transactions • 2018 – acquired, and sold Troilus North Property, QC to Troilus Gold Corporation (TSX: TL) for C$250,000 in cash and 3.75 million TLG shares • 2019/20 - acquired and signed Earn-in with Option to Joint Venture Agreement with Kennecott E
Slide 5: Why Nevada and Quebec?
WHY NEVADA AND QUEBEC? • Stable permitting, exploration, and mining jurisdictions • World class deposits and mines • NV is ranked #1 and QC is ranked #6 in Fraser Institute’s 2020 Survey of Mining Companies for attractiveness of investment • In 2020, NV produced 4.6 M oz Au, 79% of US production • I
Slide 6: Nevada
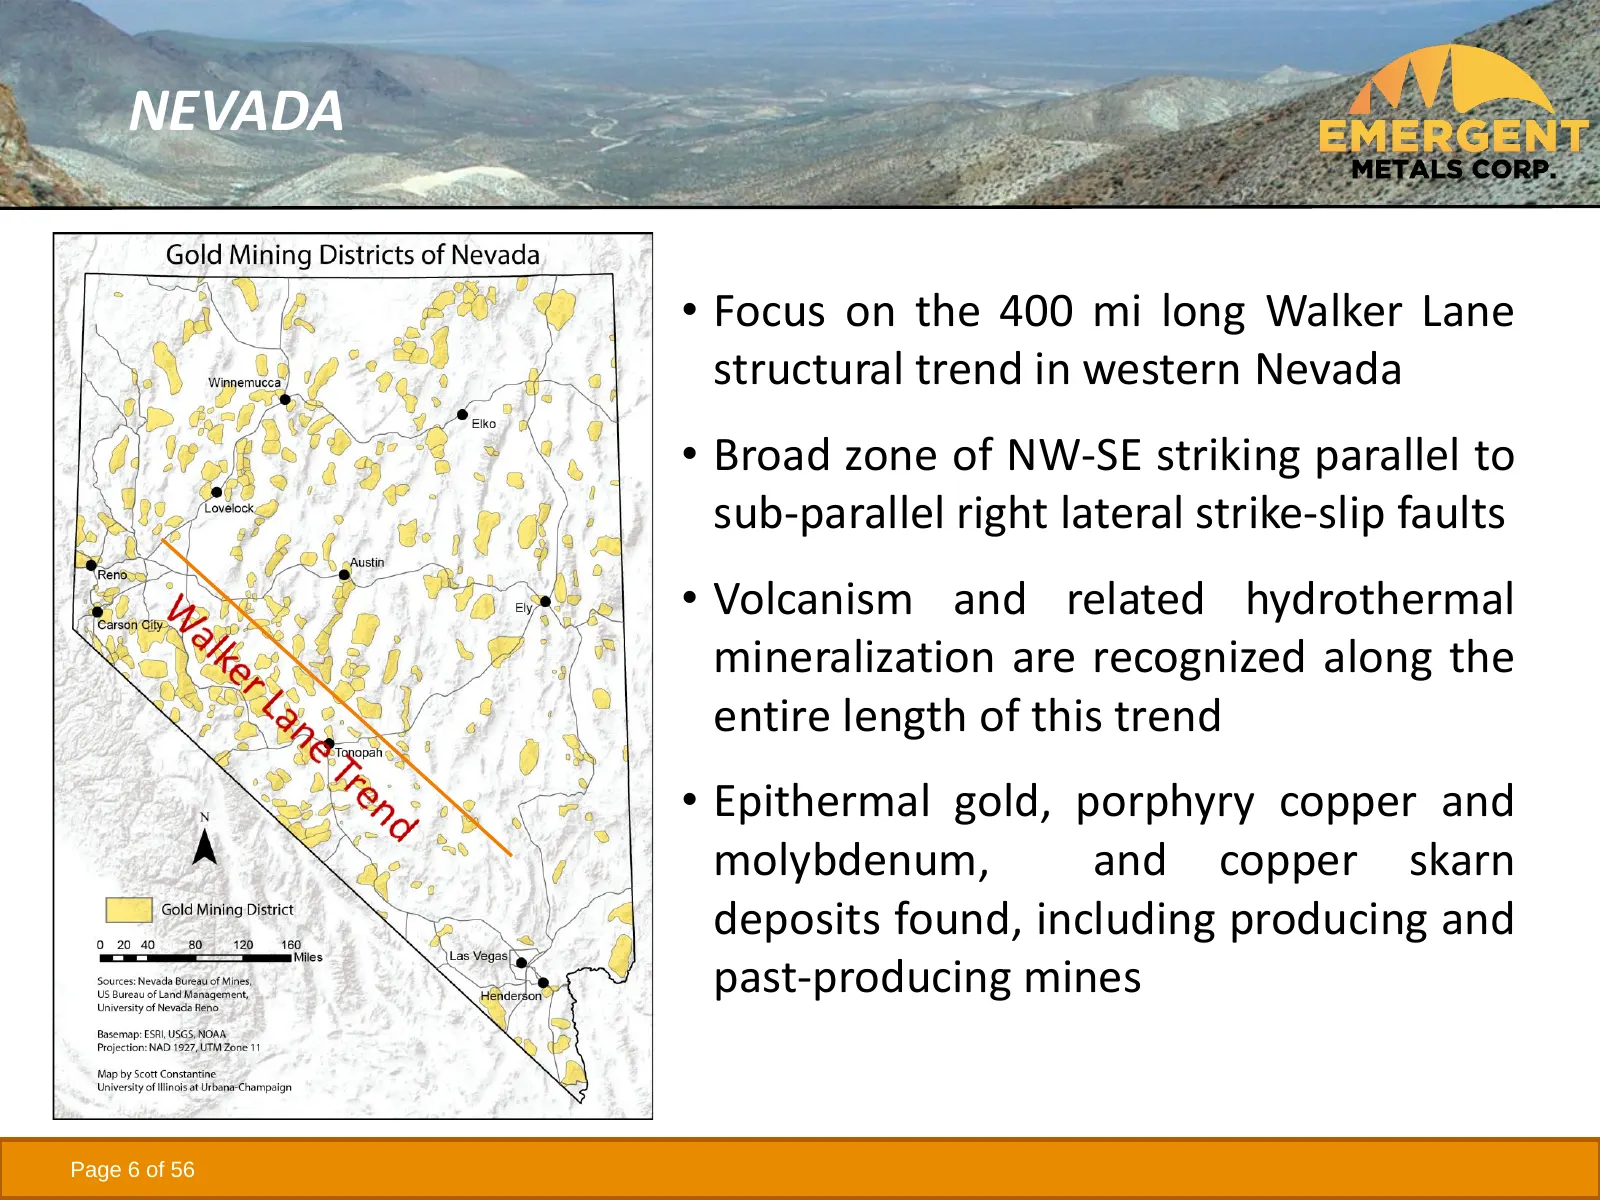
NEVADA • Focus on the 400 mi long Walker Lane structural trend in western Nevada • Broad zone of NW-SE striking parallel to sub-parallel right lateral strike-slip faults • Volcanism and related hydrothermal mineralization are recognized along the entire length of this trend • Epithermal gold, porphy
Slide 7: Emergent's Nevada Properties
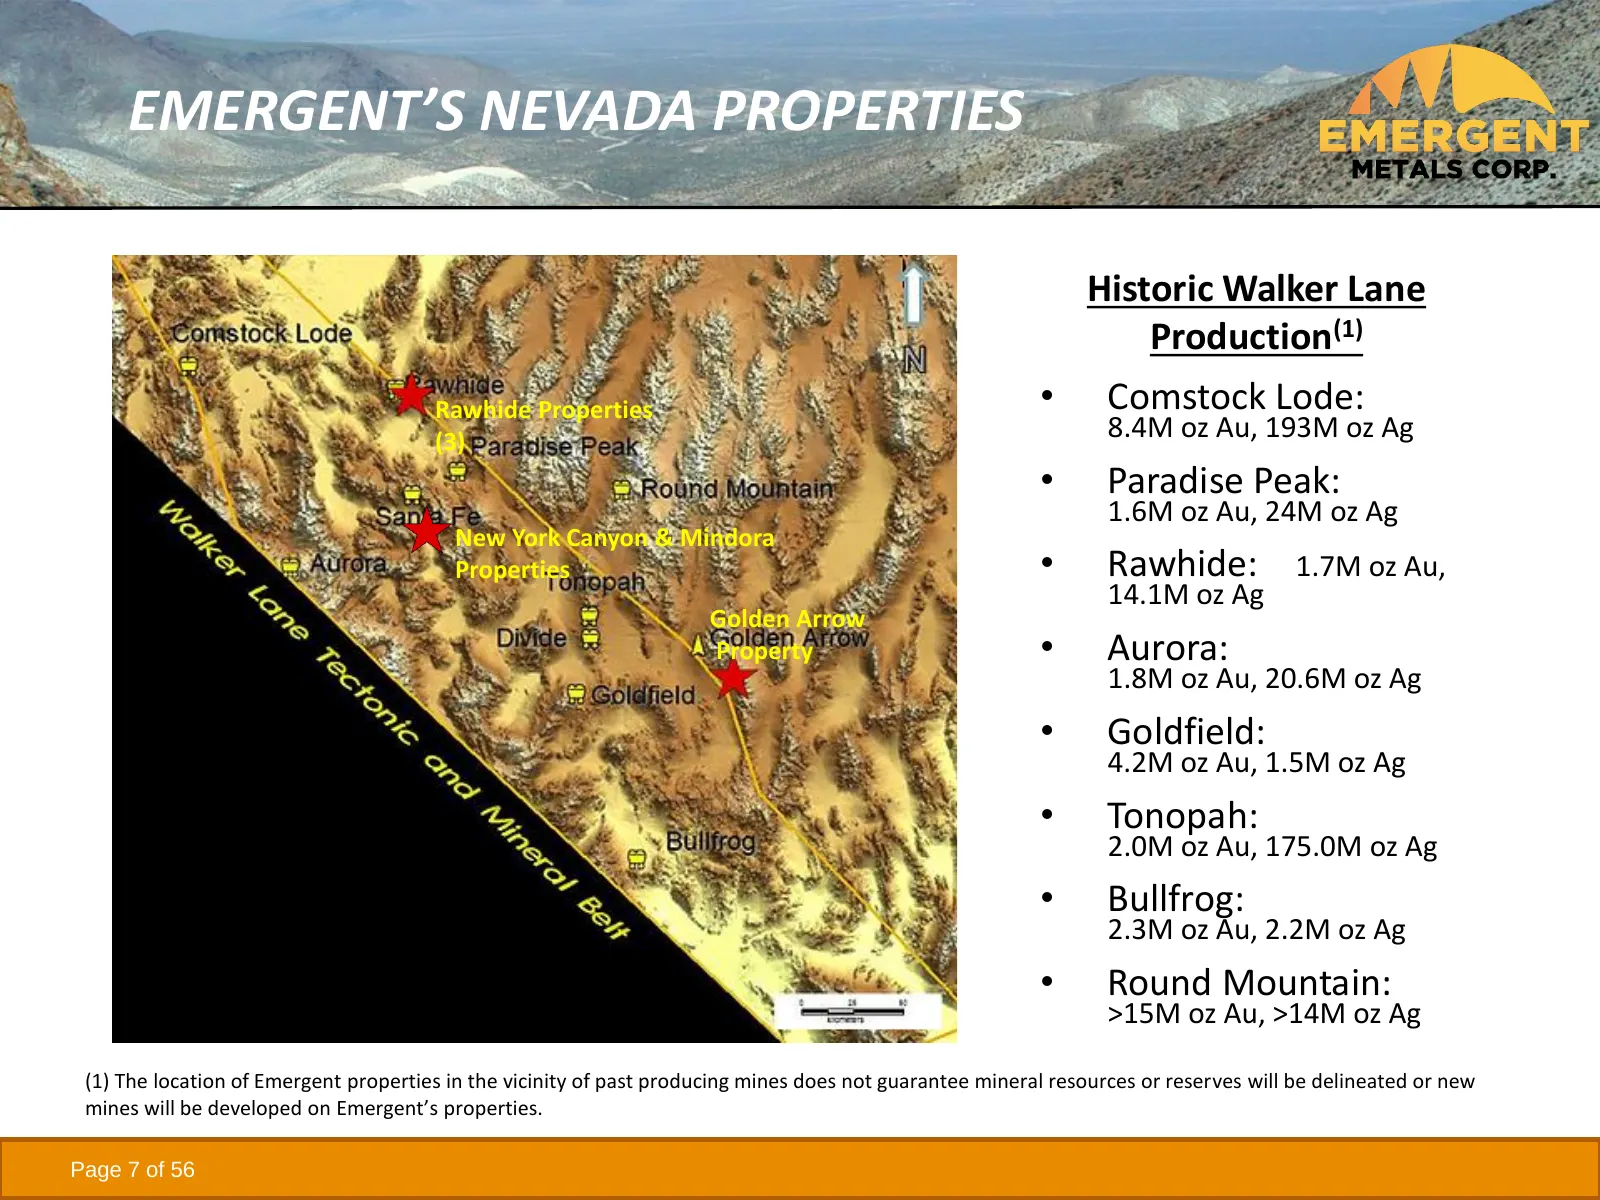
EMERGENT’S NEVADA PROPERTIES Historic Walker Lane Production(1) Rawhide Properties • Comstock Lode: (3) 8.4M oz Au, 193M oz Ag • Paradise Peak: 1.6M oz Au, 24M oz Ag New York Canyon & Mindora Properties • Rawhide: 1.7M oz Au, 14.1M oz Ag Golden Arrow Property • Aurora: 1.8M oz Au, 20.6M oz Ag • Gold
Slide 8: Golden Arrow Property
GOLDEN ARROW PROPERTY • ~10,000 ac property consisting of 17 patented and 494 unpatented claims • Advanced stage property with a 296,500 oz Au and 4.0 million oz Ag M&I resource(1) and 2018 Technical Report(2) • Extensive exploration database with >200,000 ft of drilling • Plan of Operations and Env
Slide 9: Golden Arrow Exploration to Date
GOLDEN ARROW EXPLORATION TO DATE • 361 drill holes totaling just over 201,000 ft • Comprehensive soil and rock chip sampling database • Historic geophysics includes gravity, ground and aeromagnetic surveys, airborne EM, IP-resistivity, and radio-metrics • Orion 3D DCIP/MT geophysical survey by Quant
Slide 10: Golden Arrow Deposit Model
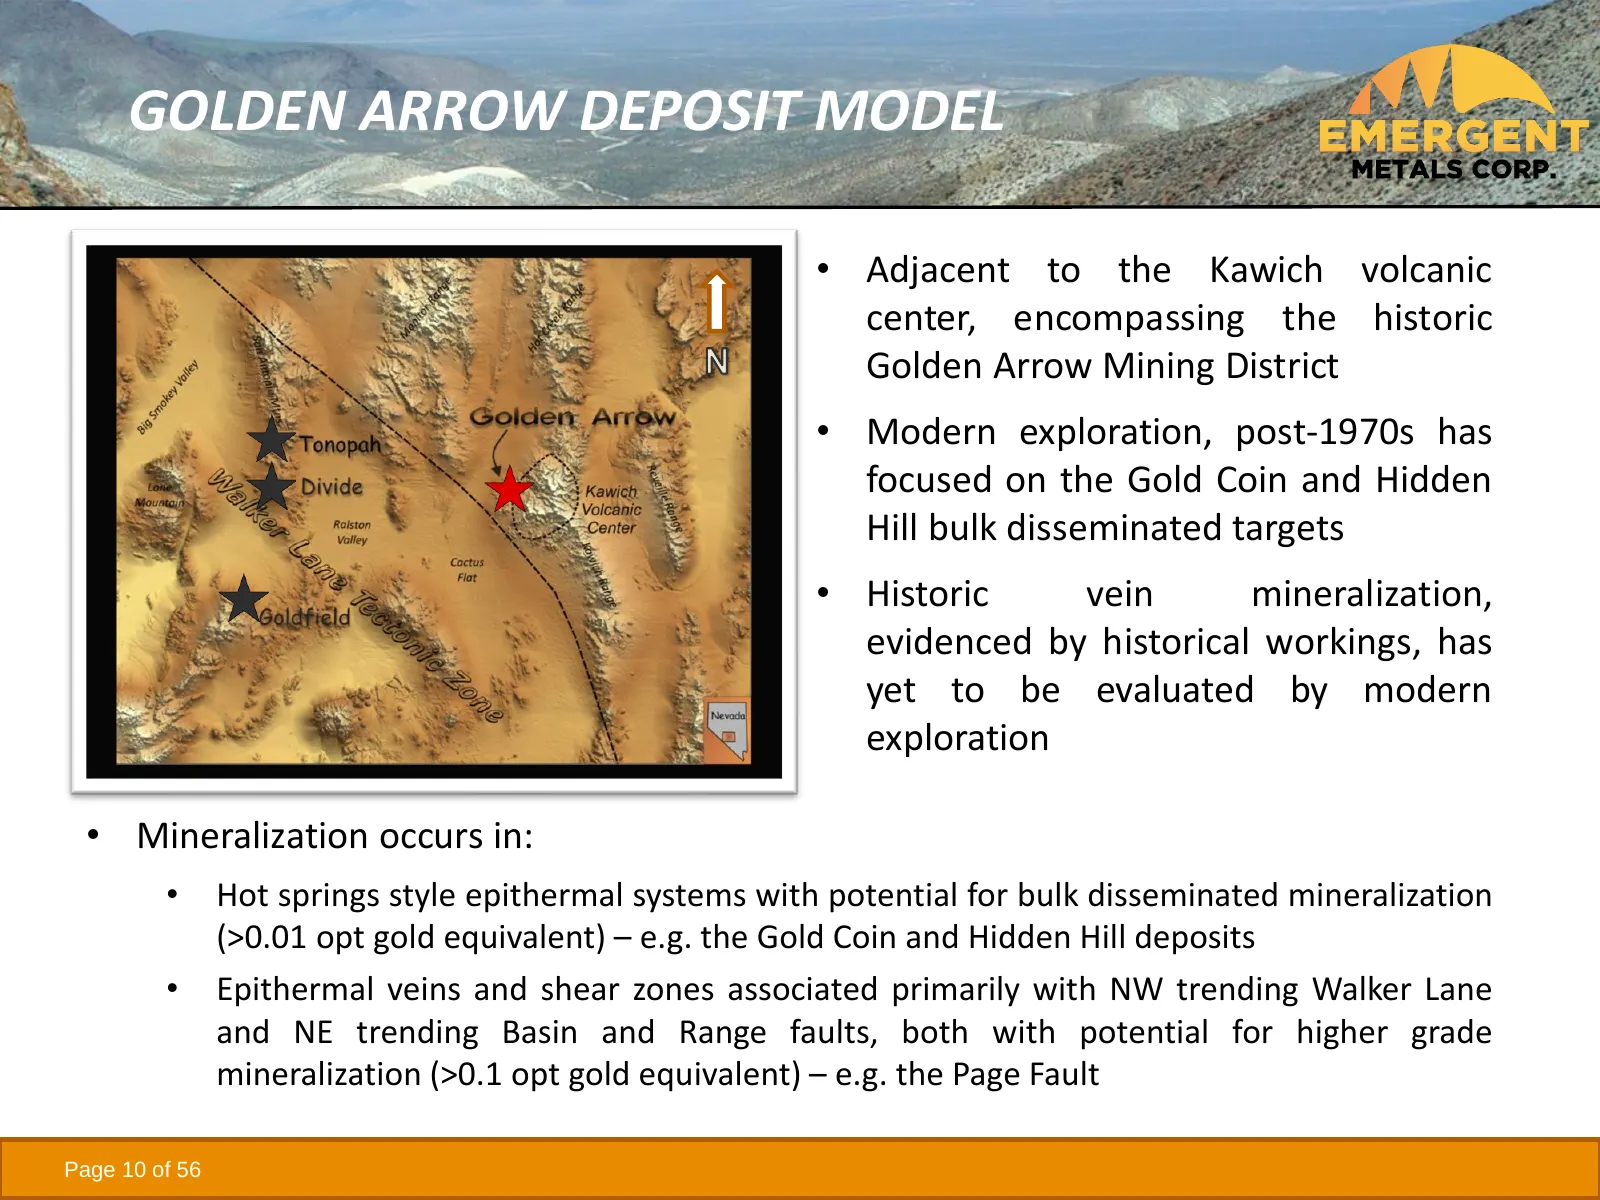
GOLDEN ARROW DEPOSIT MODEL • Adjacent to the Kawich volcanic center, encompassing the historic Golden Arrow Mining District • Modern exploration, post-1970s has focused on the Gold Coin and Hidden Hill bulk disseminated targets • Historic vein mineralization, evidenced by historical workings, has ye
Slide 11: Golden Arrow Geology (Plan View)
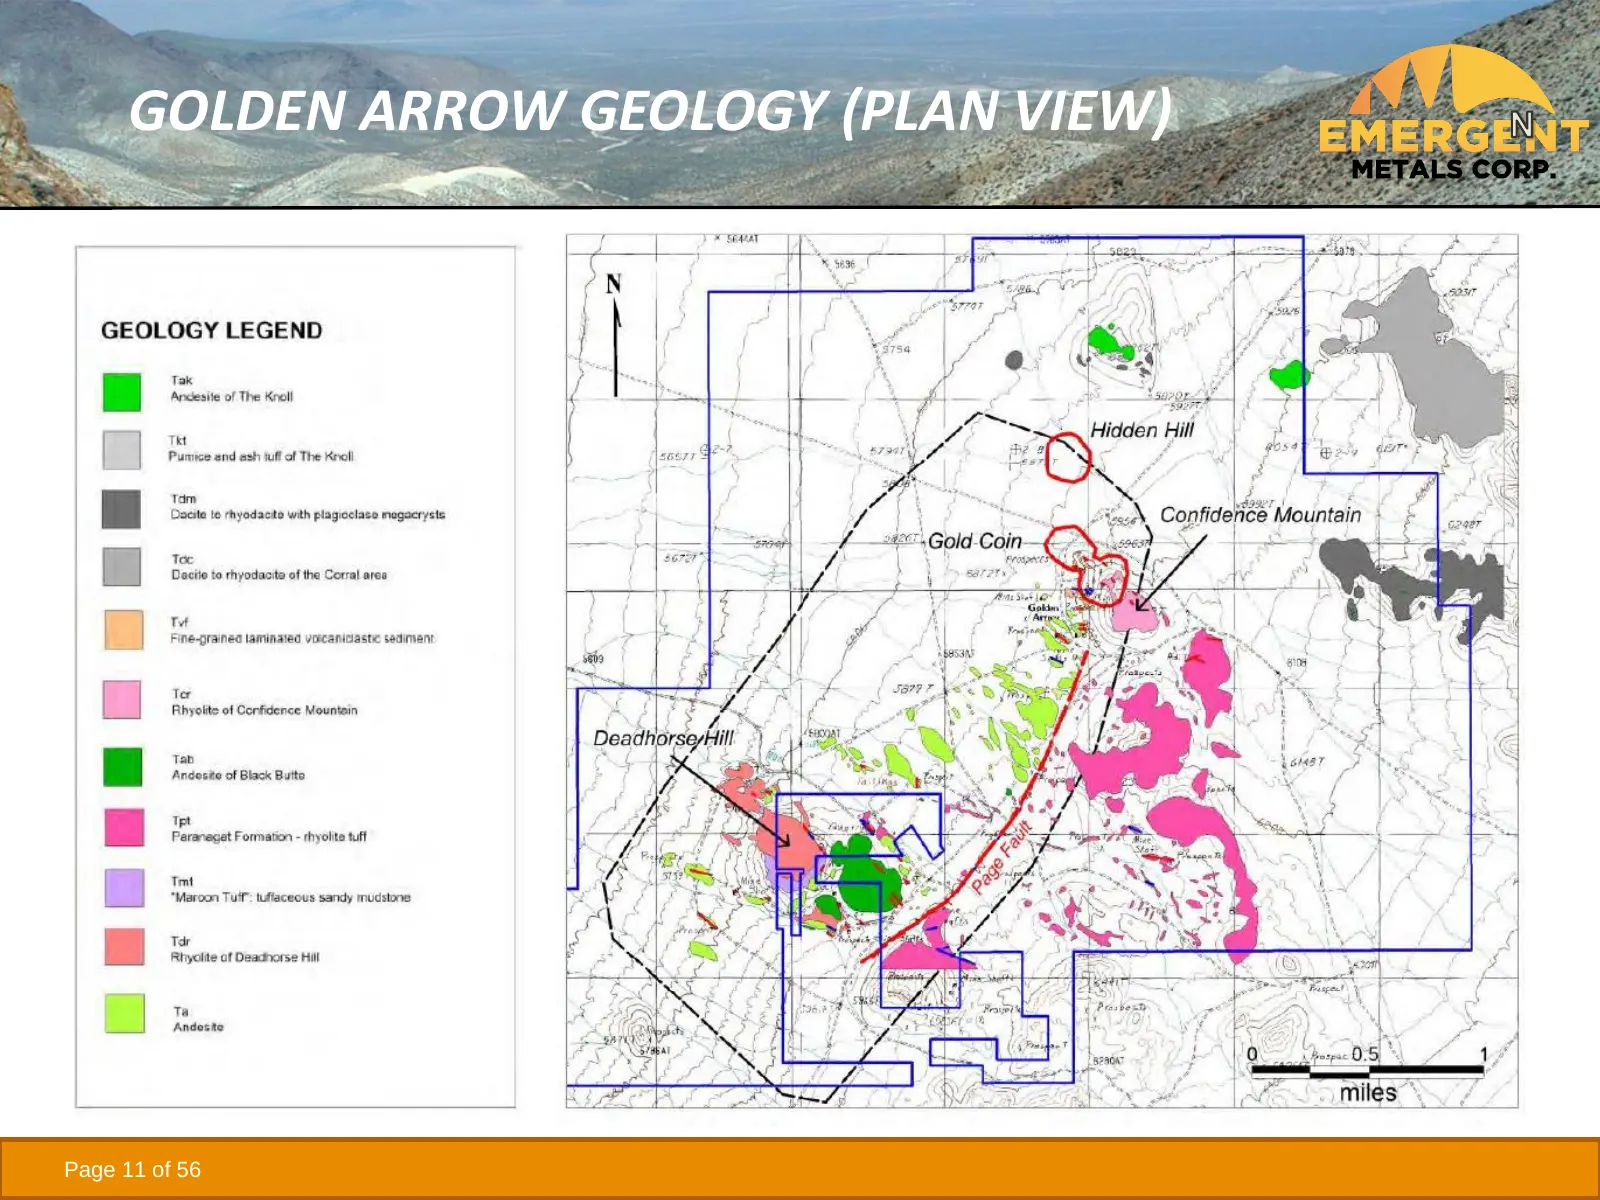
GOLDEN ARROW GEOLOGY (PLAN VIEW) CONFIDENCE MOUNTAIN DEADHORSE HILL Page 11 of 56
Slide 12: Golden Arrow Geology (X-Section)
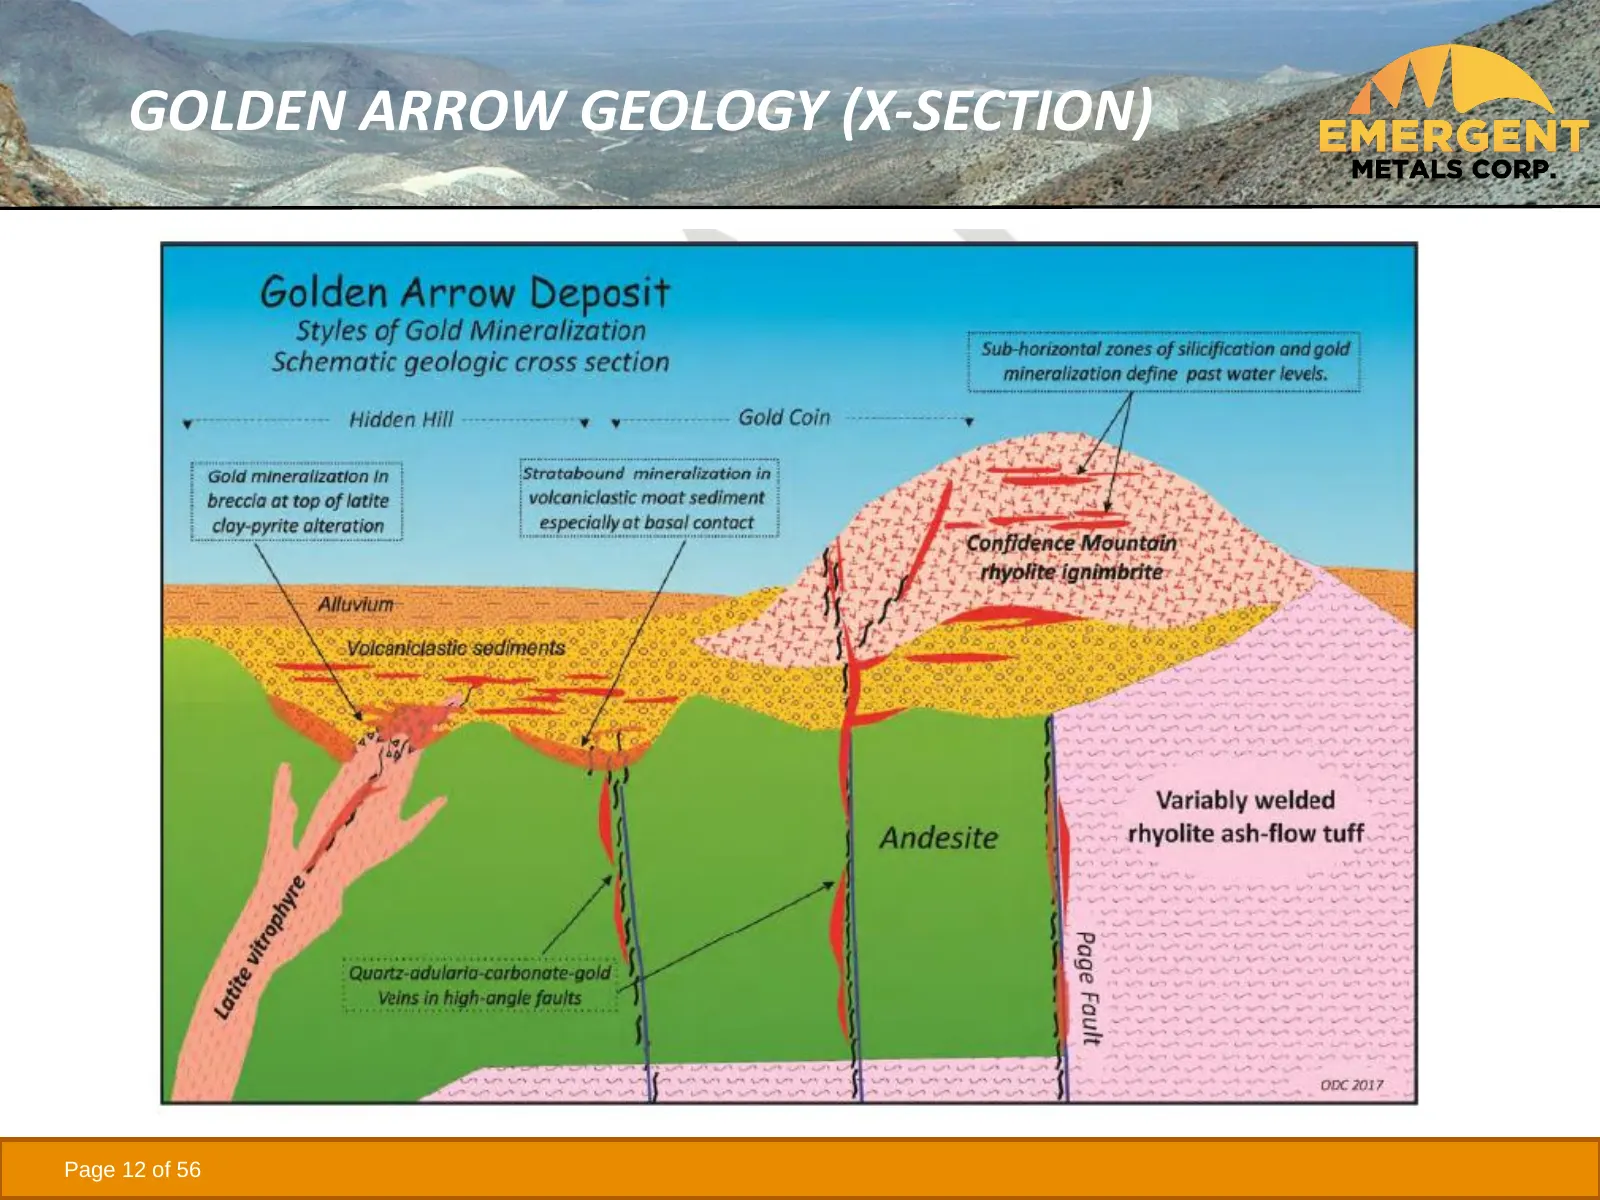
GOLDEN ARROW GEOLOGY (X-SECTION) Page 12 of 56
Slide 13: Golden Arrow Resource Model
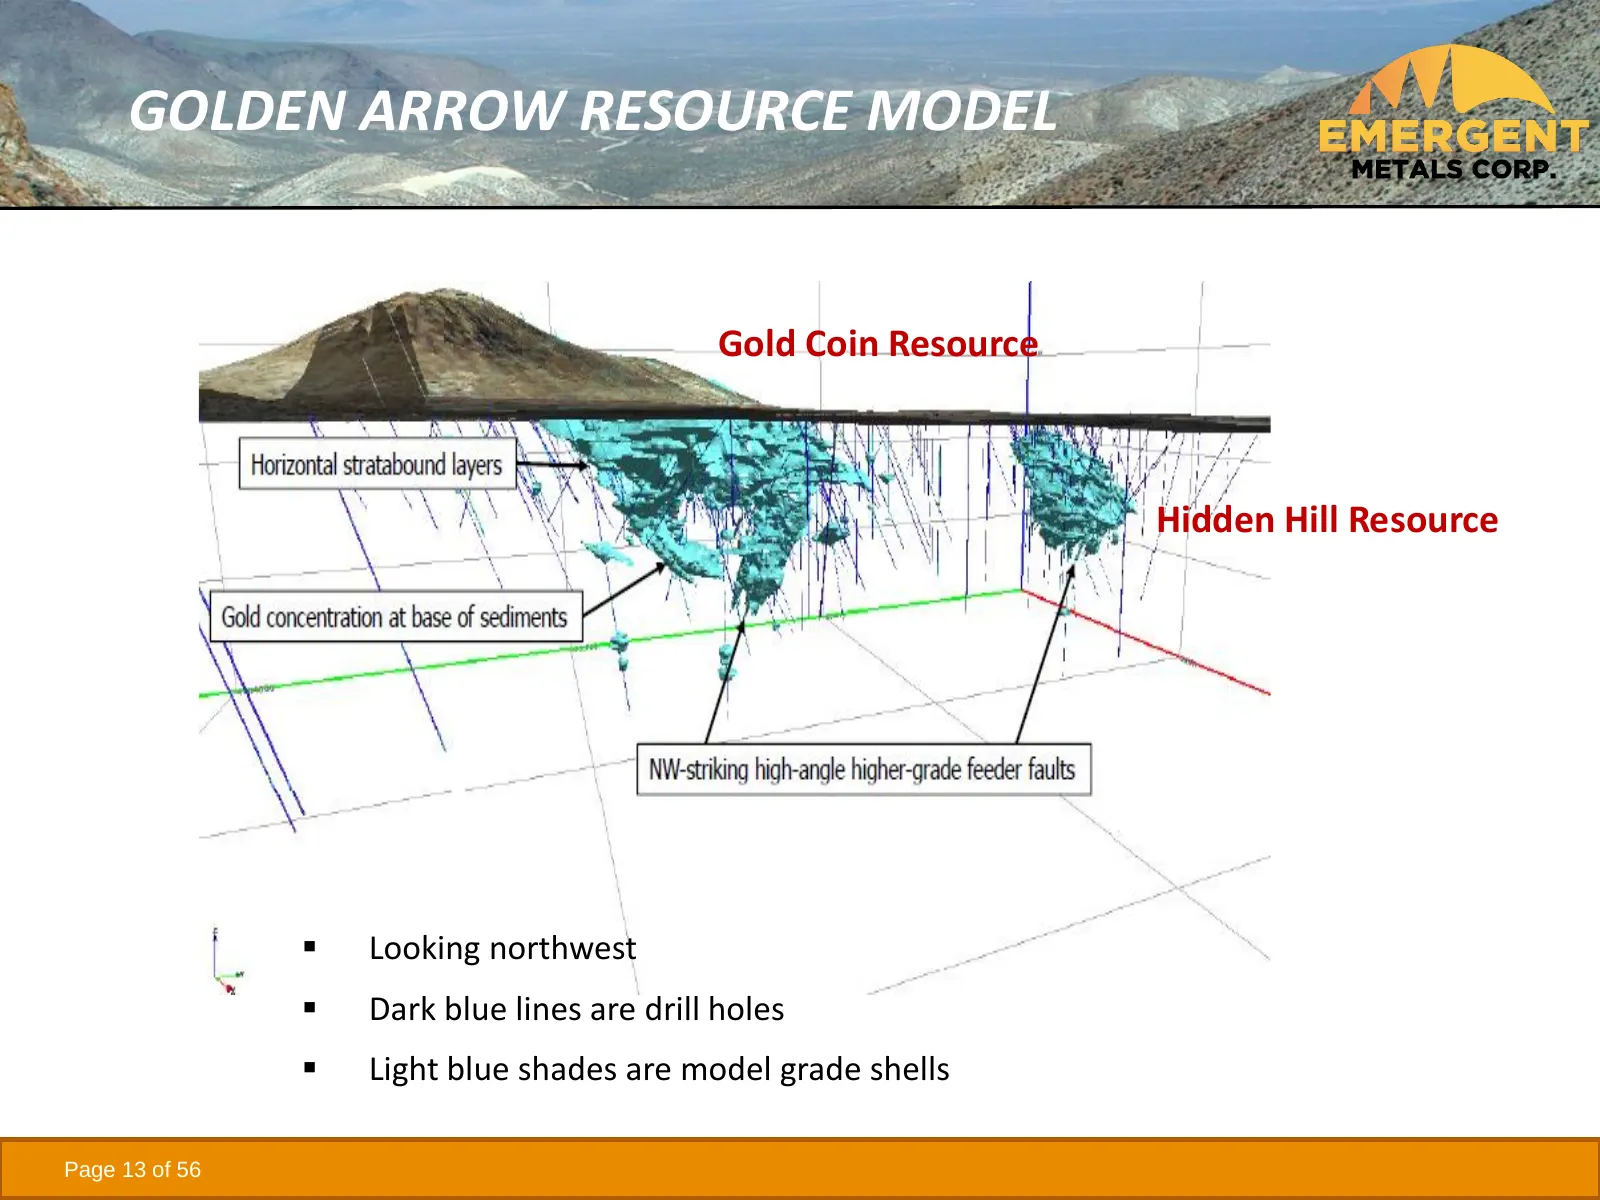
GOLDEN ARROW RESOURCE MODEL Gold Coin Resource Hidden Hill Resource ▪ Looking northwest ▪ Dark blue lines are drill holes ▪ Light blue shades are model grade shells Page 13 of 56
Slide 14: Golden Arrow 2018 Resource
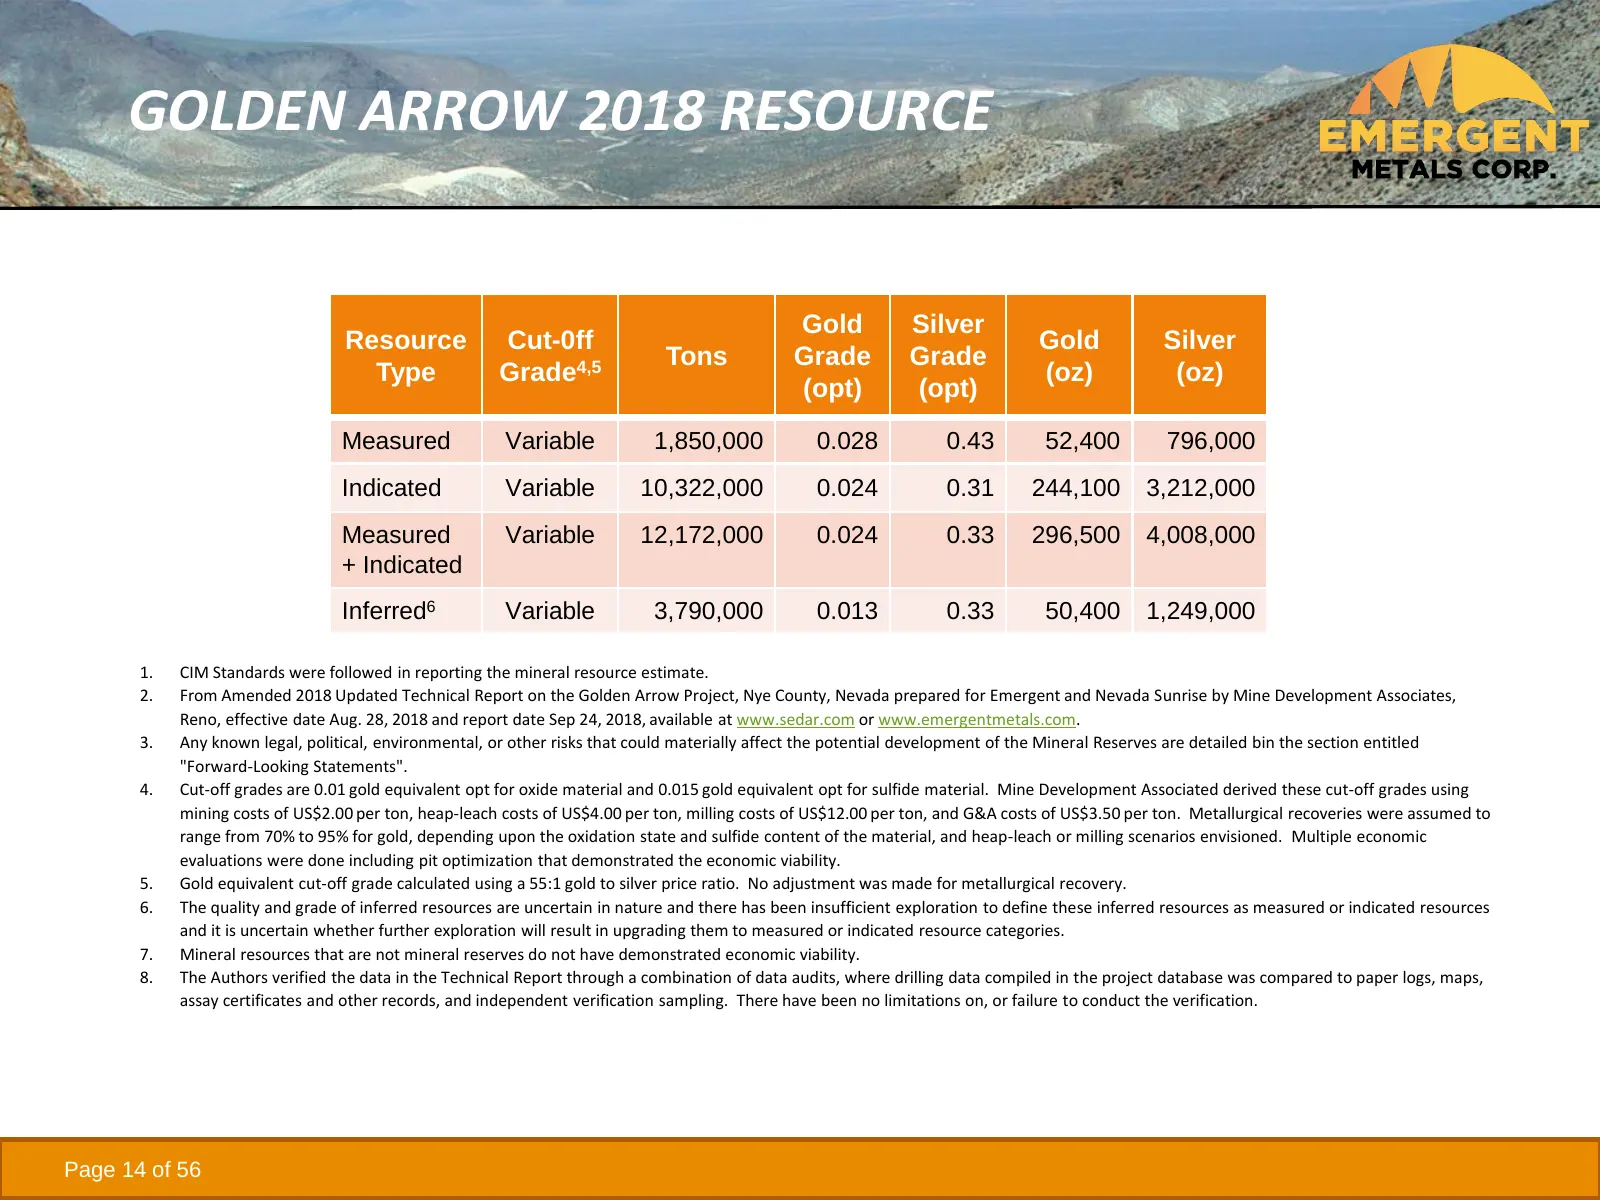
GOLDEN ARROW 2018 RESOURCE Gold Silver Resource Cut-0ff Gold Silver Tons Grade Grade Type Grade4,5 (oz) (oz) (opt) (opt) Measured Variable 1,850,000 0.028 0.43 52,400 796,000 Indicated Variable 10,322,000 0.024 0.31 244,100 3,212,000 Measured Variable 12,172,000 0.024 0.33 296,500 4,008,000 + Indica
Slide 15: Golden Arrow Drill Intercepts
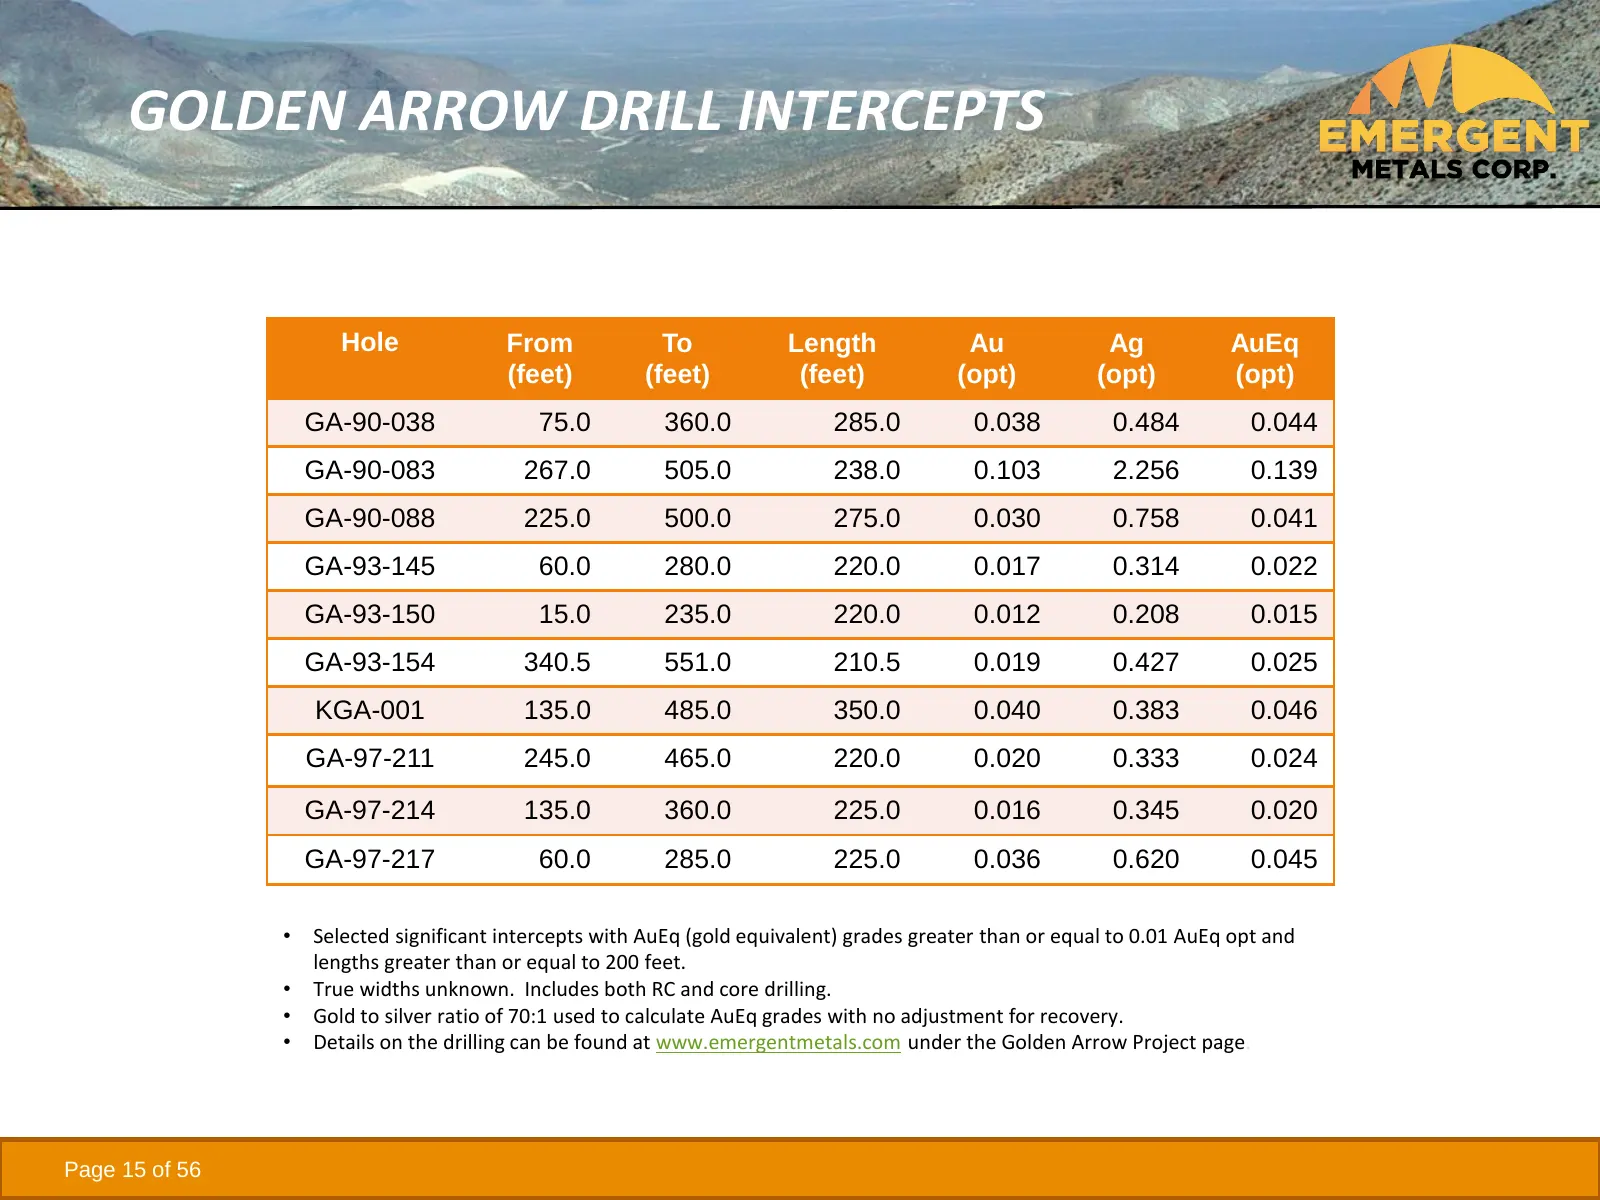
GOLDEN ARROW DRILL INTERCEPTS Hole From To Length Au Ag AuEq (feet) (feet) (feet) (opt) (opt) (opt) GA-90-038 75.0 360.0 285.0 0.038 0.484 0.044 GA-90-083 267.0 505.0 238.0 0.103 2.256 0.139 GA-90-088 225.0 500.0 275.0 0.030 0.758 0.041 GA-93-145 60.0 280.0 220.0 0.017 0.314 0.022 GA-93-150 15.0 235
Slide 16: New York Canyon
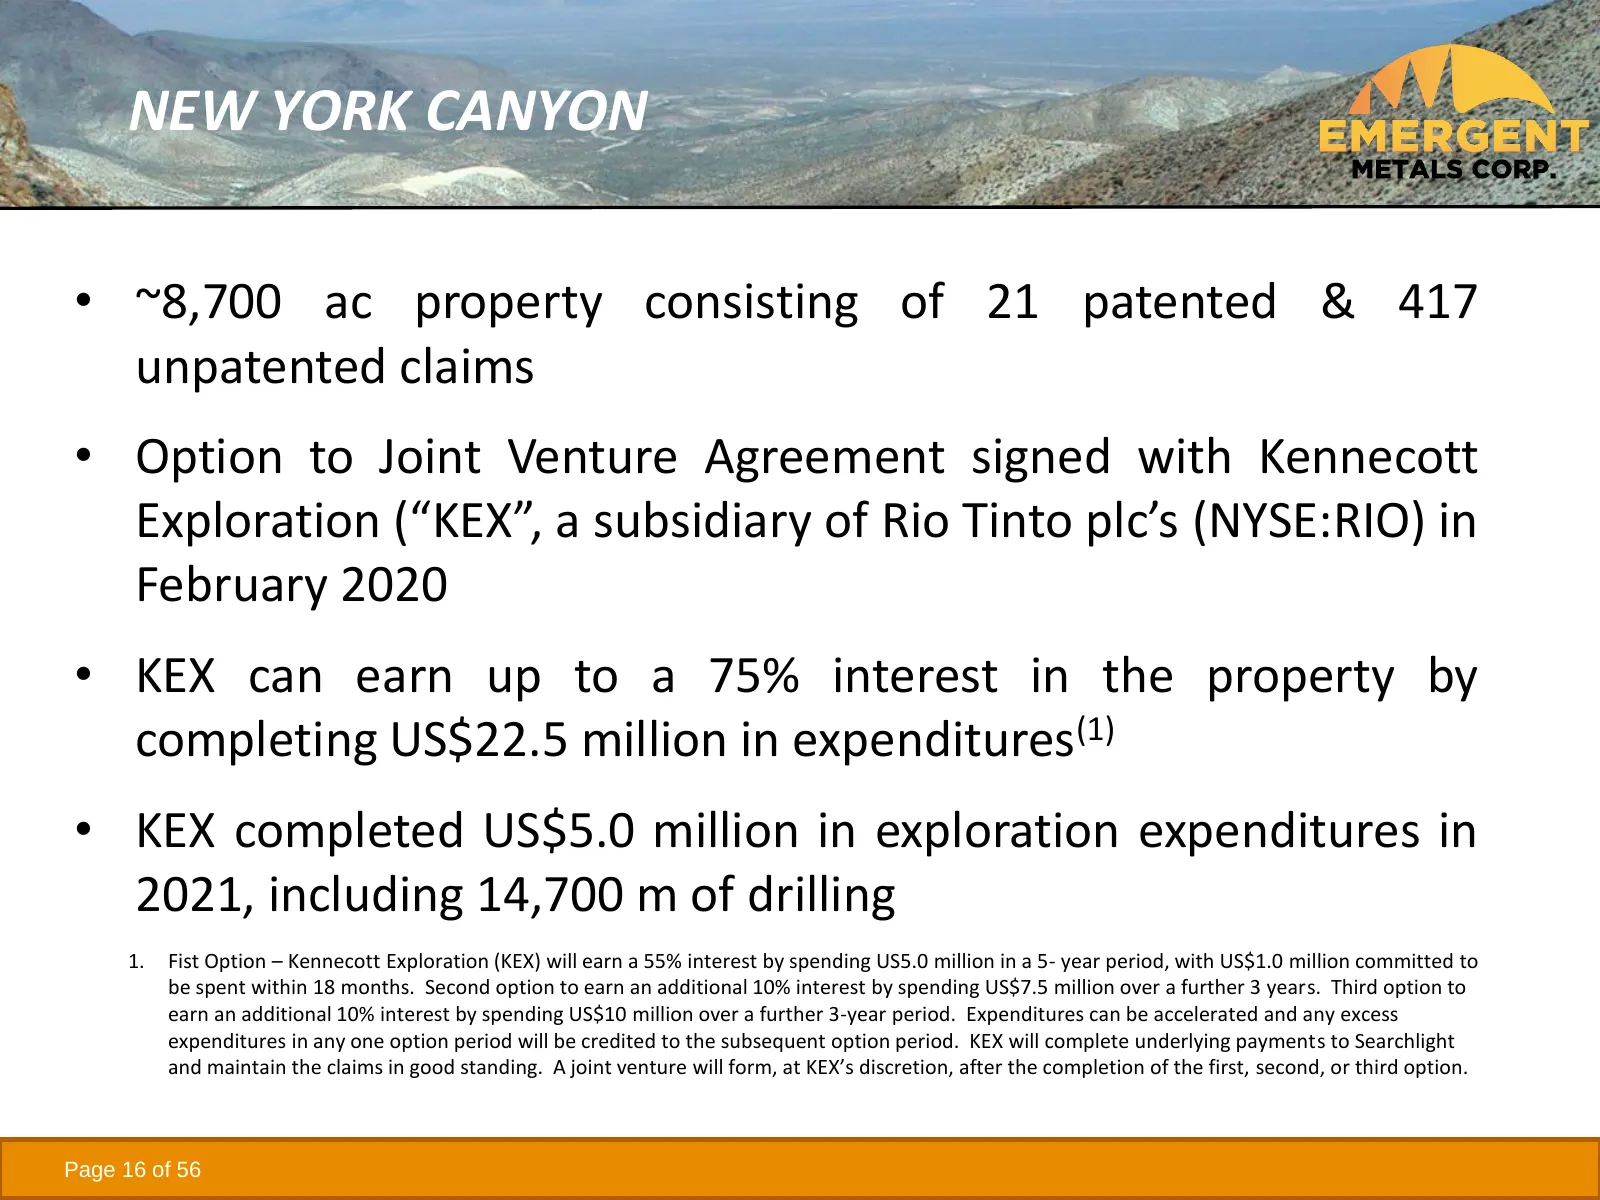
NEW YORK CANYON • ~8,700 ac property consisting of 21 patented & 417 unpatented claims • Option to Joint Venture Agreement signed with Kennecott Exploration (“KEX”, a subsidiary of Rio Tinto plc’s (NYSE:RIO) in February 2020 • KEX can earn up to a 75% interest in the property by completing US$22.5 m
Slide 17: New York Canyon Target
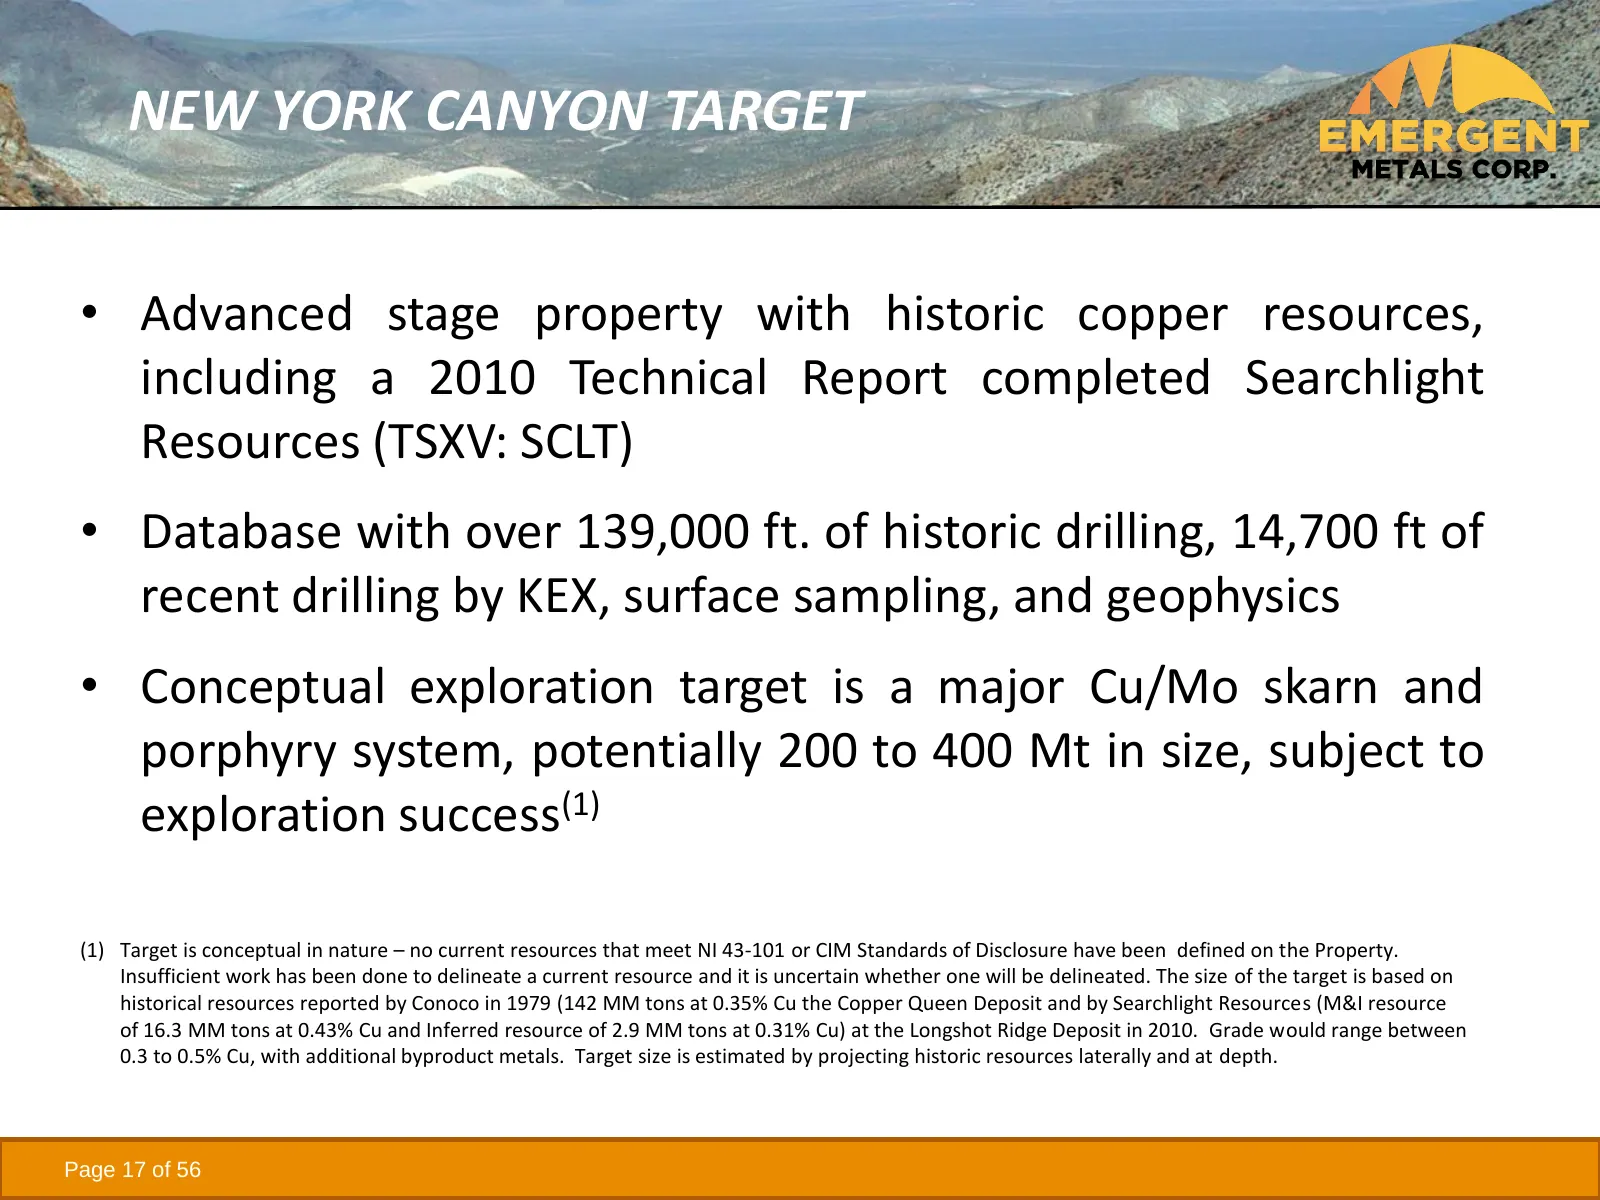
NEW YORK CANYON TARGET • Advanced stage property with historic copper resources, including a 2010 Technical Report completed Searchlight Resources (TSXV: SCLT) • Database with over 139,000 ft. of historic drilling, 14,700 ft of recent drilling by KEX, surface sampling, and geophysics • Conceptual ex
Slide 18: New York Canyon Exploration to Date
NEW YORK CANYON EXPLORATION TO DATE • Discovered in the late 1800’s • Since the 1960’s several companies explored the property for major porphyry deposits • Between 1977-1991, Conoco drilled 107 holes totaling 83,433 ft, completed metallurgical work, and other studies • Between 1992-1997, Kookaburra
Slide 19: New York Canyon Geology
NEW YORK CANYON GEOLOGY • Stratigraphy composed mostly of conformable marine sedimentary units of Triassic and Jurassic ages • Sedimentary units are intruded by granitic rocks of the Cretaceous age • Rocks are intersected by structures, mostly associated with Walker Lane faulting, as conduits for mi
Slide 20: New York Canyon Geology
NEW YORK CANYON GEOLOGY • North Claim Block adjacent to past producing Santa Fe Gold Mine with production reported at 345,499 oz Au and 710,629 oz. Ag between 1989 and 1995(1) • South Claim Block includes three main exploration targets – Longshot Ridge, Copper Queen, and Champion • Cu/Mo porphyry po
Slide 21: New York Canyon Historic Resources
NEW YORK CANYON HISTORIC RESOURCES • May 1979 internal report completed by Conoco detailed a 142 Mt inferred resource grading 0.35% Cu, 0.015% Mo, 0.1% Zn, 4ppm Ag, and 0.1 ppm Au at the Copper Queen prospect(1) • Sept. 1979 internal report completed by Conoco detailed “possible reserves” of 13.2 Mt
Slide 22: New York Canyon Historic Resources
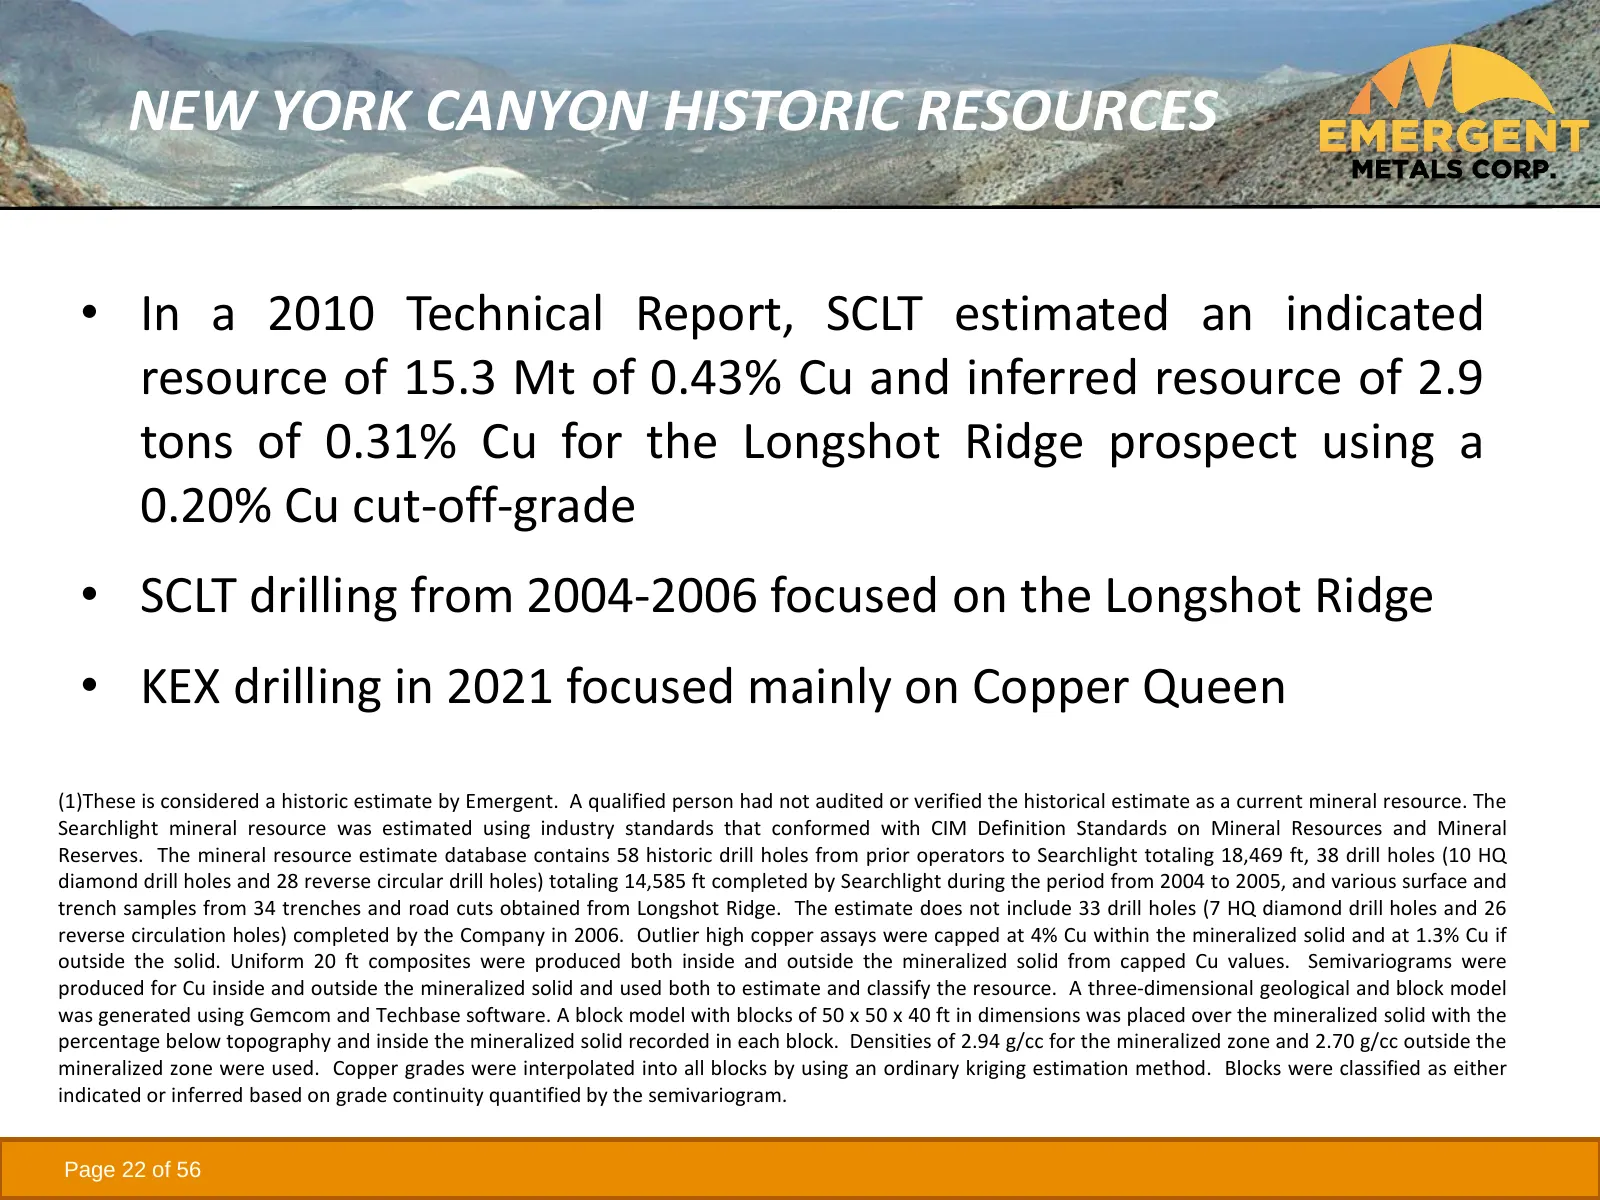
NEW YORK CANYON HISTORIC RESOURCES • In a 2010 Technical Report, SCLT estimated an indicated resource of 15.3 Mt of 0.43% Cu and inferred resource of 2.9 tons of 0.31% Cu for the Longshot Ridge prospect using a 0.20% Cu cut-off-grade • SCLT drilling from 2004-2006 focused on the Longshot Ridge • KEX
Slide 23: 3-D View of South Claim Block Area
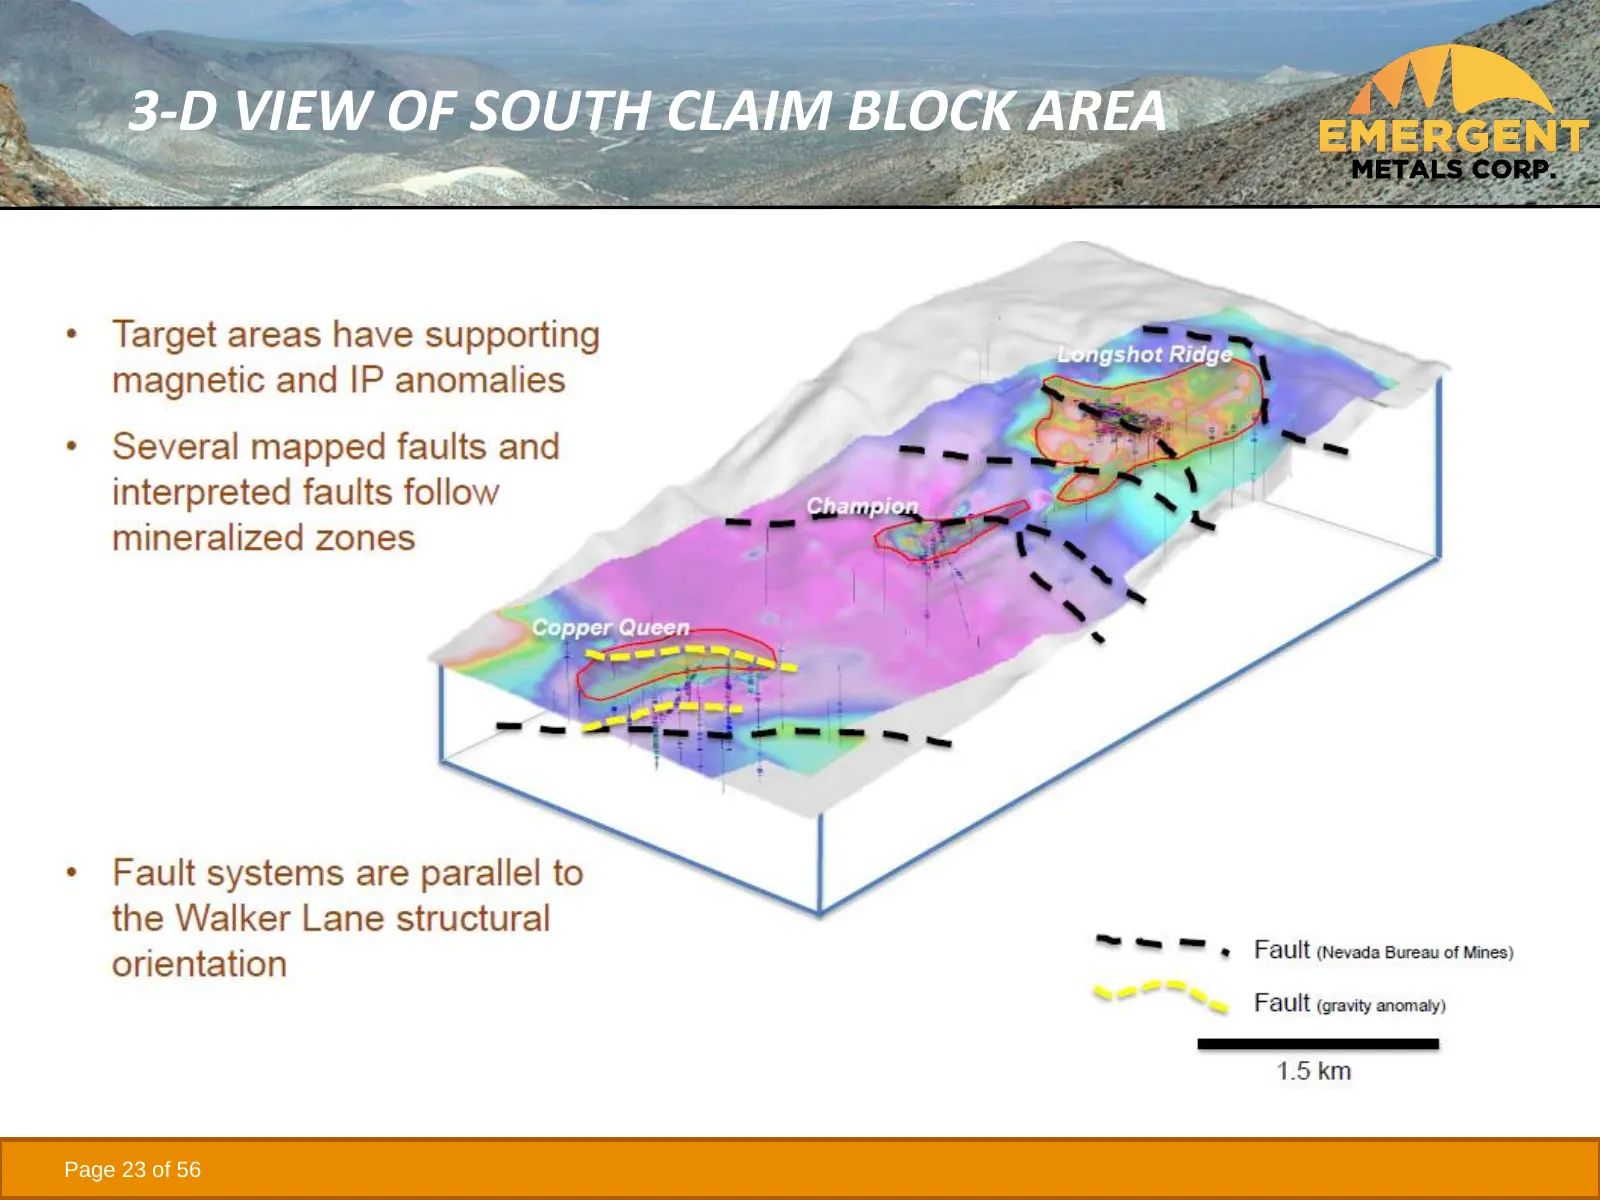
3-D VIEW OF SOUTH CLAIM BLOCK AREA Page 23 of 56
Slide 24: Mindora Property
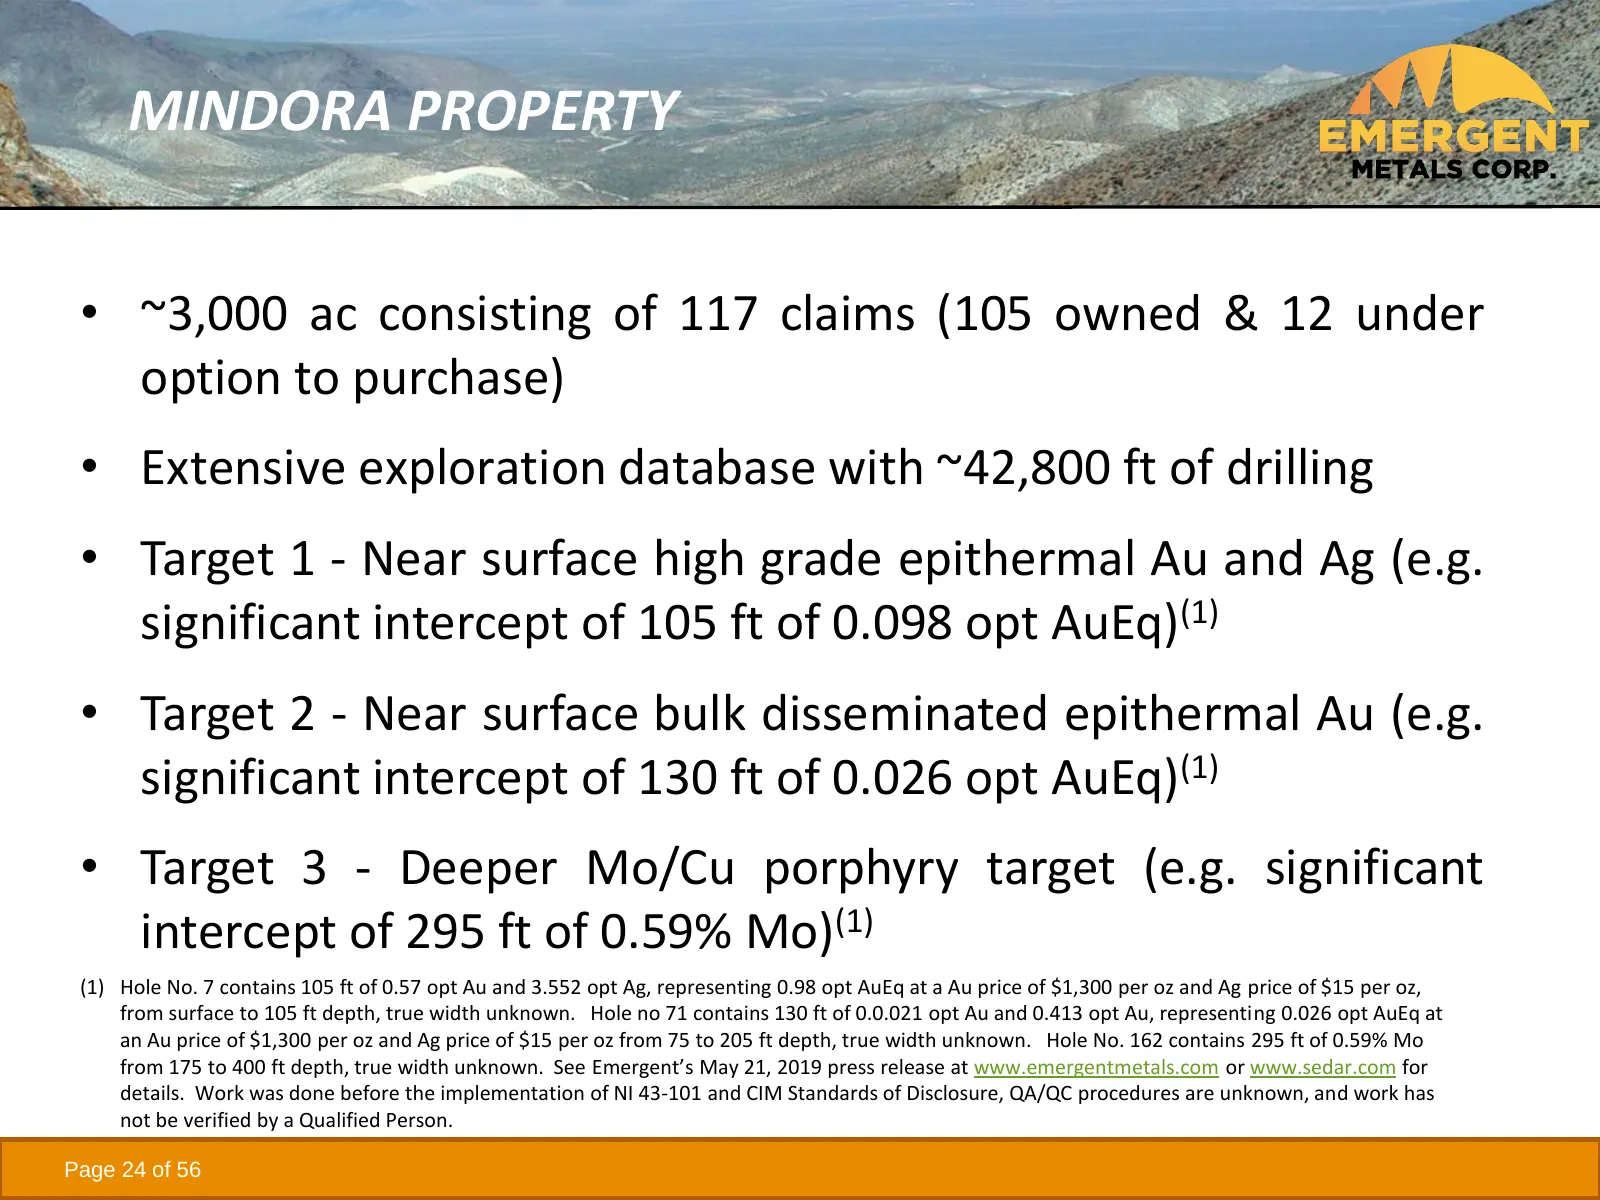
MINDORA PROPERTY • ~3,000 ac consisting of 117 claims (105 owned & 12 under option to purchase) • Extensive exploration database with ~42,800 ft of drilling • Target 1 - Near surface high grade epithermal Au and Ag (e.g. significant intercept of 105 ft of 0.098 opt AuEq)(1) • Target 2 - Near surface
Slide 25: Mindora Exploration to Date
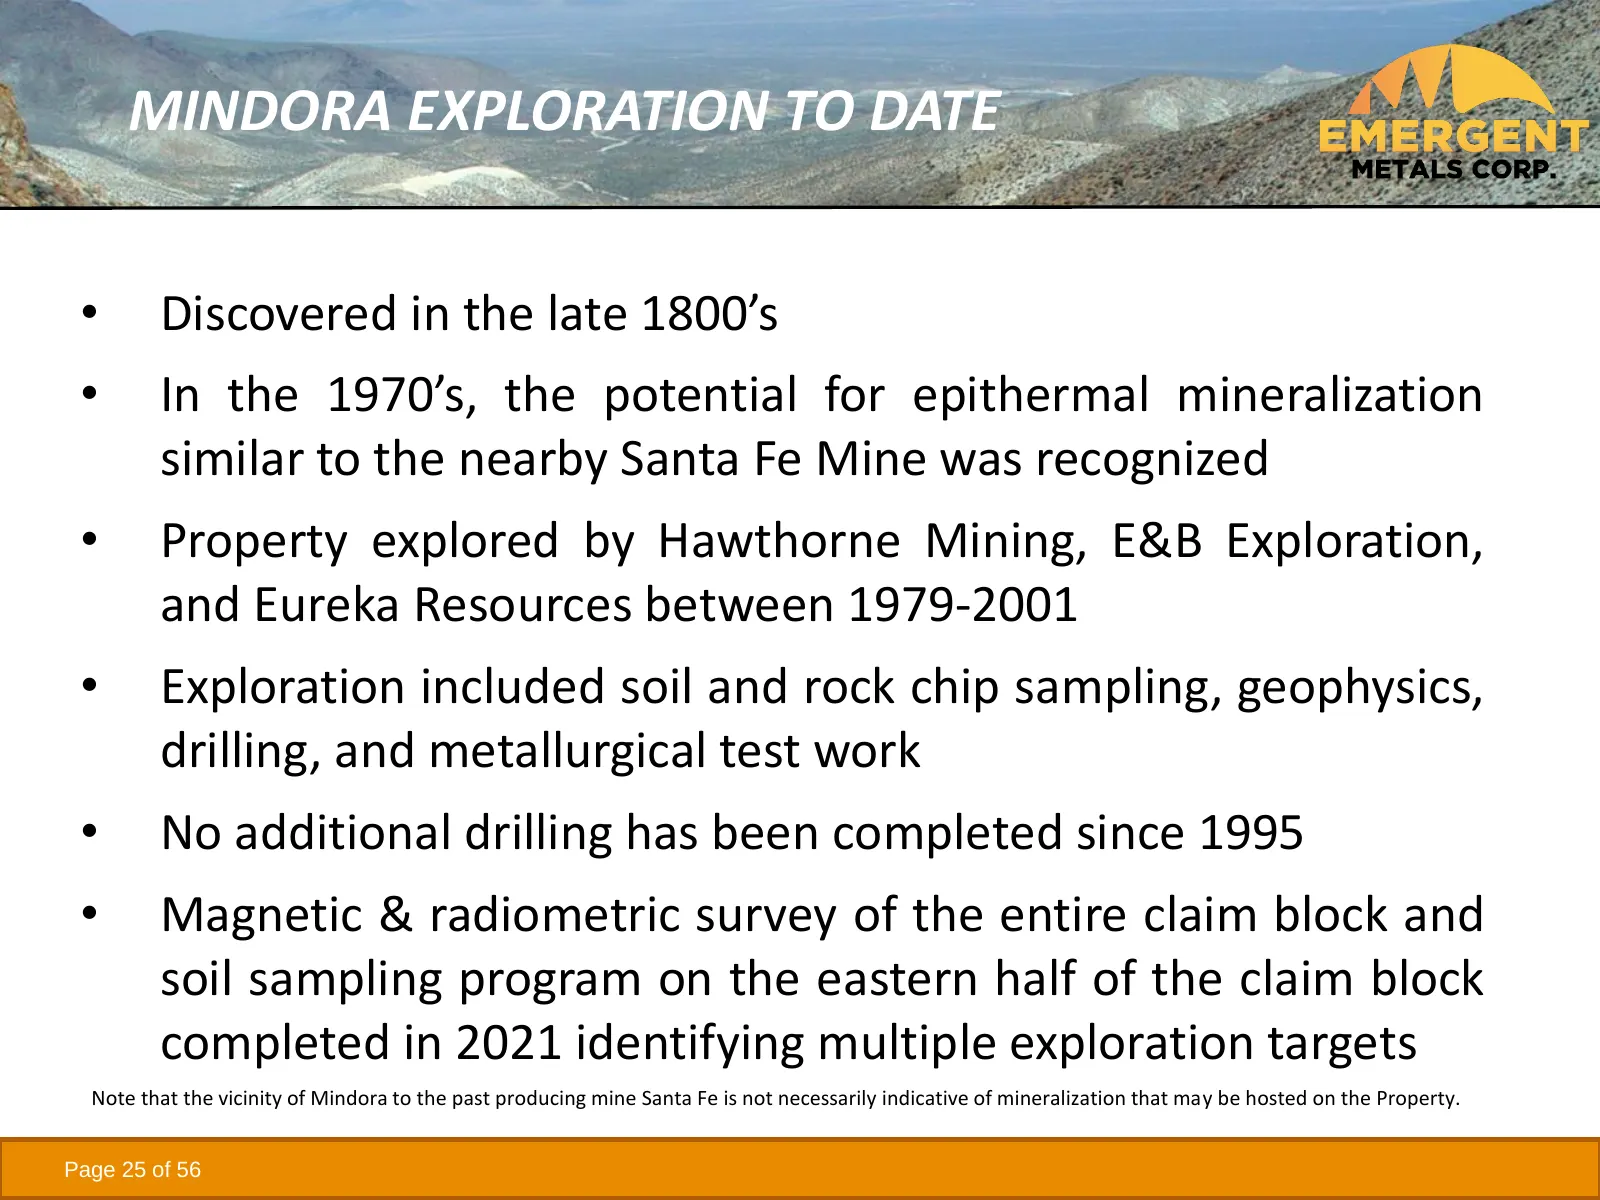
MINDORA EXPLORATION TO DATE • Discovered in the late 1800’s • In the 1970’s, the potential for epithermal mineralization similar to the nearby Santa Fe Mine was recognized • Property explored by Hawthorne Mining, E&B Exploration, and Eureka Resources between 1979-2001 • Exploration included soil and
Slide 26: Mindora Panoramic View
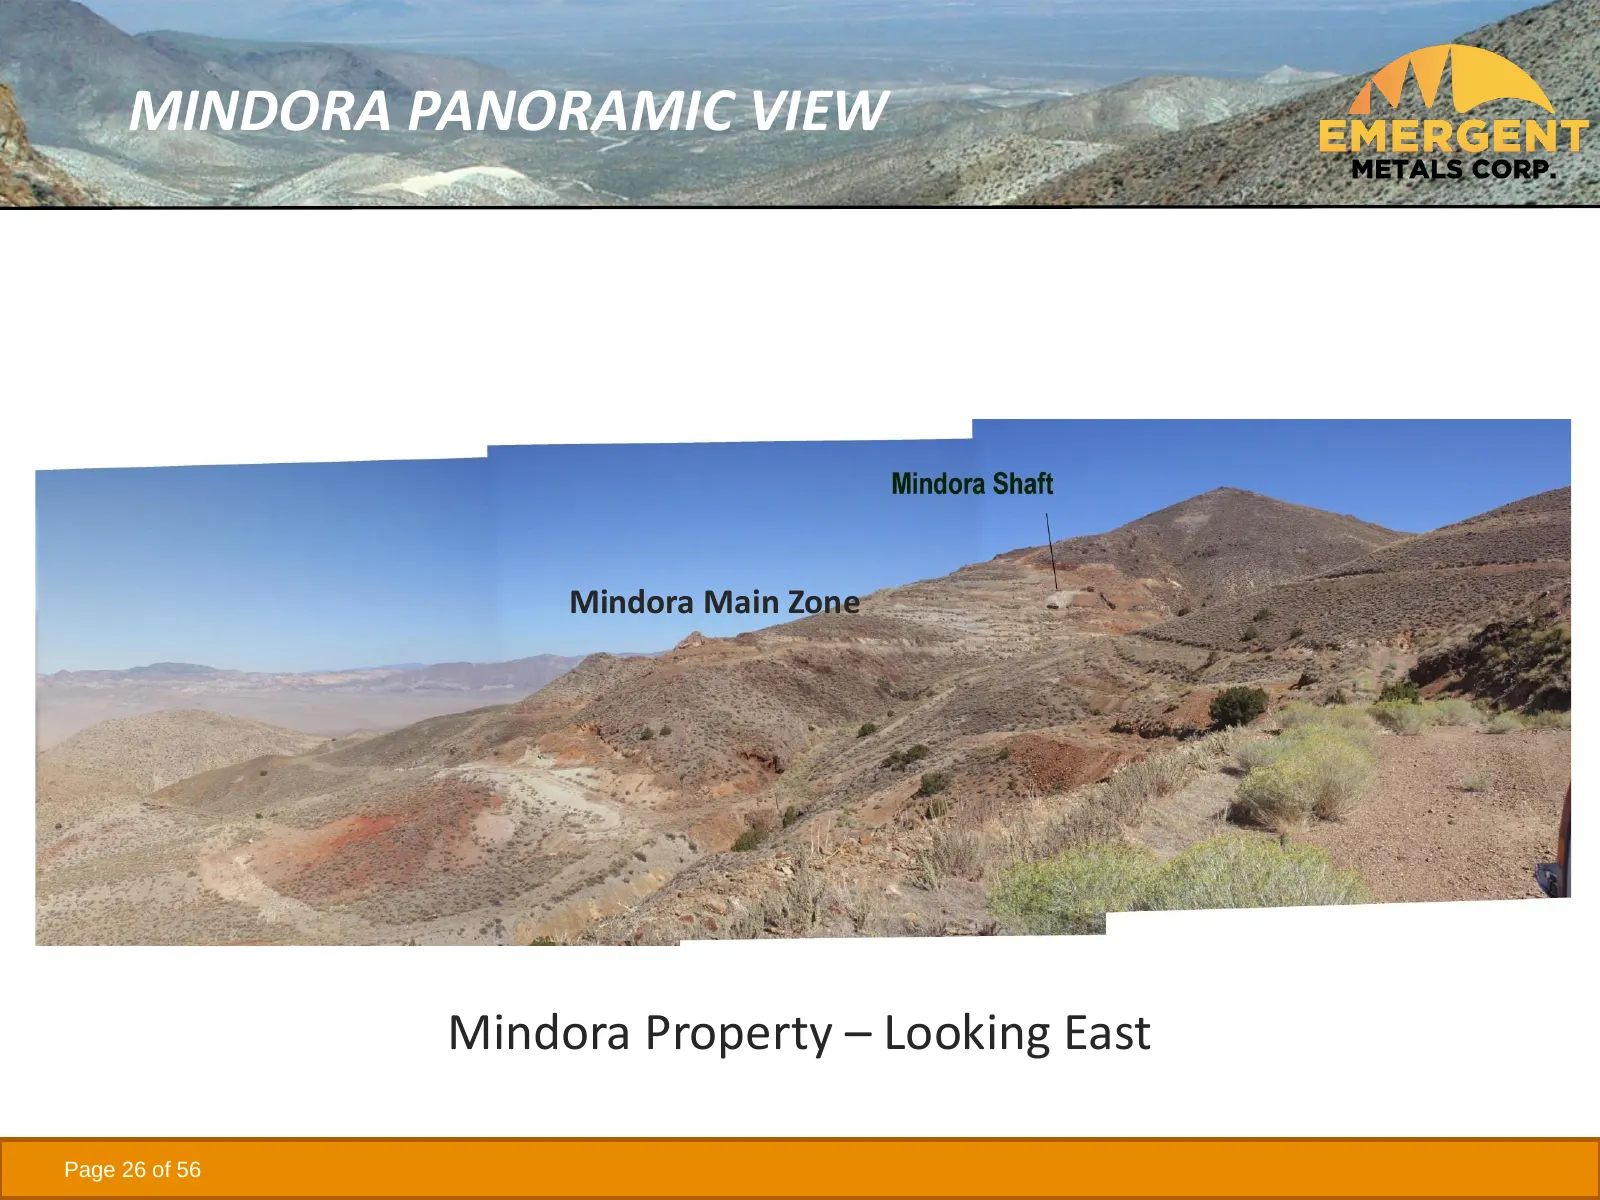
MINDORA PANORAMIC VIEW Mindora Main Zone Mindora Property – Looking East Page 26 of 56
Slide 27: Mindora Geology
MINDORA GEOLOGY • Limestone and intermediate volcanic rocks of the Triassic Luning Formation underlie the east and central portions of the Property • Quartz rhyolite and quartz latite dikes and sills, and altered granodiorite, intrude the meta-sedimentary and metavolcanic rocks • Late Tertiary volca
Slide 28: Mindora Structural Setting
MINDORA STRUCTURAL SETTING • Located in a regional flexure of the Walker Lane Trend that appears to be favorable to both the ascent of intrusions and porphyry systems as well as epithermal mineralization • Epithermal gold mineralization controlled by N to NW trending structures associated with Walke
Slide 29: Mindora Mineralization
MINDORA MINERALIZATION • Disseminated Au and Ag mineralization found near surface in limestone contact with intrusive rocks • Mo mineralization found at depth below Au and Ag mineralization • Cu anomalies found on surface in 1990’s never drilled • Shallow hole depths range mostly from 200 to 300 ft
Slide 30: Mindora Historical Resources
MINDORA HISTORICAL RESOURCES • In 1998, Eureka calculated a historic resource of 1.04M tons of 0.037 opt Au & 1.78 opt Ag = 0.058 opt AuEq, containing 58,800 AuEq oz based current metal prices(1) • Metallurgical work indicated potential recoveries of >90% for Au and 75-80% Ag for milled ore and 70-7
Slide 31: Buckskin Rawhide East (BRE) Property
BUCKSKIN RAWHIDE EAST (BRE) PROPERTY • 48 unpatented claims • Surrounded by Rawhide Mining LLC’s (“RMC”) operating Rawhide Mine (aka Denton Rawhide Mine) • RMC optioned BRE from Emergent in 2014 • Represents a near term royalty opportunity for Emergent • Exploration targets –four known targets adjac
Slide 32: Rawhide Properties' Location Map
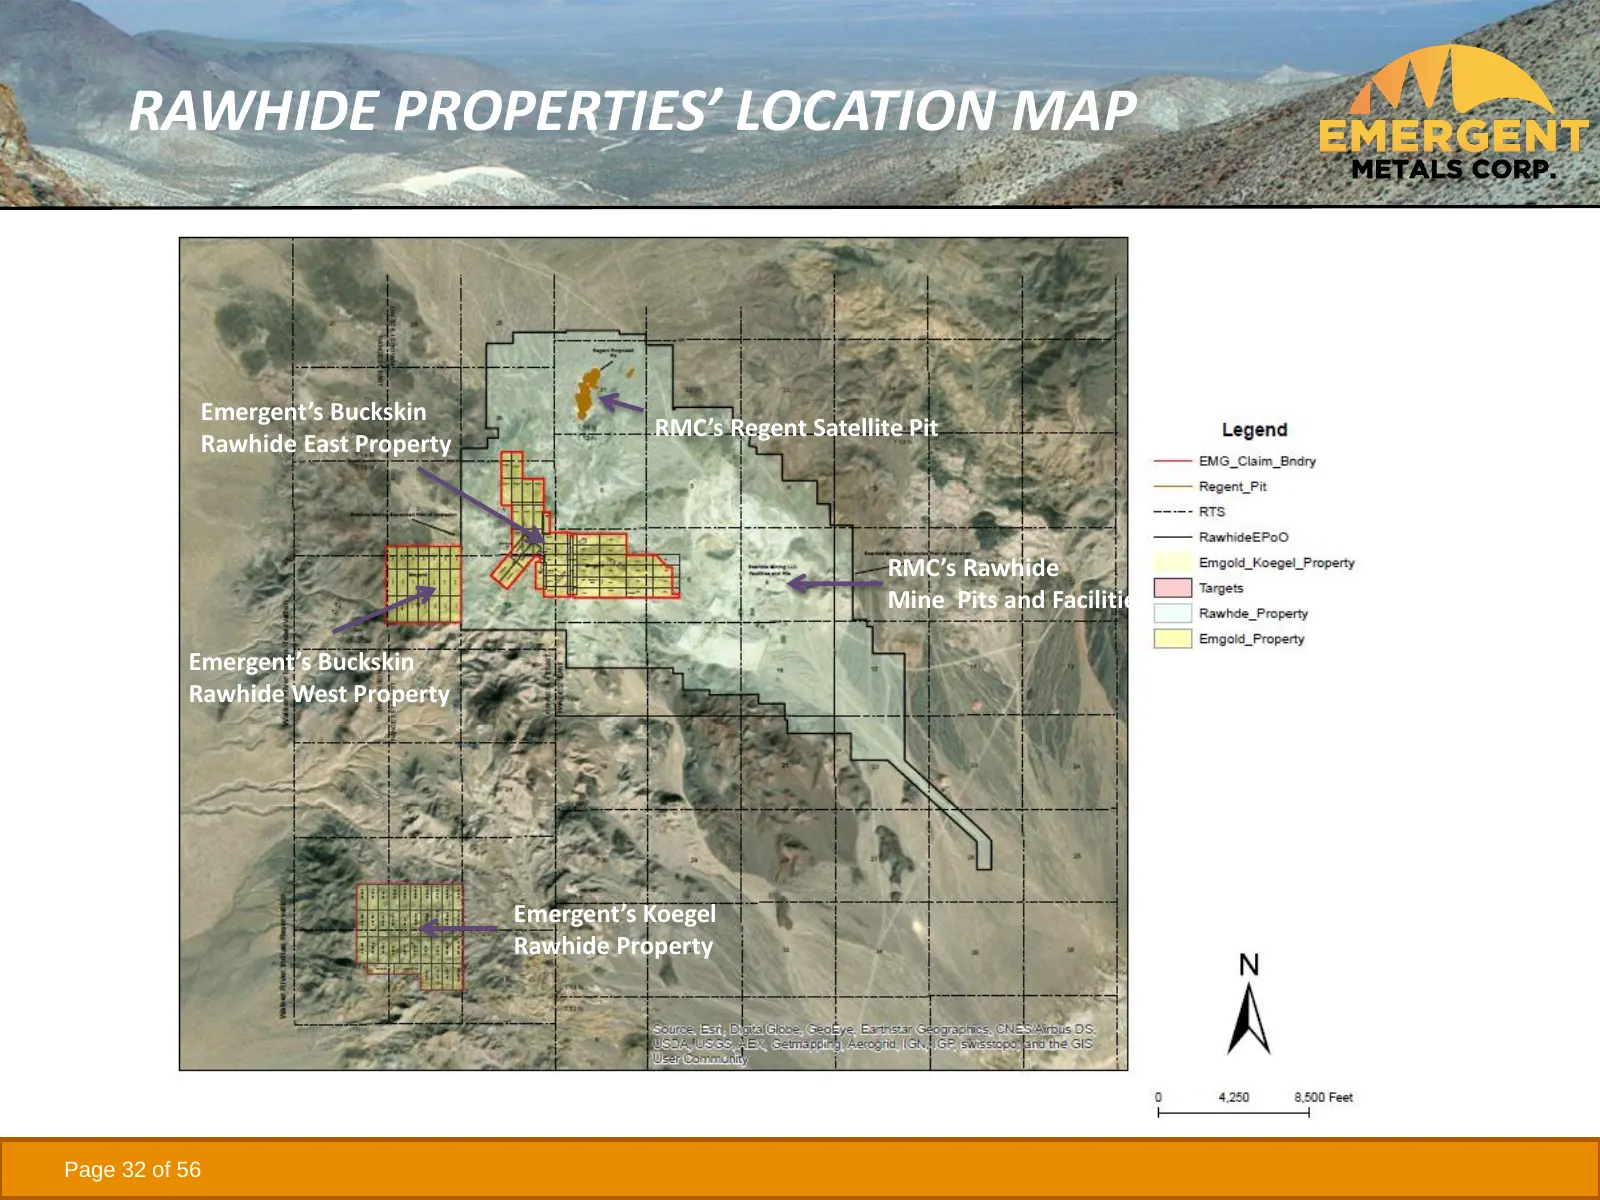
RAWHIDE PROPERTIES’ LOCATION MAP Emergent’s Buckskin RMC’s Regent Satellite Pit Rawhide East Property RMC’s Rawhide Mine Pits and Facilities Emergent’s Buckskin Rawhide West Property Emergent’s Koegel Rawhide Property Page 32 of 56
Slide 33: BRE Lease to RMC
BRE LEASE TO RMC • In 2014 (effective date June 17, 2013), Emergent leased BRE to RMC under the following terms: ➢ Lease term is 20 years, advance royalty payments are US$10,000 per year ➢ US$250,000 in exploration in Year 1 (completed) ➢ Cumulative US$500,000 in exploration by Year 3 (completed) ➢
Slide 34: History of the Rawhide Mine
HISTORY OF THE RAWHIDE MINE • Rawhide Mine has produced 1.8 M oz of gold and 14.9 M oz of silver from 1990 through 2019(1) • Gold was discovered in the Rawhide Mining District in 1906, with historic mining from 1908 to 1920 • Modern exploration in the District began in 1982 • Rawhide Mine was constr
Slide 35: History of the Rawhide Mine
HISTORY OF THE RAWHIDE MINE • In 2010, Rawhide Mine was acquired by RMC who continued to recover gold from the heap leach pads • In November 2012, RMC recommenced mining activities at Rawhide • In 2013/14 RMC acquired the Regent Property from Pilot Gold and leased the BRE Property from Emergent • In
Slide 36: BRE Exploration History
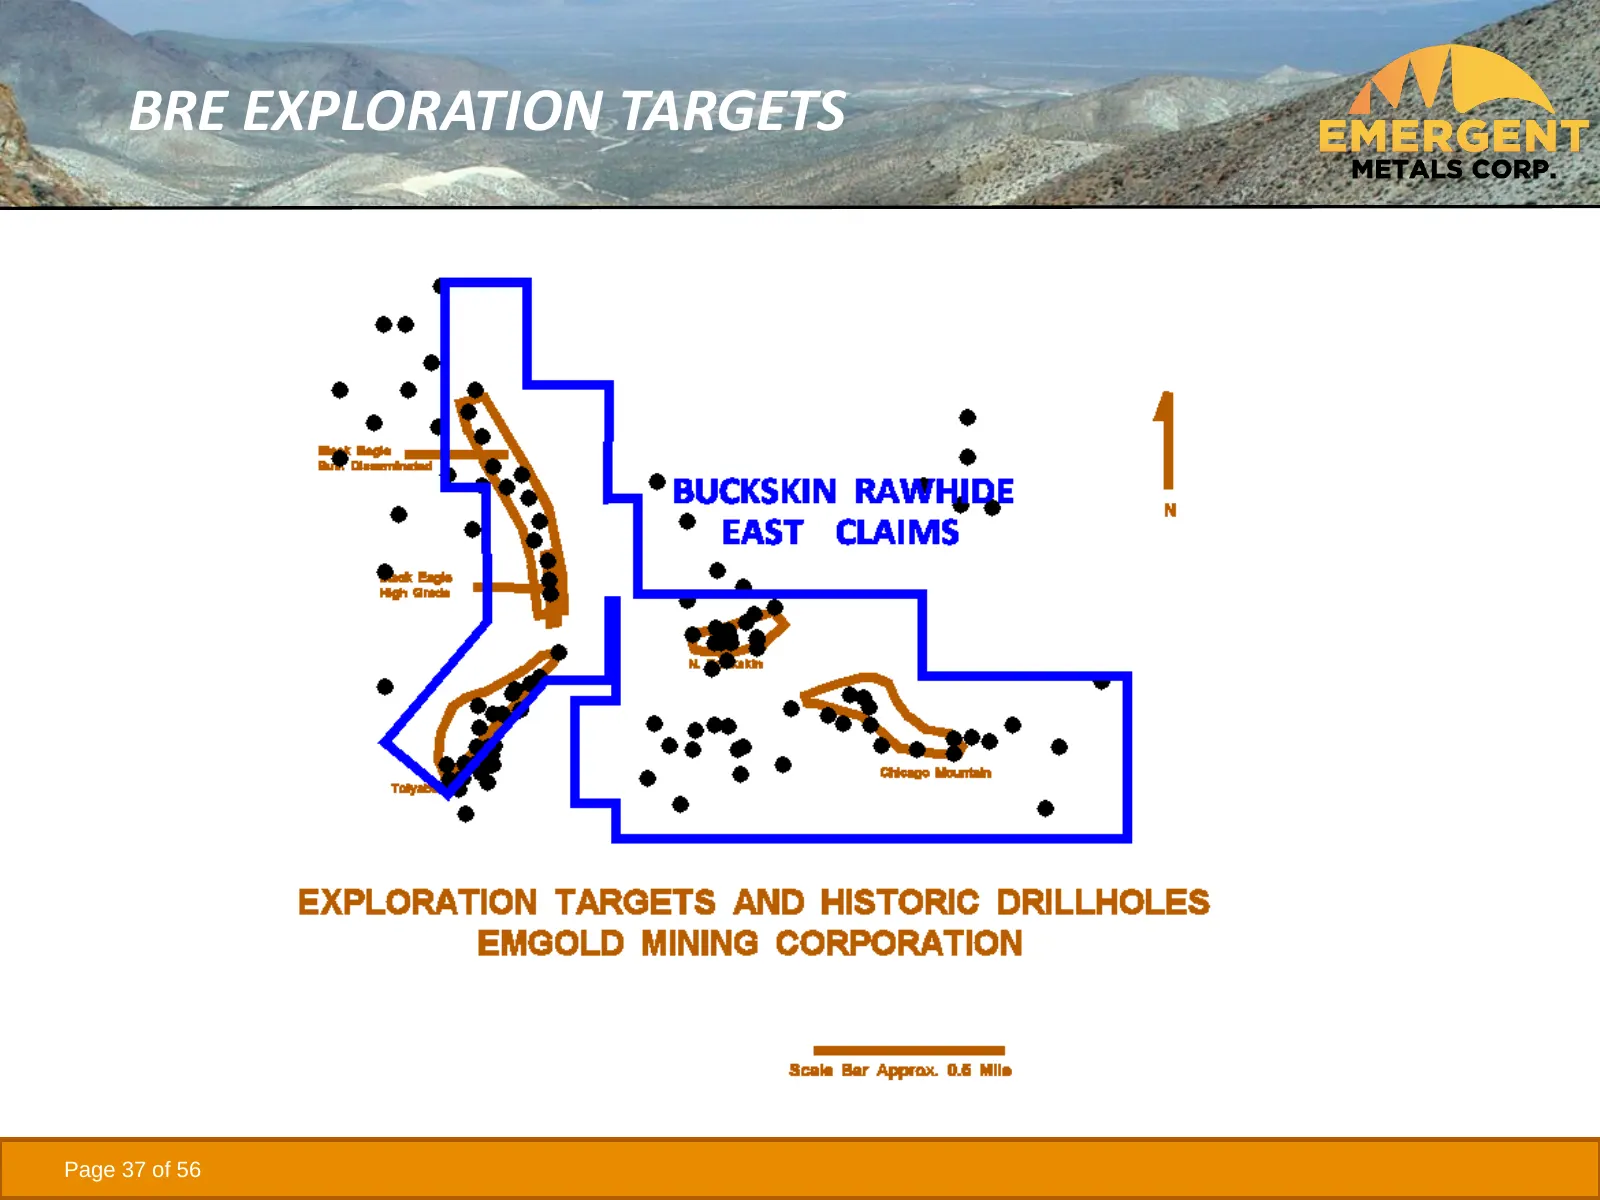
BRE EXPLORATION HISTORY • Kennecott conducted exploration and drilled 113 holes totaling 54,370 ft in the 1990’s on the BRE property • Four exploration targets were identified – Toiyabe, Chicago Mountain, North Buckskin Mountain, and Black Eagle • Mapping/sampling was done by Emergent in the 2000’s
Slide 37: BRE Exploration Targets
BRE EXPLORATION TARGETS Page 37 of 56
Slide 38: Buckskin Rawhide West (BRW) Property
BUCKSKIN RAWHIDE WEST (BRW) PROPERTY • 21 unpatented claims • Early-stage exploration property with potential for discovery of bulk disseminated Au/Ag mineralization • Strategic property due to: ➢ its location adjacent to the operating Rawhide Mine ➢ Its location adjacent to and west of the Toiyabe
Slide 39: Koegel Rawhide Property
KOEGEL RAWHIDE PROPERTY • 36 unpatented claims, early-stage strategic Au/Ag property located 4 mi south of Rawhide Mine • Mapping, soil, and rock chip sampling completed to date identifying major alteration zone 5,000 ft x 600 ft in size • 464 historic rock chip samples average 0.02 opt Au, with 13
Slide 40: Quebec
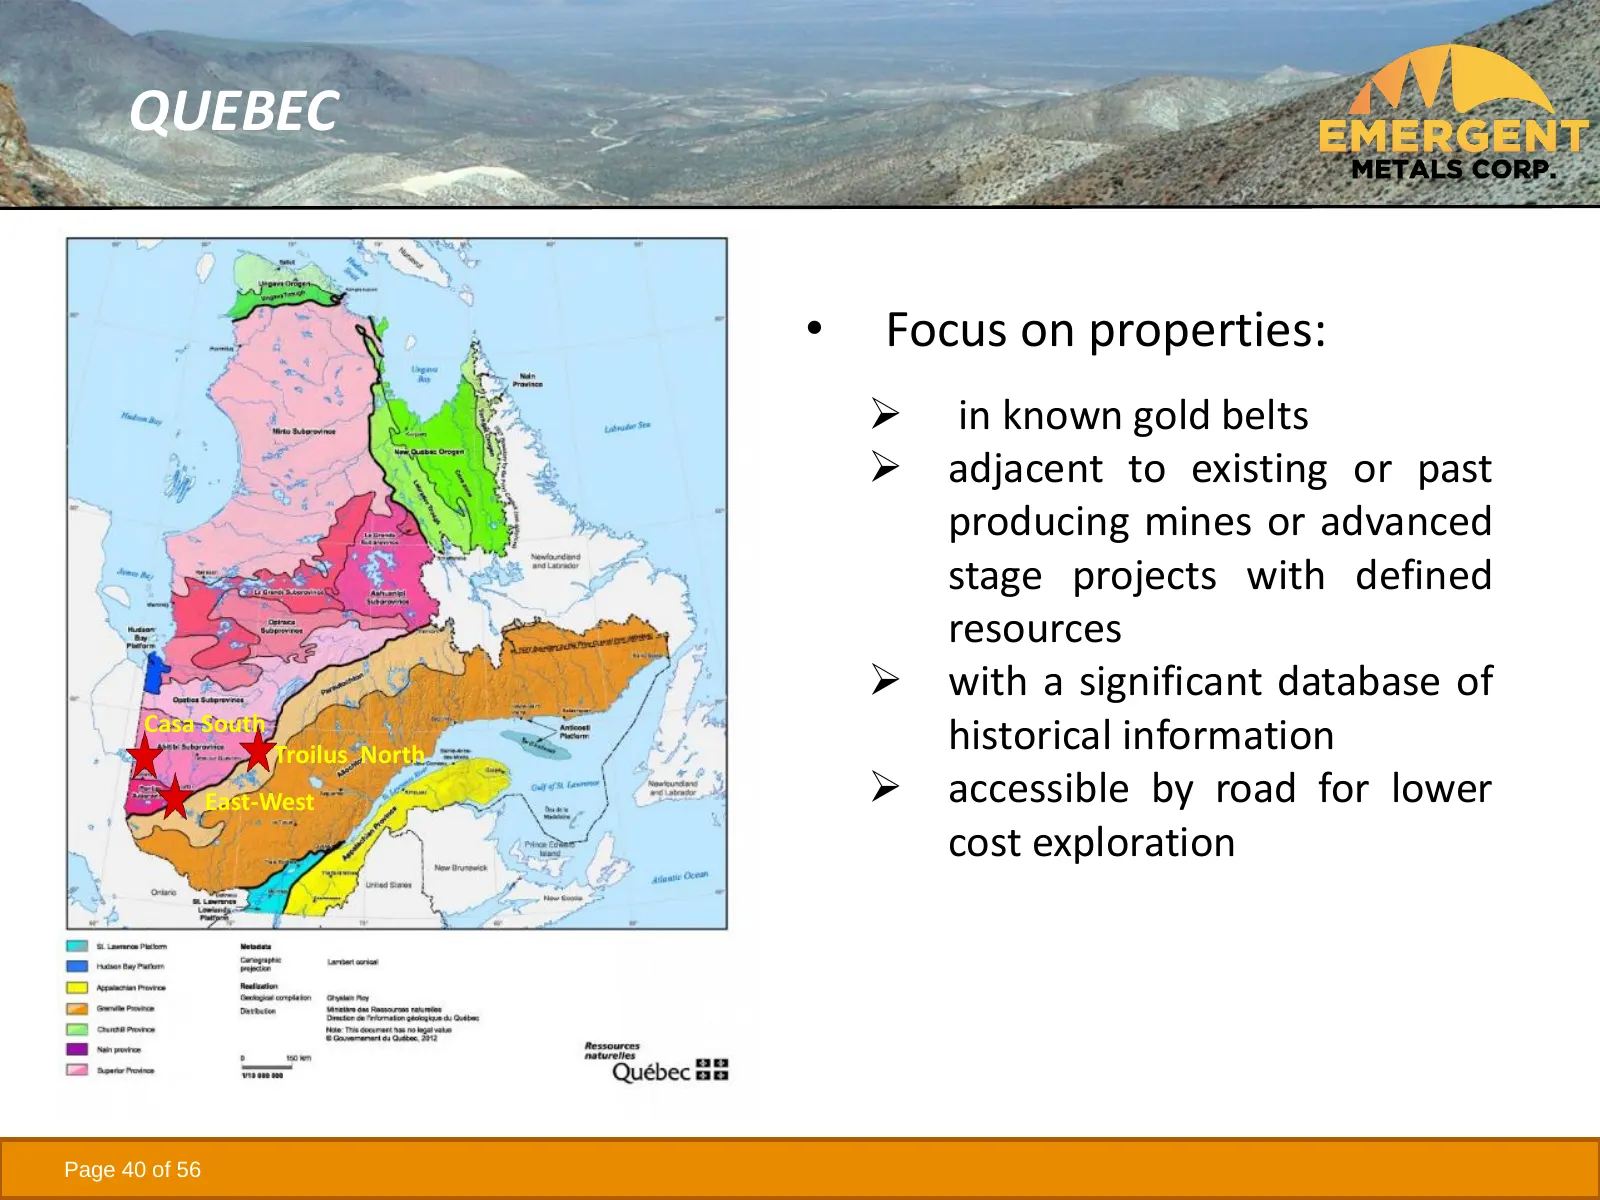
QUEBEC • Focus on properties: ➢ in known gold belts ➢ adjacent to existing or past producing mines or advanced stage projects with defined resources ➢ with a significant database of Casa South Troilus North historical information East-West ➢ accessible by road for lower cost exploration Page 40 of 5
Slide 41: Casa South Property
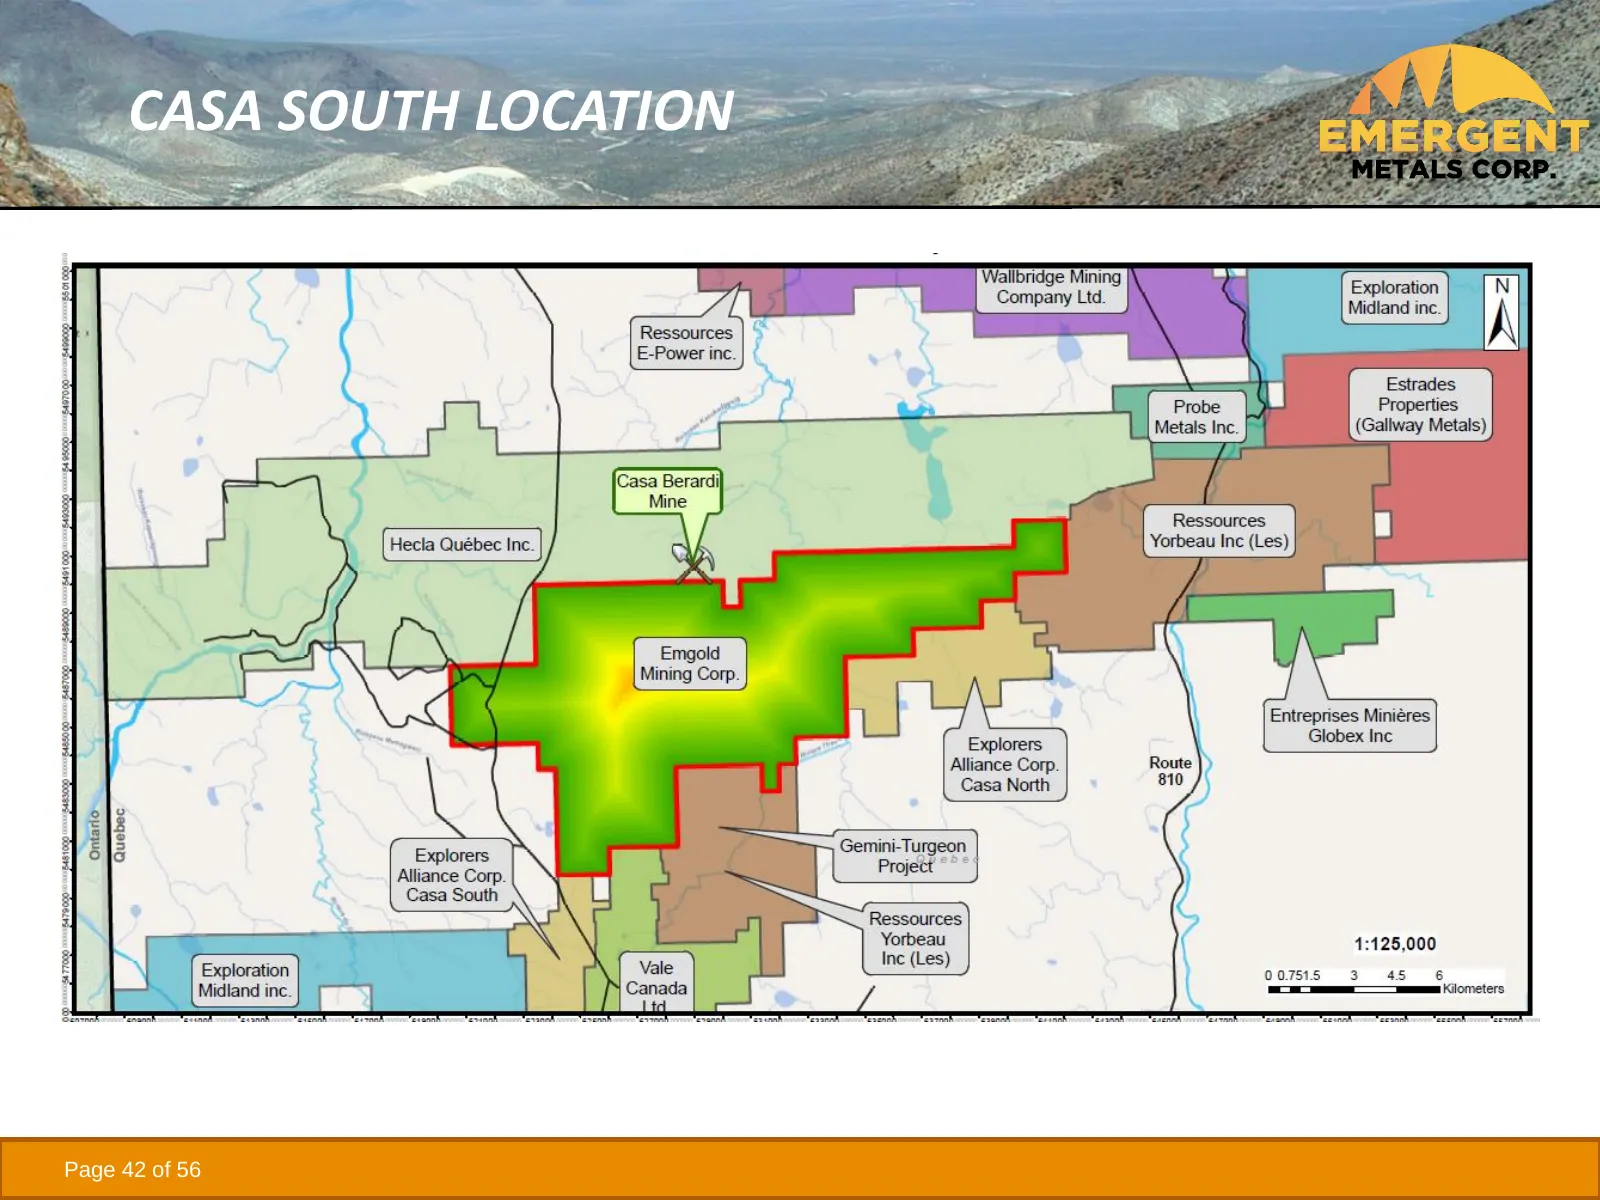
CASA SOUTH PROPERTY • 204 claims totaling ~11,400 ha • Adjacent and south of Hecla Mining Corporation’s (NYSE:HL) Casa Berardi Mine which produced over 2.4M oz Au since 1988(1) and 121,493 oz Au in 2020(2) • Adjacent and north of Iamgold’s (NYSE:AAG) Gemini Turgeon Property (3) • Exploration targets
Slide 42: Casa South Location
CASA SOUTH LOCATION Page 42 of 56
Slide 43: Casa South Exploration to Date
CASA SOUTH EXPLORATION TO DATE • Limited exploration work occurred on property over the last 20 years including diamond drilling and RC drilling in glacial till • Emergent acquired a comprehensive database of historic exploration work and modern geophysics • 3 multi-kilometer long gold zones have be
Slide 44: Casa South Exploration Targets
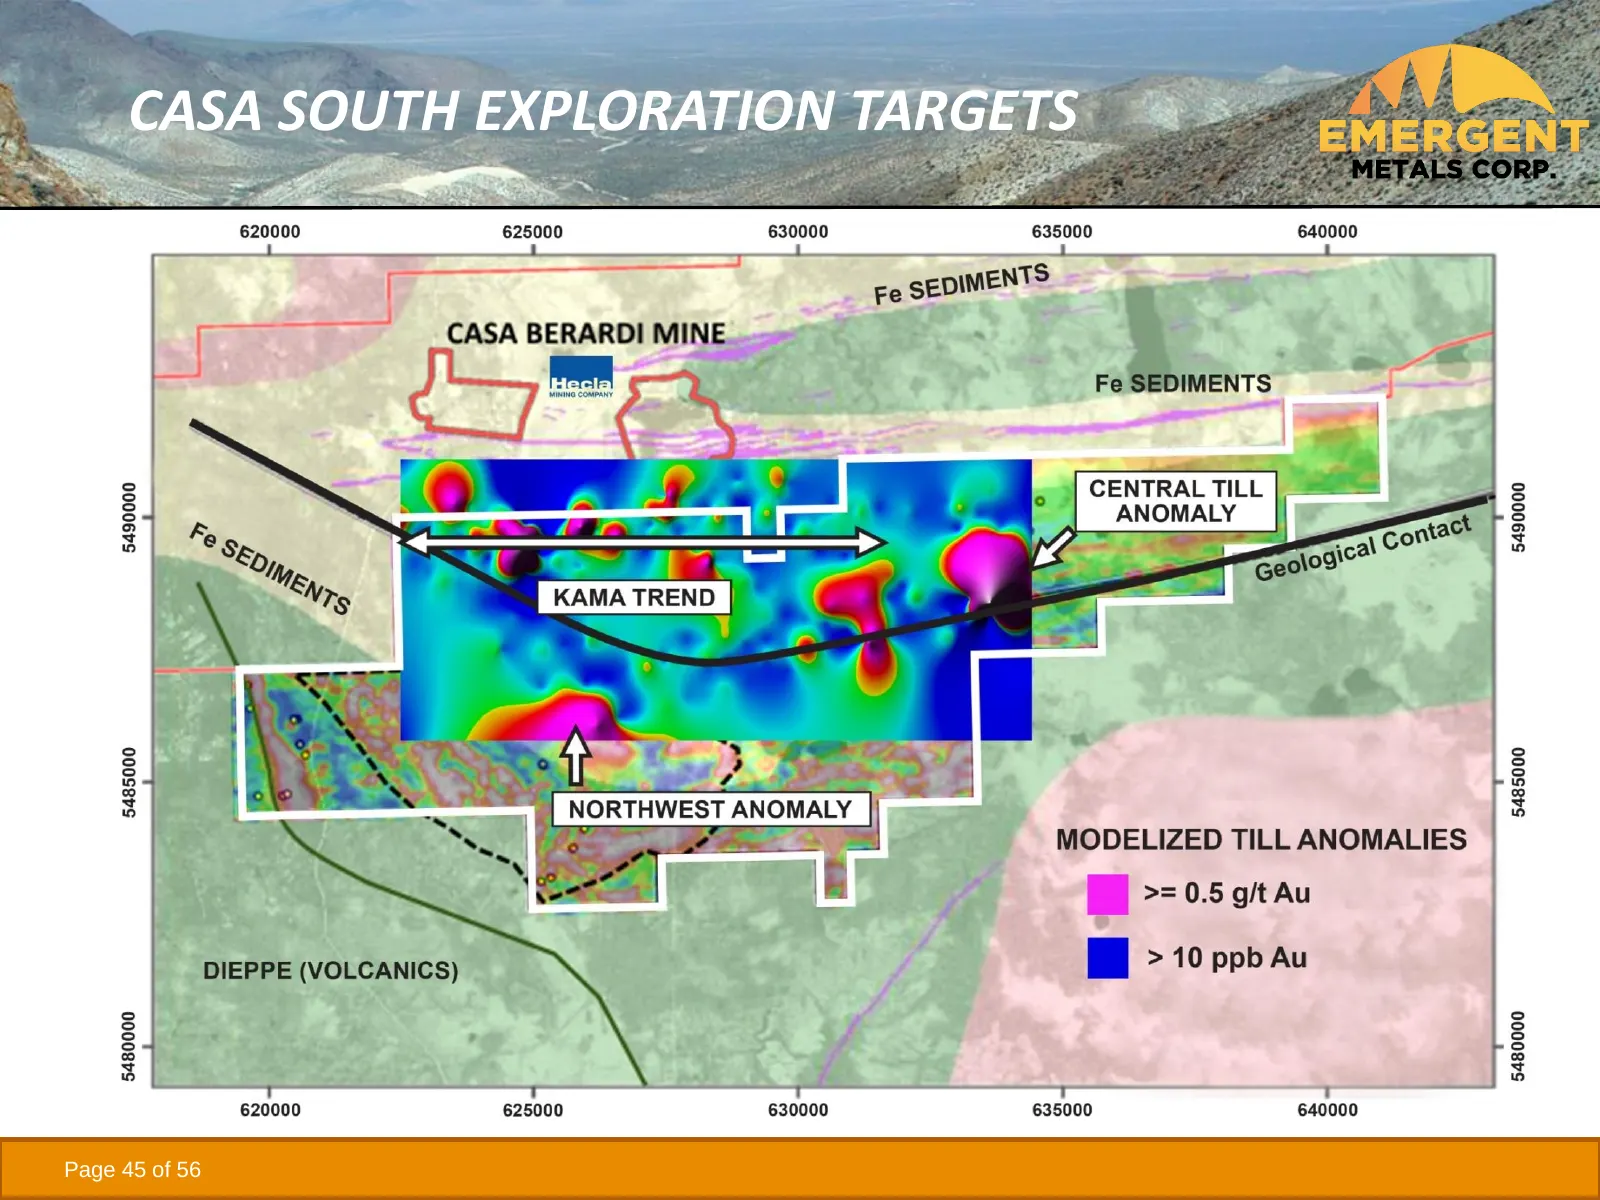
CASA SOUTH EXPLORATION TARGETS • Major gold bearing structure known as the Kama Trend lies just south of the Casa Berardi Mine - similar geologic characteristics with the Detour Lake Mine (5M oz+ Au) (1) • Major gold anomaly called the Central Till Anomaly extends up to 7 km - similar geologic chara
Slide 45: Casa South Exploration Targets
CASA SOUTH EXPLORATION TARGETS Page 45 of 56
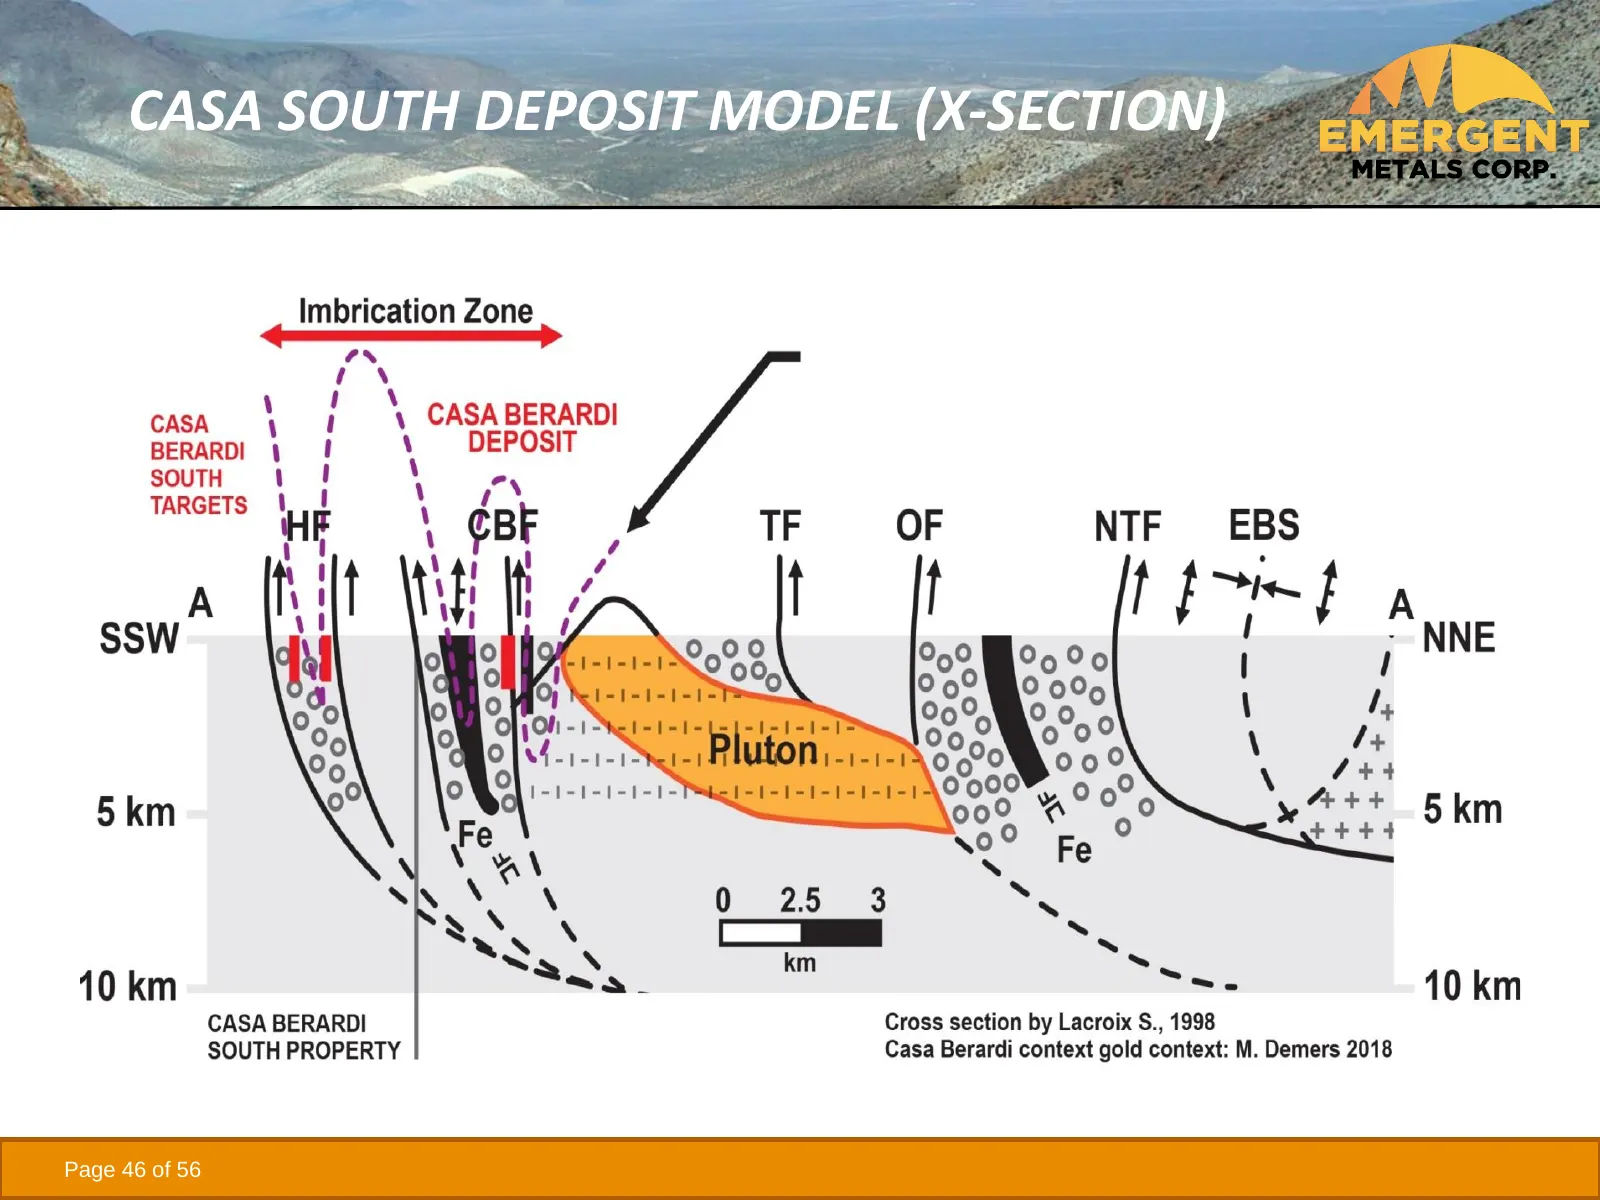
Slide 46: Casa South Deposit Model (X-Section)
CASA SOUTH DEPOSIT MODEL (X-SECTION) Page 46 of 56
Slide 47: East-West Property
EAST-WEST PROPERTY • 7 claims totaling 184 ha in the Val d’Or Mining Camp, QC • ~41,000 m of historic drilling in 180 drill holes and 17,700 m of recent drilling in 100 drill holes • Exploration targets include high grade vein and bulk disseminated mineralization on strike with historic Kiena and Ma
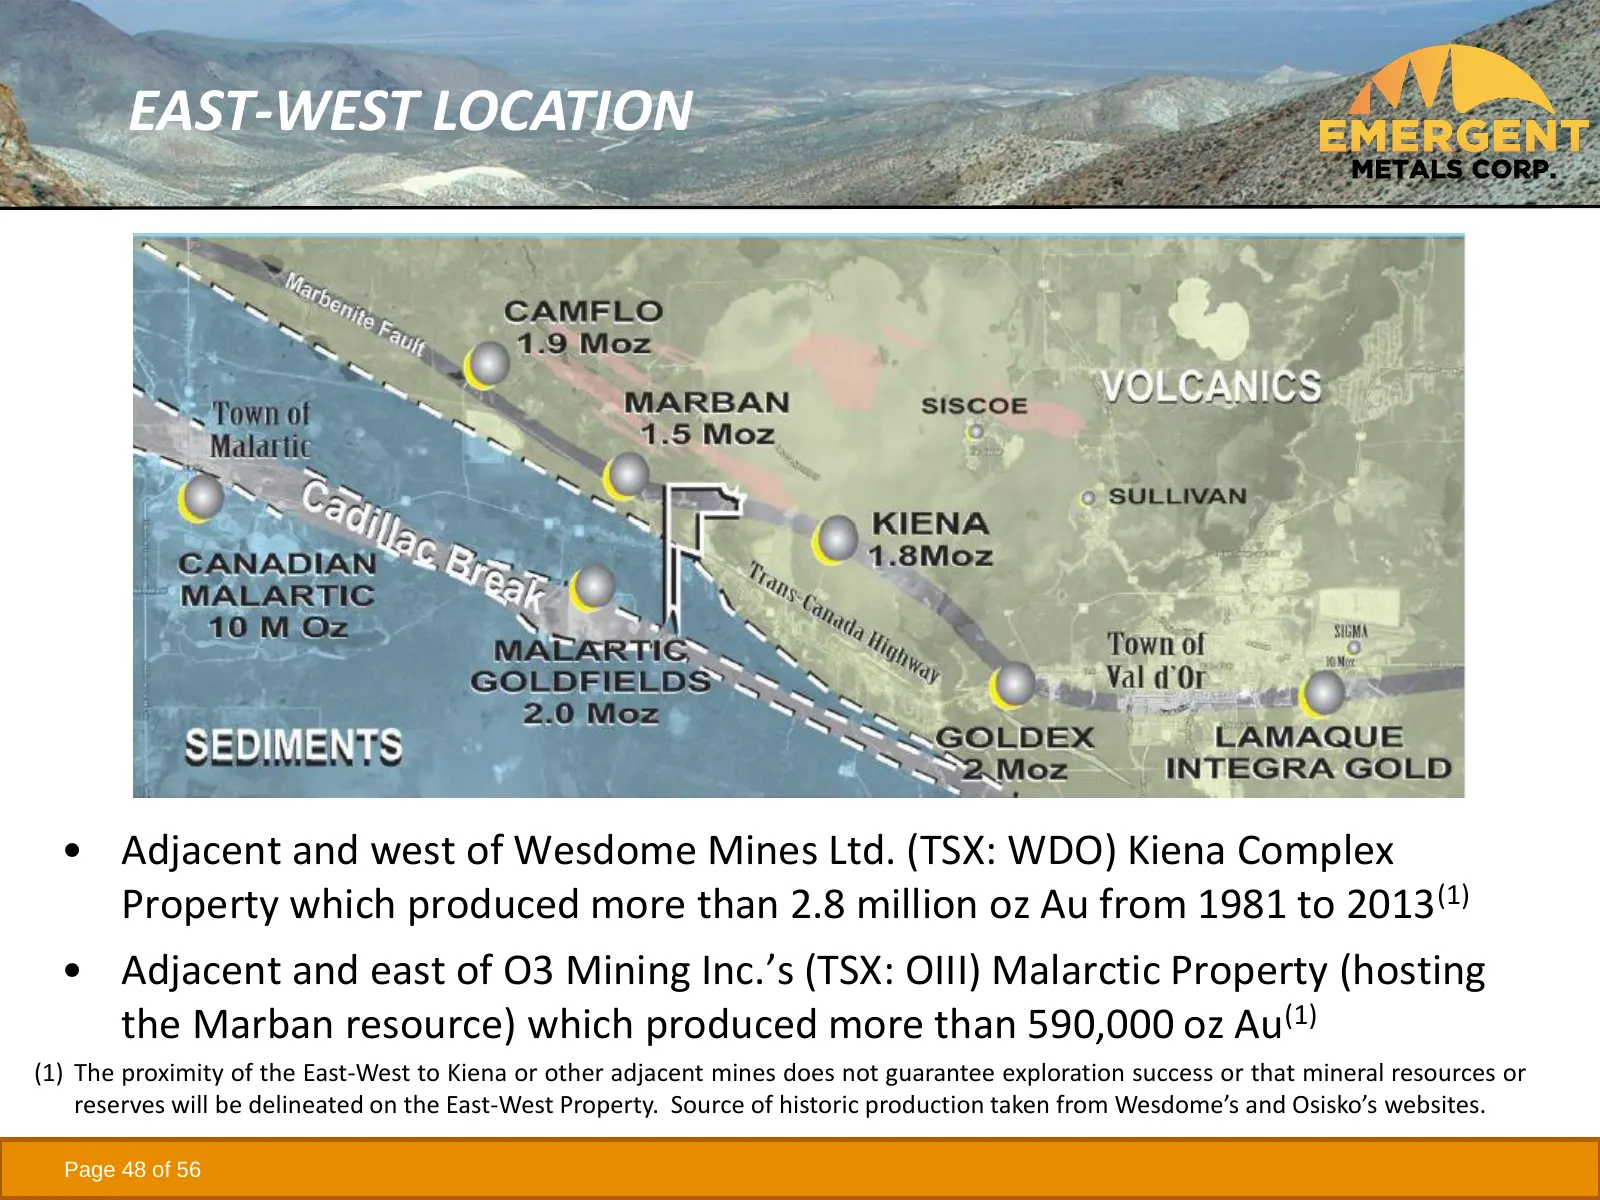
Slide 48: East-West Location
EAST-WEST LOCATION • Adjacent and west of Wesdome Mines Ltd. (TSX: WDO) Kiena Complex Property which produced more than 2.8 million oz Au from 1981 to 2013(1) • Adjacent and east of O3 Mining Inc.’s (TSX: OIII) Malarctic Property (hosting the Marban resource) which produced more than 590,000 oz Au(1
Slide 49: Trecesson Property
TRECESSON PROPERTY • 56 claims totaling ~1,900 ha • 50 km north of Val d’Or and 10 km west of the town of Amos • Recently acquired from Knick Exploration Inc. • Cossett Gold System identified in exploration • Knick completed 154 drill holes totaling about 6,700 m in 2011 and 2017 and a 2012 Technica
Slide 50: Troilus North Royalty
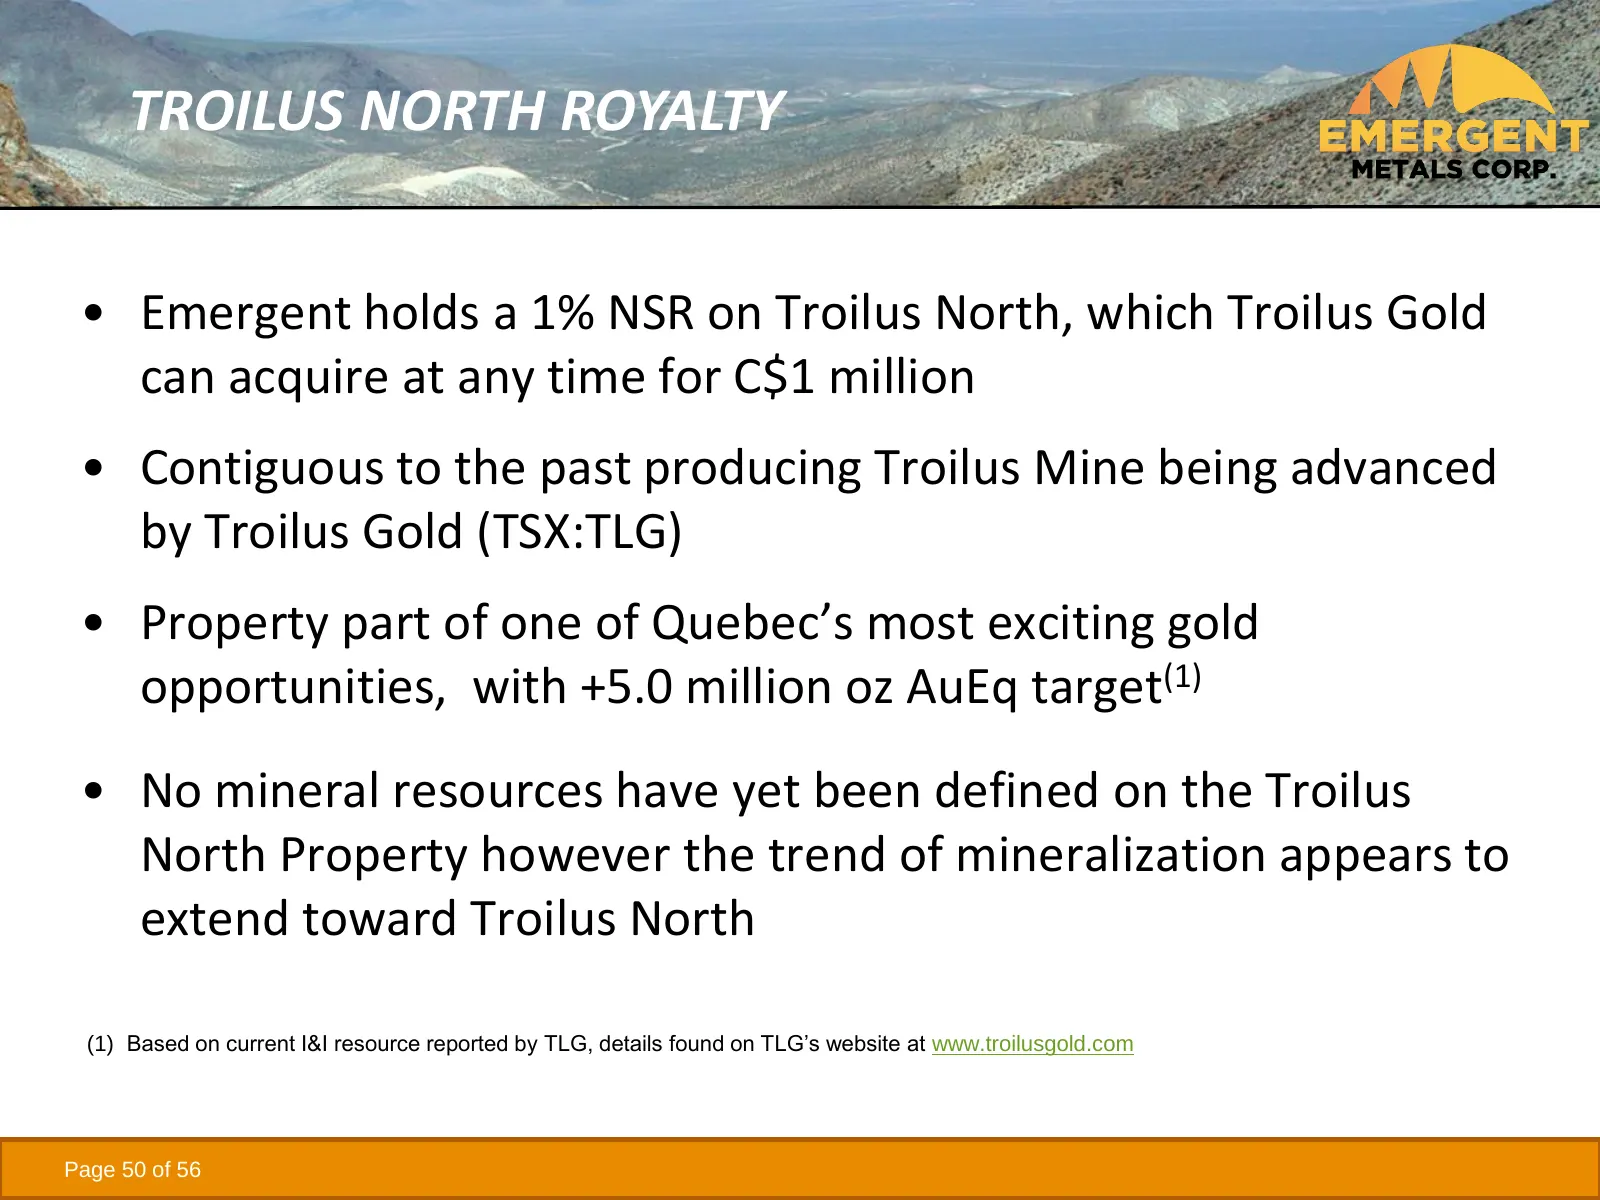
TROILUS NORTH ROYALTY • Emergent holds a 1% NSR on Troilus North, which Troilus Gold can acquire at any time for C$1 million • Contiguous to the past producing Troilus Mine being advanced by Troilus Gold (TSX:TLG) • Property part of one of Quebec’s most exciting gold opportunities, with +5.0 million
Slide 51: Management Team
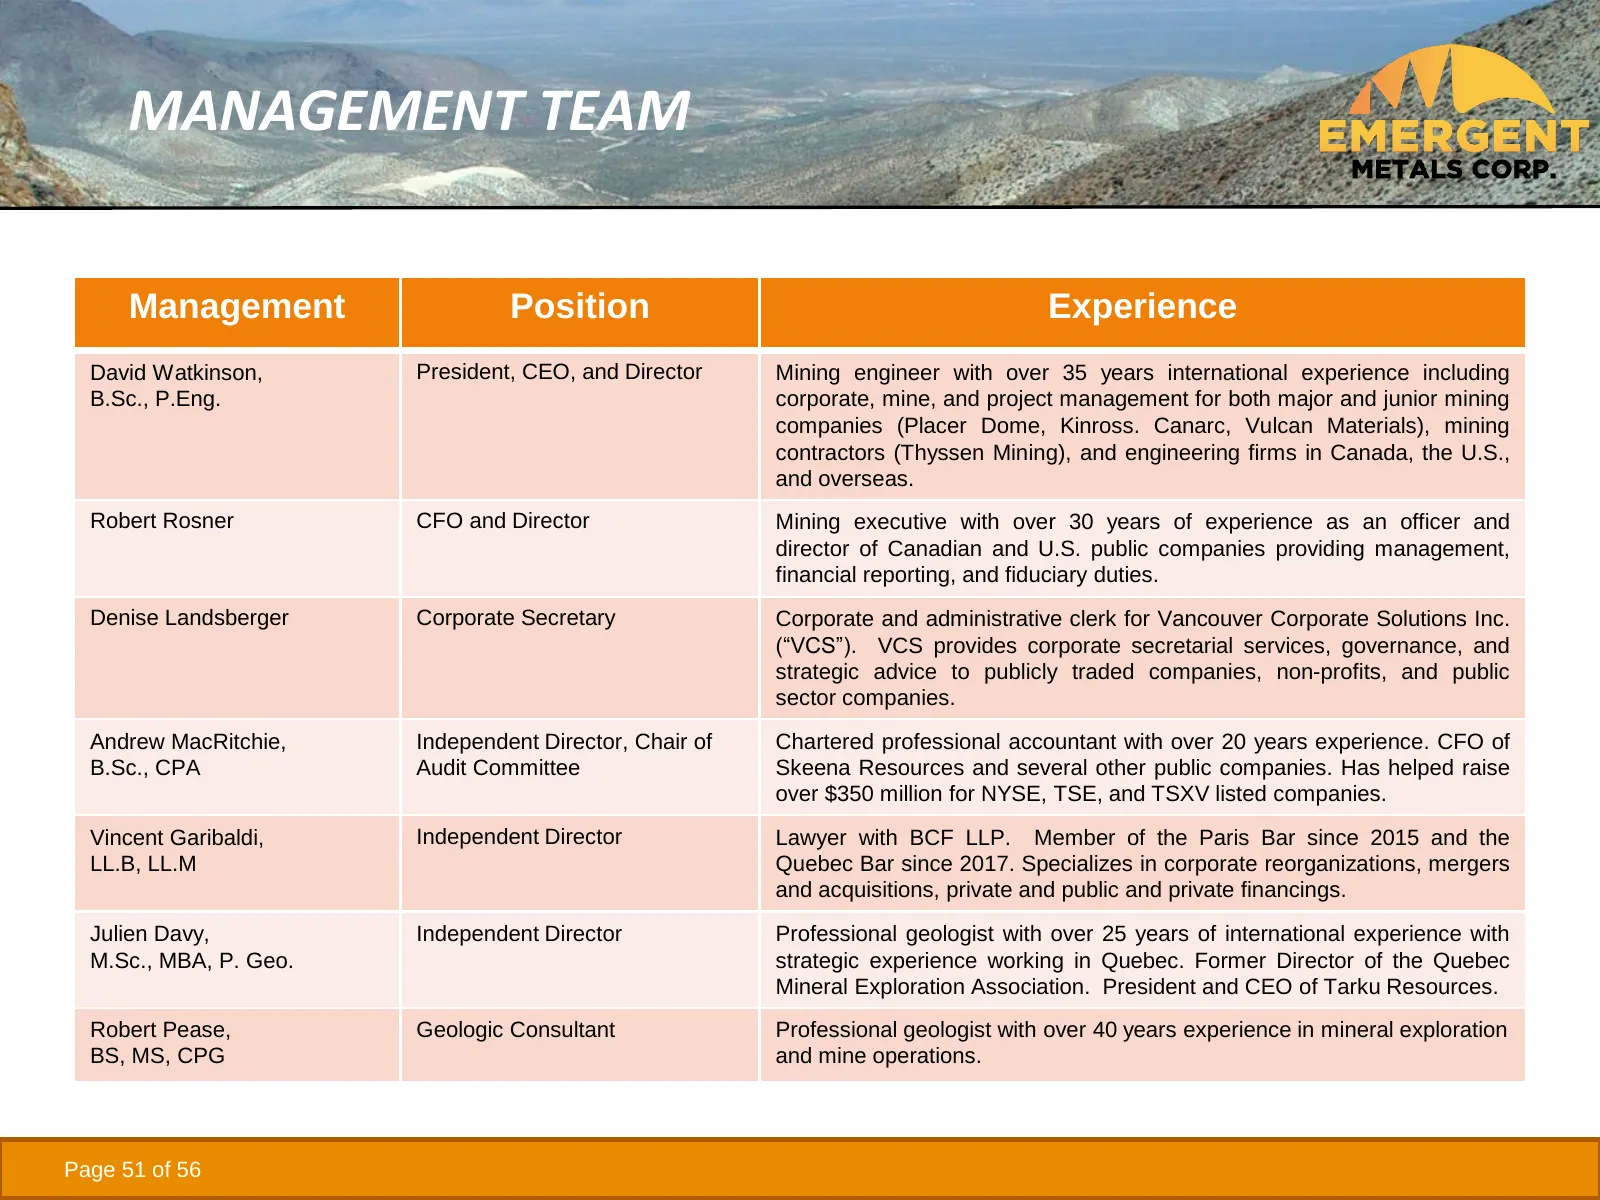
MANAGEMENT TEAM Management Position Experience David Watkinson, President, CEO, and Director Mining engineer with over 35 years international experience including B.Sc., P.Eng. corporate, mine, and project management for both major and junior mining companies (Placer Dome, Kinross. Canarc, Vulcan Ma
Slide 52: Emergent Share Structure
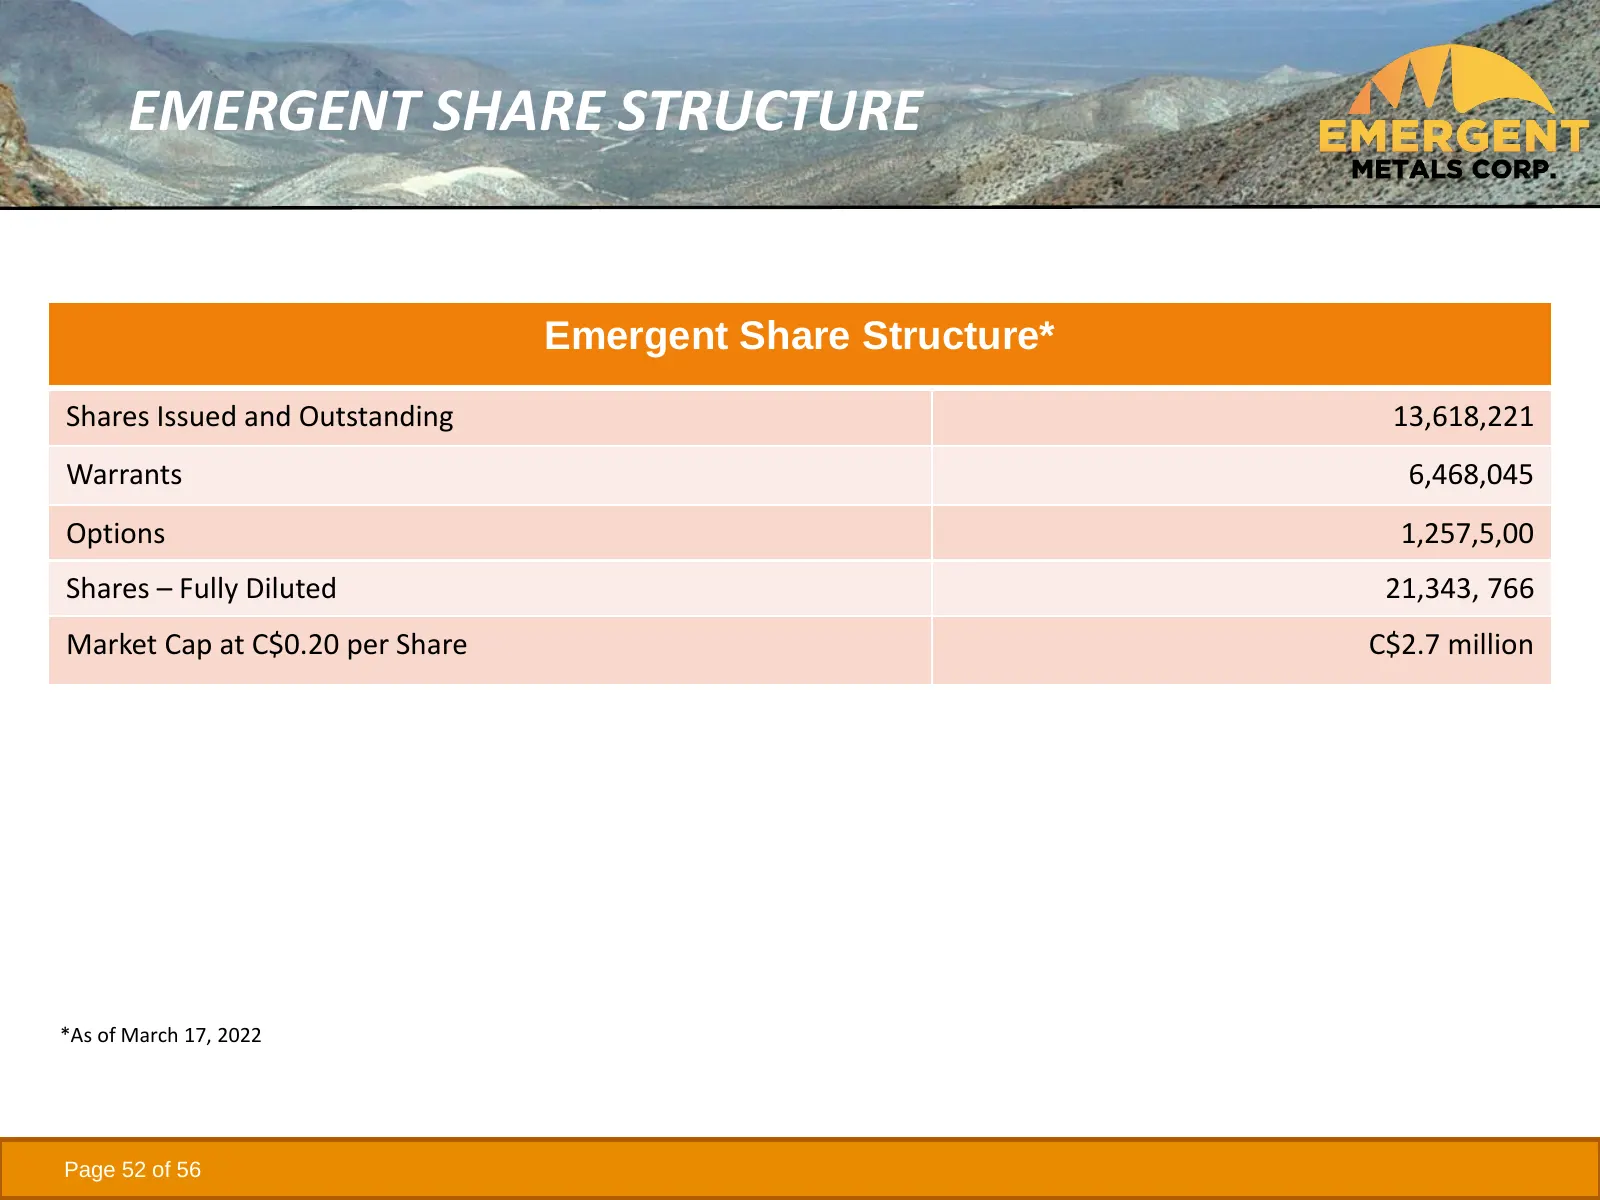
EMERGENT SHARE STRUCTURE Emergent Share Structure* Shares Issued and Outstanding 13,618,221 Warrants 6,468,045 Options 1,257,5,00 Shares – Fully Diluted 21,343, 766 Market Cap at C$0.20 per Share C$2.7 million *As of March 17, 2022 Page 52 of 56
Slide 53: Emergent Peer Comparison - Nevada
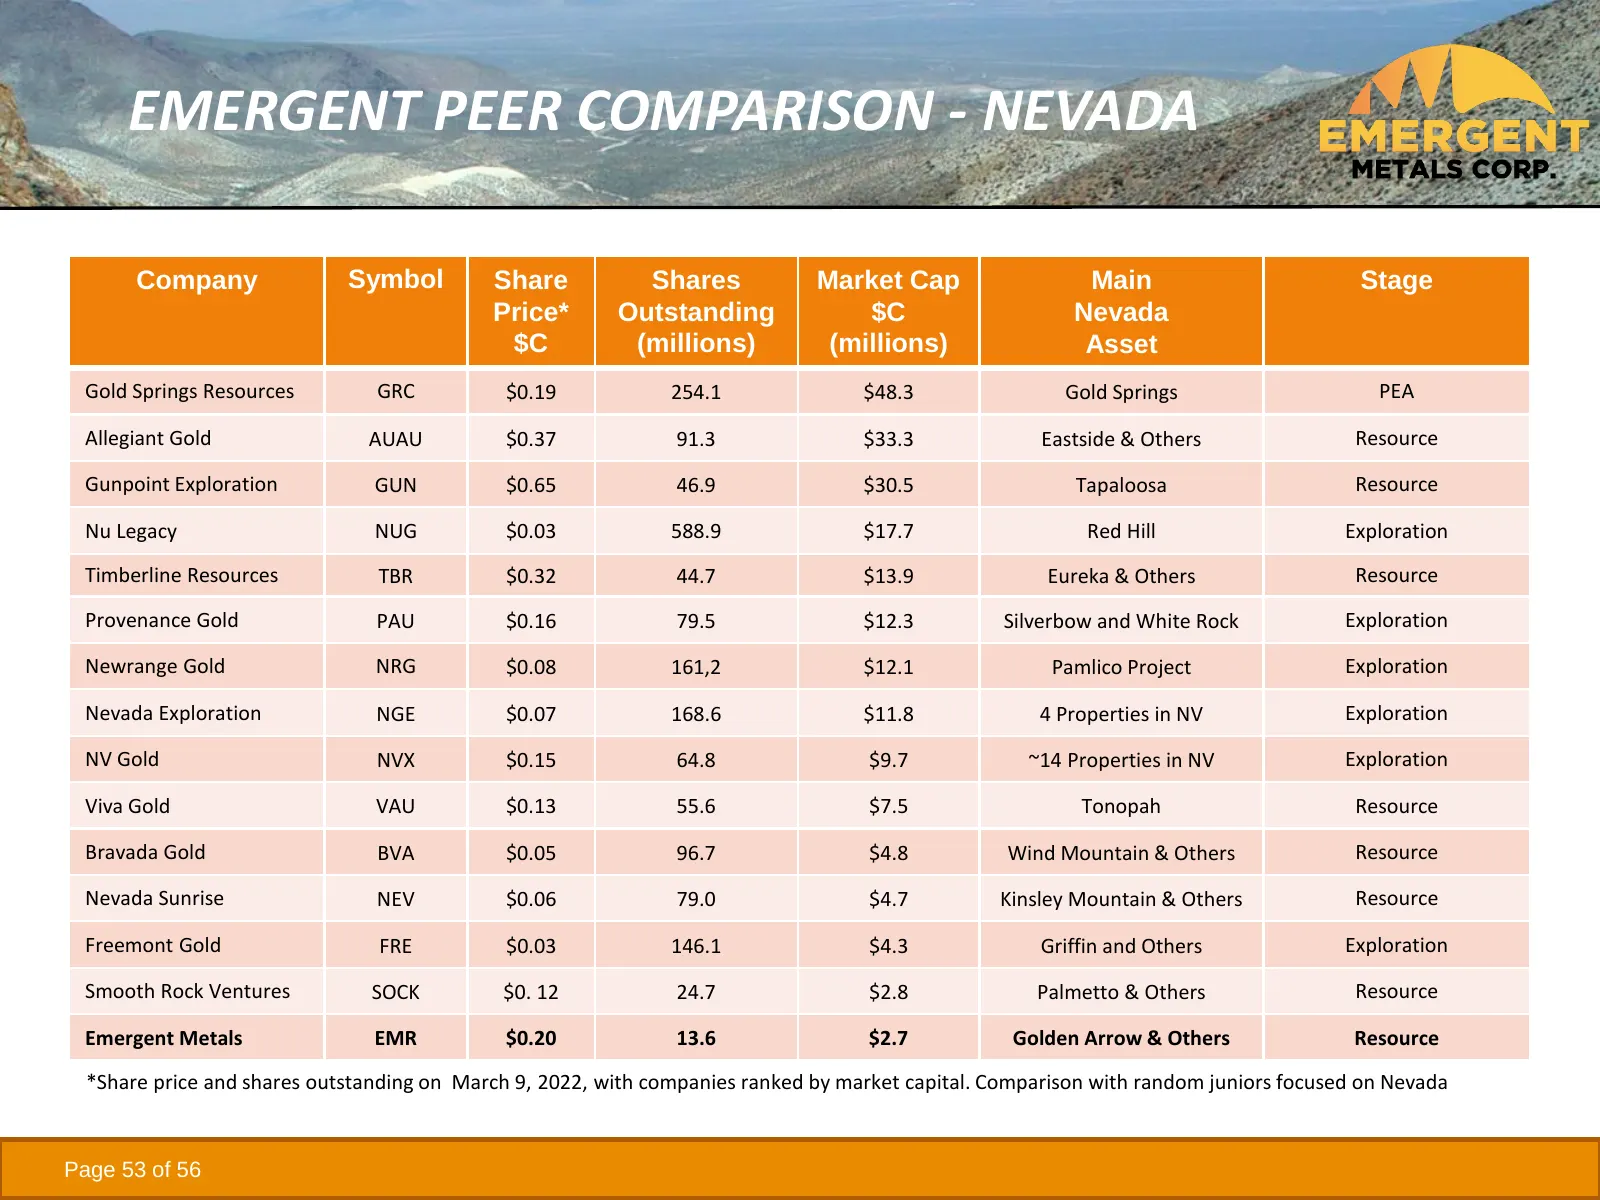
EMERGENT PEER COMPARISON - NEVADA Company Symbol Share Shares Market Cap Main Stage Price* Outstanding $C Nevada $C (millions) (millions) Asset Gold Springs Resources GRC $0.19 254.1 $48.3 Gold Springs PEA Allegiant Gold AUAU $0.37 91.3 $33.3 Eastside & Others Resource Gunpoint Exploration GUN $0.65
Slide 54: Emergent Peer Comparison - Quebec
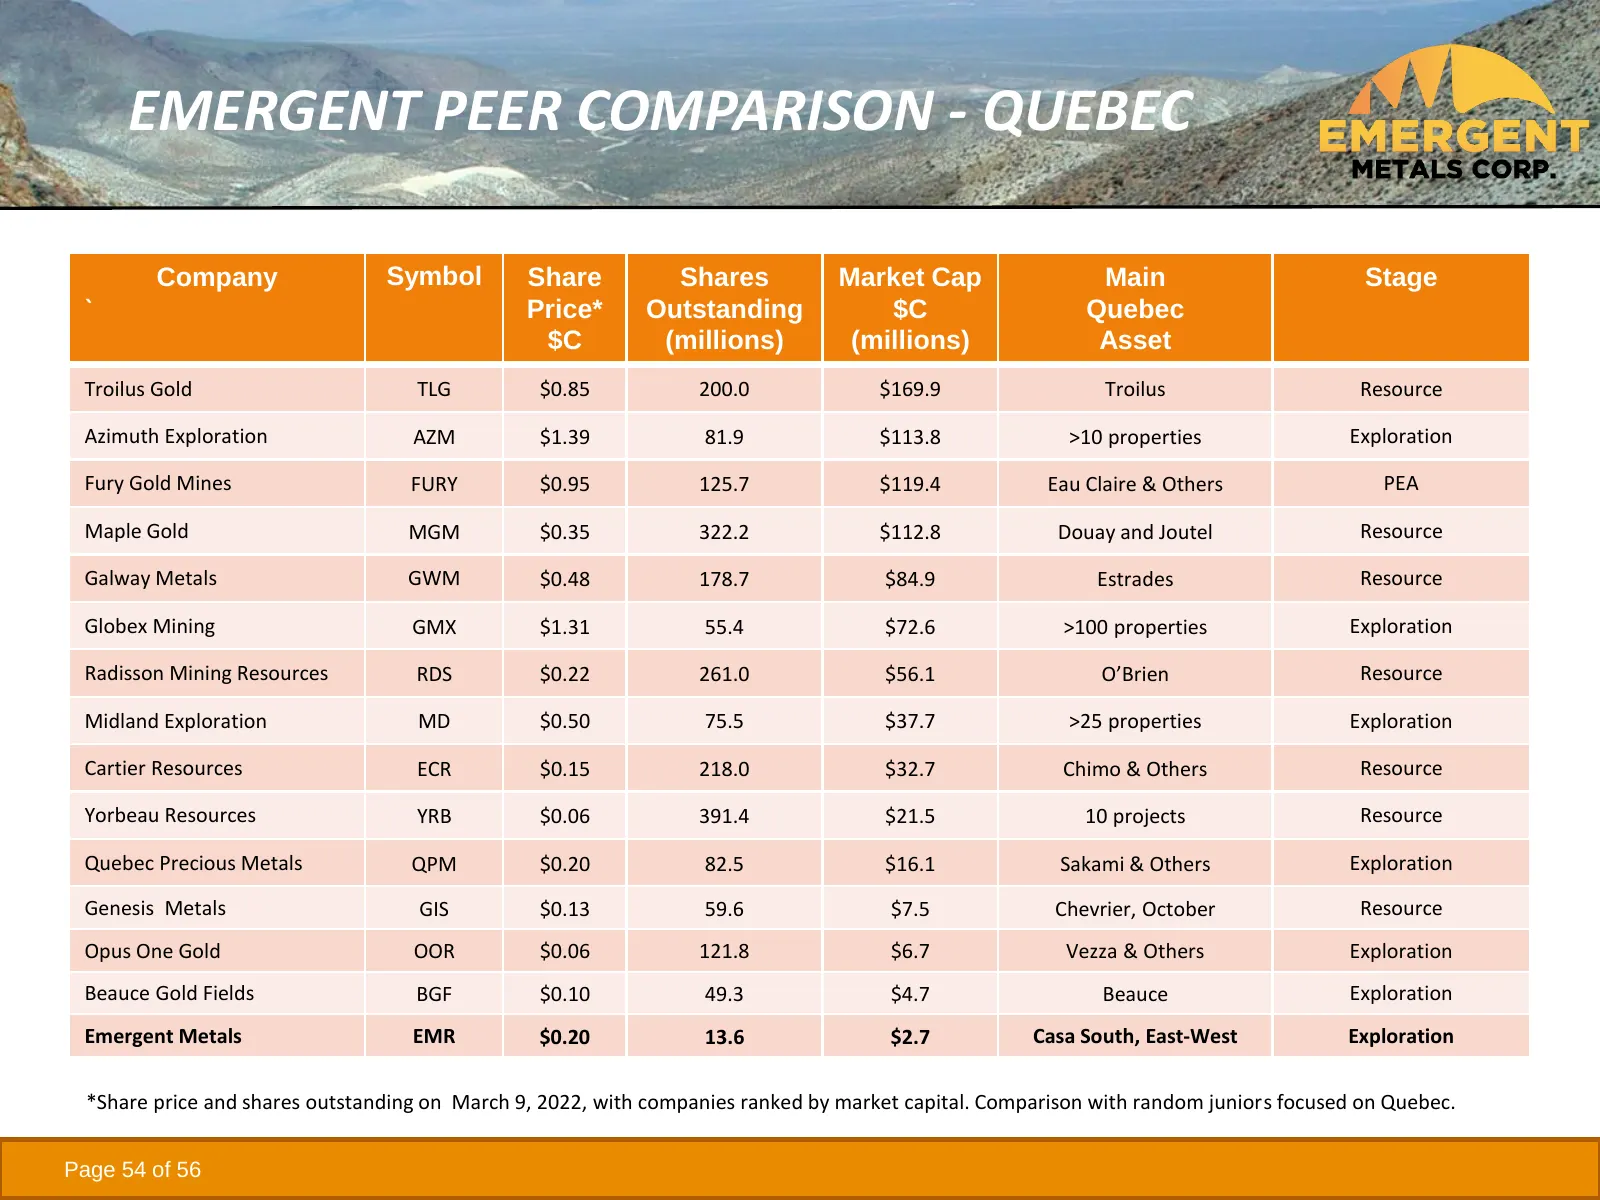
EMERGENT PEER COMPARISON - QUEBEC Company Symbol Share Shares Market Cap Main Stage ` Price* Outstanding $C Quebec $C (millions) (millions) Asset Troilus Gold TLG $0.85 200.0 $169.9 Troilus Resource Azimuth Exploration AZM $1.39 81.9 $113.8 >10 properties Exploration Fury Gold Mines FURY $0.95 125.7
Slide 55: Opportunity Summary
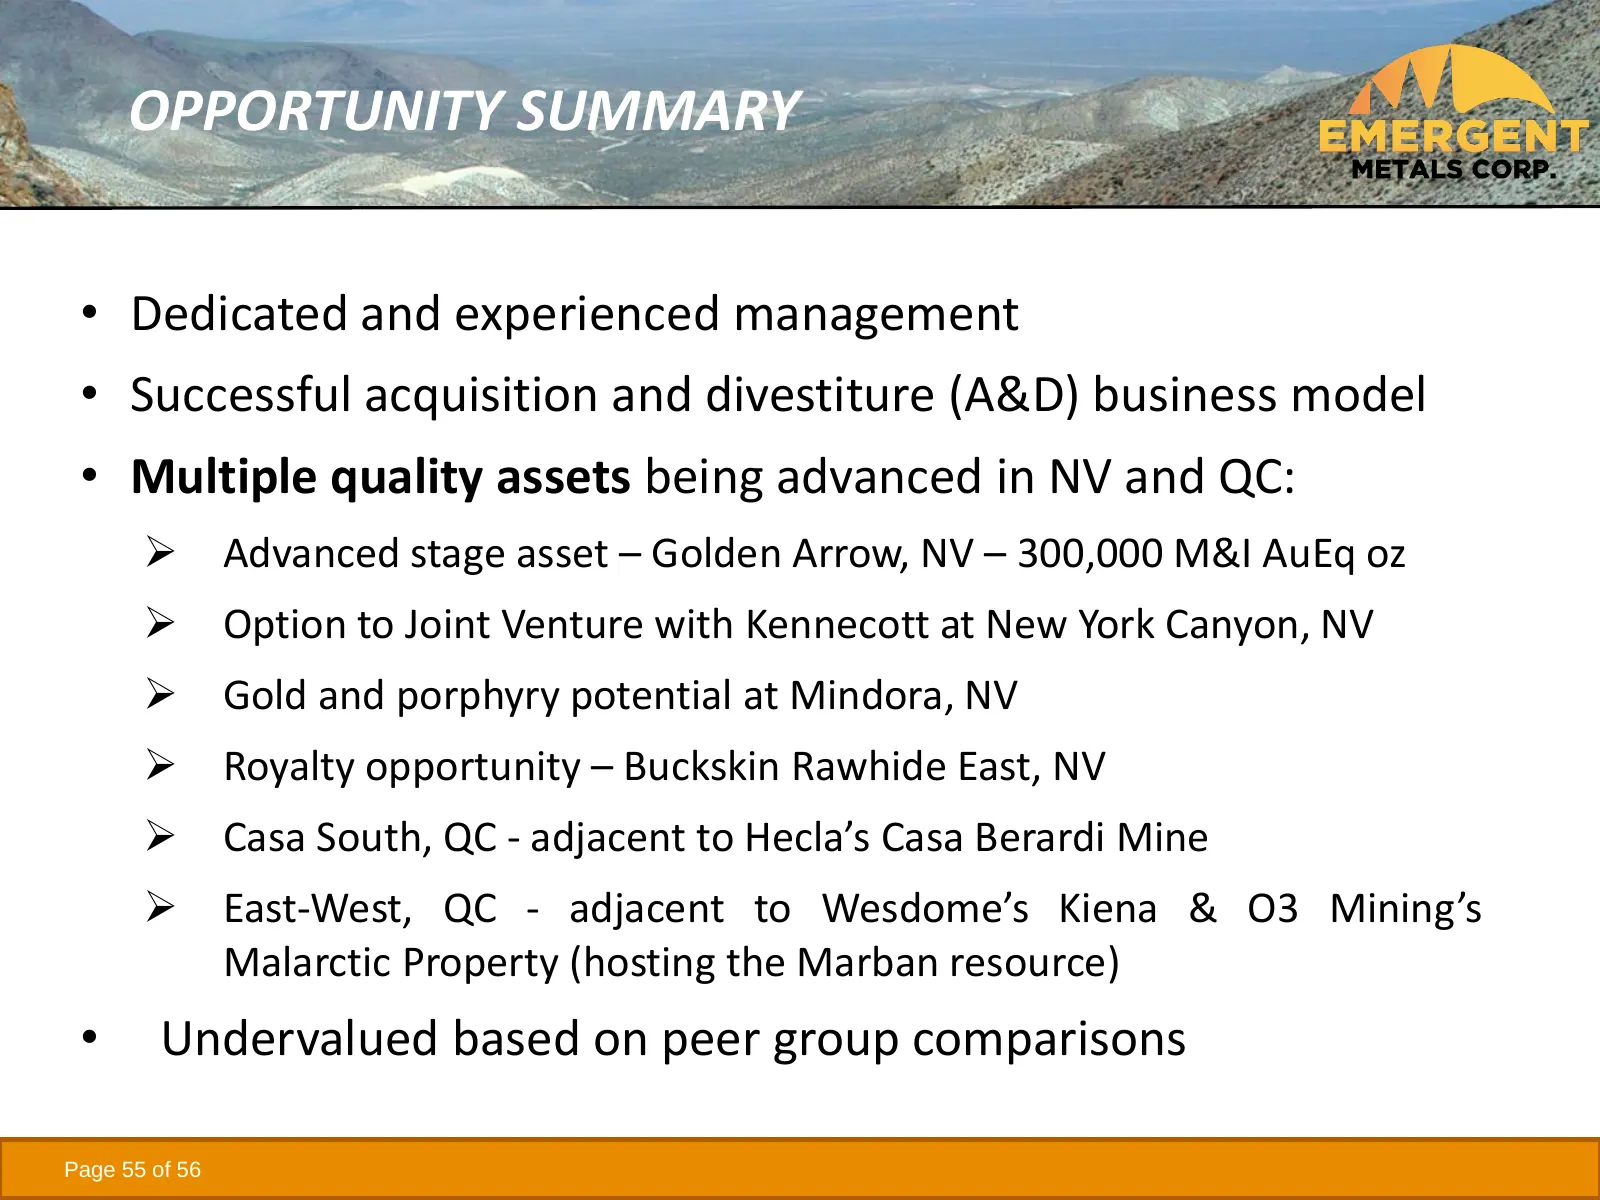
OPPORTUNITY SUMMARY • Dedicated and experienced management • Successful acquisition and divestiture (A&D) business model • Multiple quality assets being advanced in NV and QC: ➢ Advanced stage asset – Golden Arrow, NV – 300,000 M&I AuEq oz ➢ Option to Joint Venture with Kennecott at New York Canyon,
Slide 56: Company and Contact Information
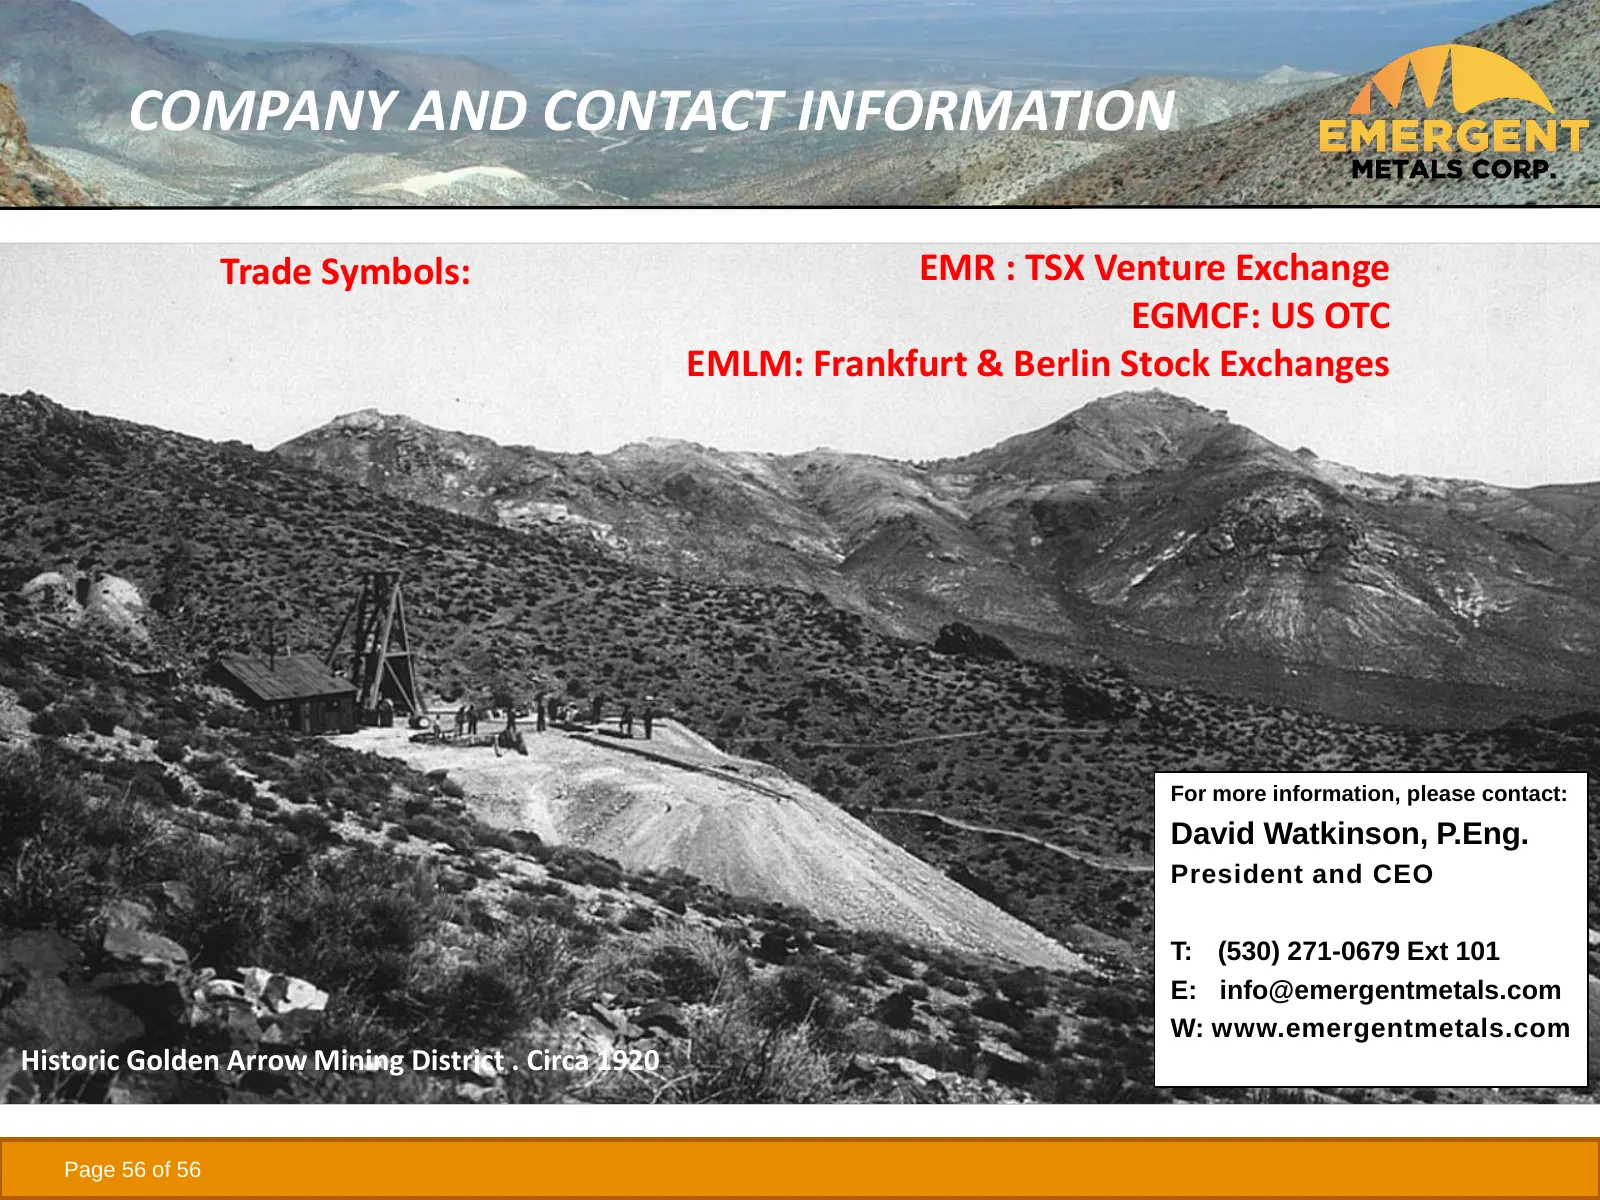
COMPANY AND CONTACT INFORMATION Trade Symbols: EMR : TSX Venture Exchange EGMCF: US OTC EMLM: Frankfurt & Berlin Stock Exchanges For more information, please contact: David Watkinson, P.Eng. President and CEO T: (530) 271-0679 Ext 101 E: [email protected] W: www.emergentmetals.com Historic Gol
Source: Internet Archive copy of emergentmetals.com
More decks from Emergent Metals Corp
 Investor Presentation (May 2026)34 slides · May 2026
 Investor Presentation (July 2024)64 slides · July 2024
 Investor Presentation (March 2024)64 slides · March 2024
 Investor Presentation (January 2024)63 slides · January 2024
 Investor Presentation (November 2023)63 slides · Nov 9, 2023
 Investor Presentation (September 2023)63 slides · Sep 11, 2023