Allegiance Bancshares — Investor Presentation (February 2016)
16 slides from Allegiance Bancshares's investor presentation, Feb 2, 2016
Slide 1: Investor Presentation February 2016
“Jl” AllegianceB NASDAQ: ABTX Investor Presentation February 2016
Slide 2: Safe Harbor Statement
Safe Harbor Statement = “Safe Harbor’ Statement under the Private Securities Litigation Reform Act of 1995: This presentation may contain forward-looking statements within the meaning of the securities laws that are based on various facts and derived utilizing important assumptions, present expectat
Slide 3: Allegiance Bancshares, Inc. Overview
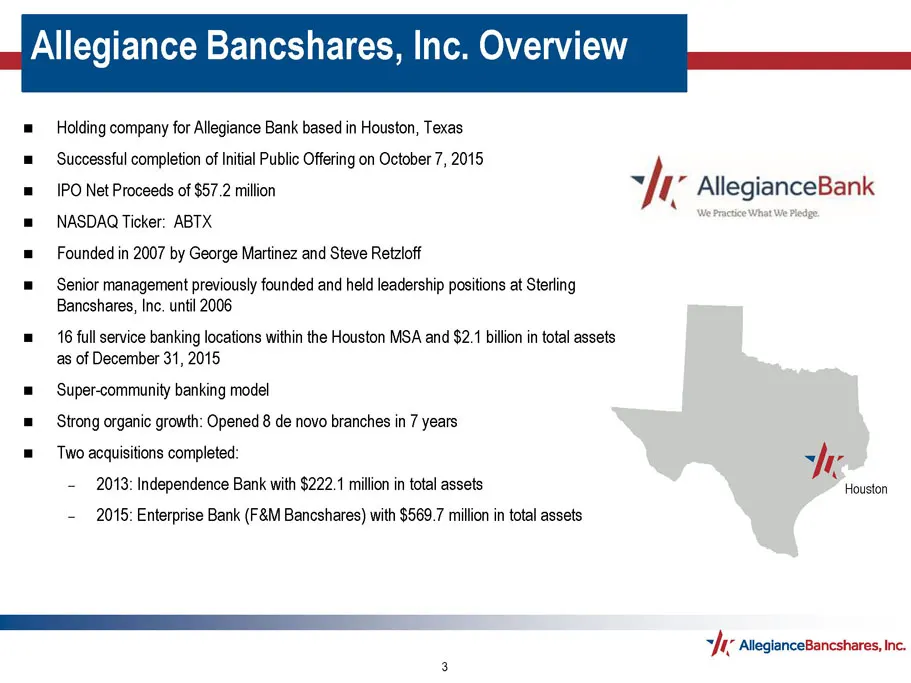
Allegiance Bancshares, Inc. Overview = Holding company for Allegiance Bank based in Houston, Texas = Successful completion of Initial Public Offering on October 7, 2015 : whee "i = IPO Net Proceeds of $57.2 million Mh AllegianceBank m NASDAQ Ticker: ABTX a ara = Founded in 2007 by George Martinez an
Slide 4: Organic Growth and Acquisitions
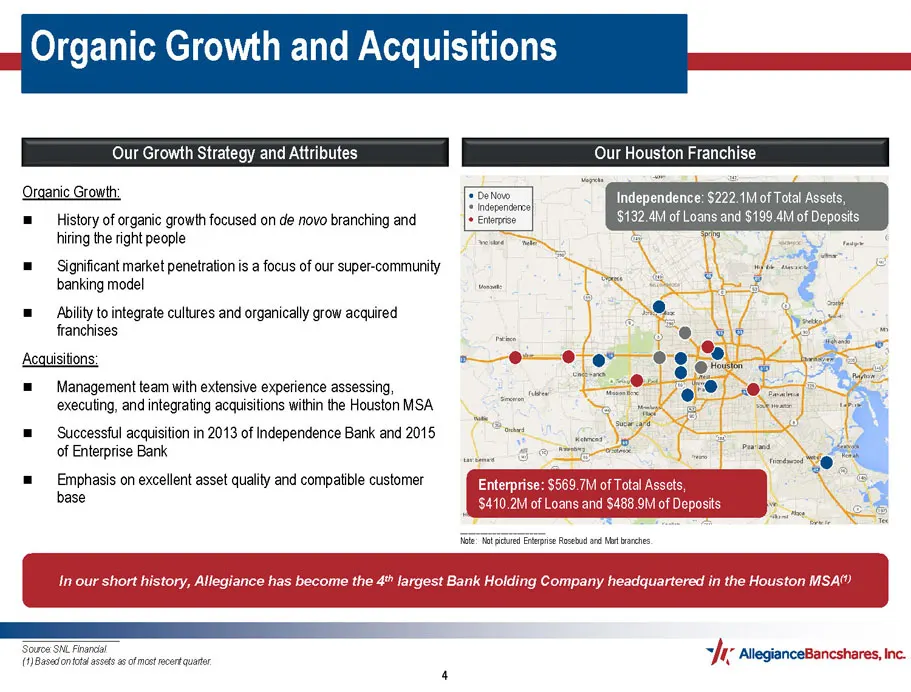
Organic Growth and Acquisitions ur Growth Strategy and Attributes Our Houston Franchise lependence: $222.1M of Total Assets, $132.4 of Loans and $199.4M of Deposits Organic Growth: m= History of organic growth focused on de novo branching and hiring the right people = Significant market penetration
Slide 5: Experienced Leadership
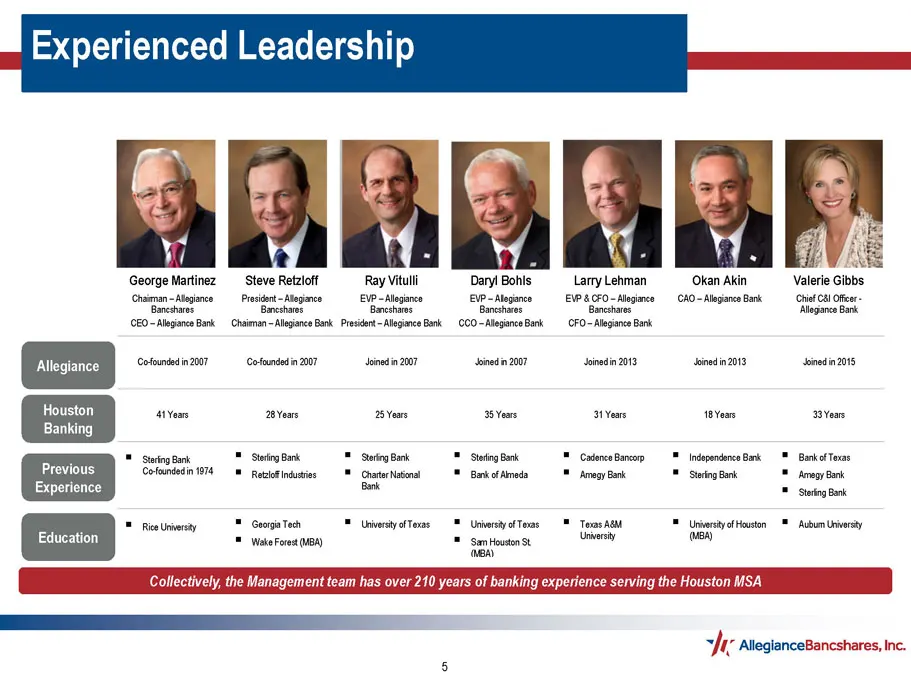
Experienced Leadership ABaR Ate George Martinez Steve Retzloff Ray Vituli Daryl Bohls ——_LarryLehman Okan Akin Valerie Gibbs Charan Algjnee ——Presdt-Alaginea EVP Agana ExP-Alapanee EVP ACFO-AlesinceCAO~Alagiane Sank Oho Cl Oca anche pes ncses Concer Cuneo ‘logo Bark CE0--Alojoce Bank Chaimen= Alegre
Slide 6: Our Super-community Banking Strategy
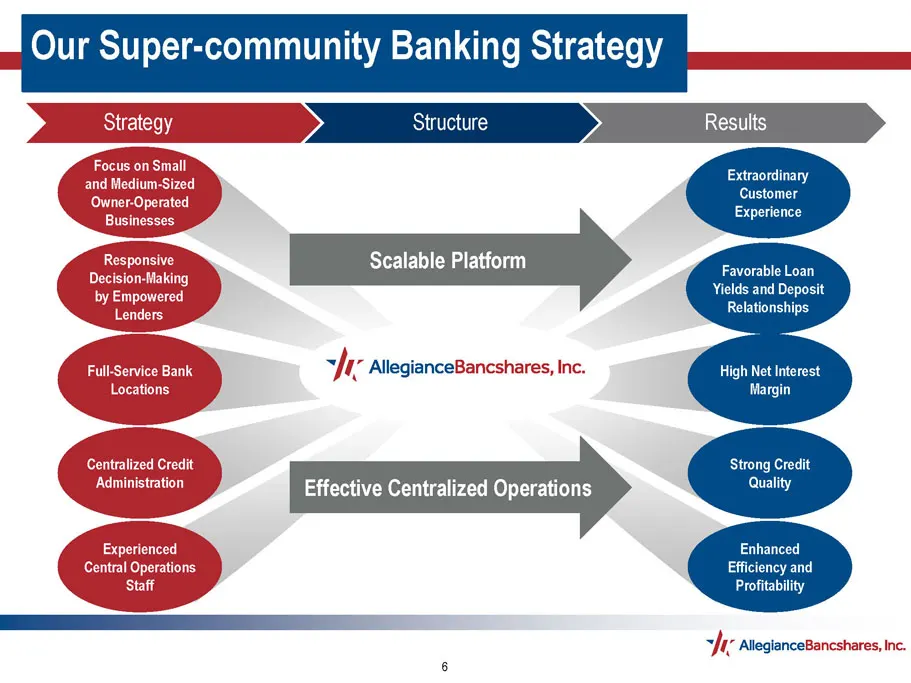
ur Super-community Banking Strateg Extraordinary Customer Experience Scalable Platform Favorable Loan Yields and Deposit Relationships 5 Allegiance! High Net Interest Margin Strong Credit Quality Effective Centralized Operations Enhanced Efficiency and Profitability sft; Alegiancet
Slide 7: Financial Highlights
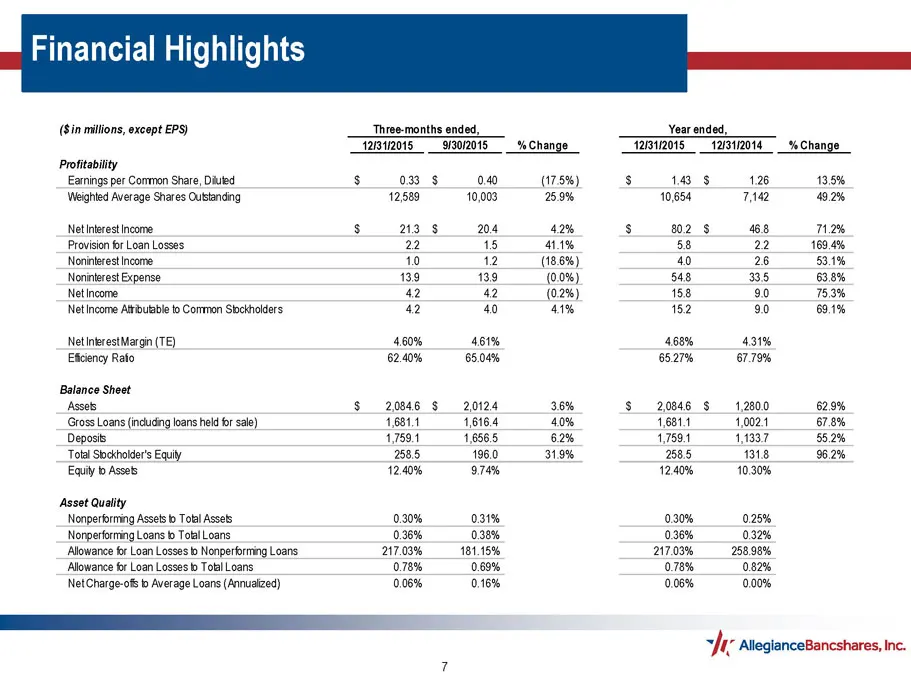
Financial Highlights (Sin millions, except EPS) Profitability Earnings per Common Share, Ditied Weighled Average Shares Outstanding Netinterest income. Provision fr Loan Losses Noninterest Income Noninierest Expense Net income ‘Net ncome Attbuable fo Common Stockholders NetinerestMargin (TE) Eficien
Slide 8: Historical Balance Sheet Growth
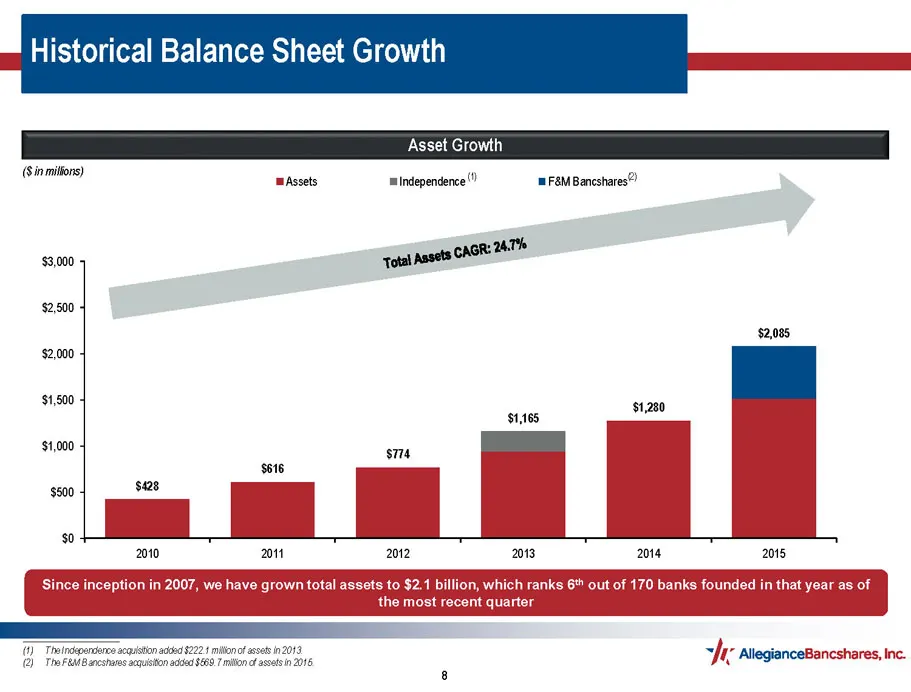
Historical Balance Sheet Growth Asset Growth (Sinmilions) Assets mindependence F&M Bancshares”) 3 24TH $3,000 ‘fal Assets CAR: $2,085 $500 $428 $0 + Iie Ailegiancet
Slide 9: Continued Organic Loan Growth
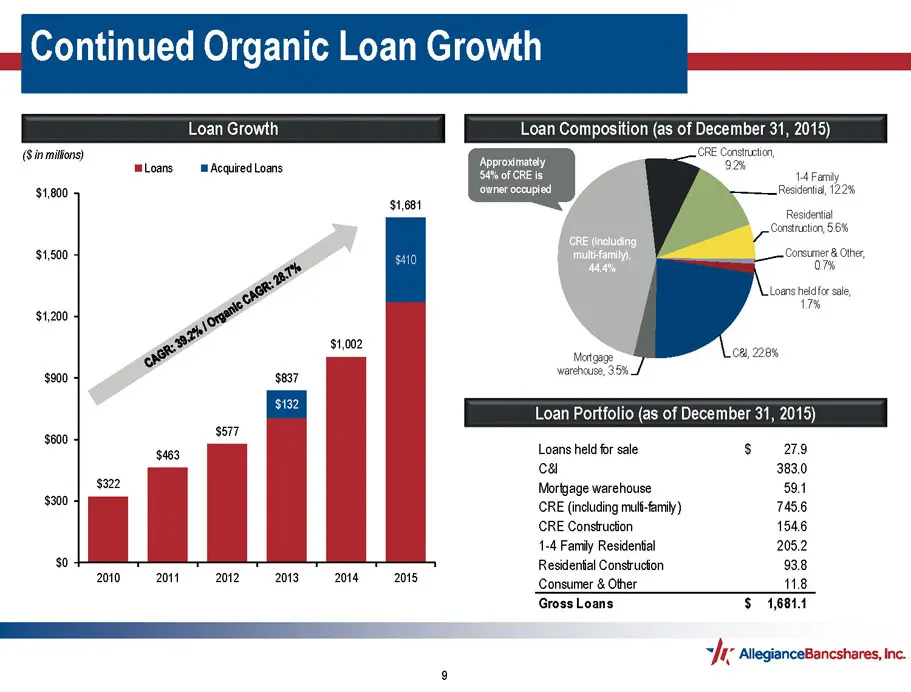
Continued Organic Loan Growth (Sin millions) Approximate Loans m Aequred Loans (geri $1,800 courer occupied $1,681 $1,500 $4,200 $1,002 <6 warchause, 35% Loan Portfolio (as of December 31, 2015) ‘$600 ‘$577 $463 Loans held for sale $79 cal 3830 $322 Mortgage warehouse 501 3000 CRE (including mult-fa
Slide 10: Strong Credit Quality
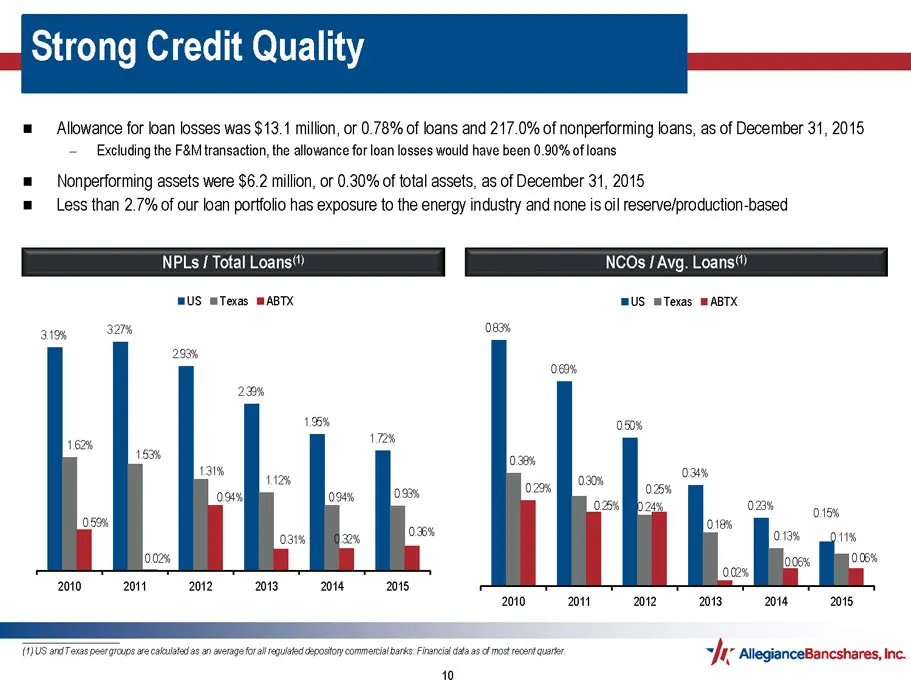
Strong Credit Quality = Allowance for loan losses was $13.1 million, or 0.78% of loans and 217.0% of nonperforming loans, as of December 31, 2015 — Excluding the F&M transaction, the allowance for loan losses would have been 0.90% of loans = — Nonperforming assets were $6.2 million, or 0.30% of tota
Slide 11: Improved Deposit Sourcing and Composition
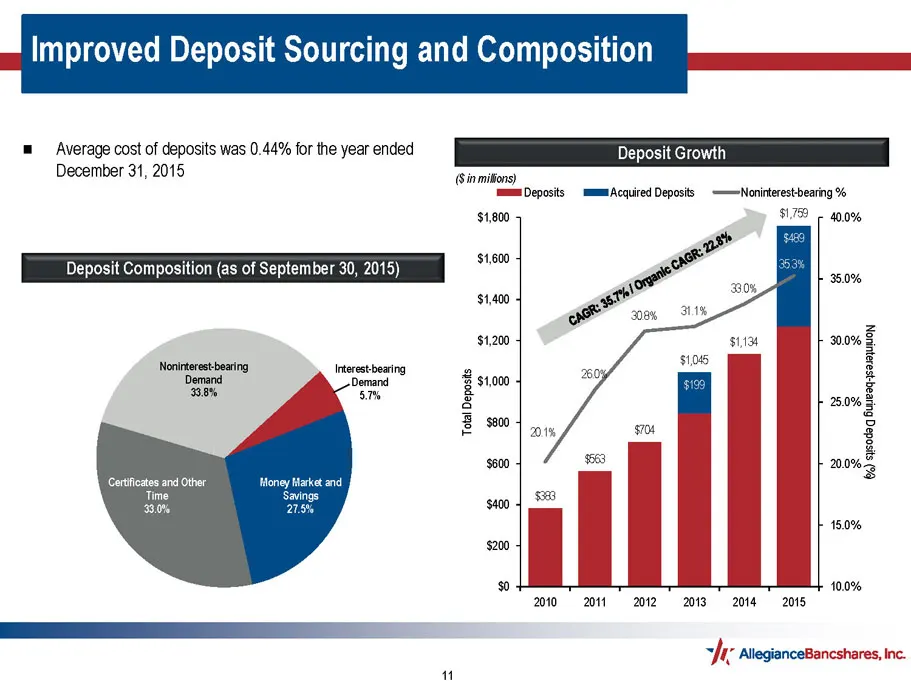
Improved Deposit Sourcing and Composition = ~~ Average cost of deposits was 0.44% for the year ended Deposit Growth December 31, 2015 (Sinmilions) Deposits mammAcquired Deposits | ——Noninterest-bearing % $1,800 S175 40.0% $1600 35.0% $1,400 ast oF z $1,200 30.0% 3 z ‘Noninterest-bearing Interest-bea
Slide 12: Net Interest Income Growth and Improved Efficiency
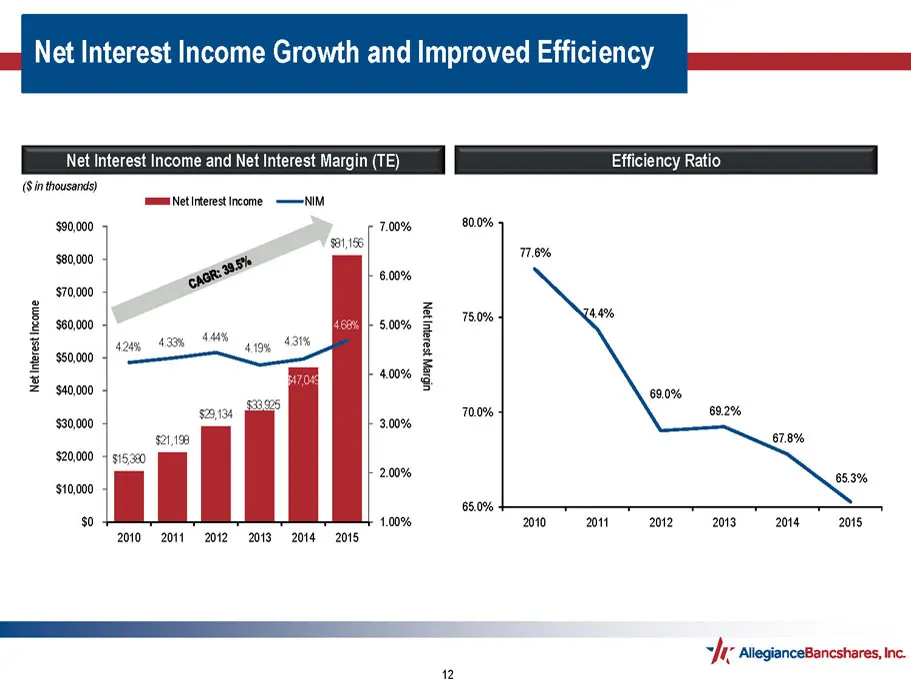
Net Interest Income Growth and Improved Efficiency Net Interest Income and Net Interest Margin (TE) (Sin thousands) mE Netrterest Income —=NM $90,000 7.00% 80.0% 81,155 $80,000 6.00% $70,000 5 z i $60,000 500% @ TAO J sano k = som & 2 $40,000 » 70.0% $30,000 3.00% $20,000 2.00% $10,000 05.0% + $0 1.
Slide 13: Exceptional Earnings Growth and Performance
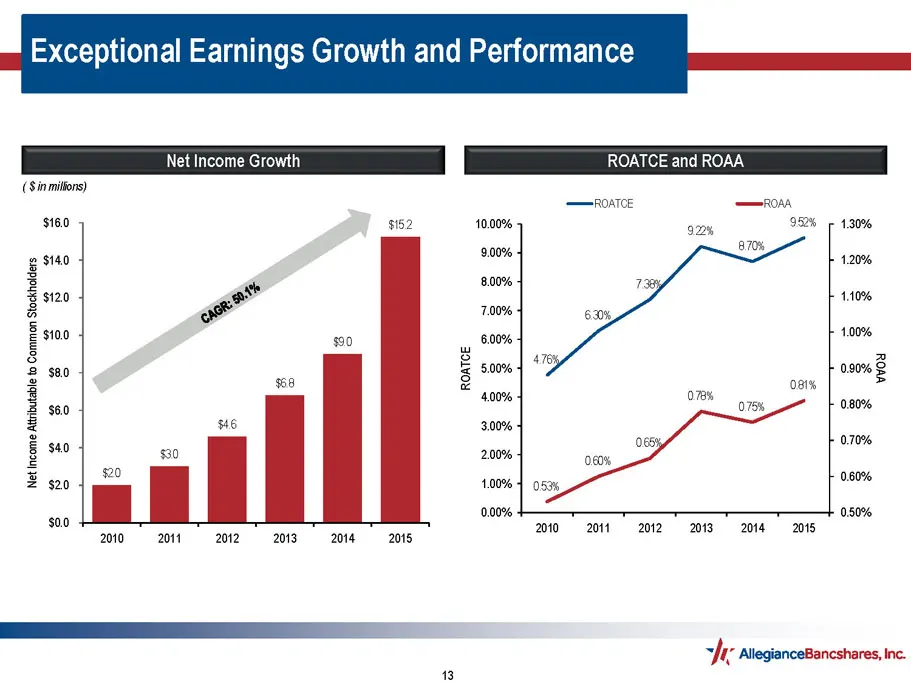
Exceptional Earnings Growth and Performance Net Income Growth ROATCE and ROAA (Sinmilons) Rater rom $160 982 10.00% a 95% 130% 870% g si40 ane 120% 3 8.0% 7 ¥ si20 4.10% a 7.00% 60%, a 0 6.00% 1.00% 4 2 som]! 90% 8 2 seo g r = * 68 2 ie ost% = 4.00% 3 x0 075% 080% 2 #6 3.00% ri o 070% § Ho #30 200%
Slide 14: Dynamic Houston Market
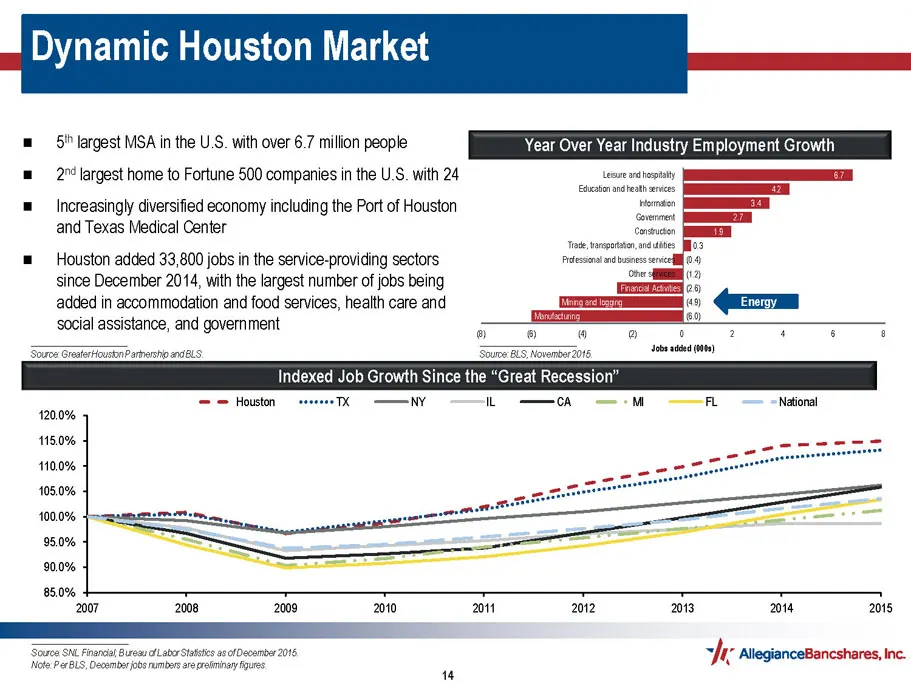
namic Houston Market =~! largest MSA in the U.S. with over 6.7 million people Year Over Year Industry Employment Growth m= = 2% largest home to Fortune 500 companies in the U.S. with 24 eae hospital bear neath arcs = Increasingly diversified economy including the Port of Houston — and Texas Medical
Slide 15: Houston Market: Growth Drivers
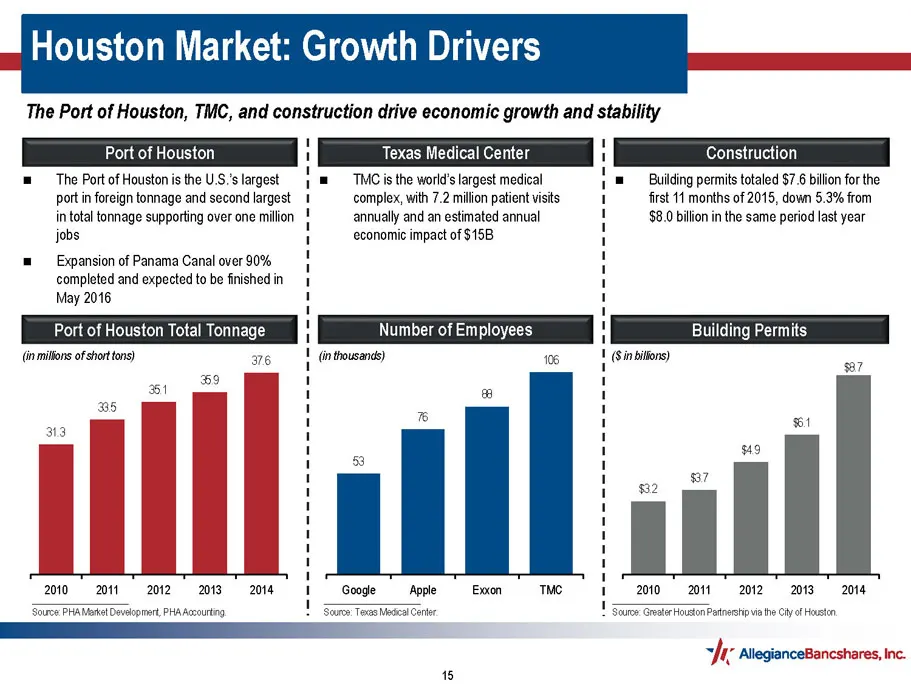
Houston Market: Growth Drivers The Port of Houston, TMC, and construction drive economic growth and stability Port of Houston Texas Medical Center = The Port of Houston is the U.S’slargest | = —TMCis the world’s largest medical = Building permits totaled $7.6 billion for the port in foreign tonnage
Slide 16: Houston MSA Banking Landscape
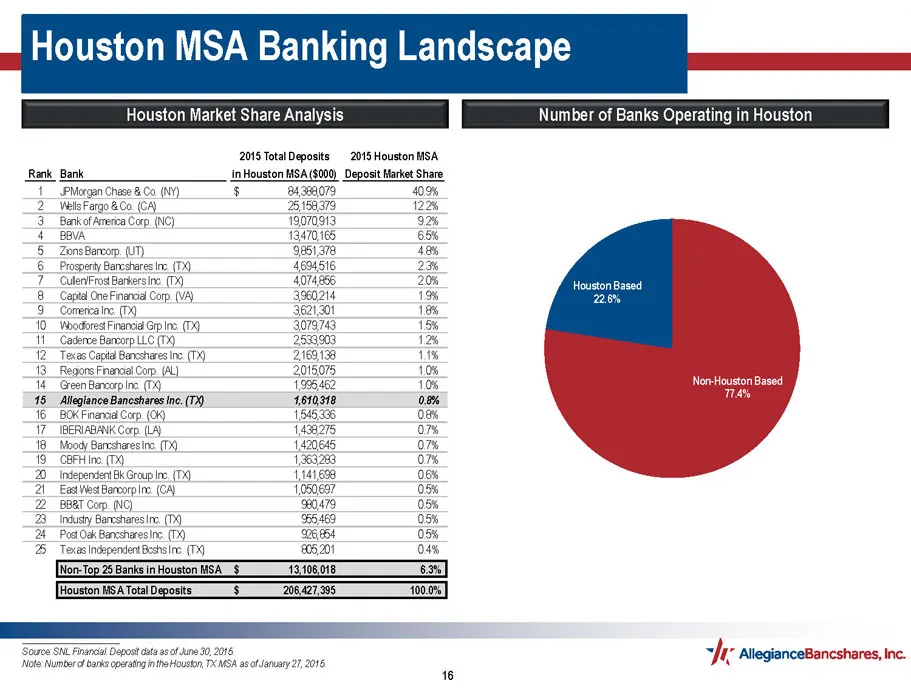
uston MSA Banking Landscape Houston Market Share Analysis Number of Banks Operating in Houston 2018 Total Deposits 2015 Houston MSA Rank Bank InHouston MSA($000) Deposit Market Share 1 .PMoxgan Ghose & Go (NY) $ 40% 2 Was Fargo &Co. (CA) 122% 3 BarkofArenca Corp. (NO) 92% 4 BBVA 65% 5 _ZensBarcop UT
Source: SEC EDGAR · 8-K filed Feb 2, 2016
More decks from Allegiance Bancshares Inc
 Q2 2022 Earnings Presentation16 slides · Jul 29, 2022
 Q1 2022 Earnings Presentation19 slides · Apr 28, 2022
 FY2021 Earnings Presentation18 slides · Jan 28, 2022
 Q4 2021 Earnings Presentation19 slides · Jan 28, 2022
 Merger or Acquisition (November 2021)28 slides · Nov 8, 2021
 Q3 2021 Earnings Presentation17 slides · Oct 28, 2021