Bob Evans Farms — Evans BOB Farms — Investor Day (June 2008)
152 slides from Bob Evans Farms's investor day presentation, Jun 4, 2008
Slide 1: Regional Brands, National Potential Analyst Day
Regional Brands, National Potential Analyst Day June 4, 2008
Slide 2: Dave Poplar, VP Investor Relations
Dave Poplar Vice President Investor Relations
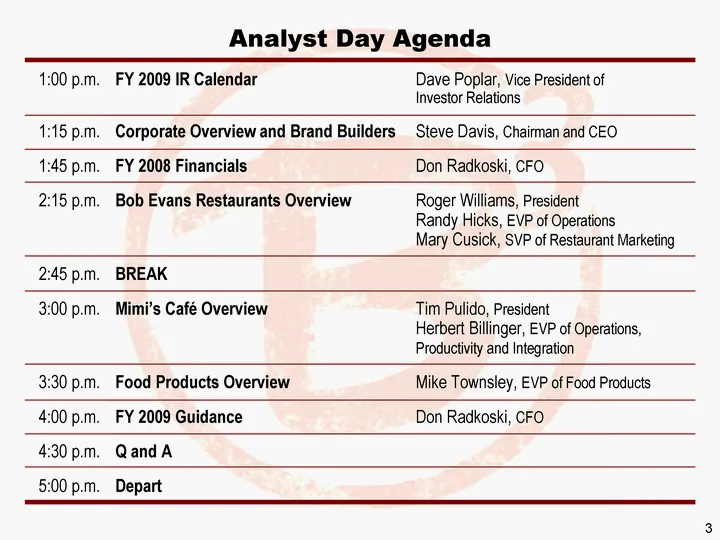
Slide 3: Analyst Day Agenda
Analyst Day Agenda 1:00 p.m. FY 2009 IR Calendar Dave Poplar, Vice President of Investor Relations 1:15 p.m. Corporate Overview and Brand Builders Steve Davis, Chairman and CEO 1:45 p.m. FY 2008 Financials Don Radkoski, CFO 2:15 p.m. Bob Evans Restaurants Overview Roger Williams, President Randy Hic
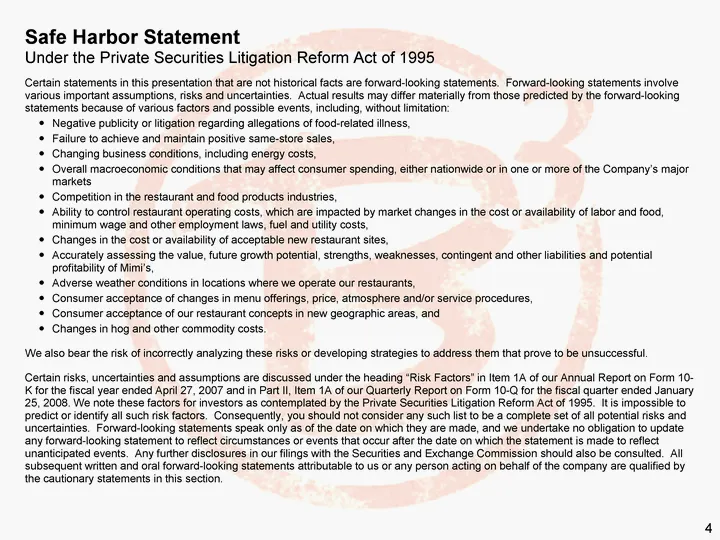
Slide 4: Safe Harbor Statement
Safe Harbor Statement Under the Private Securities Litigation Reform Act of 1995 Certain statements in this presentation that are not historical facts are forward-looking statements. Forward-looking statements involve various important assumptions, risks and uncertainties. Actual results may differ
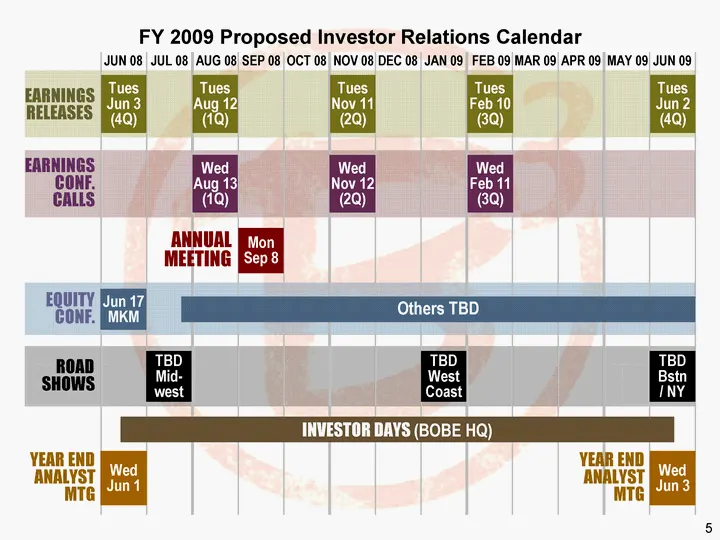
Slide 5: FY 2009 Proposed Investor Relations Calendar
FY 2009 Proposed Investor Relations Calendar JUN 08 JUL 08 AUG 08 SEP 08 OCT 08 NOV 08 DEC 08 JAN 09 FEB 09 MAR 09 APR 09 MAY 09 JUN 09 EARNINGS RELEASES Tues Jun 3 (4Q) Tues Aug 12 (1Q) Tues Nov 11 (2Q) Tues Feb 10 (3Q) Tues Jun 2 (4Q) EARNINGS CONF. CALLS Wed Aug 13 (1Q) Wed Nov 12 (2Q) Wed Feb 11
Slide 6: Merl Beery, SVP Product Innovation & Technical Services
Merl Beery Senior Vice President Product Innovation & Technical Services
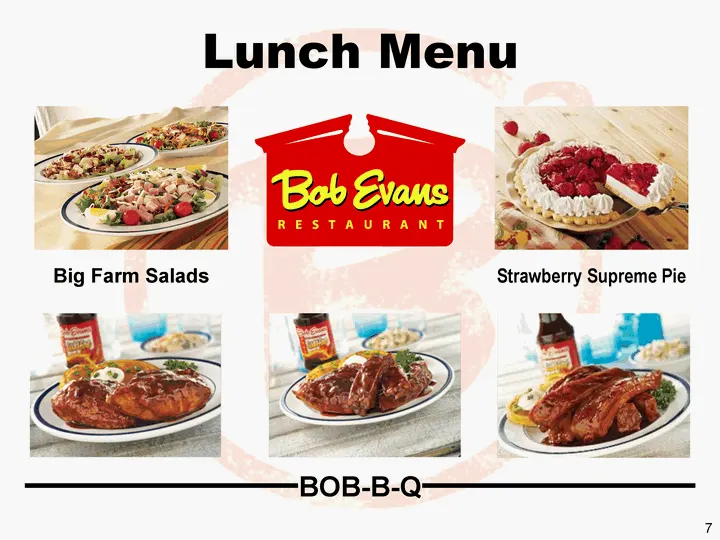
Slide 7: Lunch Menu
Lunch Menu Lunch Menu Strawberry Supreme Pie Big Farm Salads BOB-B-Q
Slide 8: Steve Davis, Chairman and CEO
Steve Davis Chairman and Chief Executive Officer
Slide 9: Company & Segment Overview, BEST Brand Builders
Company & Segment Overview BEST Brand Builders
Slide 10: Company Overview
Company Overview Full-service restaurant company with a complementary retail food and food service business FY '08 net sales: $1.7 billion, up 5.0% FY '08 reported net income: $64.9 million, up 7.2% Approximately 49,000 employees NASDAQ (ticker: BOBE) Market cap = approximately $900 million
Slide 11: Business Segments
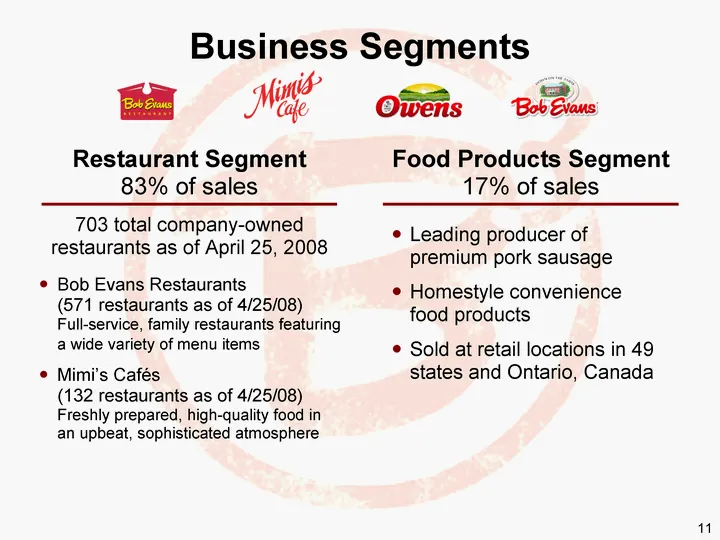
Business Segments Restaurant Segment 83% of sales Food Products Segment 17% of sales Bob Evans Restaurants (571 restaurants as of 4/25/08) Full-service, family restaurants featuring a wide variety of menu items Mimi's Cafes (132 restaurants as of 4/25/08) Freshly prepared, high-quality food in an up
Slide 12: Restaurants
Restaurants Ba in
Slide 13: Overview
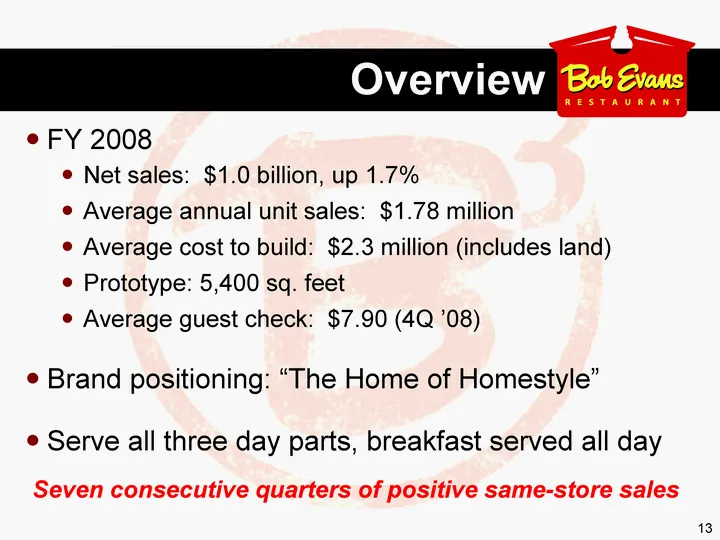
Overview FY 2008 Net sales: $1.0 billion, up 1.7% Average annual unit sales: $1.78 million Average cost to build: $2.3 million (includes land) Prototype: 5,400 sq. feet Average guest check: $7.90 (4Q '08) Brand positioning: "The Home of Homestyle" Serve all three day parts, breakfast served all day
Slide 14: Locations
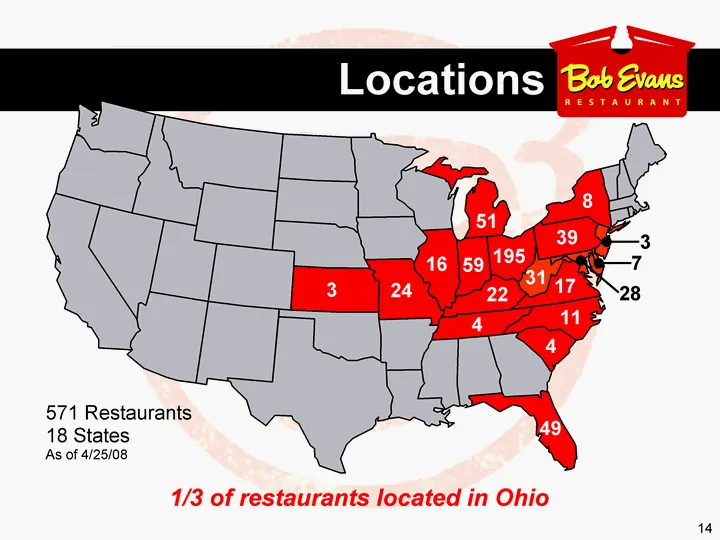
Locations 1/3 of restaurants located in Ohio 195 59 16 24 3 51 31 39 8 3 7 28 22 4 17 11 4 49 571 Restaurants 18 States As of 4/25/08
Slide 15: Day Part Mix (4Q FY '08)
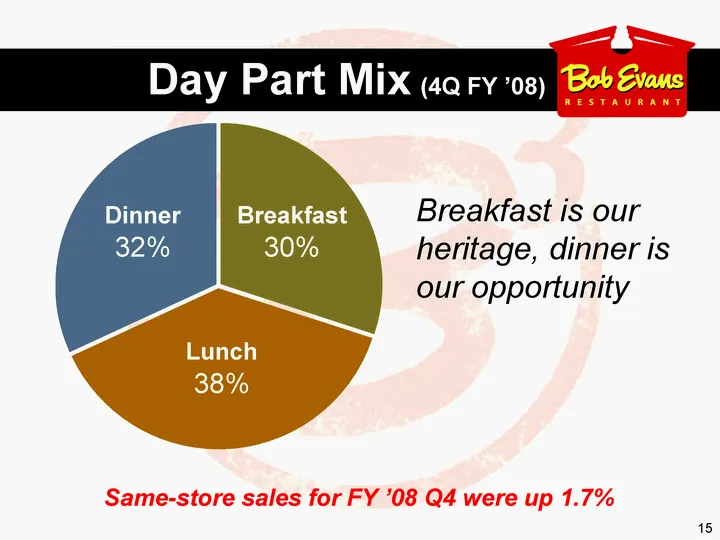
Day Part Mix (4Q FY '08) Same-store sales for FY '08 Q4 were up 1.7% Breakfast 30% Lunch 38% Dinner 32% Breakfast is our heritage, dinner is our opportunity
Slide 16: Same Store Sales (Core)
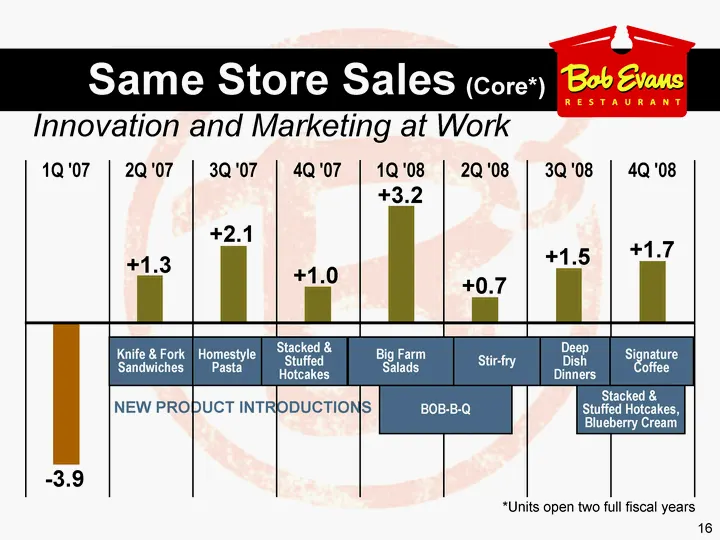
Same Store Sales (Core*) Innovation and Marketing at Work *Units open two full fiscal years 2Q '07 3Q '07 4Q '07 1Q '08 2Q '08 3Q '08 4Q '08 - -3.9 +1.3 +2.1 +1.0 +3.2 +0.7 +1.5 +1.7 1Q '07 NEW PRODUCT INTRODUCTIONS Knife & Fork Sandwiches Homestyle Pasta Stacked & Stuffed Hotcakes Big Farm Salads S
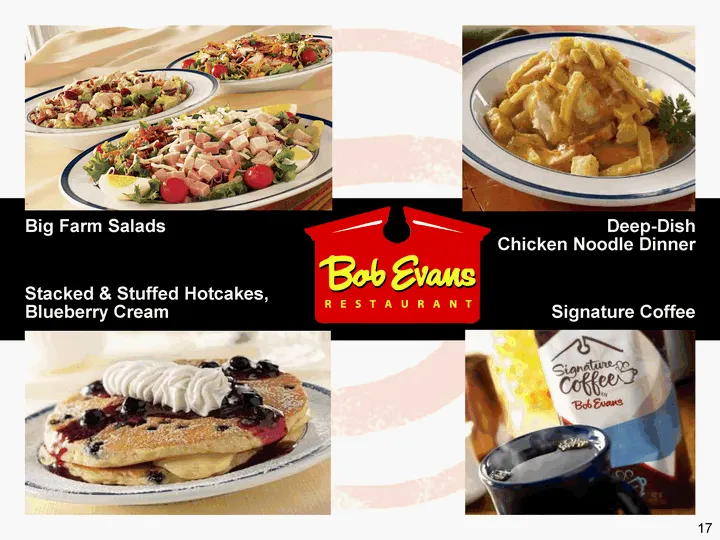
Slide 17: Deep-Dish Chicken Noodle Dinner
Deep-Dish Chicken Noodle Dinner Chicken Noodle Dinner Chicken Noodle Dinner Big Farm Salads Signature Coffee Stacked & Stuffed Hotcakes, Blueberry Cream
Slide 18: New Restaurant Development
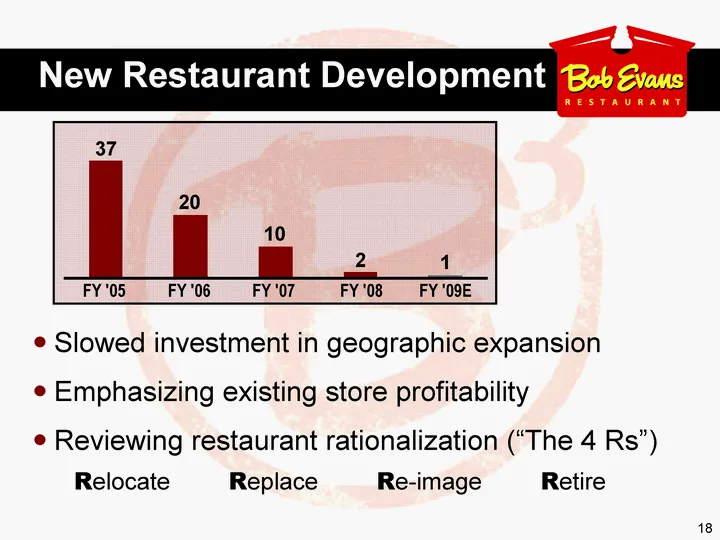
New Restaurant Development 37 20 10 2 1 FY '05 FY '06 FY '07 FY '08 FY '09E Slowed investment in geographic expansion Emphasizing existing store profitability Reviewing restaurant rationalization ("The 4 Rs") Relocate Replace Re-image Retire
Slide 19: 2009 Objectives
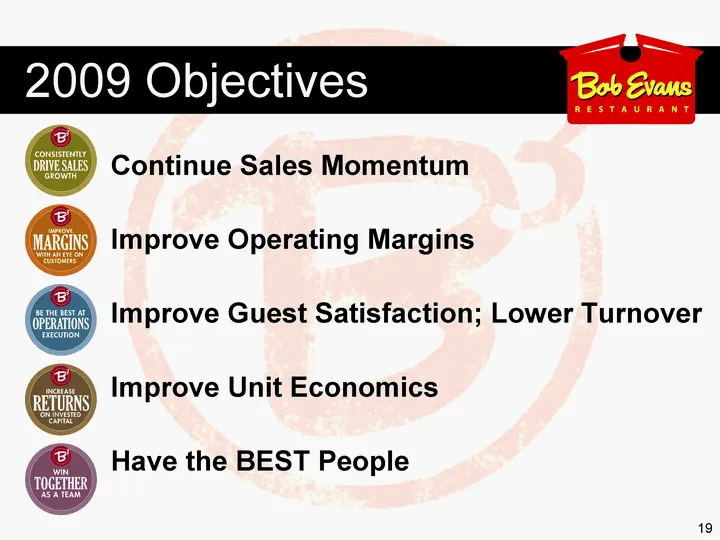
Continue Sales Momentum Improve Operating Margins Improve Guest Satisfaction; Lower Turnover Improve Unit Economics Have the BEST People 2009 Objectives
Slide 20: Overview
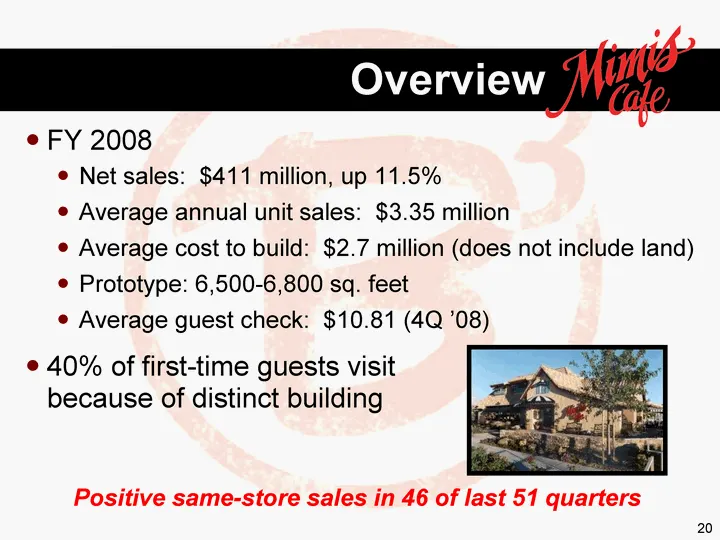
Overview FY 2008 Net sales: $411 million, up 11.5% Average annual unit sales: $3.35 million Average cost to build: $2.7 million (does not include land) Prototype: 6,500-6,800 sq. feet Average guest check: $10.81 (4Q '08) 40% of first-time guests visit because of distinct building Positive same-store
Slide 21: Locations
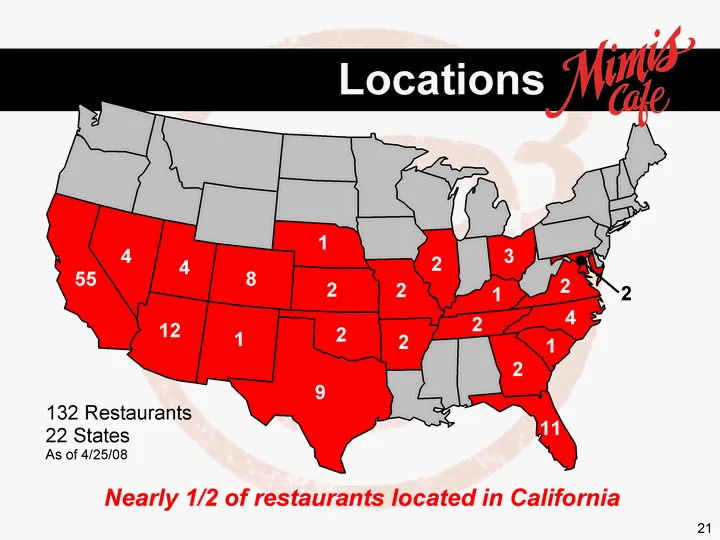
Locations Nearly 1/2 of restaurants located in California 3 2 2 2 2 1 2 2 4 1 11 132 Restaurants 22 States As of 4/25/08 2 2 1 2 9 1 8 4 12 55 4
Slide 22: Locations
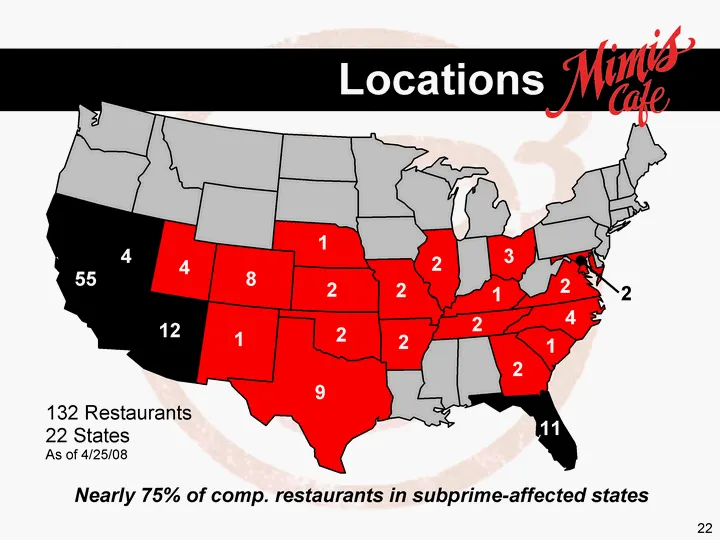
Locations Nearly 75% of comp. restaurants in subprime-affected states 3 2 2 2 2 1 2 2 4 1 11 132 Restaurants 22 States As of 4/25/08 2 2 1 2 9 1 8 4 12 55 4
Slide 23: Day Part Mix (4Q FY '08)
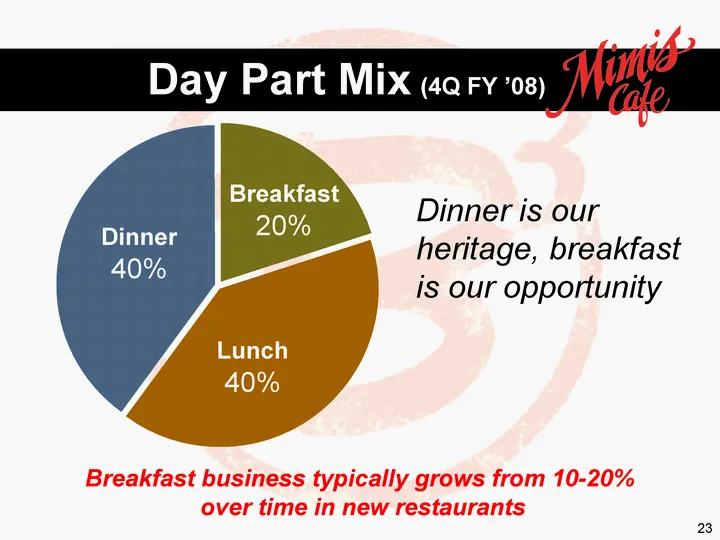
Day Part Mix (4Q FY '08) Breakfast business typically grows from 10-20% over time in new restaurants Lunch 40% Dinner 40% Dinner is our heritage, breakfast is our opportunity Breakfast 20%
Slide 24: Same Store Sales
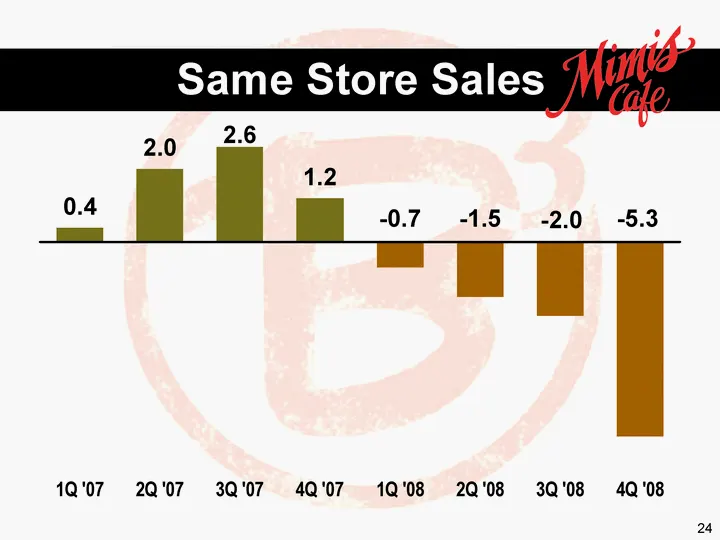
Same Store Sales 1Q '07 2Q '07 3Q '07 4Q '07 1Q '08 2Q '08 3Q '08 4Q '08 West 0.4 2 2.6 1.2 -0.7 -1.5 -2 -5.3
Slide 25: Seasonal Features
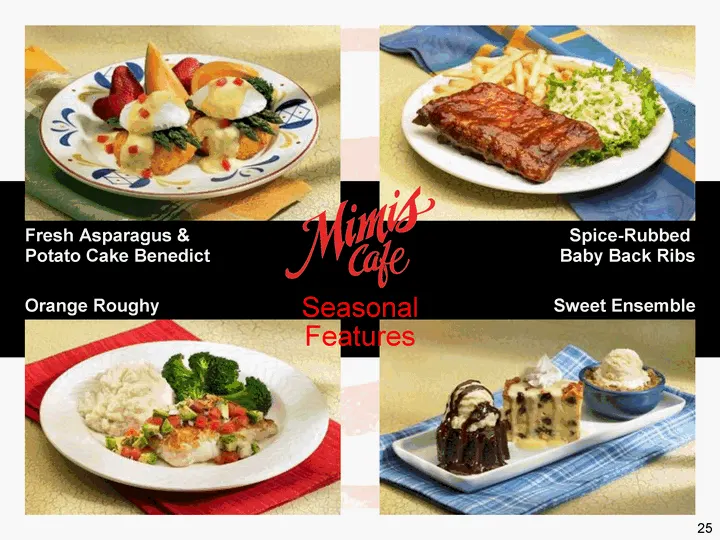
Seasonal Features Orange Roughy Sweet Ensemble Fresh Asparagus & Potato Cake Benedict Spice-Rubbed Baby Back Ribs
Slide 26: New Restaurant Development
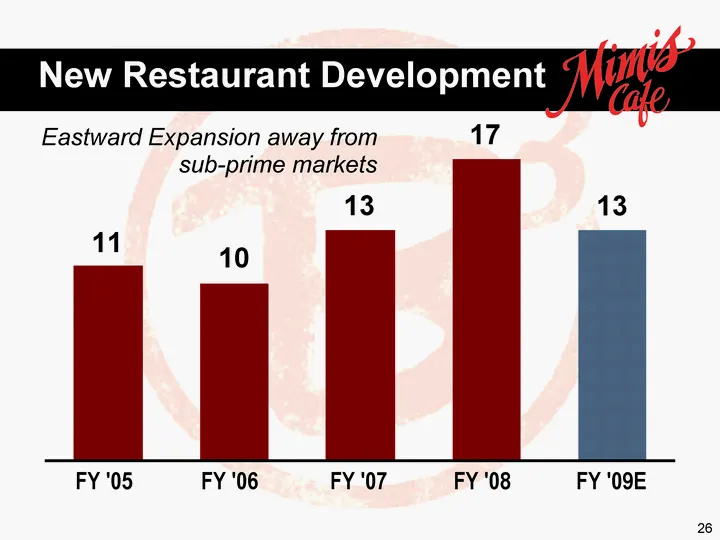
New Restaurant Development Eastward Expansion away from sub-prime markets 11 10 13 17 13 FY '05 FY '06 FY '07 FY '08 FY '09E
Slide 27: Source: National Restaurant Association
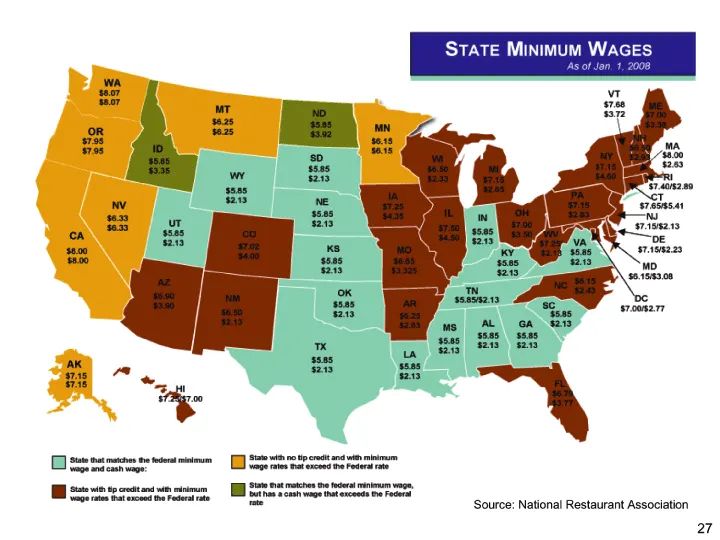
Source: National Restaurant Association
Slide 28: 2009 Objectives
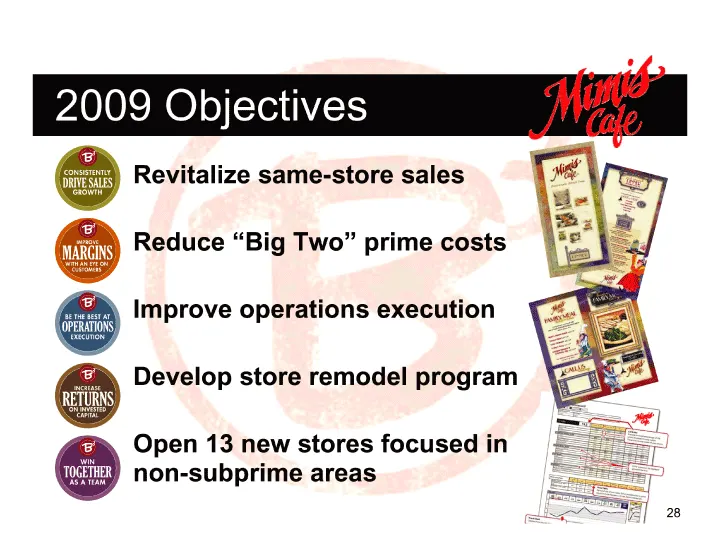
Revitalize same-store sales Reduce "Big Two" prime costs Improve operations execution Develop store remodel program Open 13 new stores focused in non-subprime areas 2009 Objectives
Slide 29: Food Products
“Bob Evaus Food Products a Ss Bilbo
Slide 30: Segment Overview
Segment Overview FY '08 net sales: $292.0 million, up 8.7% Two brands: distinct geographic strengths ~ 40 varieties of sausage, bacon and ham products ~ 50 refrigerated and frozen convenience food items Seven processing plants 25 consecutive quarters of increased comparable pounds sold Food Products
Slide 31: Food Products Segment Overview
Food Products Segment Overview Sausage production Galva, Illinois (fresh) Hillsdale, Michigan (fresh) Xenia, Ohio (fresh) Bidwell, Ohio (fresh and fully cooked) Richardson, Texas (fresh and fully cooked) Ready-to-eat Sulphur Springs, Texas (sandwiches) Springfield, Ohio (soups and gravies) Distribut
Slide 32: Comparable Pounds Sold by Category
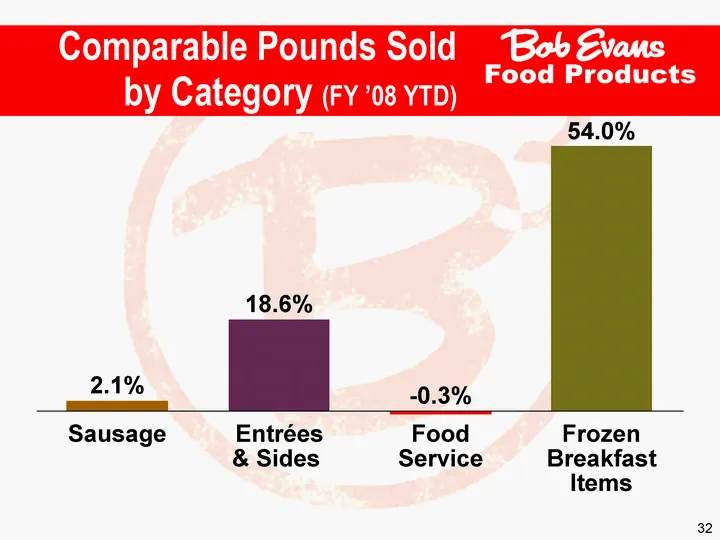
Food Products Comparable Pounds Sold by Category (FY '08 YTD) 2.1% 18.6% - -0.3% 54.0% Sausage Entrees & Sides Food Service Frozen Breakfast Items
Slide 33: Food Products
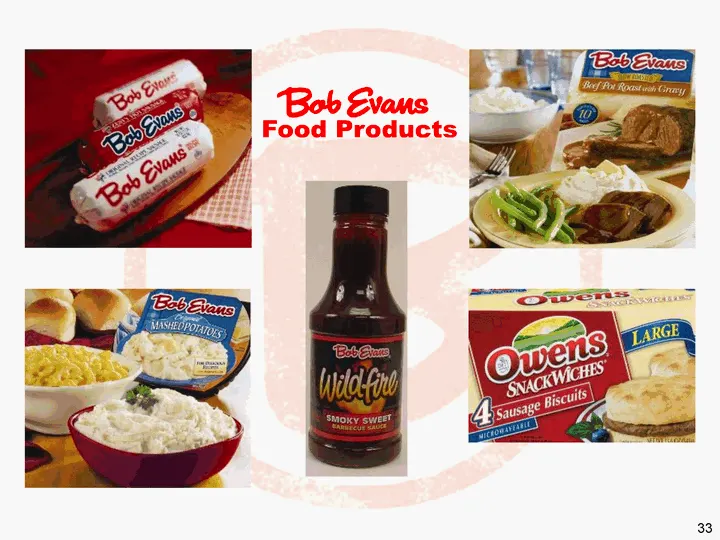
Food Products
Slide 34: Food Products Comparable Pounds Sold
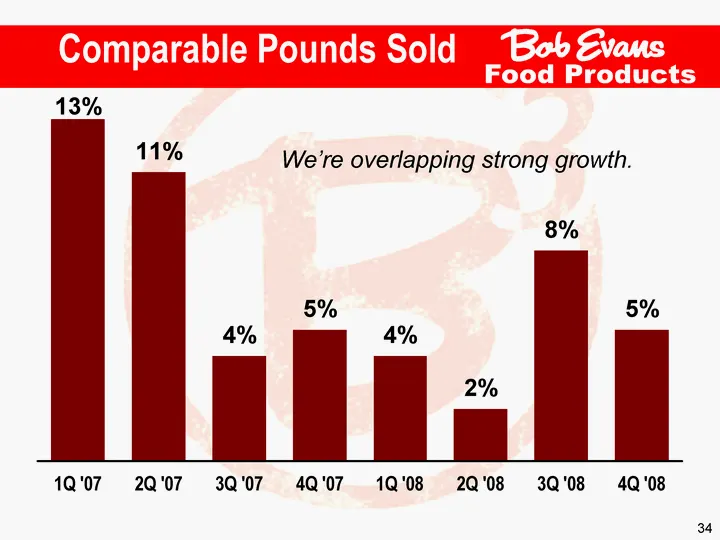
Food Products Comparable Pounds Sold 1Q '07 2Q '07 3Q '07 4Q '07 1Q '08 2Q '08 3Q '08 4Q '08 0.13 0.11 0.04 0.05 0.04 0.02 0.08 0.05 We're overlapping strong growth.
Slide 35: Food Products Growth Strategy
Food Products Growth Strategy Launch innovative new products Add new retailers serving high-growth markets Penetrate "superstore" retail centers Implement plant rationalization strategies Invest in growth capacity for convenience products Leverage new distribution center expansion
Slide 36: 2009 Objectives
Drive comparable pounds sold and new retail sales authorizations Continue margin-improvement programs Achieve Optimal Operating Efficiencies Achieve Target Returns on Sulphur Springs Expansion Build on FY 2008 Productivity Initiatives Momentum 2009 Objectives Food Products
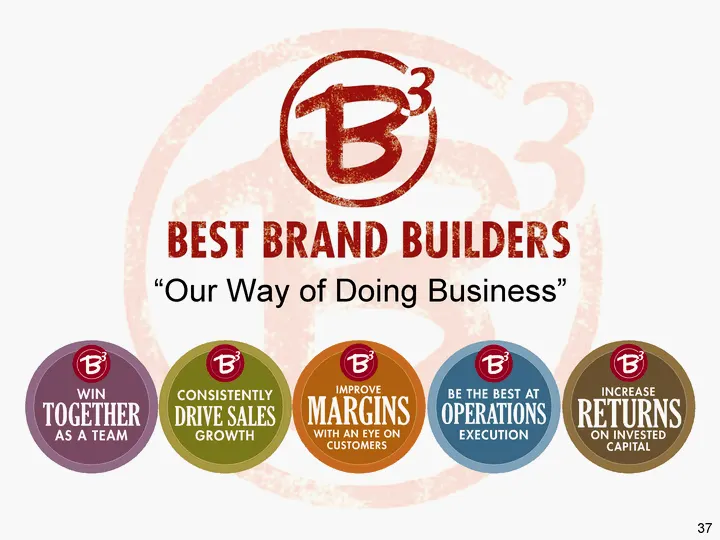
Slide 37: BEST Brand Builders
SG BEST BRAND BUILDERS “Our Way of Doing Business” B INCREASE BE THE BEST AT MAR INS OPERATIONS EXECUTION Bi BS CONSISTENTLY TOGETHER DRIVE SALES AS ATEAM ‘ON INVESTED CAPITAL, wi CUSTOMERS» 37
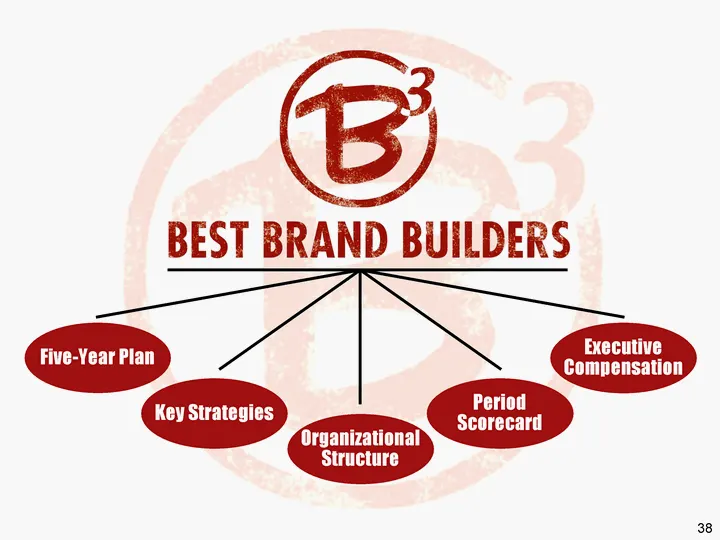
Slide 38: Key Strategies
Key Strategies Organizational Structure Period Scorecard Executive Compensation Five-Year Plan
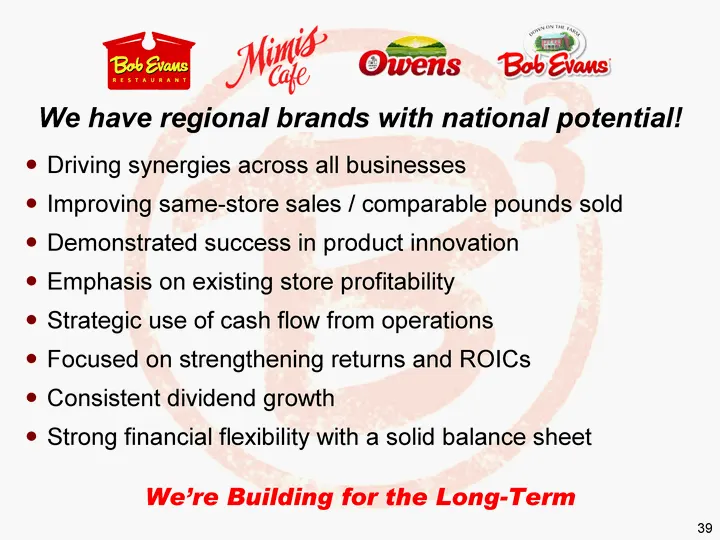
Slide 39: Regional brands with national potential
We have regional brands with national potential! Driving synergies across all businesses Improving same-store sales / comparable pounds sold Demonstrated success in product innovation Emphasis on existing store profitability Strategic use of cash flow from operations Focused on strengthening returns
Slide 40: Don Radkoski, CFO
Don Radkoski Chief Financial Officer
Slide 41: 4th Quarter and FY 2008 Financial Highlights
4th Quarter and FY 2008 Financial Highlights
Slide 42: FY 2008 Trends
FY 2008 Trends Bob Evans Restaurants, Food Products Outperform Expectations Mimi's Faces Difficult Consumer Environment in Key Regions Productivity Initiatives Offset Difficult Cost Environment
Slide 43: Diluted Earnings Per Share, Fourth Quarter
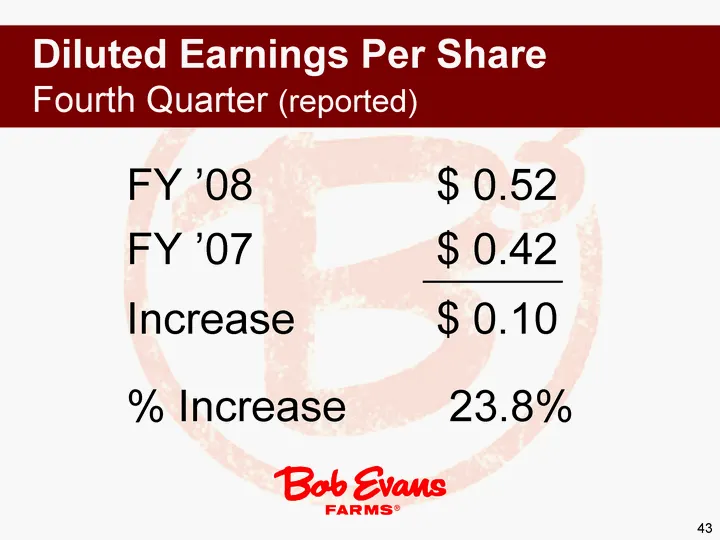
Diluted Earnings Per Share Fourth Quarter (reported) $ 0.10 Increase 23.8% % Increase $ 0.42 FY '07 $ 0.52 FY '08
Slide 44: Special Items Fourth Quarter
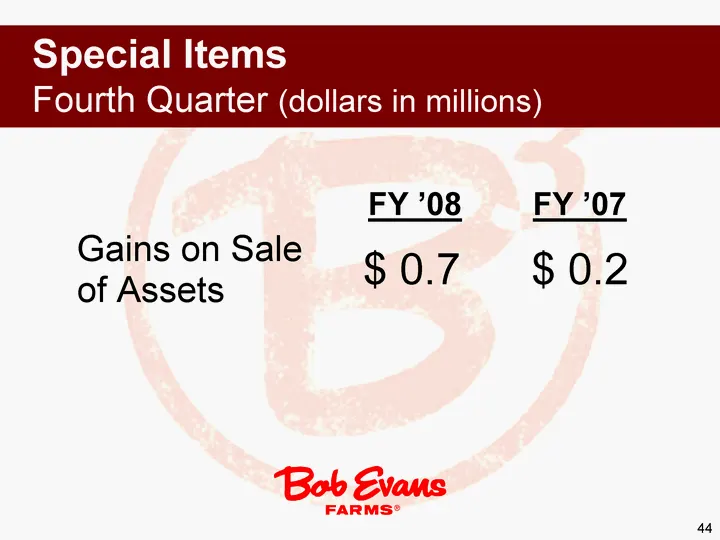
Special Items Fourth Quarter (dollars in millions) FY '07 FY '08 $ 0.2 $ 0.7 Gains on Sale of Assets
Slide 45: Diluted Earnings Per Share, Fiscal Year
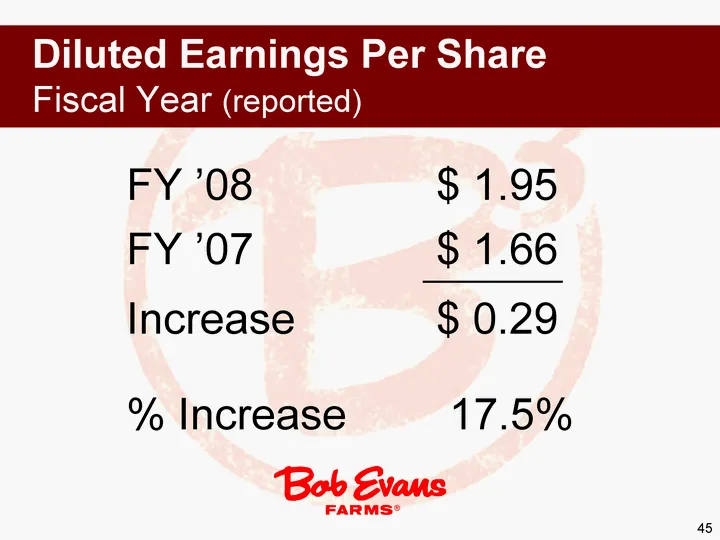
Diluted Earnings Per Share Fiscal Year (reported) $ 0.29 Increase 17.5% % Increase $ 1.66 FY '07 $ 1.95 FY '08
Slide 46: Pre-Tax Impact of Special Items, Fiscal Year
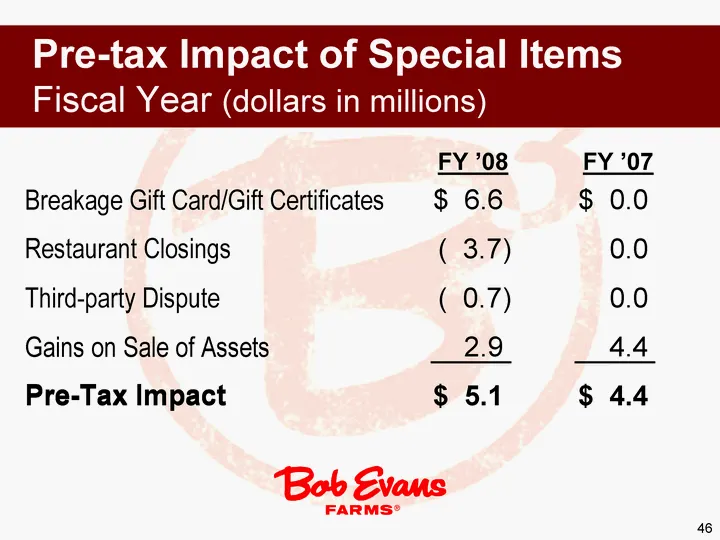
FY '07 FY '08 $ 4.4 $ 5.1 Pre-Tax Impact 4.4 2.9 Gains on Sale of Assets 0.0 ( 0.7) Third-party Dispute 0.0 ( 3.7) Restaurant Closings $ 0.0 $ 6.6 Breakage Gift Card/Gift Certificates Pre-tax Impact of Special Items Fiscal Year (dollars in millions) Gains on Sale of Assets Pre-Tax Impact
Slide 47: Bob Evans Same-Store Sales
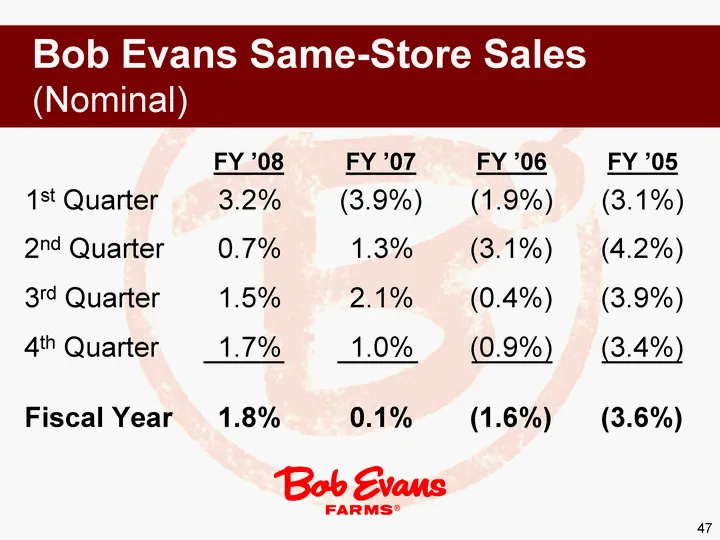
4th Quarter 3rd Quarter 2nd Quarter Fiscal Year 1st Quarter Bob Evans Same-Store Sales (Nominal) (3.4%) (3.9%) (4.2%) (3.6%) (3.1%) FY '05 FY '06 (0.9%) (0.4%) (3.1%) (1.6%) (1.9%) FY '07 1.0% 2.1% 1.3% 0.1% (3.9%) FY '08 1.7% 1.5% 0.7% 1.8% 3.2%
Slide 48: Mimi's Cafe Same-Store Sales
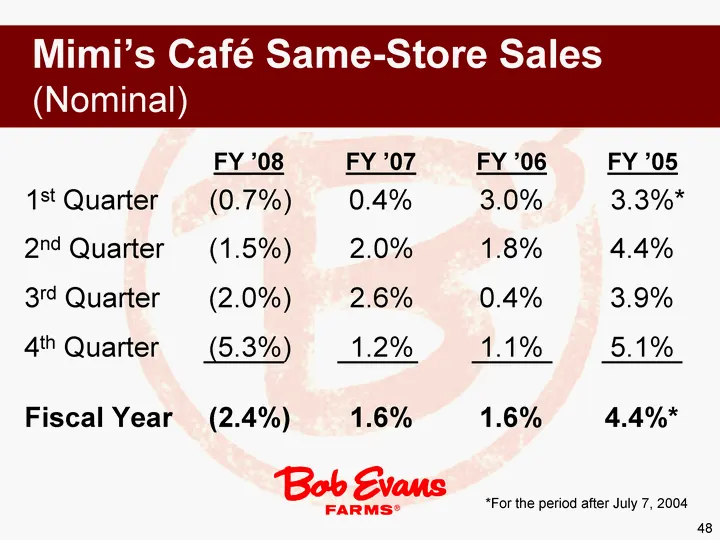
4th Quarter 3rd Quarter 2nd Quarter Fiscal Year 1st Quarter Mimi's Cafe Same-Store Sales (Nominal) 5.1% 3.9% 4.4% 4.4%* 3.3%* FY '05 FY '06 1.1% 0.4% 1.8% 1.6% 3.0% FY '07 1.2% 2.6% 2.0% 1.6% 0.4% FY '08 (5.3%) (2.0%) (1.5%) (2.4%) (0.7%) *For the period after July 7, 2004
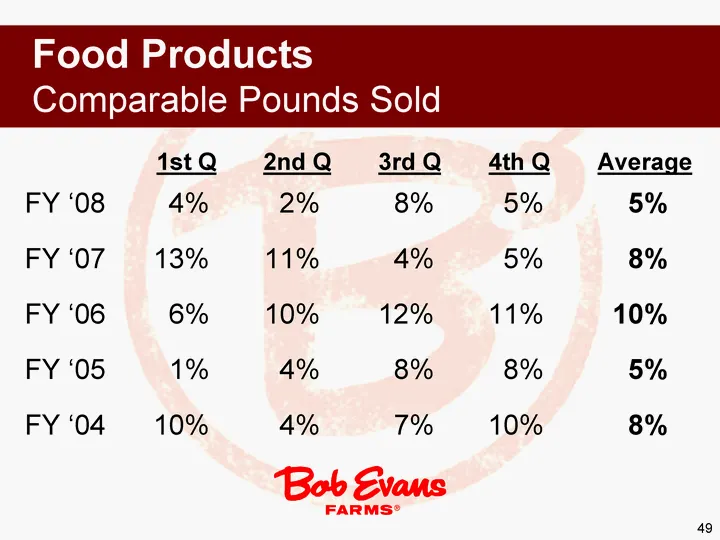
Slide 49: Food Products Comparable Pounds Sold
Food Products Comparable Pounds Sold 5% FY '08 8% FY '07 10% FY '06 8% FY '04 5% 5% 11% 4th Q 10% 8% 8% 4% 12% 3rd Q 7% 8% 5% FY '05 Average 2% 11% 10% 4% 4% 2nd Q 4% 13% 6% 10% 1% 1st Q
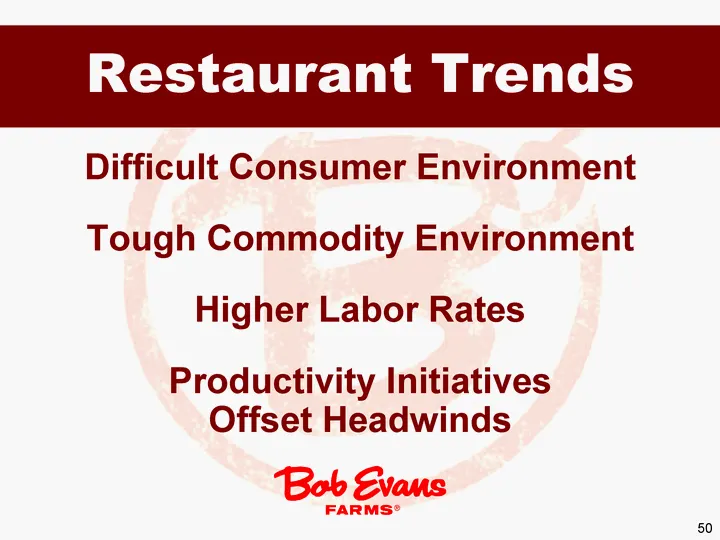
Slide 50: Restaurant Trends
Restaurant Trends Difficult Consumer Environment Tough Commodity Environment Higher Labor Rates Productivity Initiatives Offset Headwinds
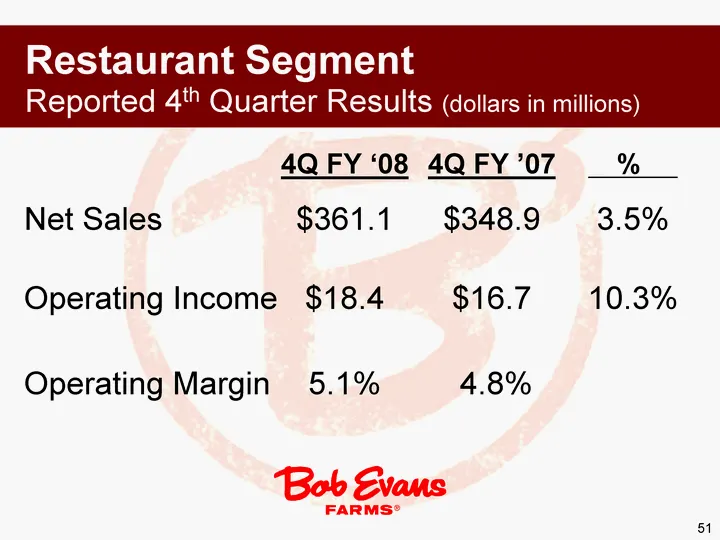
Slide 51: Restaurant Segment 4th Quarter Results
4.8% 5.1% Operating Margin 10.3% $16.7 $18.4 Operating Income 3.5% $348.9 $361.1 Net Sales % 4Q FY '07 4Q FY '08 Restaurant Segment Reported 4th Quarter Results (dollars in millions)
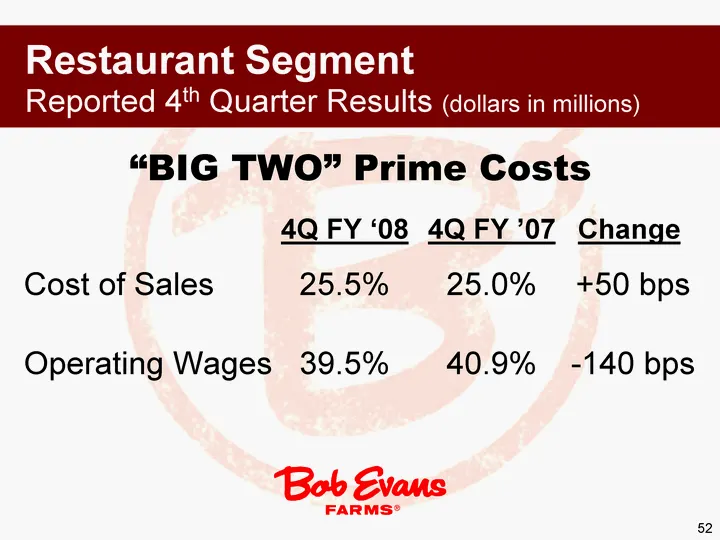
Slide 52: Restaurant Segment Q4 Prime Costs
- -140 bps 40.9% 39.5% Operating Wages +50 bps 25.0% 25.5% Cost of Sales Change 4Q FY '07 4Q FY '08 Restaurant Segment Reported 4th Quarter Results (dollars in millions) "BIG TWO" Prime Costs
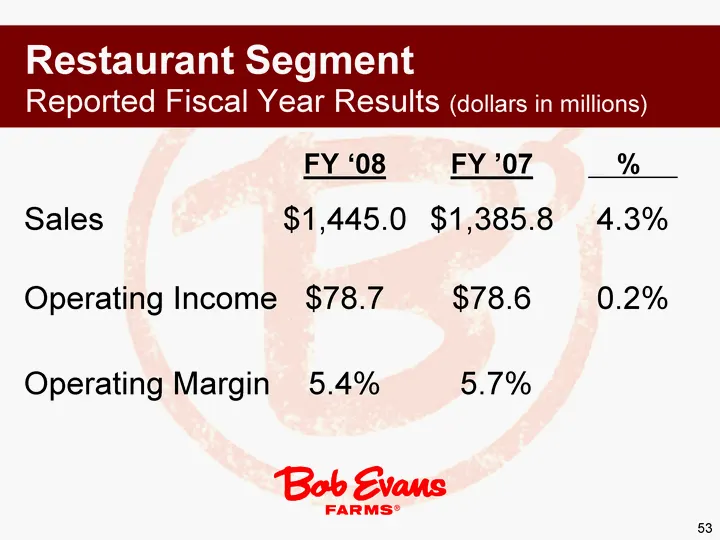
Slide 53: Restaurant Segment Fiscal Year Results
5.7% 5.4% Operating Margin 0.2% $78.6 $78.7 Operating Income 4.3% $1,385.8 $1,445.0 Sales % FY '07 FY '08 Restaurant Segment Reported Fiscal Year Results (dollars in millions)
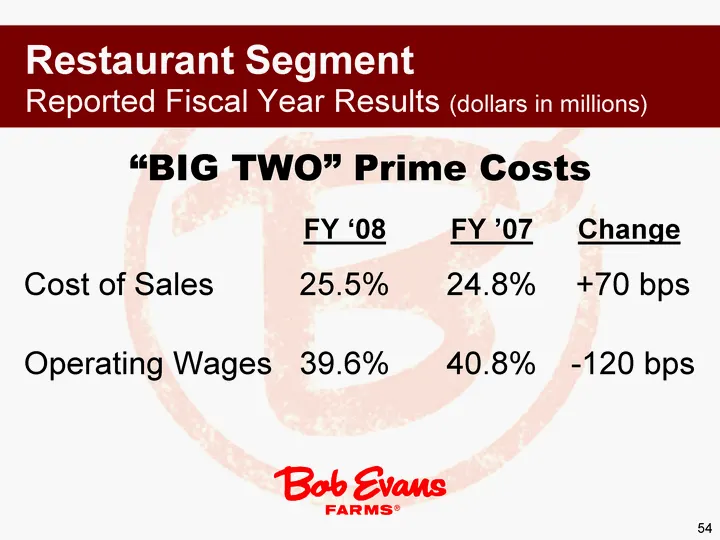
Slide 54: Restaurant Segment Fiscal Year Prime Costs
- -120 bps 40.8% 39.6% Operating Wages +70 bps 24.8% 25.5% Cost of Sales Change FY '07 FY '08 Restaurant Segment Reported Fiscal Year Results (dollars in millions) "BIG TWO" Prime Costs
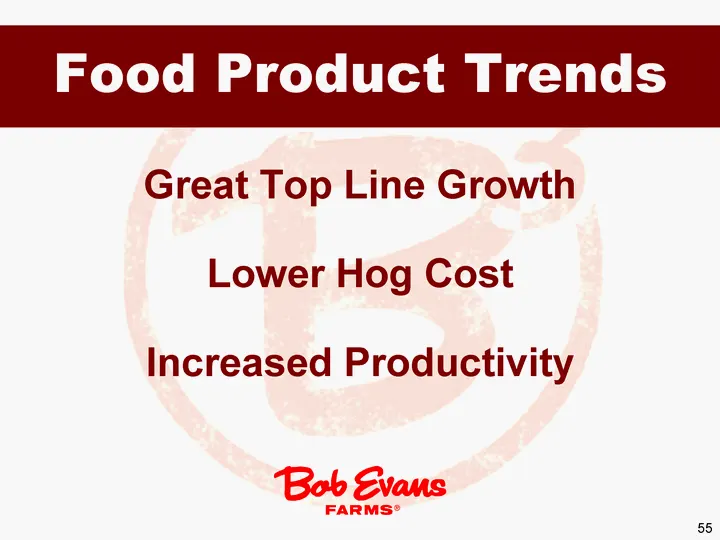
Slide 55: Food Product Trends
Food Product Trends Great Top Line Growth Lower Hog Cost Increased Productivity
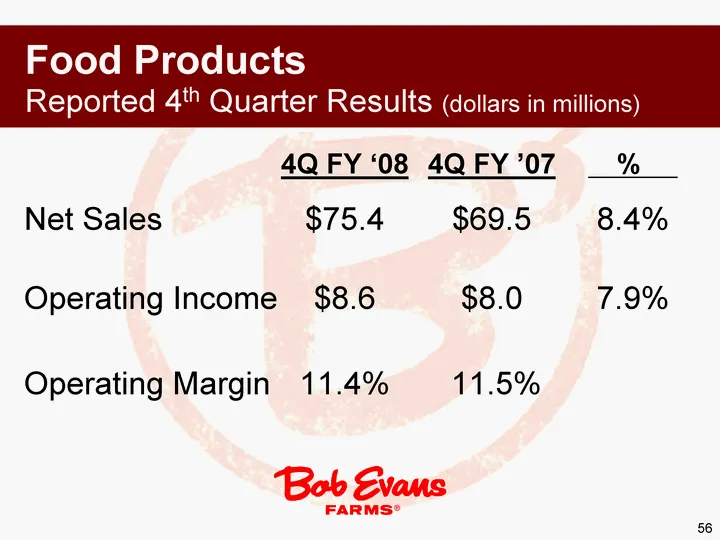
Slide 56: Food Products 4th Quarter Results
11.5% 11.4% Operating Margin 7.9% $8.0 $8.6 Operating Income 8.4% $69.5 $75.4 Net Sales % 4Q FY '07 4Q FY '08 Food Products Reported 4th Quarter Results (dollars in millions)
Slide 57: Food Products Fiscal Year Results
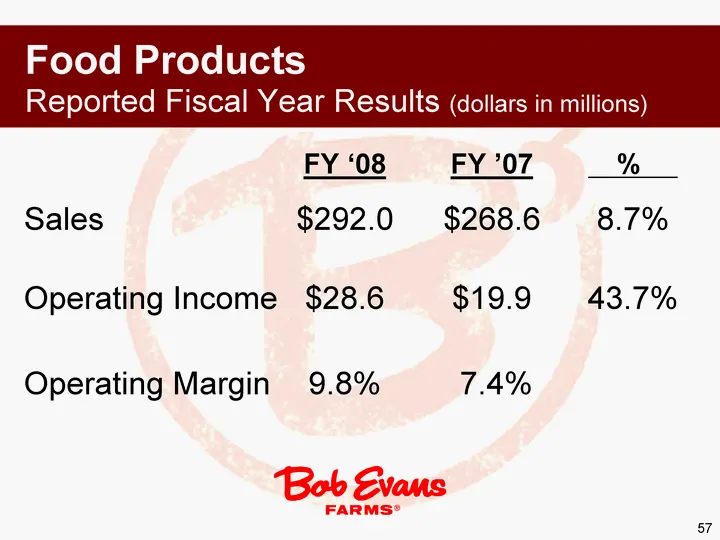
7.4% 9.8% Operating Margin 43.7% $19.9 $28.6 Operating Income 8.7% $268.6 $292.0 Sales % FY '07 FY '08 Food Products Reported Fiscal Year Results (dollars in millions)
Slide 58: Hog Cost Comparison
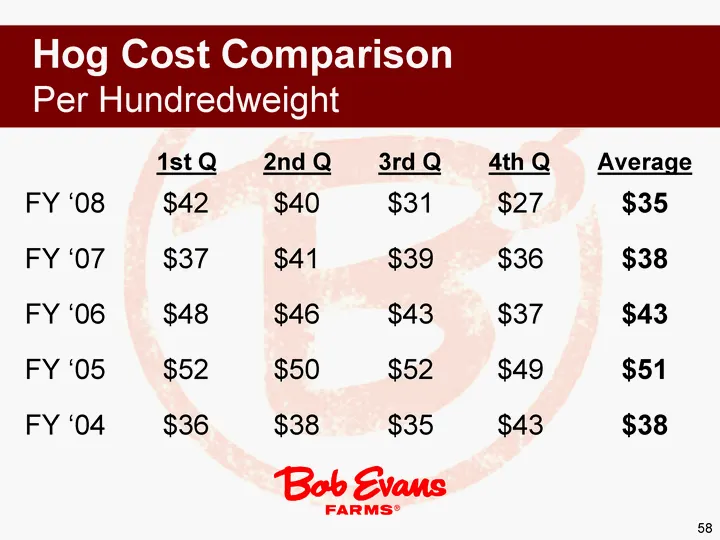
Hog Cost Comparison Per Hundredweight $35 FY '08 $38 FY '07 $43 FY '06 $38 FY '04 $27 $36 $37 4th Q $43 $49 $31 $39 $43 3rd Q $35 $52 $51 FY '05 Average $40 $41 $46 $38 $50 2nd Q $42 $37 $48 $36 $52 1st Q
Slide 59: Balance Sheet Comments
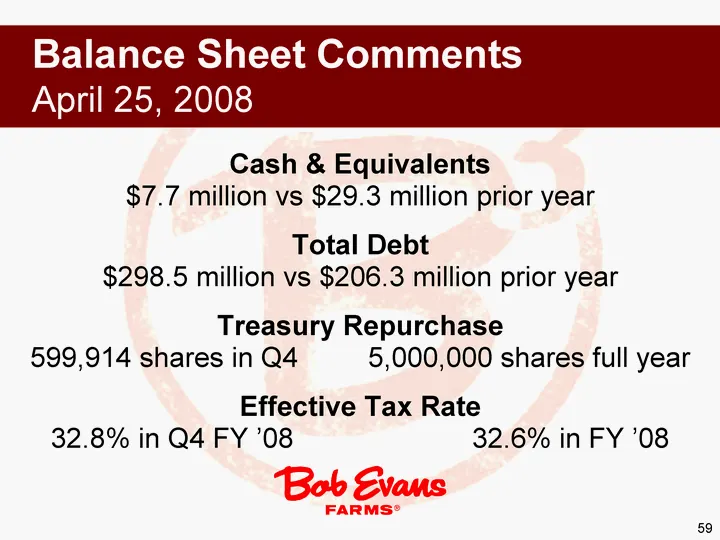
Cash & Equivalents $7.7 million vs $29.3 million prior year Total Debt $298.5 million vs $206.3 million prior year Treasury Repurchase 599,914 shares in Q4 5,000,000 shares full year Effective Tax Rate 32.8% in Q4 FY '08 32.6% in FY '08 Balance Sheet Comments April 25, 2008
Slide 60: Treasury Share Repurchases FY '08
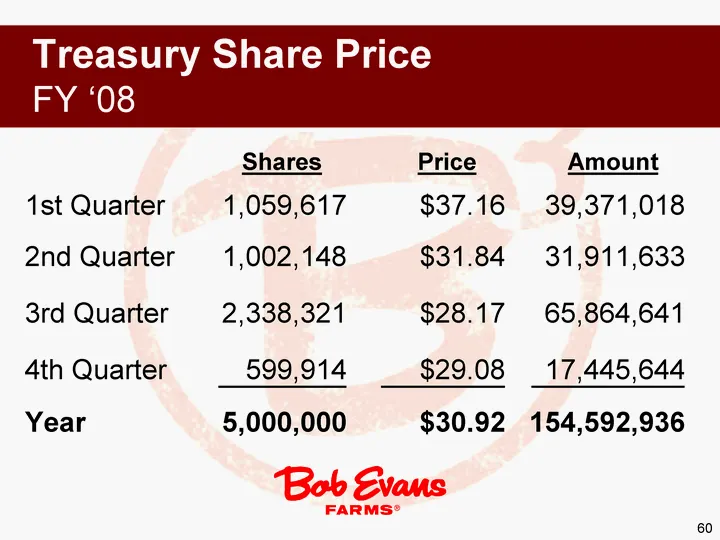
65,864,641 $28.17 2,338,321 3rd Quarter 5,000,000 599,914 1,002,148 1,059,617 Shares 154,592,936 $30.92 Year 17,445,644 $29.08 4th Quarter 31,911,633 $31.84 2nd Quarter 39,371,018 $37.16 1st Quarter Amount Price Treasury Share Price FY '08
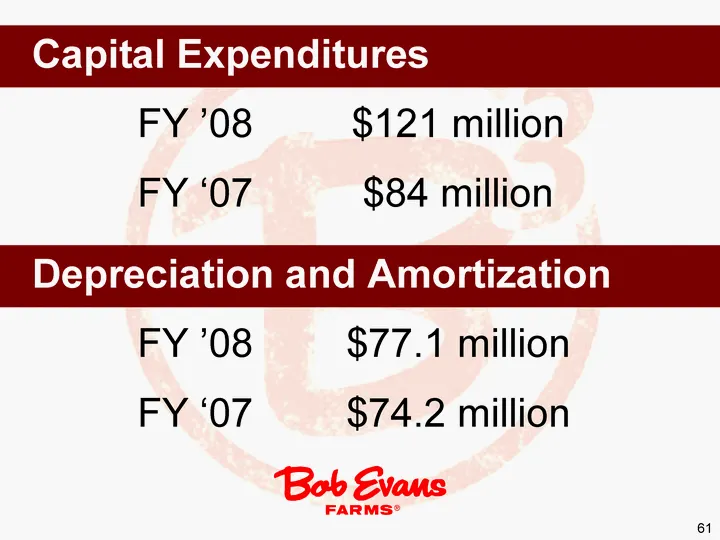
Slide 61: Capital Expenditures and Depreciation
$121 million $84 million FY '08 FY '07 Capital Expenditures $77.1 million $74.2 million FY '08 FY '07 Depreciation and Amortization
Slide 62: FY '08 Review / FY '09 Strategic Plan
FY '08 Review FY '09 Strategic Plan
Slide 63: Roger Williams, President, Bob Evans Restaurants
Roger Williams President, Bob Evans Restaurants
Slide 64: FY '08 In Review
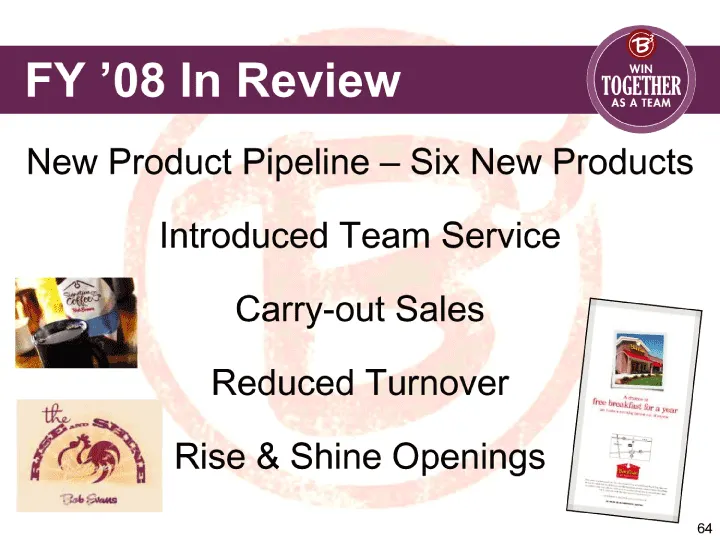
FY '08 In Review New Product Pipeline - Six New Products Introduced Team Service Carry-out Sales Reduced Turnover Rise & Shine Openings
Slide 65: Core Store Performance
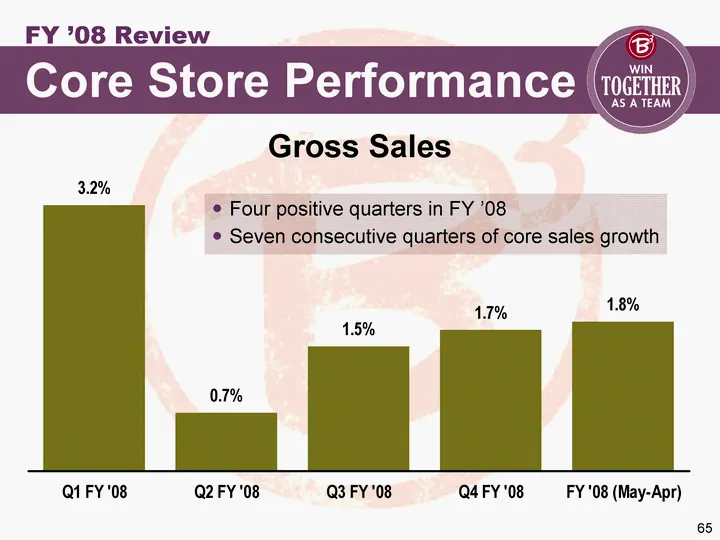
Core Store Performance FY '08 Review Q1 FY '08 Q2 FY '08 Q3 FY '08 Q4 FY '08 FY '08 (May-Apr) Gross Sales 0.032 0.007 0.015 0.017 0.018 Dine-in Sales 0.025 0.001 0.005 0.009 0.01 Carryout Sales 0.11 0.064 0.1 0.089 0.091 Four positive quarters in FY '08 Seven consecutive quarters of core sales growt
Slide 66: Sales Trac Weekly
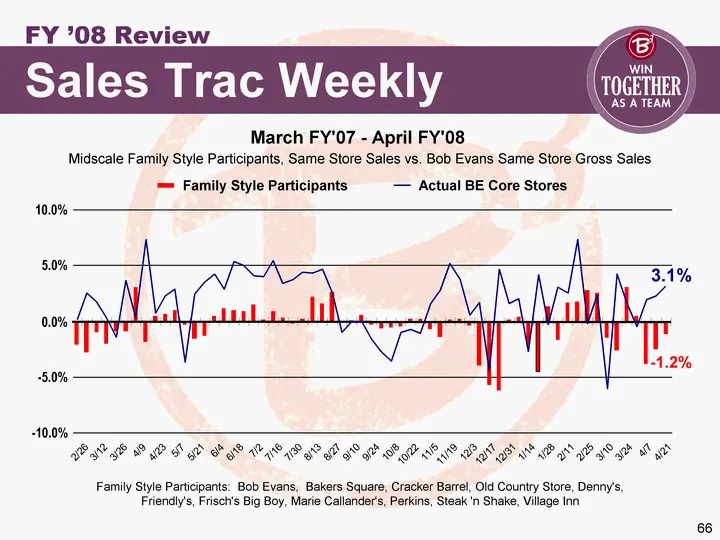
Sales Trac Weekly FY '08 Review March FY'07 - April FY'08 Midscale Family Style Participants, Same Store Sales vs. Bob Evans Same Store Gross Sales - -1.2% 3.1% - -10.0% - -5.0% 0.0% 5.0% 10.0% 2/26 3/12 3/26 4/9 4/23 5/7 5/21 6/4 6/18 7/2 7/16 7/30 8/13 8/27 9/10 9/24 10/8 10/22 11/5 11/19 12/3 12/
Slide 67: Mary Cusick, SVP Restaurant Marketing
Mary Cusick Senior Vice President, Bob Evans Restaurant Marketing
Slide 68: Bob Evans Restaurants Brand Identity
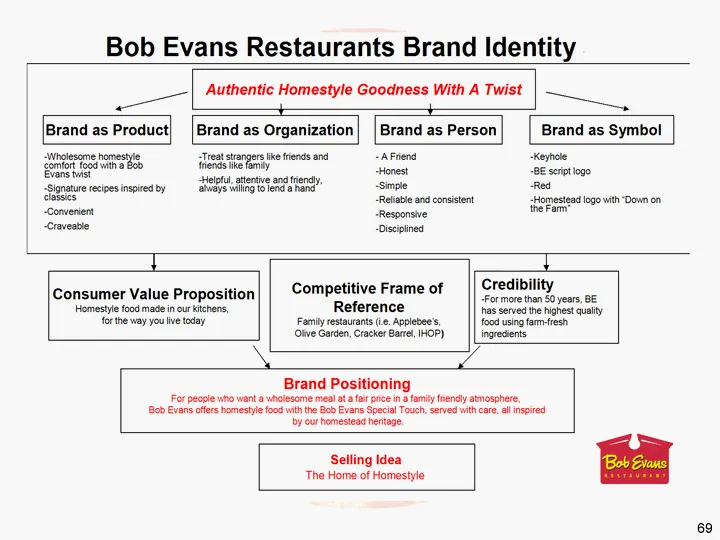
Bob Evans Restaurants Brand Identity Authentic Homestyle Goodness With A Twist ——- — + + Brand as Product] {Brand as Organization] [Brand as Person| | Brand as Symbol Sam | kumar ae aaa eae nest 9 sertogo “eb, aterve an tend ‘Sante recpesispcedy —— SeeSiemeE? -Simpe ed ae ‘etal and consent Homestead
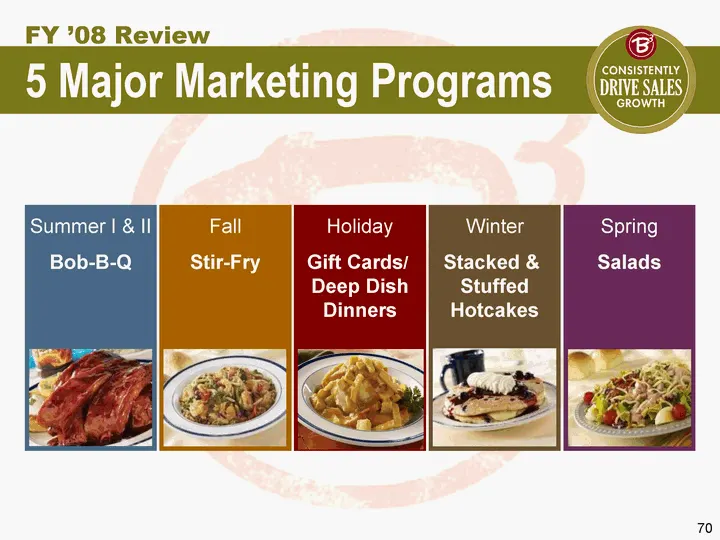
Slide 69: 5 Major Marketing Programs
Holiday Gift Cards/ Deep Dish Dinners Winter Stacked & Stuffed Hotcakes Spring Salads Summer I & II Bob-B-Q Fall Stir-Fry 5 Major Marketing Programs FY '08 Review
Slide 70: Advertising Summary
Advertising Summary FY '08 Review New Campaign Innovation Focus Leverages Brand Positioning "Home of Homestyle" :05 Carry-out Tags
Slide 71: TV Ads
TV ads Big Farm Salads: Drive-thru (30 sec.) BOB-B-Q: Expert (30 sec.) BOB-B-Q: Glasses (30 sec.)
Slide 72: Operations Drives Sales
Starts by executing consistently within our four walls Suggestive Selling New Product Rallies Local Store Marketing (LSM) Product Execution 5 E's Operations Drives Sales FY '08 Review
Slide 73: Pricing
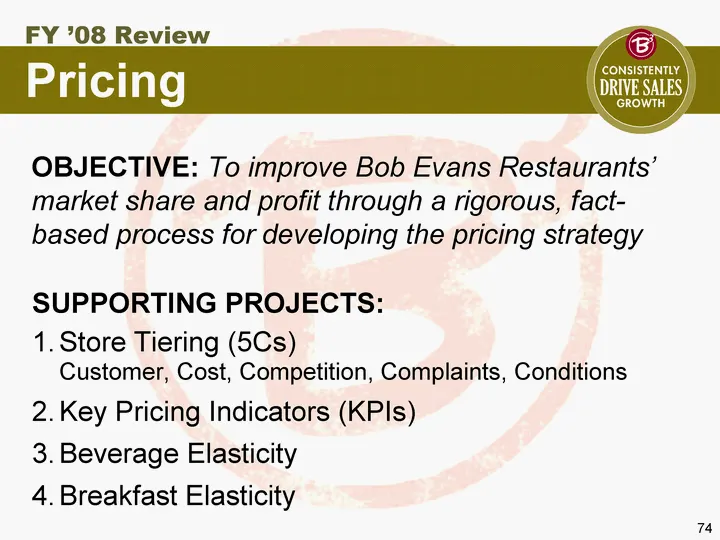
OBJECTIVE: To improve Bob Evans Restaurants' market share and profit through a rigorous, fact- based process for developing the pricing strategy SUPPORTING PROJECTS: Store Tiering (5Cs) Customer, Cost, Competition, Complaints, Conditions Key Pricing Indicators (KPIs) Beverage Elasticity Breakfast El
Slide 74: Randy Hicks, EVP Restaurant Operations
Randy Hicks Executive Vice President, Bob Evans Restaurant Operations
Slide 75: "Big Two" Food and Labor
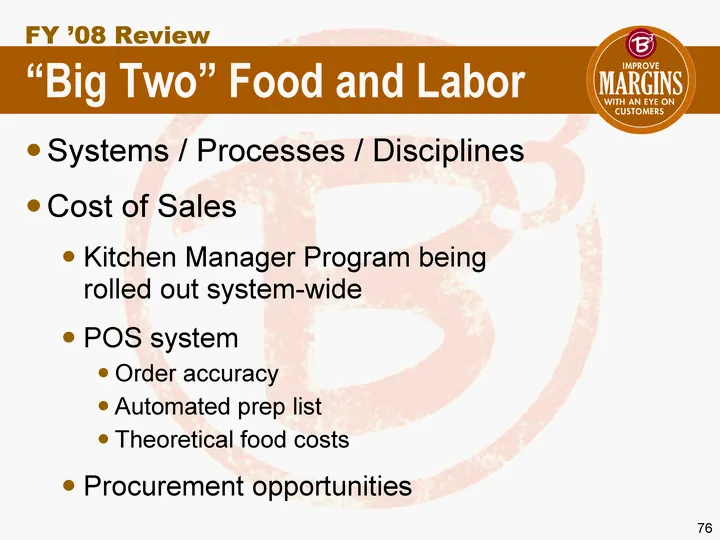
Systems / Processes / Disciplines Cost of Sales Kitchen Manager Program being rolled out system-wide POS system Order accuracy Automated prep list Theoretical food costs Procurement opportunities "Big Two" Food and Labor FY '08 Review
Slide 76: Labor
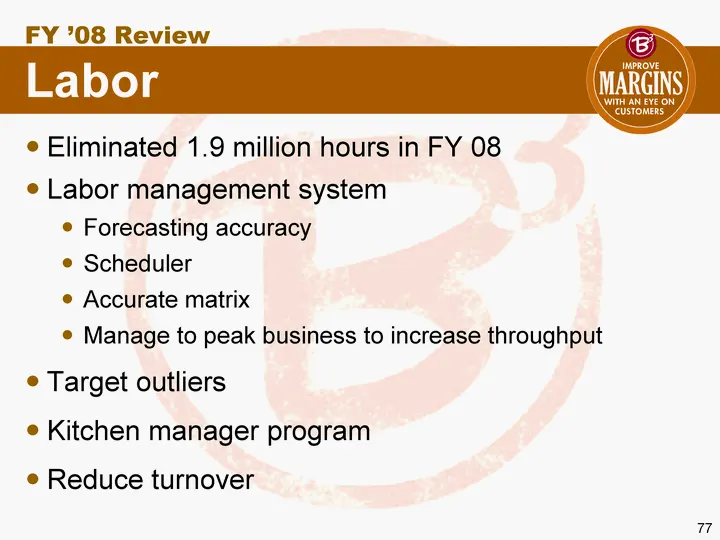
Eliminated 1.9 million hours in FY 08 Labor management system Forecasting accuracy Scheduler Accurate matrix Manage to peak business to increase throughput Target outliers Kitchen manager program Reduce turnover Labor FY '08 Review
Slide 77: Be the Best at Operations Execution
y BE THE BEST AT OPERATIONS EXECUTION
Slide 78: Operations
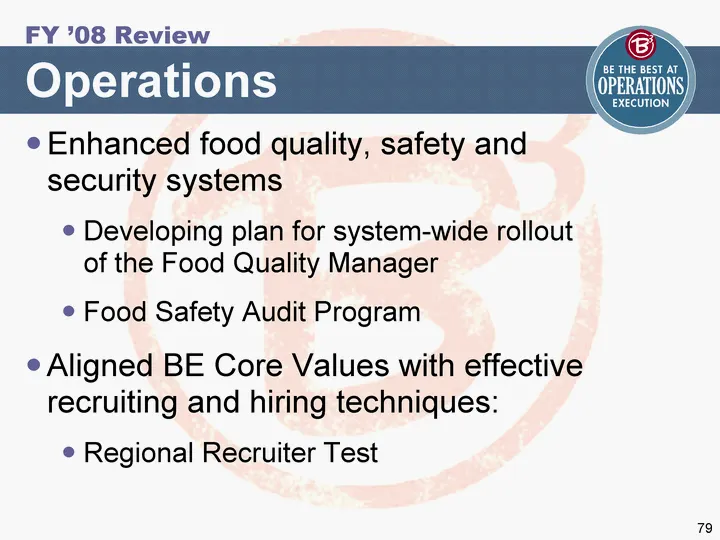
Enhanced food quality, safety and security systems Developing plan for system-wide rollout of the Food Quality Manager Food Safety Audit Program Aligned BE Core Values with effective recruiting and hiring techniques: Regional Recruiter Test Operations FY '08 Review
Slide 79: Employee Turnover (hourly)
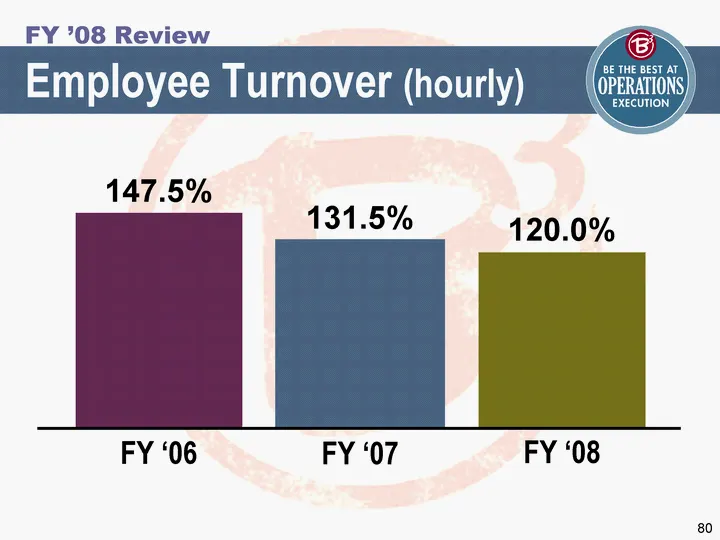
FY '06 FY '07 120.0% 147.5% FY '08 131.5% Employee Turnover (hourly) FY '08 Review
Slide 80: Operations
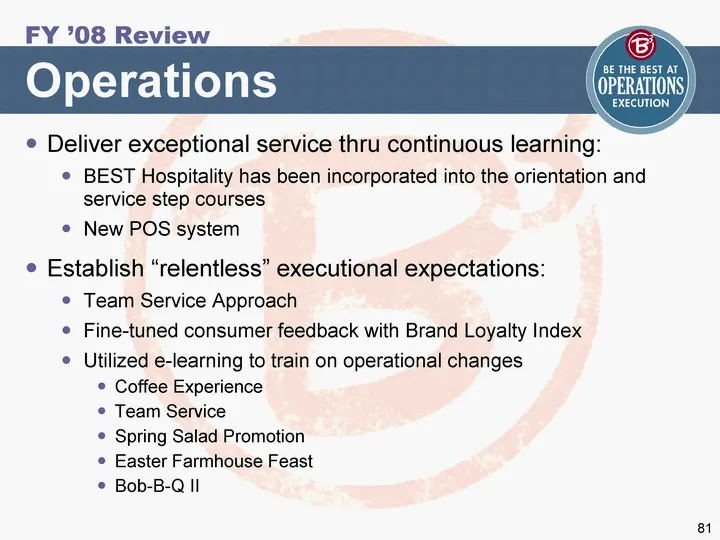
Deliver exceptional service thru continuous learning: BEST Hospitality has been incorporated into the orientation and service step courses New POS system Establish "relentless" executional expectations: Team Service Approach Fine-tuned consumer feedback with Brand Loyalty Index Utilized e-learning t
Slide 81: Roger Williams, President, Bob Evans Restaurants
Roger Williams President, Bob Evans Restaurants
Slide 82: Development: Situation Analysis
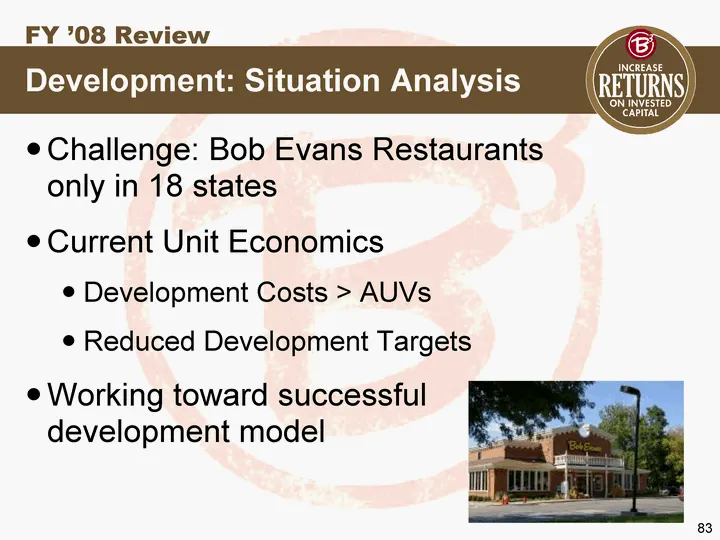
Challenge: Bob Evans Restaurants only in 18 states Current Unit Economics Development Costs > AUVs Reduced Development Targets Working toward successful development model Development: Situation Analysis FY '08 Review
Slide 83: Development FY '08 Review
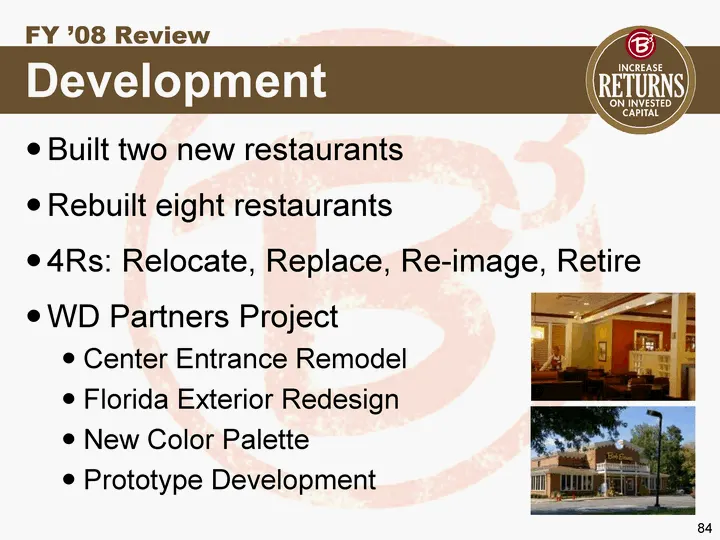
Built two new restaurants Rebuilt eight restaurants 4Rs: Relocate, Replace, Re-image, Retire WD Partners Project Center Entrance Remodel Florida Exterior Redesign New Color Palette Prototype Development Development FY '08 Review
Slide 84: FY '09 Strategic Plan
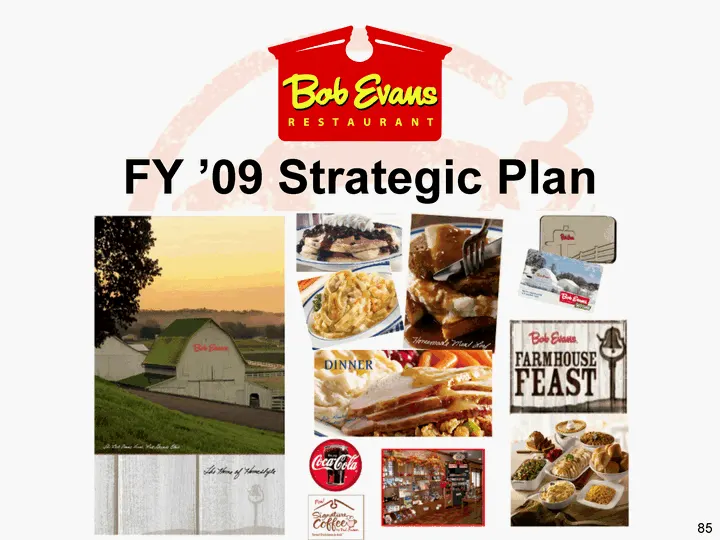
FY '09 Strategic Plan
Slide 85: FY '09 Strategic Plan
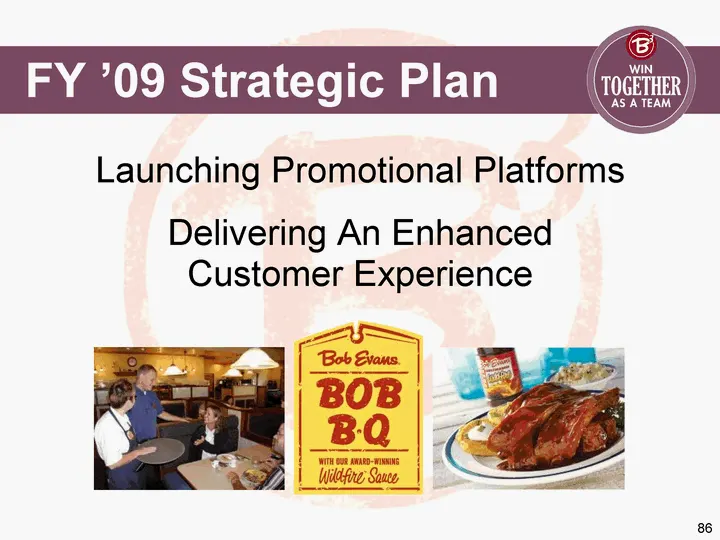
Launching Promotional Platforms Delivering An Enhanced Customer Experience FY '09 Strategic Plan
Slide 86: Top-line Growth
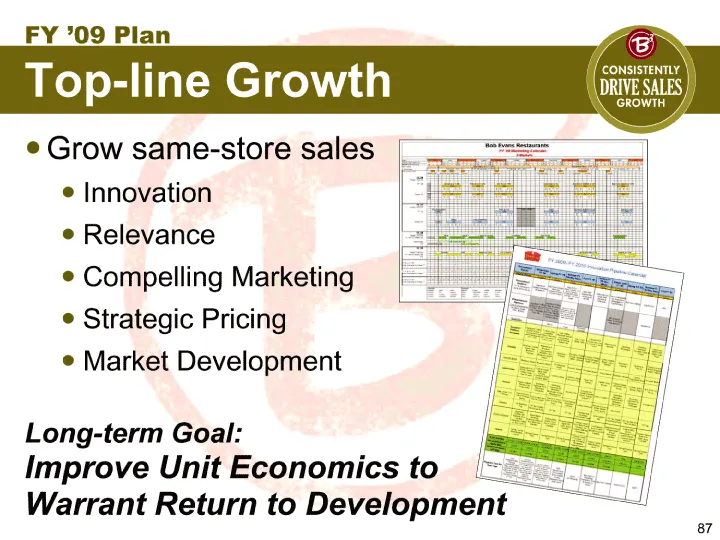
Grow same-store sales Innovation Relevance Compelling Marketing Strategic Pricing Market Development Top-line Growth FY '09 Plan Long-term Goal: Improve Unit Economics to Warrant Return to Development
Slide 87: Operating Margins
Labor Management System - SRE Forecasting / Scheduling IRIS/POS: Accurate Orders Reduce Training Time of Servers and Grill Cooks Automate Prep List Improved Food Cost Management Operating Margins FY '09 Plan Goal: Improve Operating Margins
Slide 88: Labor
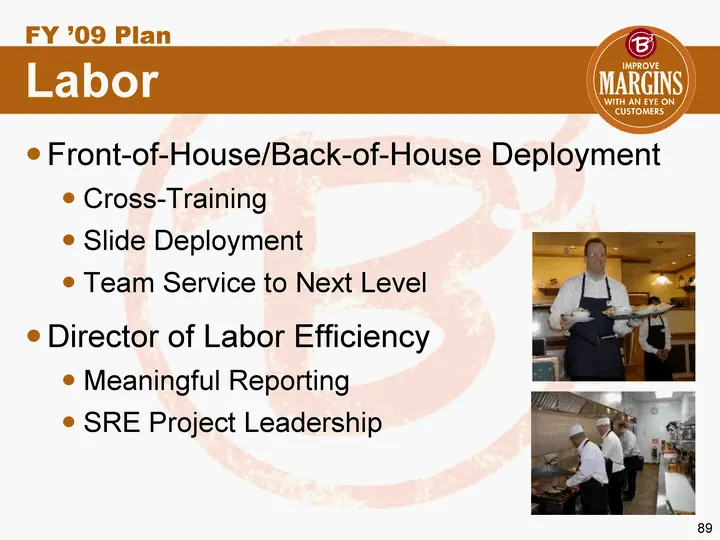
Front-of-House/Back-of-House Deployment Cross-Training Slide Deployment Team Service to Next Level Director of Labor Efficiency Meaningful Reporting SRE Project Leadership Labor FY '09 Plan
Slide 89: Margins
Improve other controllables as a percent of sales: Evaluating next areas for regional HVAC Accounts Identifying high repair and maintenance restaurants Maintain/reduce the cost of goods: Utilizing Corporate Procurement Program Food Costing System Price Management Store Level Executions Margins FY '0
Slide 90: Have the BEST People
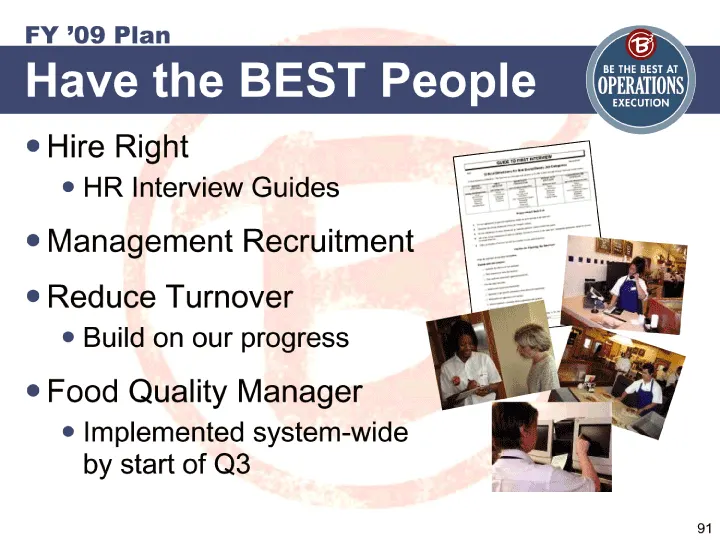
Hire Right HR Interview Guides Management Recruitment Reduce Turnover Build on our progress Food Quality Manager Implemented system-wide by start of Q3 Have the BEST People FY '09 Plan
Slide 91: Development
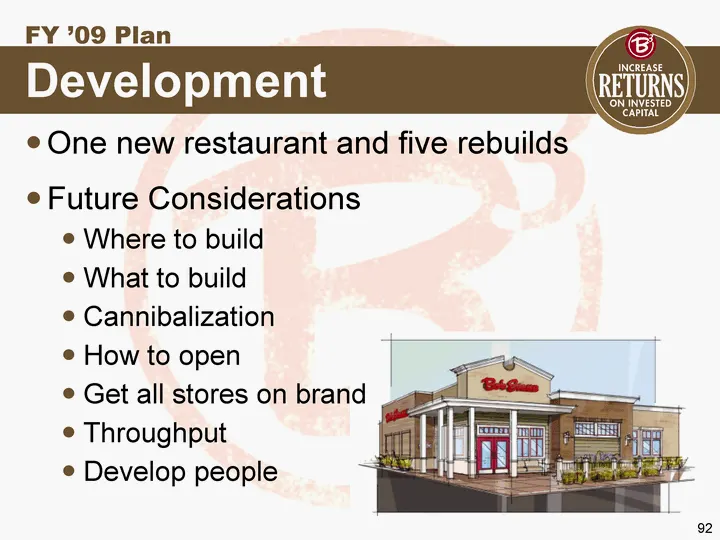
One new restaurant and five rebuilds Future Considerations Where to build What to build Cannibalization How to open Get all stores on brand Throughput Develop people Development FY '09 Plan
Slide 92: 2009 Objectives
Continue Sales Momentum Improve Operating Margins Improve Guest Satisfaction; Lower Turnover Improve Unit Economics Have the BEST People 2009 Objectives
Slide 93: Breakfast is our heritage, dinner is our opportunity
Breakfast is our heritage, dinner is our opportunity.
Slide 94: Break
Break Bob Evaus Ln a
Slide 95: Tim Pulido, President, Mimi's Cafe
Tim Pulido President, Mimi's Cafe
Slide 96: Marketplace Update, FY '08 Review, FY '09 Outlook
Marketplace Update FY '08 Review FY '09 Outlook
Slide 97: Marketplace Update
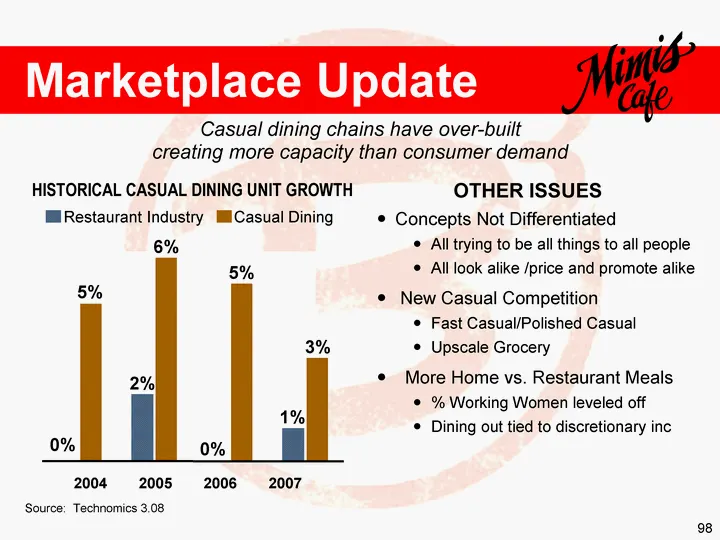
Casual dining chains have over-built creating more capacity than consumer demand Concepts Not Differentiated All trying to be all things to all people All look alike /price and promote alike New Casual Competition Fast Casual/Polished Casual Upscale Grocery More Home vs. Restaurant Meals % Working W
Slide 98: Mimi's Comparative Store Sales
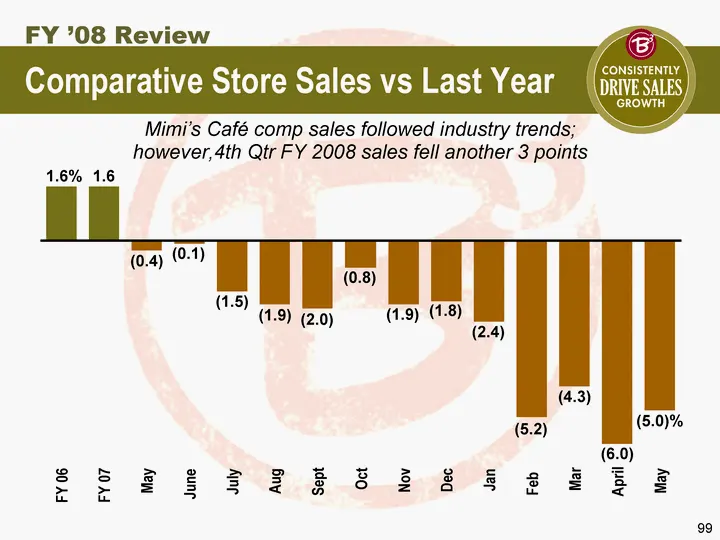
Mimi's Cafe comp sales followed industry trends; however,4th Qtr FY 2008 sales fell another 3 points Comparative Store Sales vs Last Year FY '08 Review (5.0)% (6.0) (4.3) (5.2) (1.9) (1.8) (2.4) (0.8) (2.0) (1.9) (1.5) (0.1) (0.4) 1.6 1.6% FY 06 FY 07 May June July Aug Sept Oct Nov Dec Jan Feb Mar A
Slide 99: Subprime-affected markets drive comp sales decline
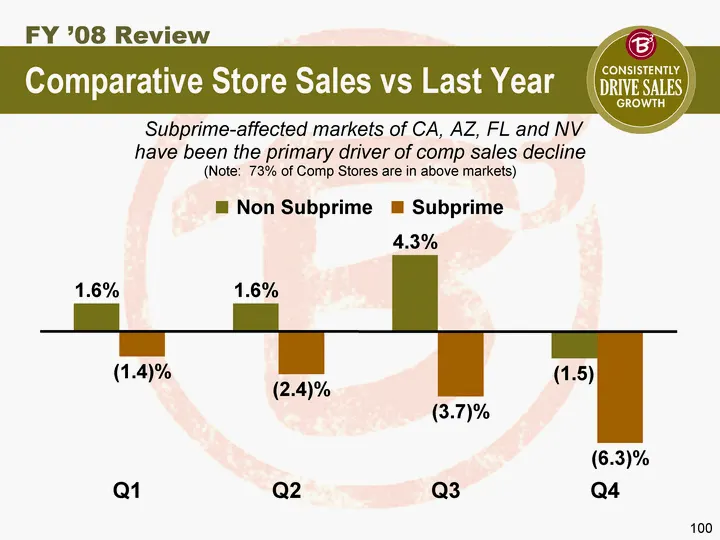
Subprime-affected markets of CA, AZ, FL and NV have been the primary driver of comp sales decline (Note: 73% of Comp Stores are in above markets) Comparative Store Sales vs Last Year (1.5) 4.3% 1.6% 1.6% (6.3)% (3.7)% (2.4)% (1.4)% Q1 Q2 Q3 Q4 Non Subprime Subprime FY '08 Review
Slide 100: Pricing
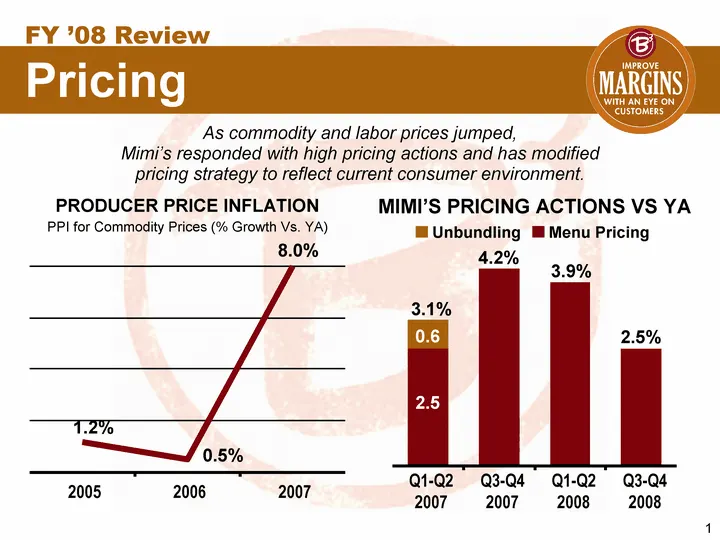
As commodity and labor prices jumped, Mimi's responded with high pricing actions and has modified pricing strategy to reflect current consumer environment. 3.1% Pricing FY '08 Review PRODUCER PRICE INFLATION MIMI'S PRICING ACTIONS VS YA PPI for Commodity Prices (% Growth Vs. YA) 0.5% 8.0% 1.2% 2005
Slide 101: Margins and Costs
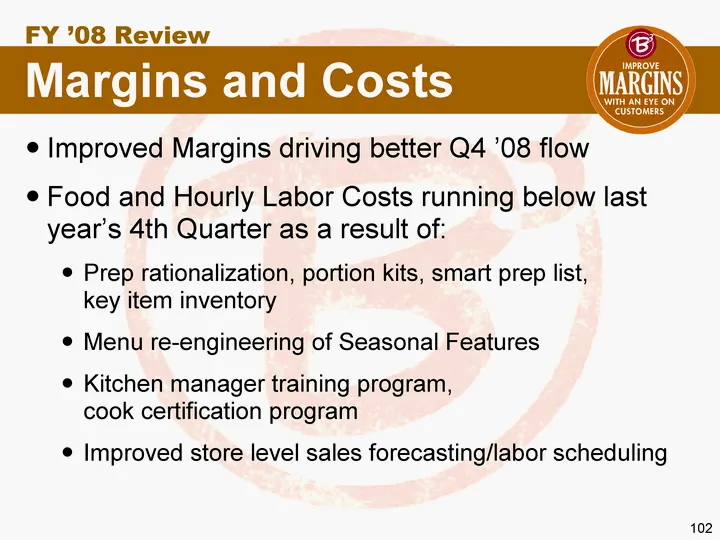
Improved Margins driving better Q4 '08 flow Food and Hourly Labor Costs running below last year's 4th Quarter as a result of: Prep rationalization, portion kits, smart prep list, key item inventory Menu re-engineering of Seasonal Features Kitchen manager training program, cook certification program
Slide 102: Other Accomplishments
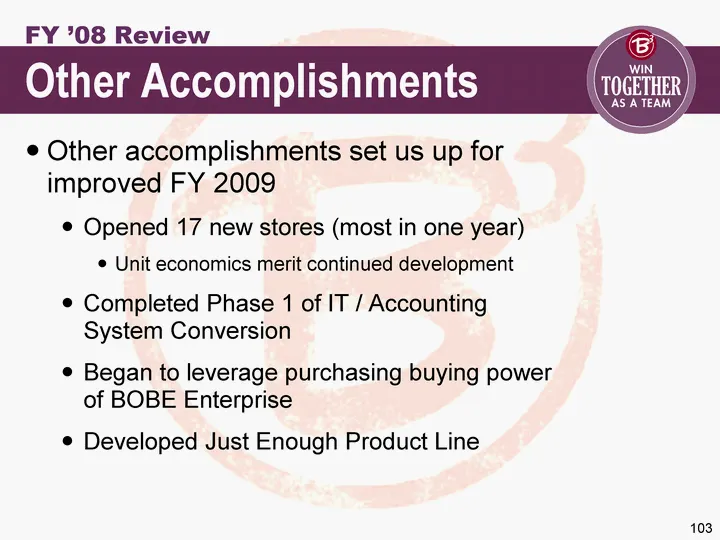
Other accomplishments set us up for improved FY 2009 Opened 17 new stores (most in one year) Unit economics merit continued development Completed Phase 1 of IT / Accounting System Conversion Began to leverage purchasing buying power of BOBE Enterprise Developed Just Enough Product Line Other Accompl
Slide 103: Comp Store AUVs have been flat for 6 years
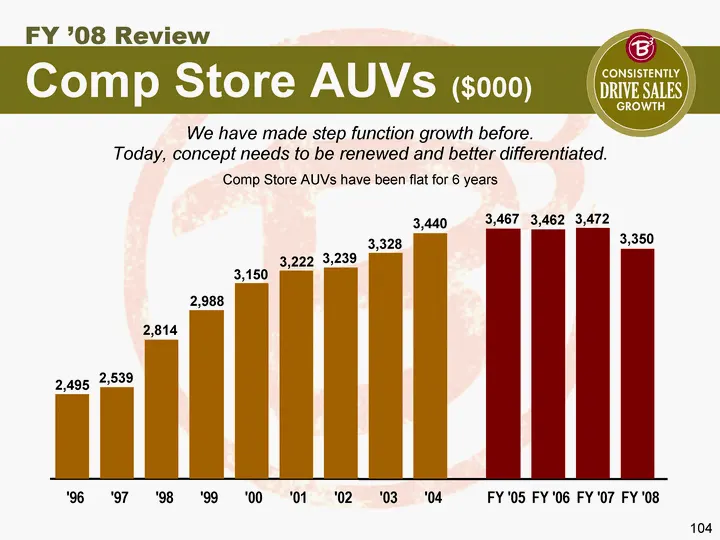
We have made step function growth before. Today, concept needs to be renewed and better differentiated. Comp Store AUVs have been flat for 6 years Comp Store AUVs ($000) 3,350 3,472 3,462 3,467 3,440 3,328 3,239 3,222 3,150 2,988 2,814 2,539 2,495 '96 '97 '98 '99 '00 '01 '02 '03 '04 FY '05 FY '06 FY
Slide 104: Summary: Situation and Opportunities
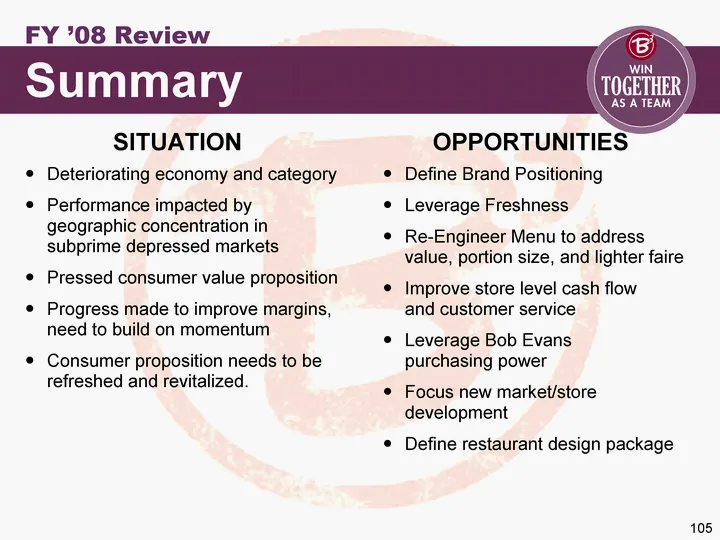
Deteriorating economy and category Performance impacted by geographic concentration in subprime depressed markets Pressed consumer value proposition Progress made to improve margins, need to build on momentum Consumer proposition needs to be refreshed and revitalized. Define Brand Positioning Levera
Slide 105: 2009 Objectives
Revitalize Same-store Sales through focused brand positioning, rollout of Just Enough value/portion initiatives, menu redesign and re- launch of breakfast and carry-out. Reduce Mimi's Cafe Prime Costs (food and labor) through simplified menu, food cost engineering, FOH/BOH labor remodeling and Bob E
Slide 106: Brand Analysis
Time Pressed & Stressed Multi-Generational Demands Vitality & Balance Multi-Cultural Influences Brand Analysis FY '09 Outlook CUSTOMER NEEDS Functional benefits Freshly prepared foods Served all day Reasonable price "Everyday luxury" Emotional benefits Cheerful and welcoming Provencal atmosphere Rel
Slide 107: Brand Opportunities
Become relevant not only to Baby Boomers, but Generation X & Y Bring fresh ingredients, slow roasting, and made from scratch preparation to life Better leverage a superior breakfast (three daypart uniqueness) Take advantage of our Southern European charm and place for connection to define a unique e
Slide 108: 1. Revitalize Same-store Sales
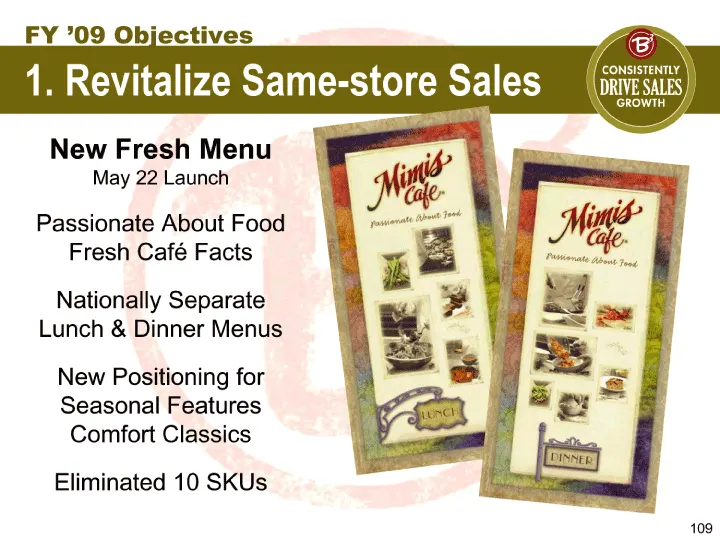
New Fresh Menu May 22 Launch Passionate About Food Fresh Cafe Facts Nationally Separate Lunch & Dinner Menus New Positioning for Seasonal Features Comfort Classics Eliminated 10 SKUs 1. Revitalize Same-store Sales FY '09 Objectives
Slide 109: 1. Revitalize Same-store Sales
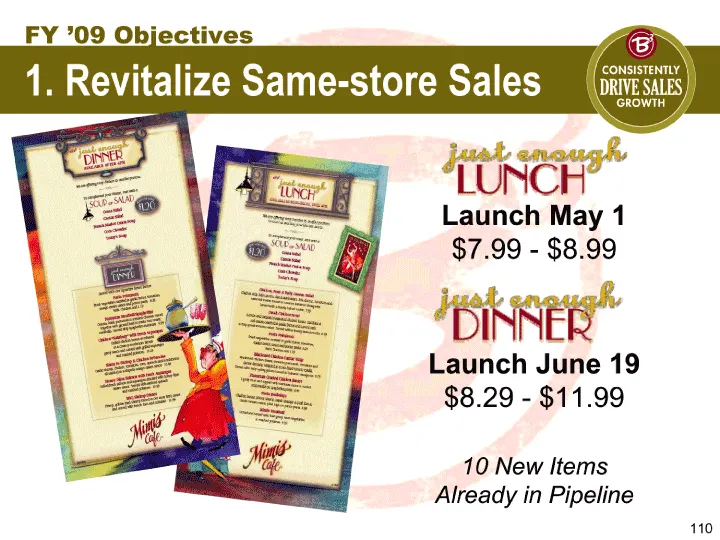
Launch June 19 $8.29 - $11.99 1. Revitalize Same-store Sales FY '09 Objectives Launch May 1 $7.99 - $8.99 10 New Items Already in Pipeline
Slide 110: 1. Revitalize Same-store Sales
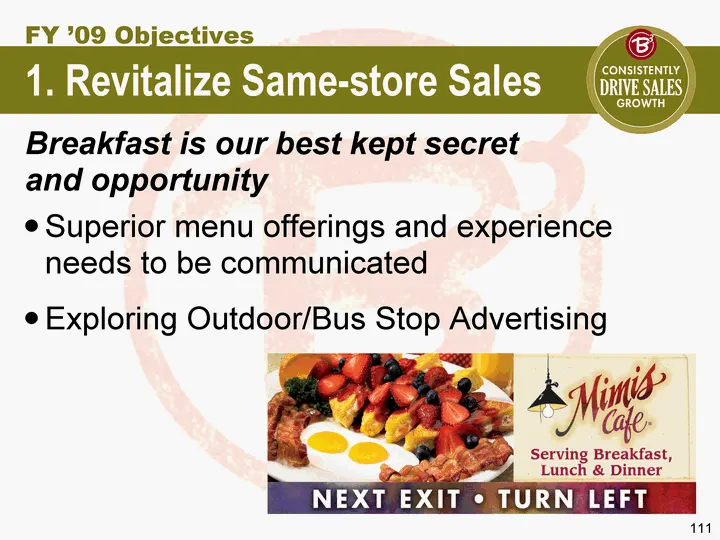
Breakfast is our best kept secret and opportunity Superior menu offerings and experience needs to be communicated Exploring Outdoor/Bus Stop Advertising 1. Revitalize Same-store Sales FY '09 Objectives
Slide 111: Home Meal Replacement / Take-out Game Plan
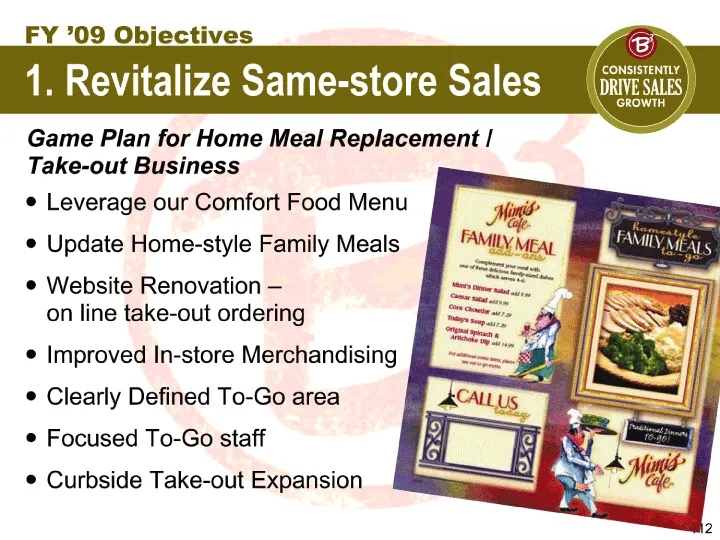
Game Plan for Home Meal Replacement / Take-out Business Leverage our Comfort Food Menu Update Home-style Family Meals Website Renovation - on line take-out ordering Improved In-store Merchandising Clearly Defined To-Go area Focused To-Go staff Curbside Take-out Expansion 1. Revitalize Same-store Sal
Slide 112: Herbert Billinger, EVP Operations, Productivity and Integration
Herbert Billinger Executive Vice President, Operations, Productivity and Integration
Slide 113: 2. Reduce Prime Costs
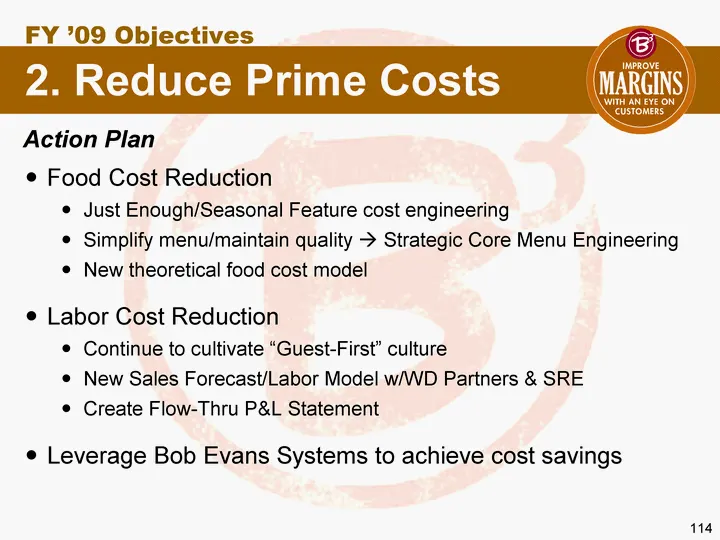
2. Reduce Prime Costs FY '09 Objectives Action Plan Food Cost Reduction Just Enough/Seasonal Feature cost engineering Simplify menu/maintain quality ? Strategic Core Menu Engineering New theoretical food cost model Labor Cost Reduction Continue to cultivate "Guest-First" culture New Sales Forecast/L
Slide 114: 3. Improve Operations Execution
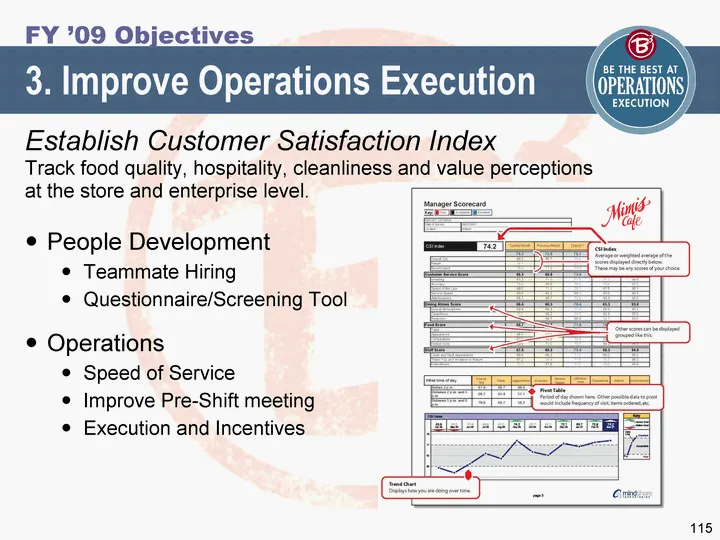
People Development Teammate Hiring Questionnaire/Screening Tool Operations Speed of Service Improve Pre-Shift meeting Execution and Incentives 3. Improve Operations Execution FY '09 Objectives Establish Customer Satisfaction Index Track food quality, hospitality, cleanliness and value perceptions at
Slide 115: 4. Develop Store Remodel Program
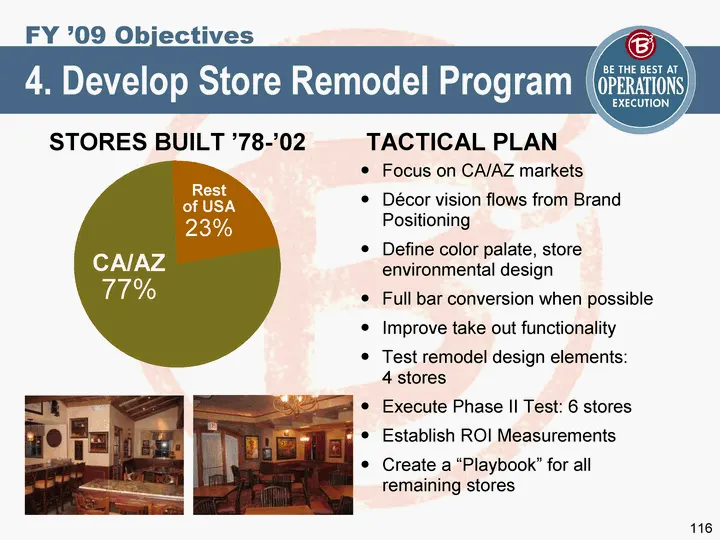
Focus on CA/AZ markets Decor vision flows from Brand Positioning Define color palate, store environmental design Full bar conversion when possible Improve take out functionality Test remodel design elements: 4 stores Execute Phase II Test: 6 stores Establish ROI Measurements Create a "Playbook" for
Slide 116: 5. Open 13 New Stores
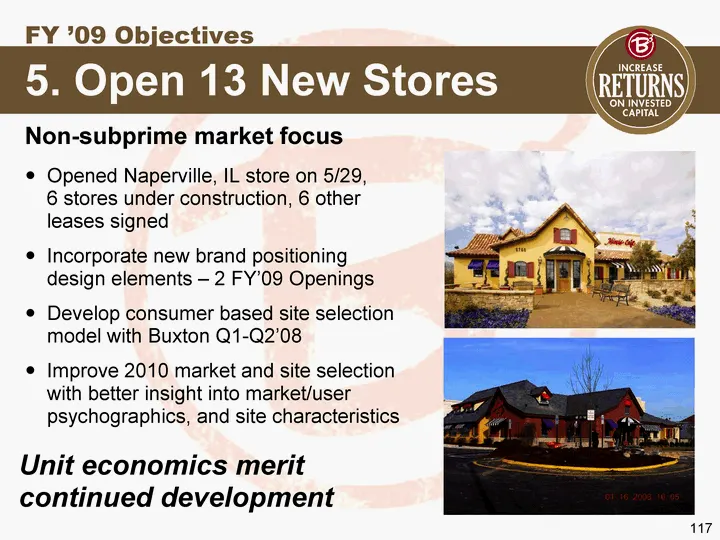
Opened Naperville, IL store on 5/29, 6 stores under construction, 6 other leases signed Incorporate new brand positioning design elements - 2 FY'09 Openings Develop consumer based site selection model with Buxton Q1-Q2'08 Improve 2010 market and site selection with better insight into market/user ps
Slide 117: 2009 Objectives
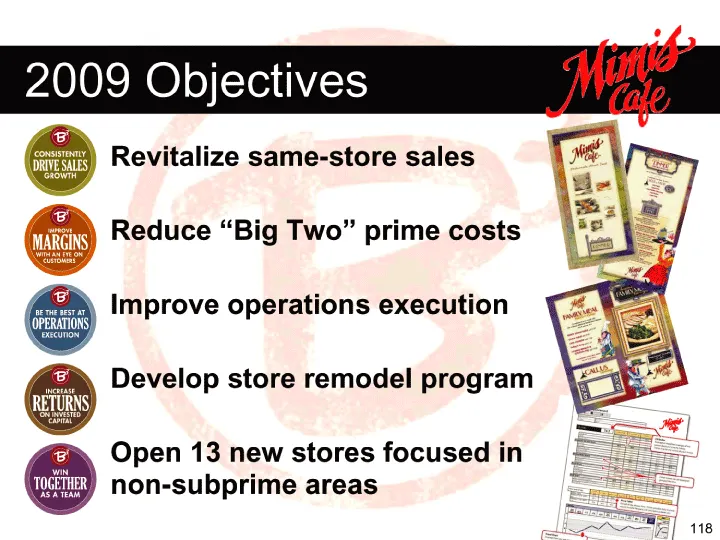
Revitalize same-store sales Reduce "Big Two" prime costs Improve operations execution Develop store remodel program Open 13 new stores focused in non-subprime areas 2009 Objectives
Slide 118: FY '08 Review / FY '09 Strategic Plan: Food Products
FY '08 Review FY '09 Strategic Plan Food Products
Slide 119: Mike Townsley, EVP Food Products
Mike Townsley Executive Vice President, Food Products Food Products
Slide 120: Key Statistics
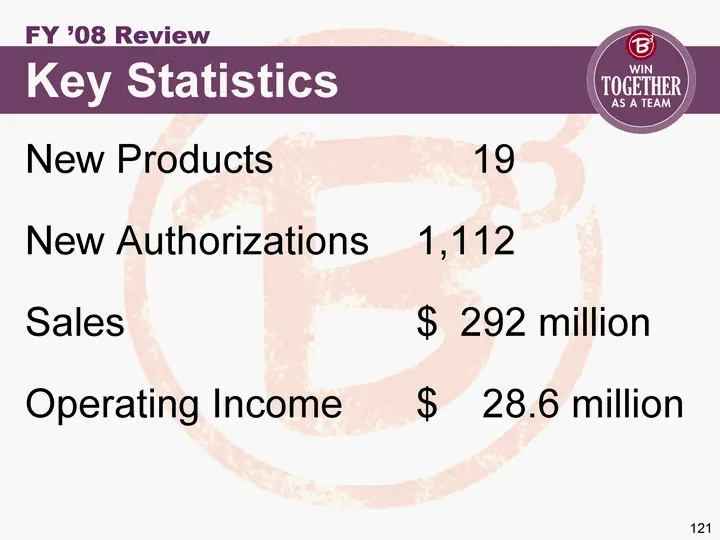
Key Statistics New Products 19 New Authorizations 1,112 Sales $ 292 million Operating Income $ 28.6 million FY '08 Review
Slide 121: Business Profile
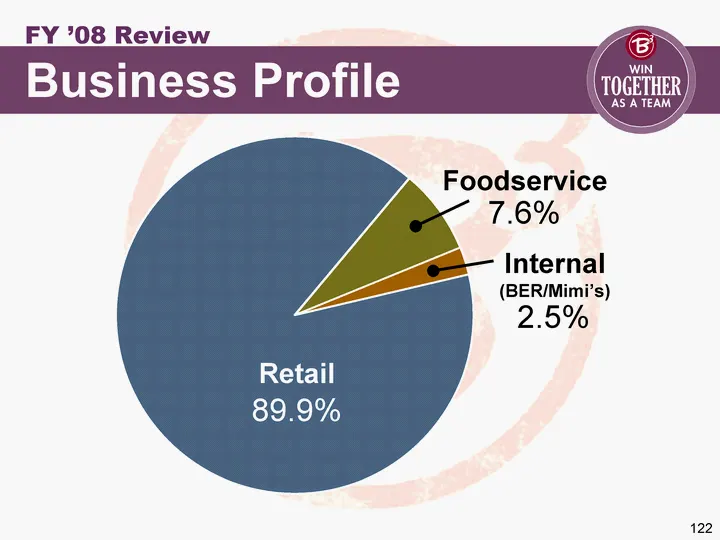
Business Profile FY '08 Review Foodservice Internal Retail 4th Qtr East 0.076 0.025 0.879582524271845 20.4 West 30.6 38.6 34.6 31.6 North 45.9 46.9 45 43.9 Retail 89.9% Foodservice 7.6% Internal (BER/Mimi's) 2.5%
Slide 122: Accomplishments
DSD to warehouse Refined product innovation pipeline Joint Restaurant and Food Products marketing programs Reduced Mimi's freight costs for east coast distribution FY '08 Review Accomplishments
Slide 123: Marketing Area
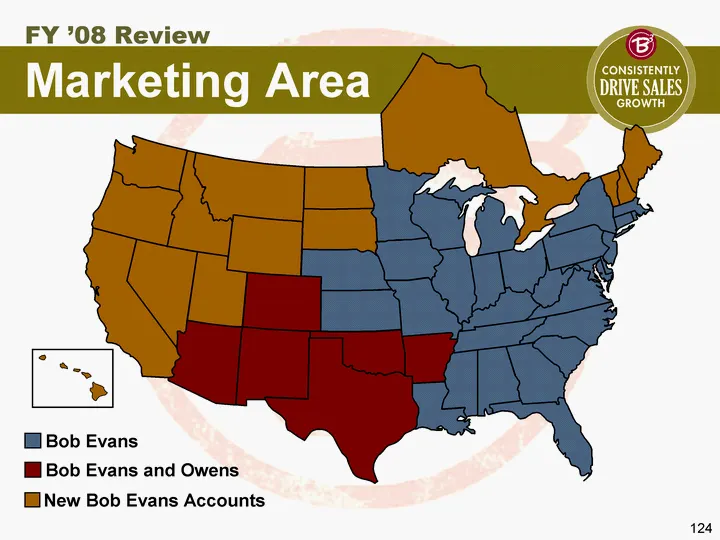
Marketing Area FY '08 Review Bob Evans Bob Evans and Owens New Bob Evans Accounts
Slide 124: Key Retailer Footprint
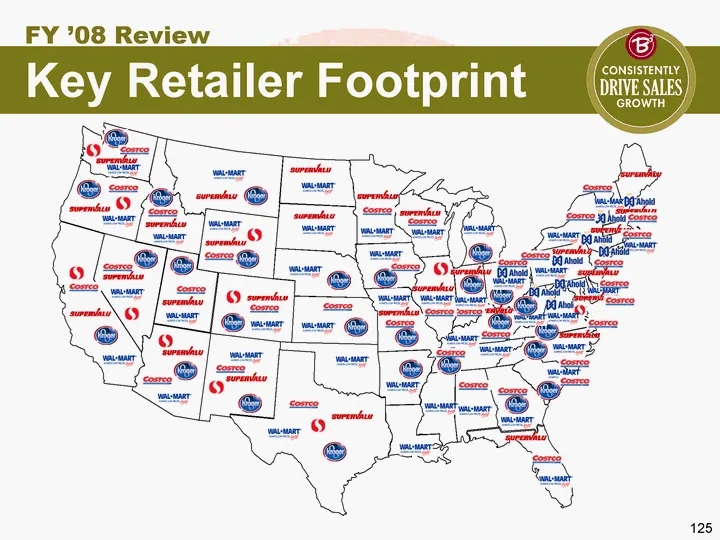
Key Retailer Footprint FY '08 Review
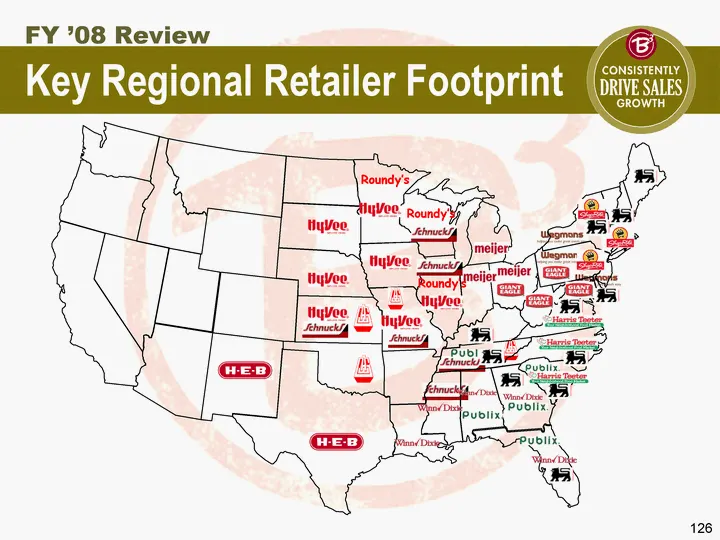
Slide 125: Key Regional Retailer Footprint
Roundy's Roundy's Roundy's Key Regional Retailer Footprint FY '08 Review
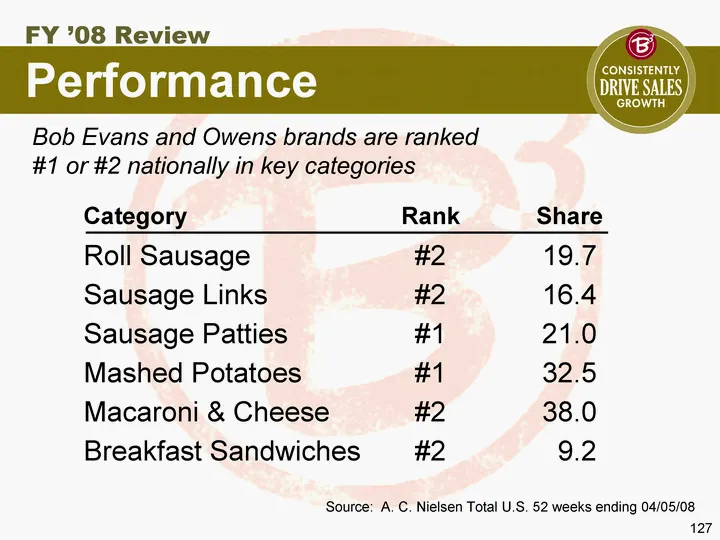
Slide 126: Brands ranked #1 or #2 nationally in key categories
Bob Evans and Owens brands are ranked #1 or #2 nationally in key categories 9.2 #2 Breakfast Sandwiches 38.0 #2 Macaroni & Cheese 32.5 #1 Mashed Potatoes 21.0 #1 Sausage Patties 16.4 #2 Sausage Links 19.7 #2 Roll Sausage Share Rank Category Performance FY '08 Review Source: A. C. Nielsen Total U.S.
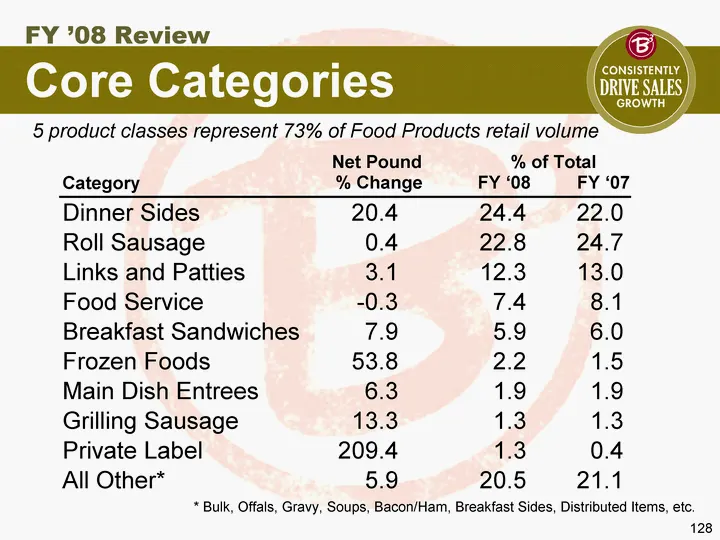
Slide 127: Core Categories
5 product classes represent 73% of Food Products retail volume * Bulk, Offals, Gravy, Soups, Bacon/Ham, Breakfast Sides, Distributed Items, etc. Core Categories FY '08 Review % of Total Net Pound % Change Category FY '08 FY '07 2.2 53.8 Frozen Foods 1.5 5.9 7.9 Breakfast Sandwiches 6.0 7.4 - -0.3 Fo
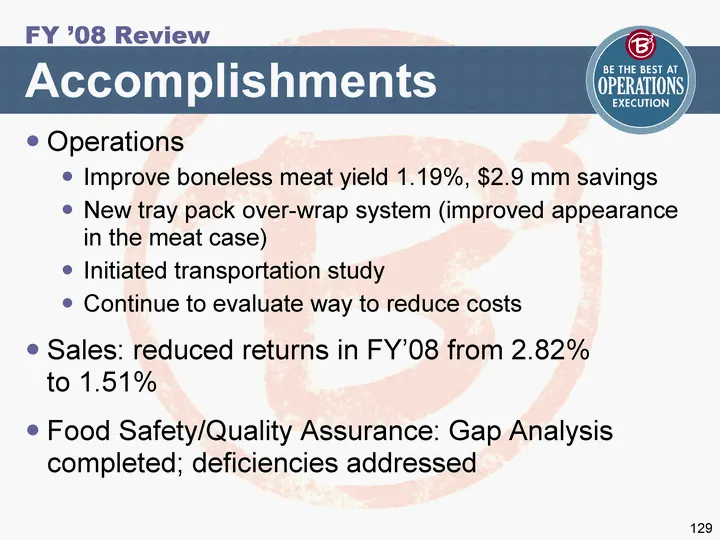
Slide 128: Operations Accomplishments
Operations Improve boneless meat yield 1.19%, $2.9 mm savings New tray pack over-wrap system (improved appearance in the meat case) Initiated transportation study Continue to evaluate way to reduce costs Sales: reduced returns in FY'08 from 2.82% to 1.51% Food Safety/Quality Assurance: Gap Analysis
Slide 129: Plant Rationalization Plan
DC expansion completed September '07 Sulphur Springs fully cooked expansion to be completed May'09 East Coast prep kitchen currently being evaluated Plant Rationalization Plan FY '08 Review
Slide 130: Return on Identifiable Assets
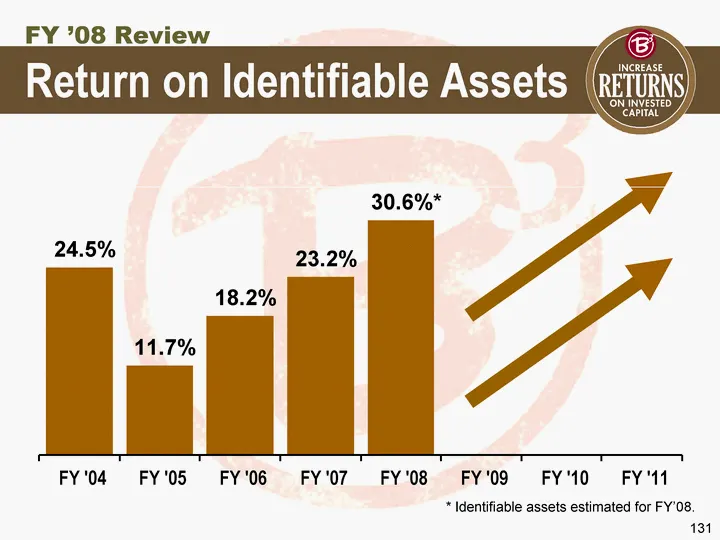
* Identifiable assets estimated for FY'08. Return on Identifiable Assets FY '08 Review 24.5% 11.7% 18.2% 23.2% 30.6%* FY '04 FY '05 FY '06 FY '07 FY '08 FY '09 FY '10 FY '11
Slide 131: Recap
Completed DC Expansion September '07 Completed Food Safety/QA Gap Analysis Reviewed efficacy and rationalized sales routes Launched new and improved grilling program Grocery Frozen Initiative / National Distribution Implications; Restructured Frozen Foods Sales Division FY '08 Review Recap
Slide 132: FY '09 Strategic Plan: Food Products
FY '09 Strategic Plan Food Products
Slide 133: FY '09 Plan
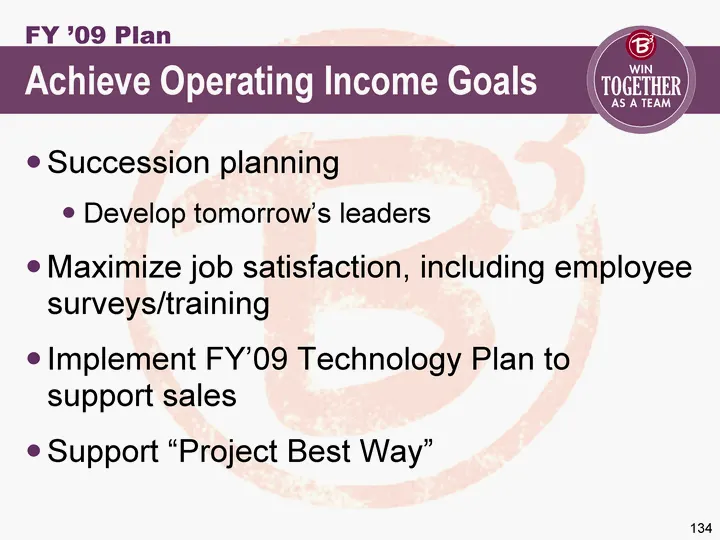
Succession planning Develop tomorrow's leaders Maximize job satisfaction, including employee surveys/training Implement FY'09 Technology Plan to support sales Support "Project Best Way" Achieve Operating Income Goals FY '09 Plan
Slide 134: Goal: Net Sales Growth
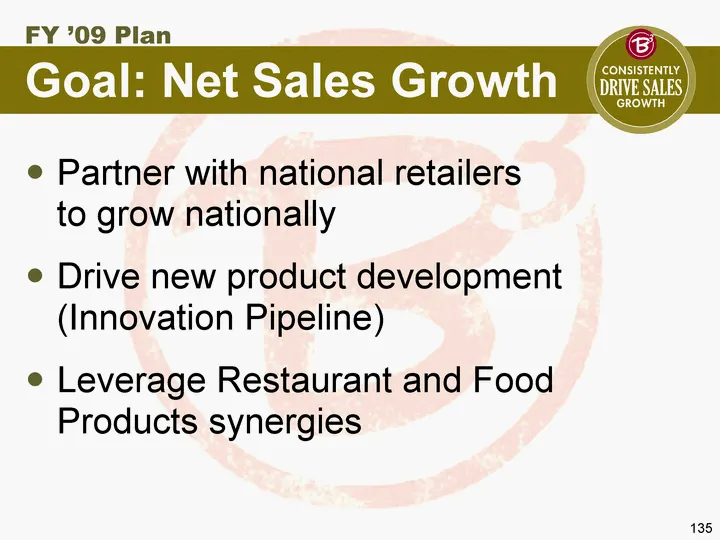
Partner with national retailers to grow nationally Drive new product development (Innovation Pipeline) Leverage Restaurant and Food Products synergies Goal: Net Sales Growth FY '09 Plan
Slide 135: Bob Evans Food Products Brand Identity
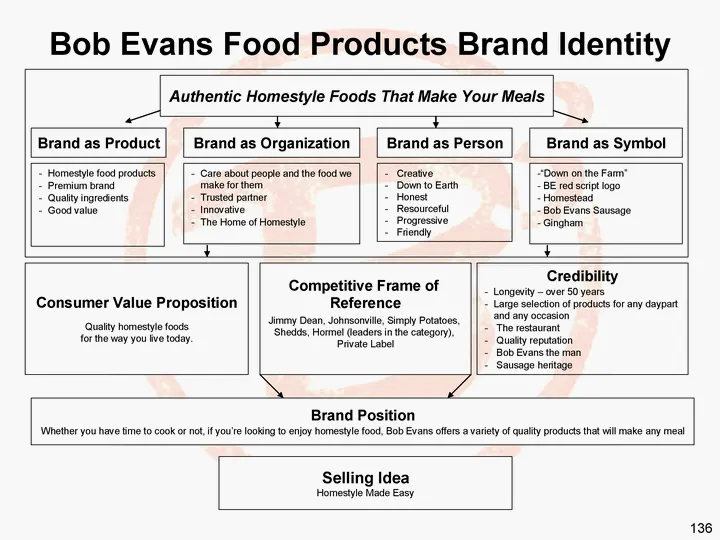
Bob Evans Food Products Brand Identity
Slide 136: Achieve Target Margin
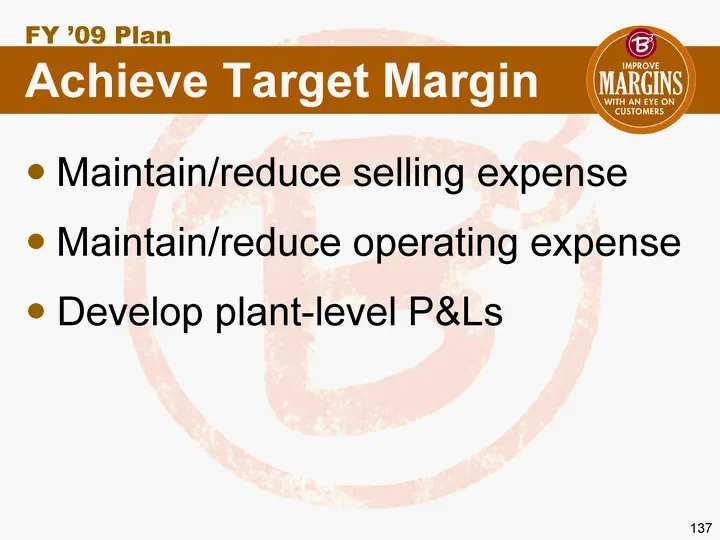
Maintain/reduce selling expense Maintain/reduce operating expense Develop plant-level P&Ls Achieve Target Margin FY '09 Plan
Slide 137: Achieve Optimal Operating Efficiencies
Improve facility cost per hundredweight Strengthen Food Safety and Quality Assurance Minimize freight expense Strengthen Sales Achieve Optimal Operating Efficiencies FY '089 Plan
Slide 138: Achieve Target Returns
Drive operational efficiency and productivity in new and existing facilities Expand production capacity in key product lines Develop and evaluate feasibility of East Coast Prep Kitchen Achieve Target Returns FY '09 Plan
Slide 139: Key Strategies and Initiatives
Develop plant P&Ls Complete Sulphur Springs fully cooked expansion Develop rationale for the East Coast Prep Kitchen Enhance existing Customer Relationship Management (CRM) Drive Product Innovation Pipeline Develop a "Gain Share" program at plant level FY '09 Plan Key Strategies and Initiatives
Slide 140: Roadmap to Success
Build on FY'08 results Team stronger than ever Positioned for the future National Account Teams Frozen Foods sales organization New Product Innovation Pipeline Continuous improvement of Systems & Processes Cost Management techniques/Benchmarking FY '09 Plan Roadmap to Success
Slide 141: 2009 Objectives
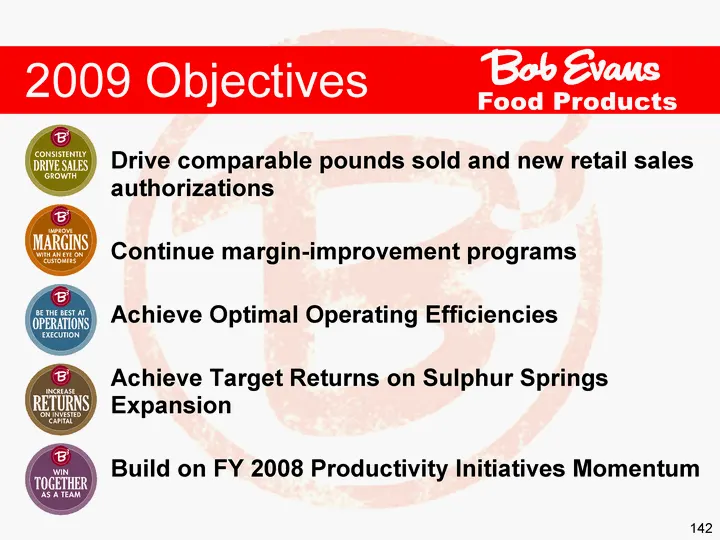
Drive comparable pounds sold and new retail sales authorizations Continue margin-improvement programs Achieve Optimal Operating Efficiencies Achieve Target Returns on Sulphur Springs Expansion Build on FY 2008 Productivity Initiatives Momentum 2009 Objectives Food Products
Slide 142: Don Radkoski, CFO
Don Radkoski Chief Financial Officer
Slide 143: FY 2009 Outlook
FY 2009 Outlook Don Radkoski Chief Financial Officer
Slide 144: FY '09 Outlook: Diluted Earnings Per Share
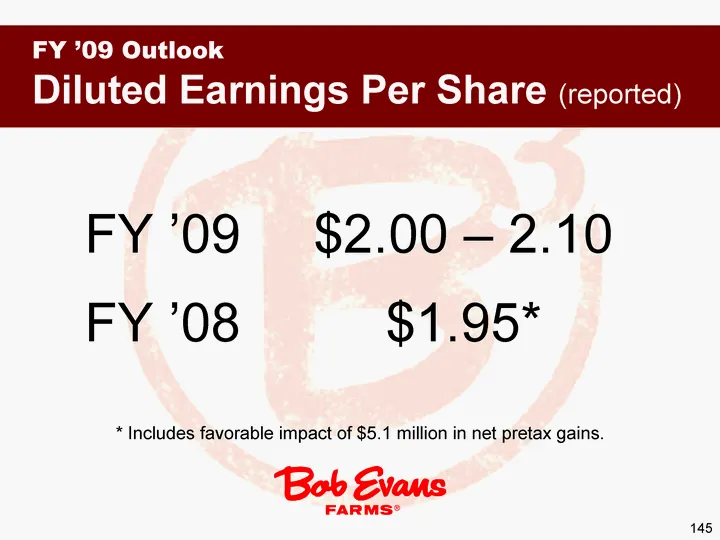
FY '09 Outlook Diluted Earnings Per Share (reported) $1.95* FY '08 $2.00 - 2.10 FY '09 * Includes favorable impact of $5.1 million in net pretax gains.
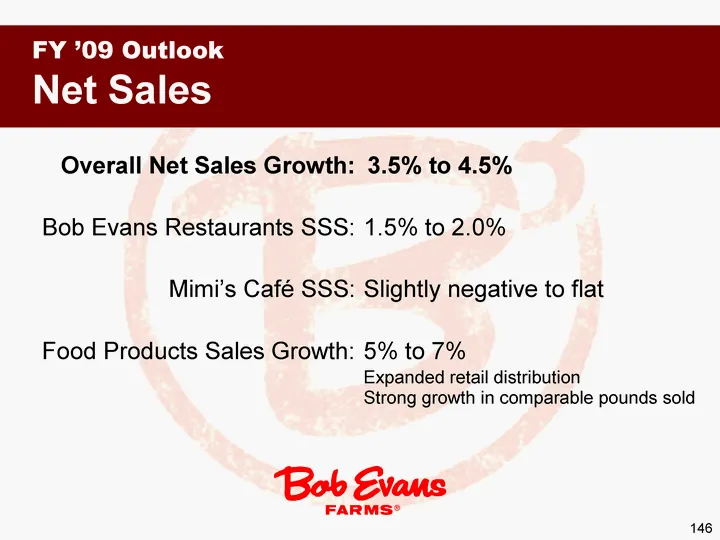
Slide 145: FY '09 Outlook: Net Sales
Slightly negative to flat Mimi's Cafe SSS: 1.5% to 2.0% Bob Evans Restaurants SSS: 3.5% to 4.5% Overall Net Sales Growth: FY '09 Outlook Net Sales 5% to 7% Food Products Sales Growth: Expanded retail distribution Strong growth in comparable pounds sold
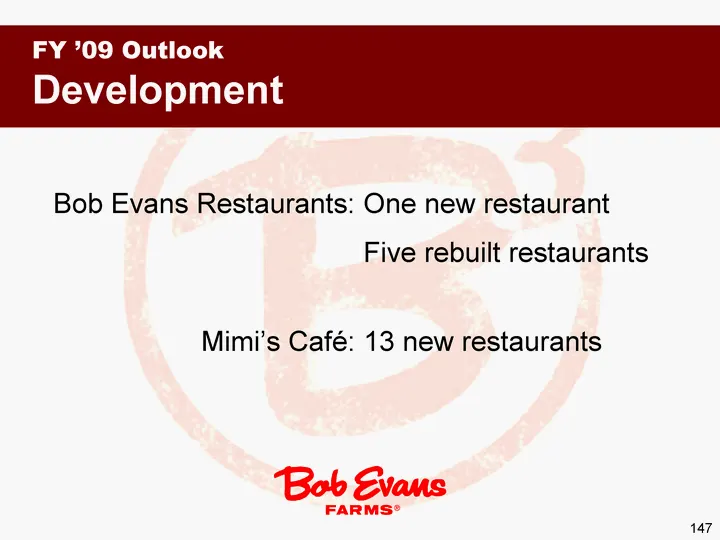
Slide 146: FY '09 Outlook: Development
13 new restaurants Mimi's Cafe: One new restaurant Five rebuilt restaurants Bob Evans Restaurants: FY '09 Outlook Development
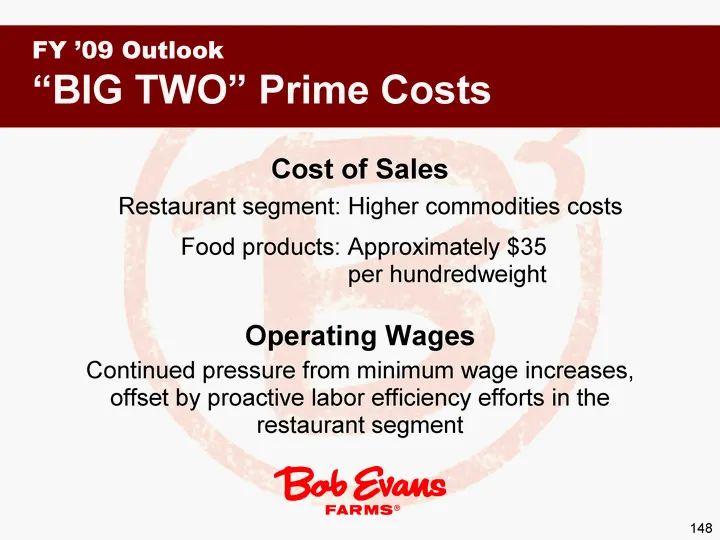
Slide 147: FY '09 Outlook: "Big Two" Prime Costs
Cost of Sales Approximately $35 per hundredweight Food products: Higher commodities costs Restaurant segment: Operating Wages Continued pressure from minimum wage increases, offset by proactive labor efficiency efforts in the restaurant segment FY '09 Outlook "BIG TWO" Prime Costs
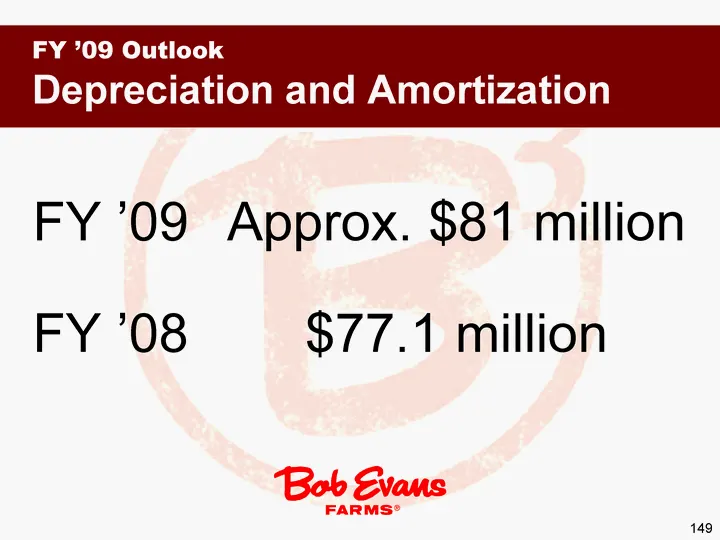
Slide 148: FY '09 Outlook: Depreciation and Amortization
FY '09 Outlook Depreciation and Amortization $77.1 million FY '08 Approx. $81 million FY '09
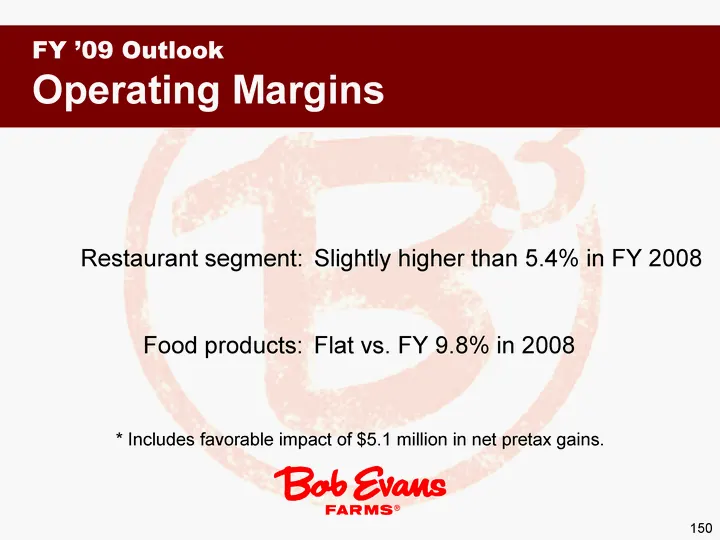
Slide 149: FY '09 Outlook: Operating Margins
Flat vs. FY 9.8% in 2008 Food products: Slightly higher than 5.4% in FY 2008 Restaurant segment: * Includes favorable impact of $5.1 million in net pretax gains. FY '09 Outlook Operating Margins
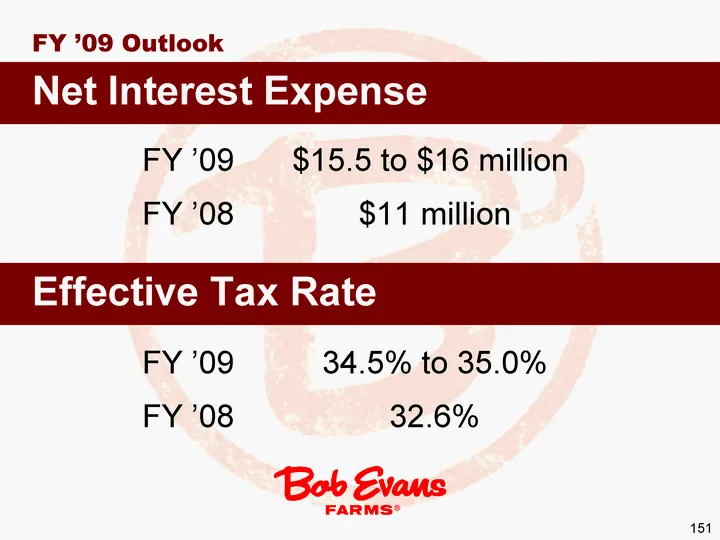
Slide 150: FY '09 Outlook: Interest Expense and Tax Rate
$11 million FY '08 $15.5 to $16 million FY '09 Net Interest Expense Effective Tax Rate FY '09 Outlook 32.6% FY '08 34.5% to 35.0% FY '09
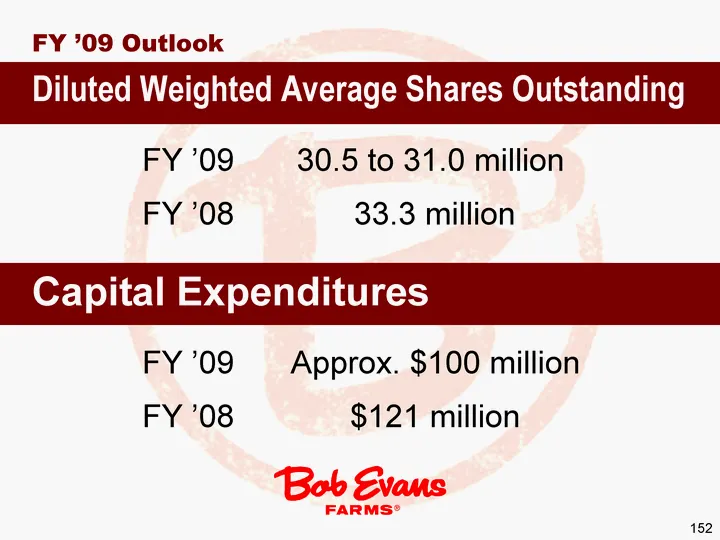
Slide 151: FY '09 Outlook: Shares and Capital Expenditures
33.3 million FY '08 30.5 to 31.0 million FY '09 Diluted Weighted Average Shares Outstanding Capital Expenditures FY '09 Outlook $121 million FY '08 Approx. $100 million FY '09
Slide 152: Q&A
Q&A “Bob Evaus FARMS® Be OWE ORR Bn
Source: SEC EDGAR · 8-K filed Jun 4, 2008
More decks from Bob Evans Farms Inc
 Merger or Acquisition (September 2017)18 slides · Sep 28, 2017
 Merger or Acquisition (September 2017)12 slides · Sep 19, 2017
 Merger or Acquisition (September 2017)17 slides · Sep 19, 2017
 Merger or Acquisition (September 2017)10 slides · Sep 19, 2017
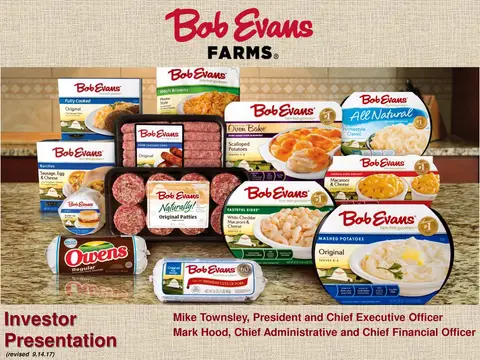 Investor Presentation (September 2017)32 slides · Sep 14, 2017
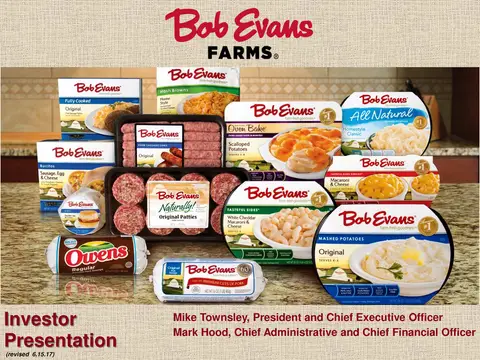 Investor Presentation (June 2017)30 slides · Jun 15, 2017