Altra Industrial Motion — Q3 2018 Earnings Presentation
15 slides from Altra Industrial Motion's earnings presentation, Oct 25, 2018

Slide 1: Third Quarter 2018 Results
Third Quarter 2018 Results October 25, 2018 Exhibit 99.2
Slide 2: Q3 2018 Conference Call Details
Q3 2018 Conference Call Details Live Webcast October 25, 2018 10:00 AM ET Dial In Number 877-407-8293 Domestic 201-689-8349 International Webcast at www.altramotion.com Replay Through November 7, 2018 877-660-6853 Domestic 201-612-7415 International Conference ID: # 13683742 Webcast Replay at www.al
Slide 3: Safe Harbor Statement
Safe Harbor Statement Cautionary Statement Regarding Forward Looking Statements: All statements, other than statements of historical fact included in this release are forward-looking statements, as that term is defined in the Private Securities Litigation Reform Act of 1995. These statements include

Slide 4: Agenda and Speakers
Agenda and Speakers Executive Overview Market Review A&S Combination Q3 Financial Review & 2018 Guidance Strategic Priorities Q&A Carl Christenson Chairman & Chief Executive Officer Christian Storch Vice President & Chief Financial Officer
Slide 5: Third-Quarter 2018 Highlights
Third-Quarter 2018 Highlights 6.5% increase in net sales to $228.5 million Third-quarter net income was $12.3 million, or $0.42 per diluted share, compared with $13.3 million, or $0.46 per diluted share, in the third quarter of 2017 Non-GAAP adjusted net income in Q3 2018 was $18.7 million, or $0.64
Slide 6: Third-Quarter Key End-Market Drivers
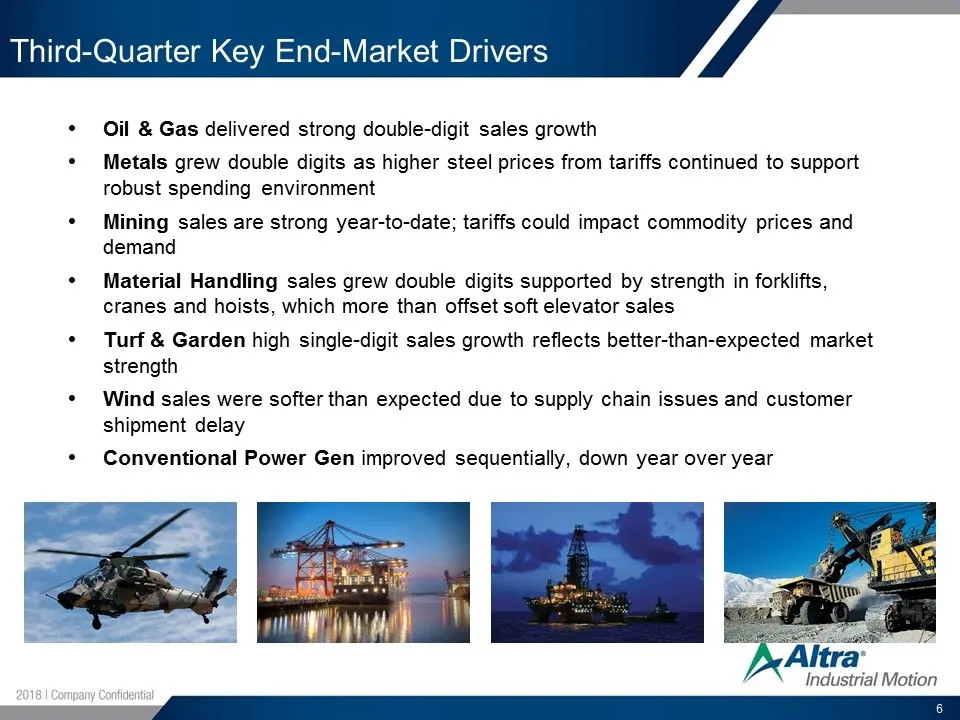
Third-Quarter Key End-Market Drivers Oil & Gas delivered strong double-digit sales growth Metals grew double digits as higher steel prices from tariffs continued to support robust spending environment Mining sales are strong year-to-date; tariffs could impact commodity prices and demand Material Han
Slide 7: Combination with A&S Completed Ahead of Schedule
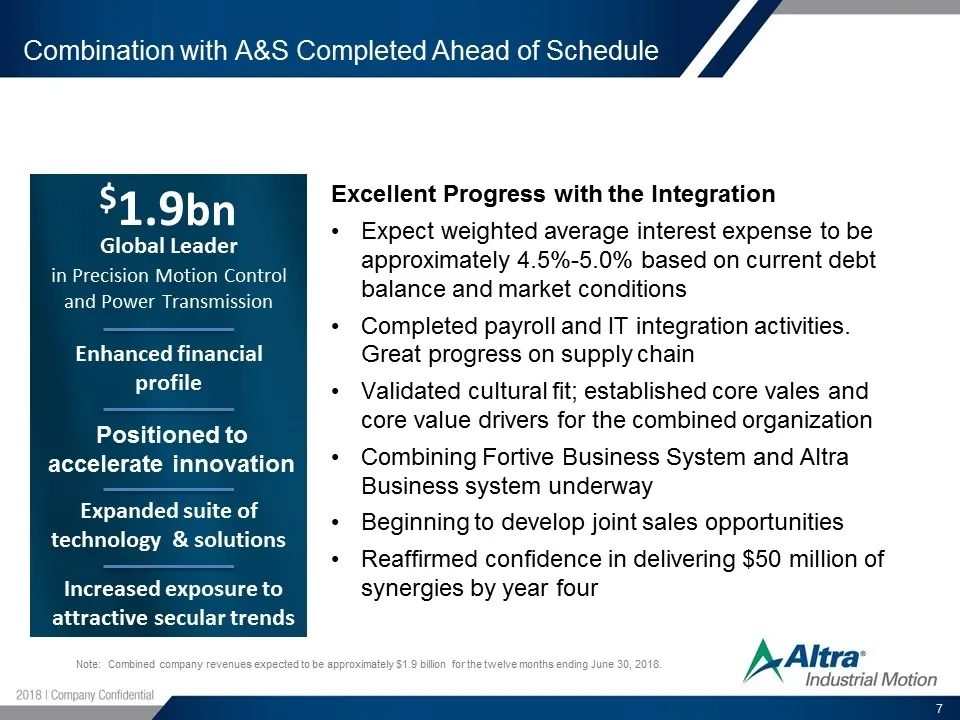
Combination with A&S Completed Ahead of Schedule $1.9bn Enhanced financial profile Global Leader in Precision Motion Control and Power Transmission Expanded suite of technology & solutions Positioned to accelerate innovation Increased exposure to attractive secular trends Excellent Progress with the
Slide 8: Q3 2018 Financial Highlights
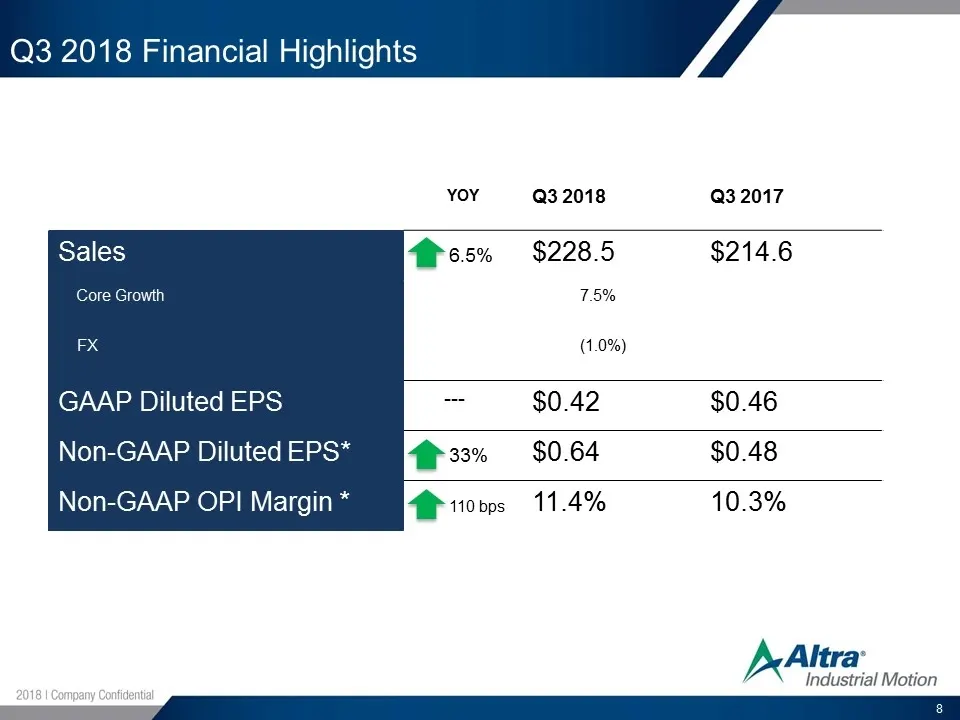
Q3 2018 Financial Highlights YOY Q3 2018 Q3 2017 Sales 6.5% $228.5 $214.6 Core Growth 7.5% FX (1.0%) GAAP Diluted EPS --- $0.42 $0.46 Non-GAAP Diluted EPS* 33% $0.64 $0.48 Non-GAAP OPI Margin * 110 bps 11.4% 10.3%
Slide 9: Balance Sheet Highlights
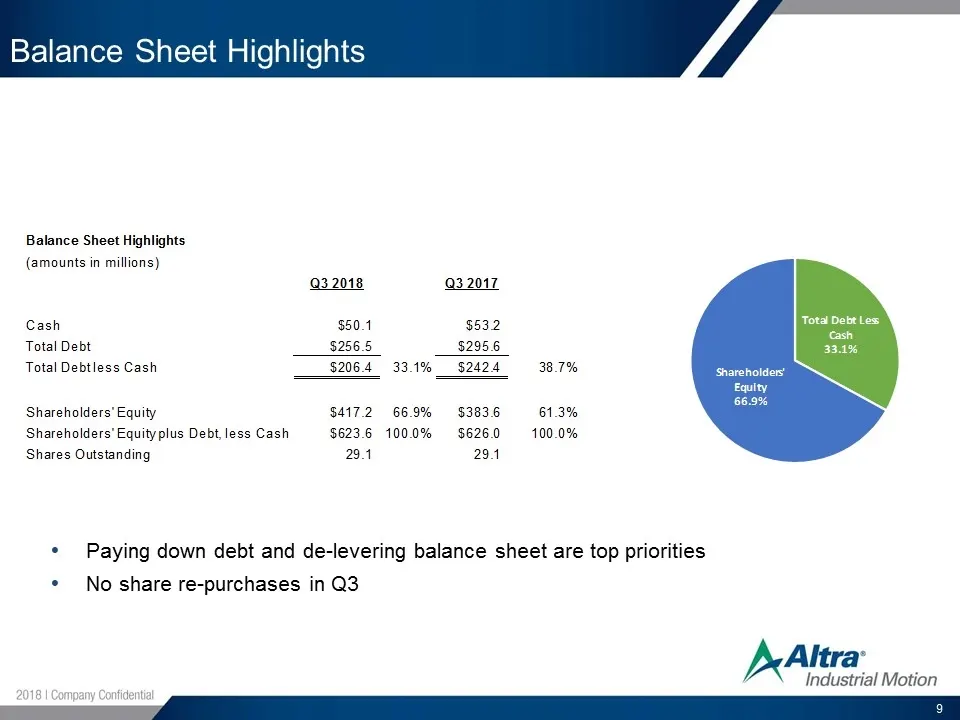
Balance Sheet Highlights Paying down debt and de-levering balance sheet are top priorities No share re-purchases in Q3 Balance Sheet Highlights(amounts in millions)Q3 2018Q3 2017Cash$50.1 $53.2 Total Debt$256.5 $295.6 Total Debt less Cash$206.4 33.1%$242.4 38.7%Shareholders' Equity$417.2 66.9%$383.6
Slide 10: 2018 Guidance: Updating Top and Bottomline Expectations
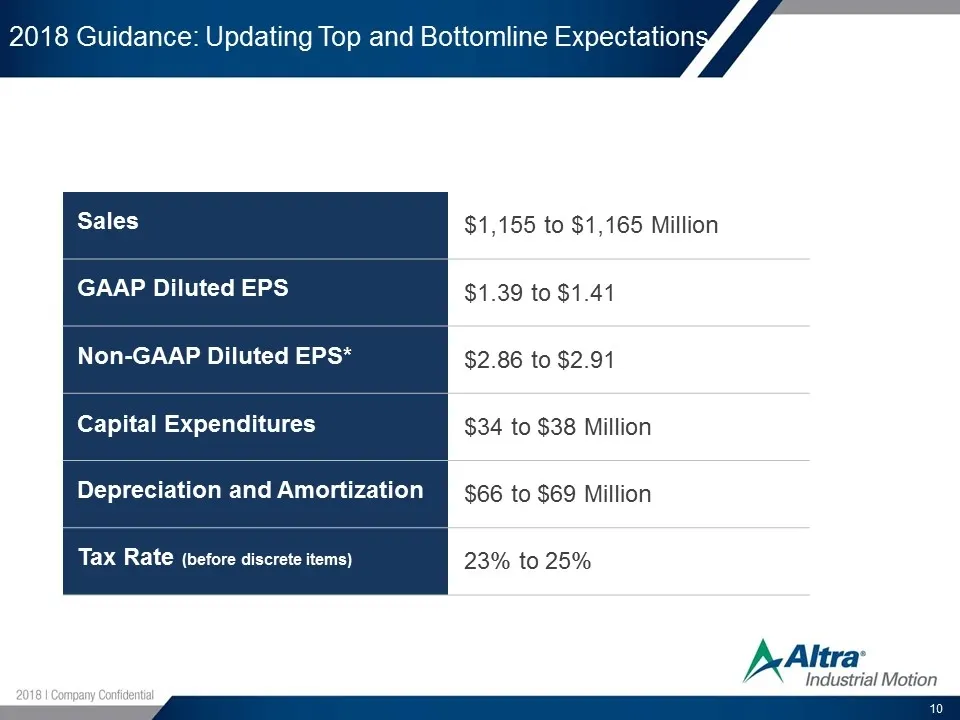
2018 Guidance: Updating Top and Bottomline Expectations Sales $1,155 to $1,165 Million GAAP Diluted EPS $1.39 to $1.41 Non-GAAP Diluted EPS* $2.86 to $2.91 Capital Expenditures $34 to $38 Million Depreciation and Amortization $66 to $69 Million Tax Rate (before discrete items) 23% to 25%
Slide 11: Strategic Priorities
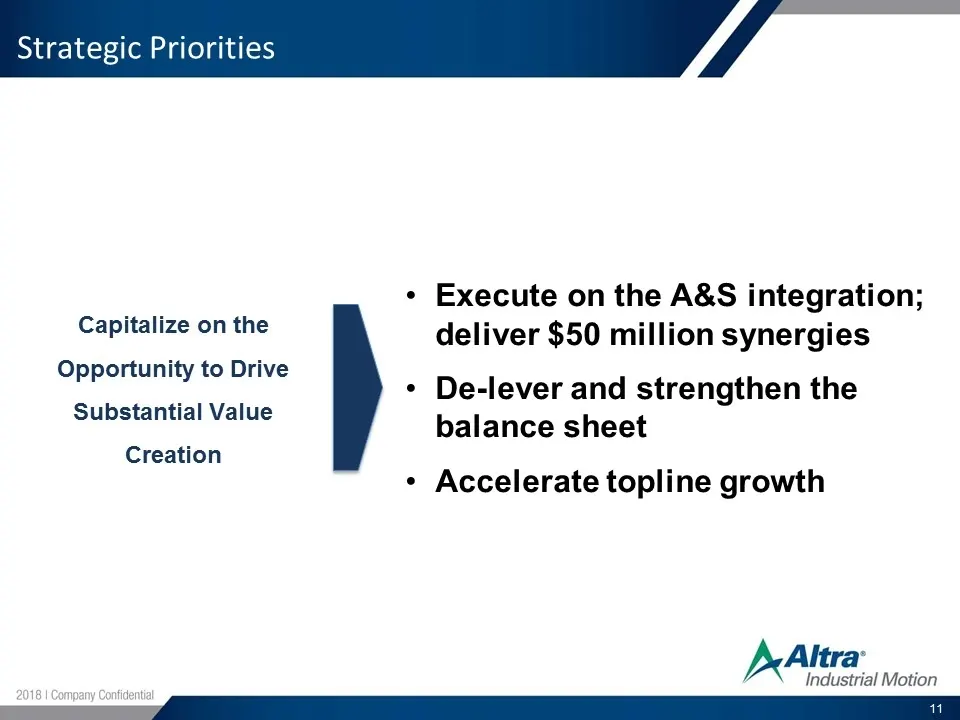
Strategic Priorities Capitalize on the Opportunity to Drive Substantial Value Creation Execute on the A&S integration; deliver $50 million synergies De-lever and strengthen the balance sheet Accelerate topline growth
Slide 12: Discussion of Non-GAAP Measures
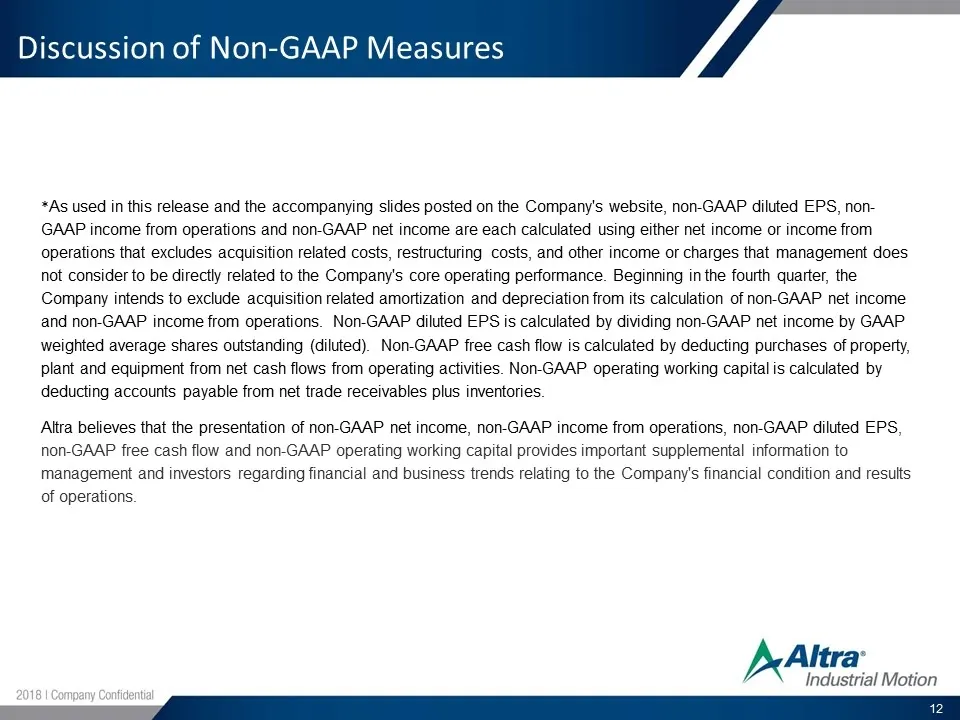
Discussion of Non-GAAP Measures *As used in this release and the accompanying slides posted on the Company's website, non-GAAP diluted EPS, non-GAAP income from operations and non-GAAP net income are each calculated using either net income or income from operations that excludes acquisition related
Slide 13: Appendix Non-GAAP Measures
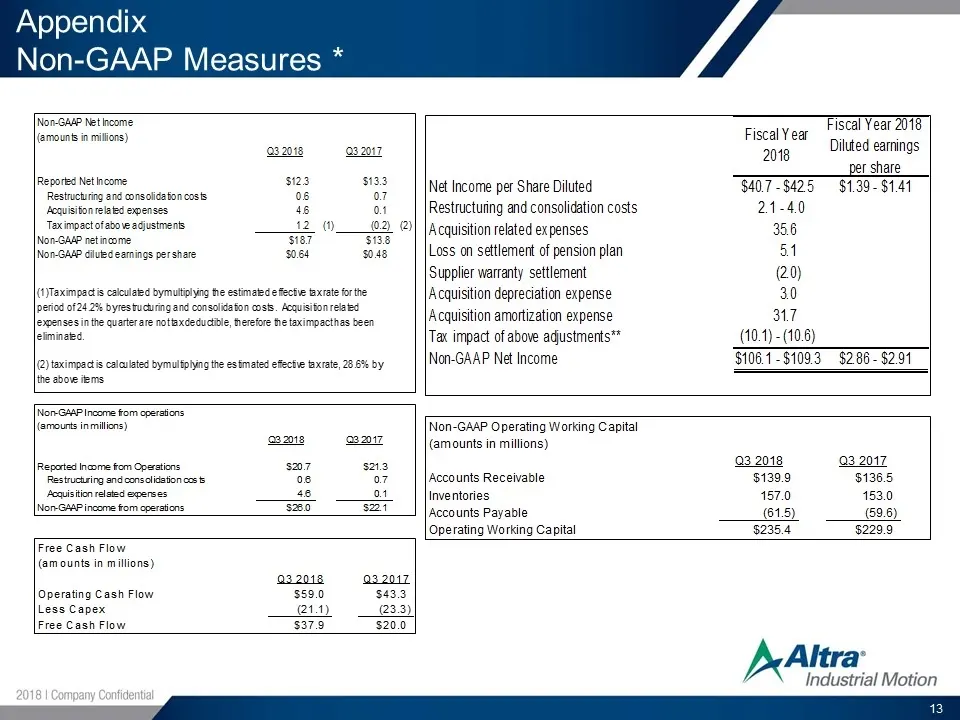
Appendix Non-GAAP Measures * Non-GAAP Net Income(amounts in millions)Q3 2018Q3 2017Reported Net Income$12.3 $13.3 Restructuring and consolidation costs 0.6 0.7 Acquisition related expenses 4.6 0.1 Tax impact of above adjustments 1.2 (1) (0.2) (2)Non-GAAP net income$18.7$13.8Non-GAAP diluted earnings
Slide 14: Appendix Non-GAAP EBITDA Reconciliation
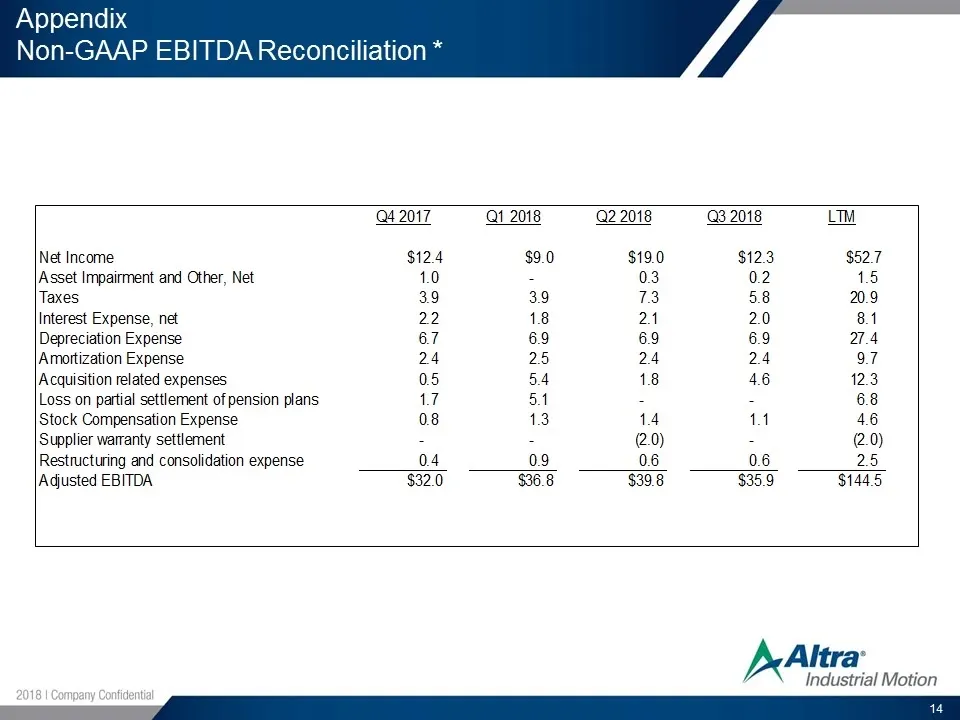
Appendix Non-GAAP EBITDA Reconciliation * EBITDA Reconciliation(amounts in millions)Q4 2017Q1 2018Q2 2018Q3 2018LTMNet Income$12.4$9.0$19.0$12.3$52.7Asset Impairment and Other, Net 1.0 - 0.3 0.2 1.5 Taxes 3.9 3.9 7.3 5.8 20.9 Interest Expense, net 2.2 1.8 2.1 2.0 8.1 Depreciation Expense 6.7 6.9 6.9
Slide 15: Appendix Non-GAAP Net Income Reconciliation
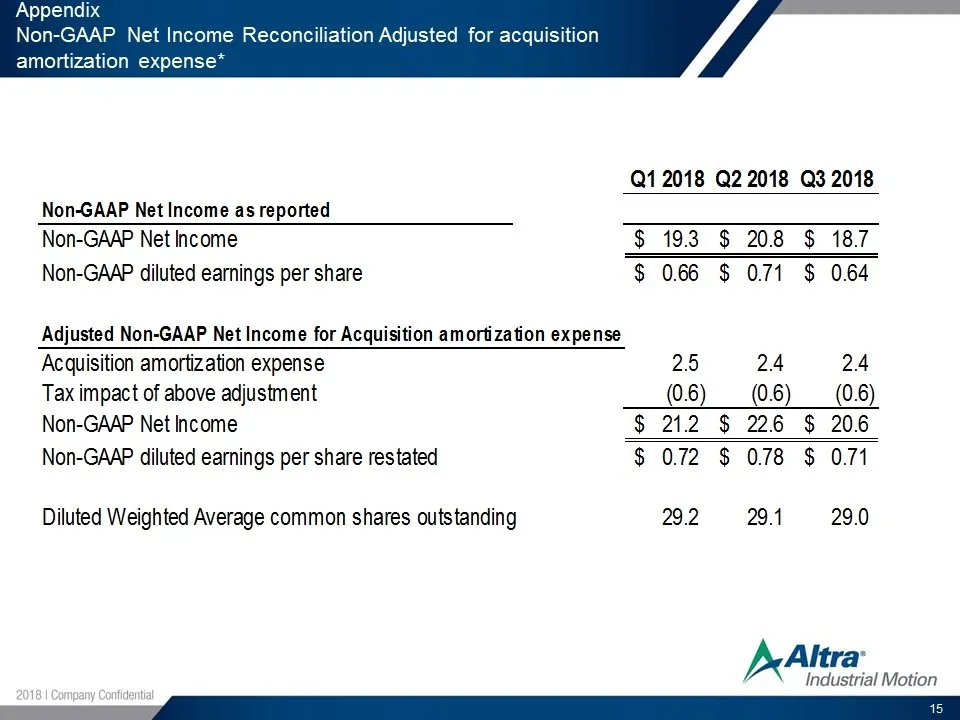
Appendix Non-GAAP Net Income Reconciliation Adjusted for acquisition amortization expense* Restated Non-GAAP Net Income with Acquisition amortization expenseQ3 2018Q1 2018Q2 2018 Q3 2018 Fiscal Year 2018Non-GAAP Net Income as reportedNon-GAAP Net Income $19.3 $20.8 $18.7 $100.5 $103.8 Non-GAAP dilut
Source: SEC EDGAR · 8-K filed Oct 25, 2018
More decks from Altra Industrial Motion Corp
 Q2 2022 Earnings Presentation25 slides · Jul 28, 2022
 Q1 2022 Earnings Presentation25 slides · Apr 28, 2022
 Investor Day (March 2022)135 slides · Mar 11, 2022
 Q4 2021 Earnings Presentation17 slides · Feb 16, 2022
 Q3 2021 Earnings Presentation16 slides · Oct 22, 2021
 Q2 2021 Earnings Presentation16 slides · Jul 23, 2021