South Jersey Industries — Morgan Stanley Utilities Conference 2017
20 slides from South Jersey Industries's conference presentation, Mar 2, 2017

Slide 1: South Jersey Industries Morgan Stanley Utilities Conference
South Jersey Industries Morgan Stanley Utilities Conference - NY March 2, 2017
Slide 2: Forward Looking Statements
Forward Looking Statements Certain statements contained in this presentation may qualify as “forward-looking statements” within the meaning of Section 27A of the Securities Act of 1933 and Section 21E of the Securities Exchange Act of 1934. All statements other than statements of historical fact sho

Slide 3: scabs ee
scabs ee ae gi ses tue ent iy re d eer, Satecrrordbatiybn aly Settee fy, GreenFlexiblessorh, ie <Sreuth iver erinienes ES egies" SolarAgitity LNG yasler Partner ¢:" sate panel s Clean ia ENS go Nae, Bor” Deliver Communit - AES enmeaner
Slide 4: 2016 Performance Overview
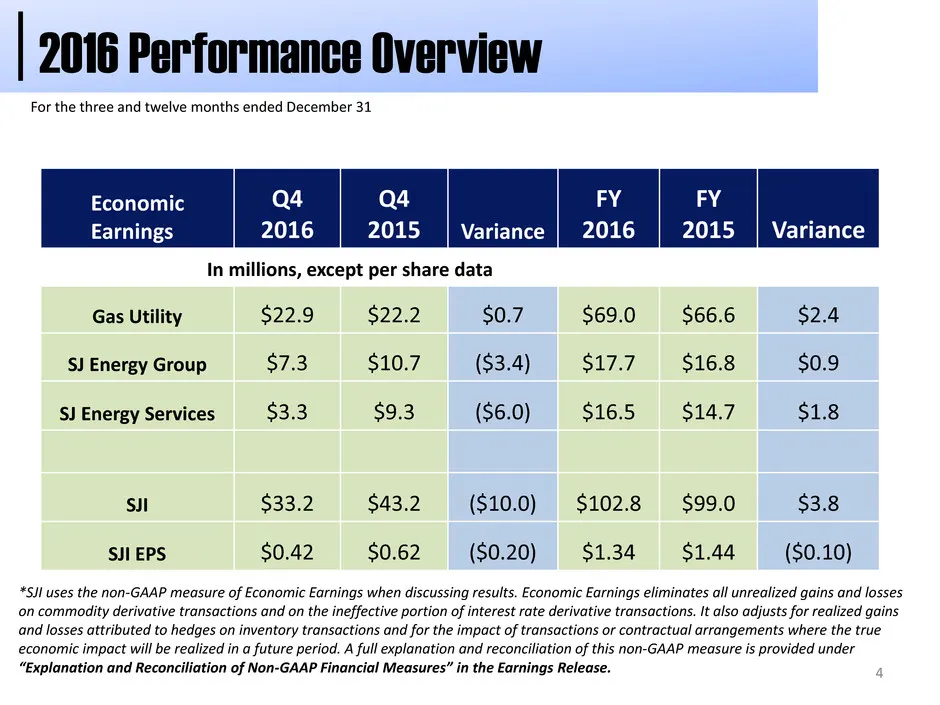
4 *SJI uses the non-GAAP measure of Economic Earnings when discussing results. Economic Earnings eliminates all unrealized gains and losses on commodity derivative transactions and on the ineffective portion of interest rate derivative transactions. It also adjusts for realized gains and losses attr
Slide 5: Strategic Focus
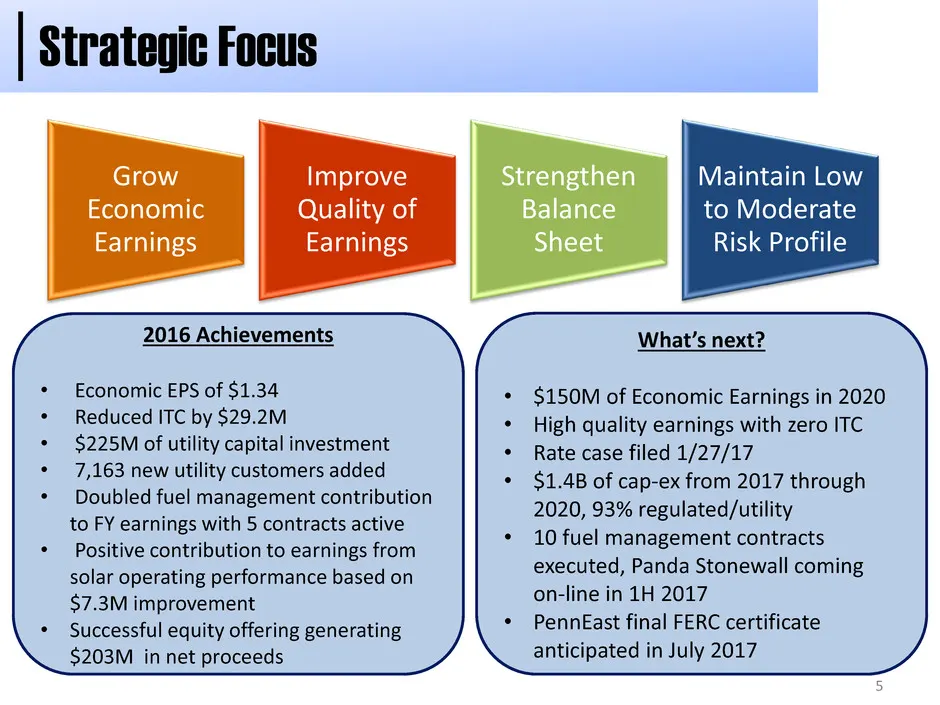
Strategic Focus 5 Grow Economic Earnings Improve Quality of Earnings Strengthen Balance Sheet Maintain Low to Moderate Risk Profile 2016 Achievements • Economic EPS of $1.34 • Reduced ITC by $29.2M • $225M of utility capital investment • 7,163 new utility customers added • Doubled fuel management co
Slide 6: Improving Earnings Quality
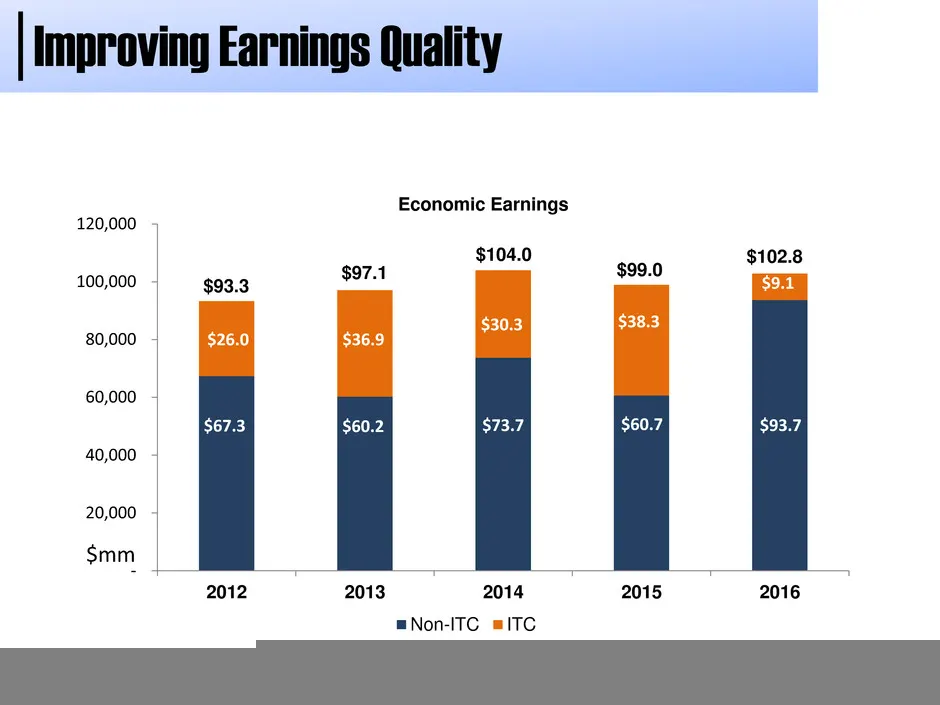
6 Improving Earnings Quality - 20,000 40,000 60,000 80,000 100,000 120,000 2012 2013 2014 2015 2016 Economic Earnings Non-ITC ITC $97.1 $104.0 $99.0 $102.8 $93.3 $26.0 $36.9 $30.3 $38.3 $9.1 $67.3 $60.2 $73.7 $60.7 $93.7 $mm
Slide 7: Financial Position
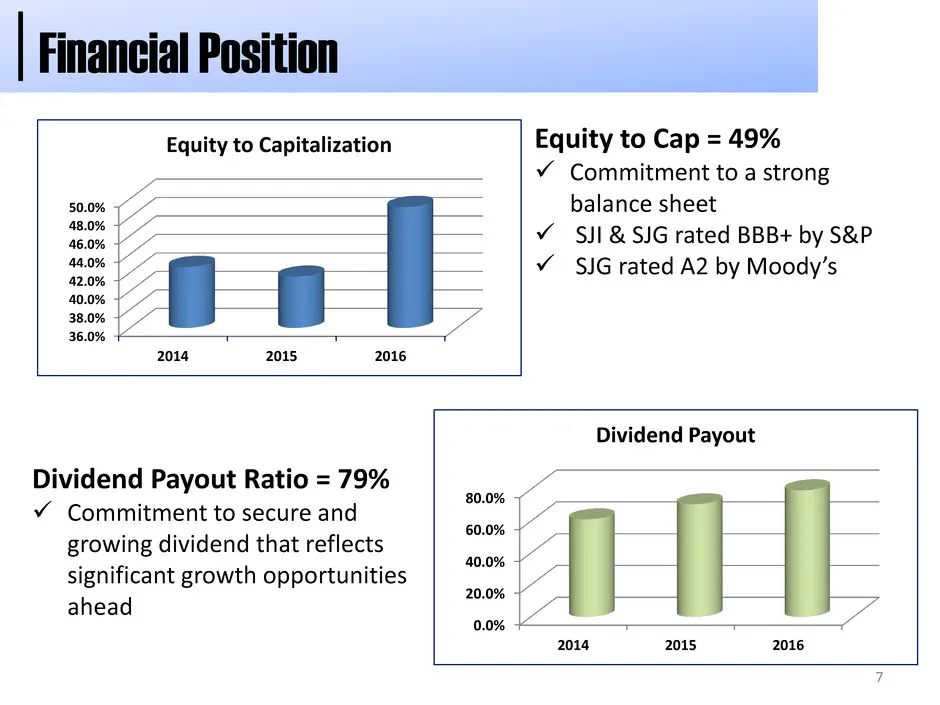
7 Financial Position 0.0% 20.0% 40.0% 60.0% 80.0% 2014 2015 2016 Dividend Payout Equity to Cap = 49% Commitment to a strong balance sheet SJI & SJG rated BBB+ by S&P SJG rated A2 by Moody’s Dividend Payout Ratio = 79% Commitment to secure and growing dividend that reflects significant growth
Slide 8: Utility / Regulated Business Update
8 Utility / Regulated Business Update
Slide 9: Utility Earnings Growth
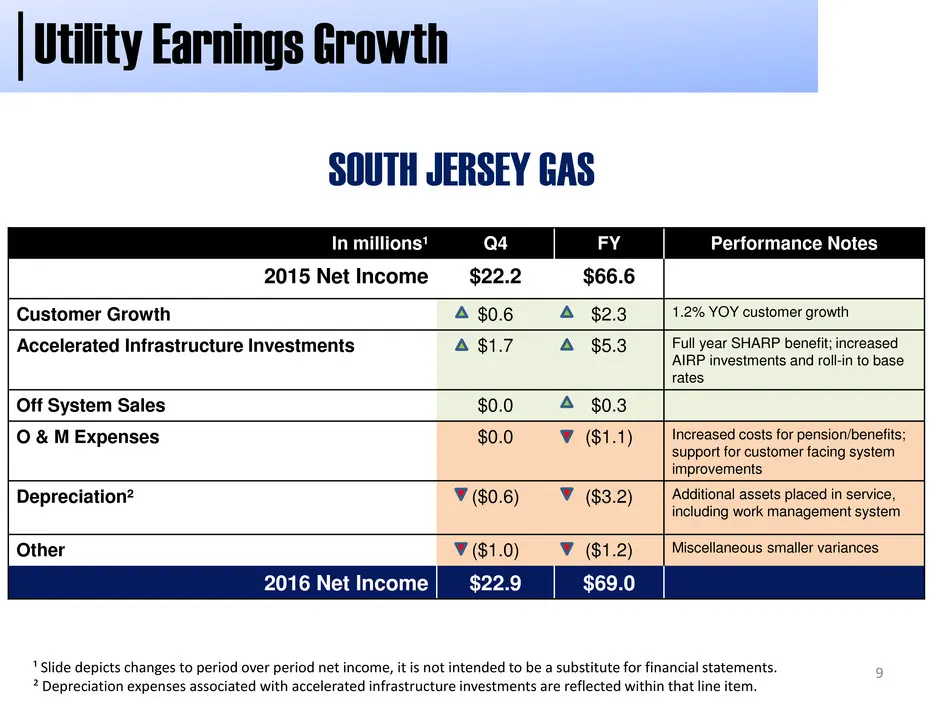
9 Utility Earnings Growth ¹ Slide depicts changes to period over period net income, it is not intended to be a substitute for financial statements. ² Depreciation expenses associated with accelerated infrastructure investments are reflected within that line item. SOUTH JERSEY GAS (In millions) In mi
Slide 10: Utility Customer Growth
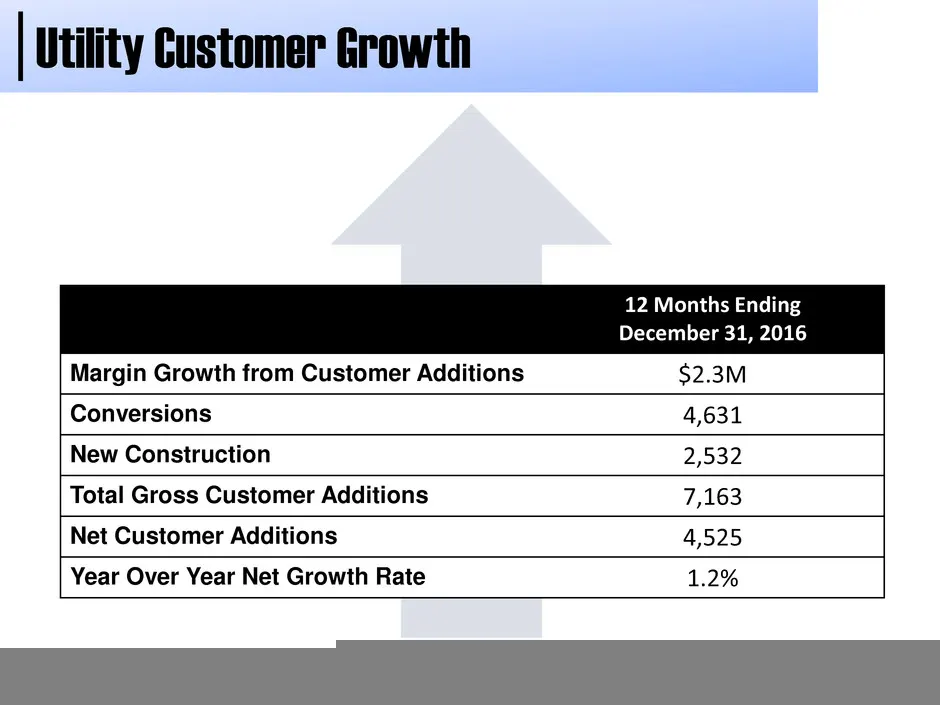
10 Utility Customer Growth 12 Months Ending December 31, 2016 Margin Growth from Customer Additions $2.3M Conversions 4,631 New Construction 2,532 Total Gross Customer Additions 7,163 Net Customer Additions 4,525 Year Over Year Net Growth Rate 1.2%
Slide 11: Regulatory Highlights: BL England, Base Rate Case, PennEast, AIRP
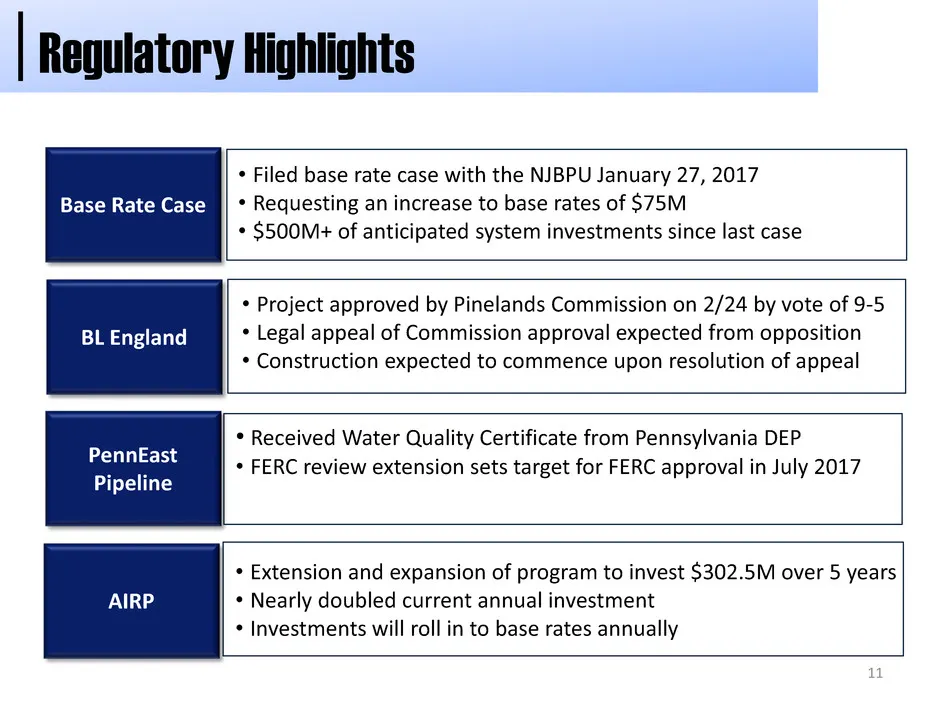
11 BL England Base Rate Case PennEast Pipeline AIRP • Filed base rate case with the NJBPU January 27, 2017 • Requesting an increase to base rates of $75M • $500M+ of anticipated system investments since last case • Extension and expansion of program to invest $302.5M over 5 years • Nearly doubled cu
Slide 12: Non-Utility Business Update
12 Non-Utility Business Update
Slide 13: Non-Utility Total Contributions to Earnings
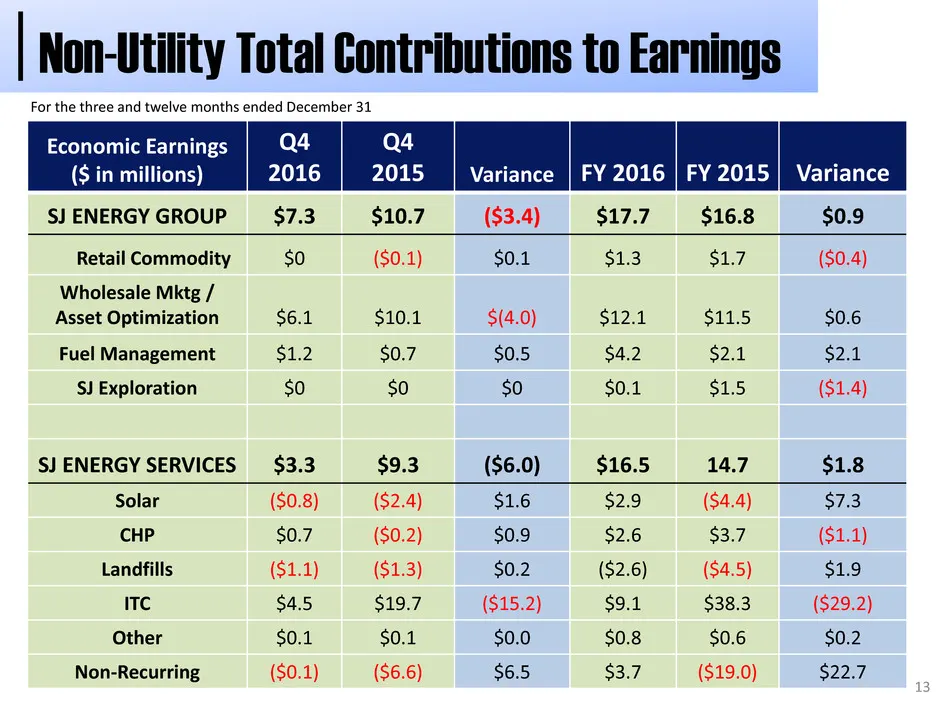
13 Non-Utility Total Contributions to Earnings Economic Earnings ($ in millions) Q4 2016 Q4 2015 Variance FY 2016 FY 2015 Variance SJ ENERGY GROUP $7.3 $10.7 ($3.4) $17.7 $16.8 $0.9 Retail Commodity $0 ($0.1) $0.1 $1.3 $1.7 ($0.4) Wholesale Mktg / Asset Optimization $6.1 $10.1 $(4.0) $12.1 $11.5 $0.
Slide 14: Fuel Supply Management
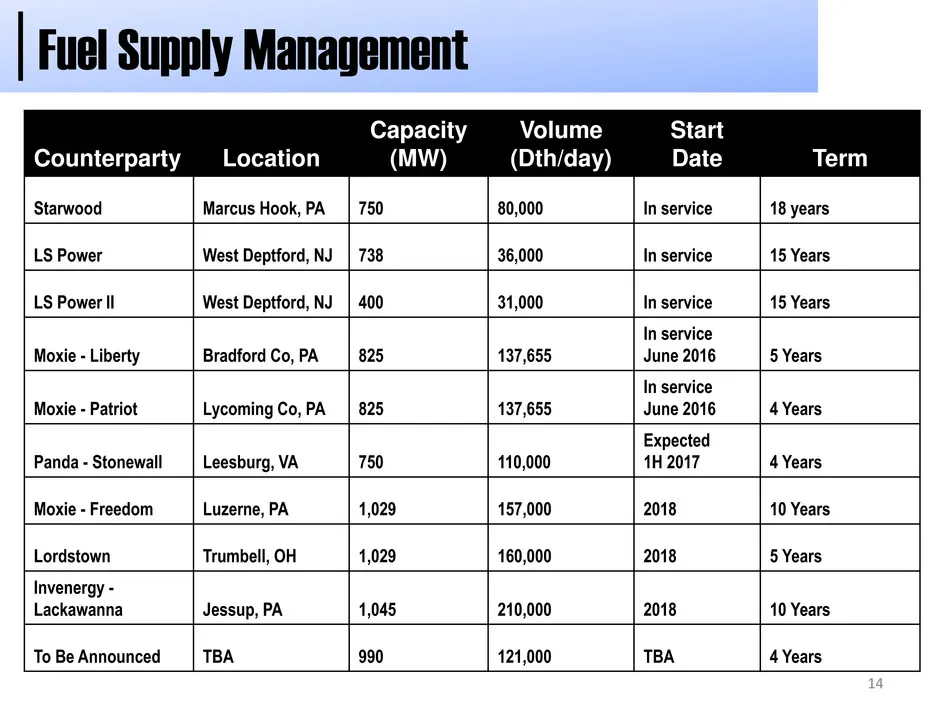
14 Counterparty Location Capacity (MW) Volume (Dth/day) Start Date Term Starwood Marcus Hook, PA 750 80,000 In service 18 years LS Power West Deptford, NJ 738 36,000 In service 15 Years LS Power II West Deptford, NJ 400 31,000 In service 15 Years Moxie - Liberty Bradford Co, PA 825 137,655 In servic
Slide 15: Solar SREC Generation
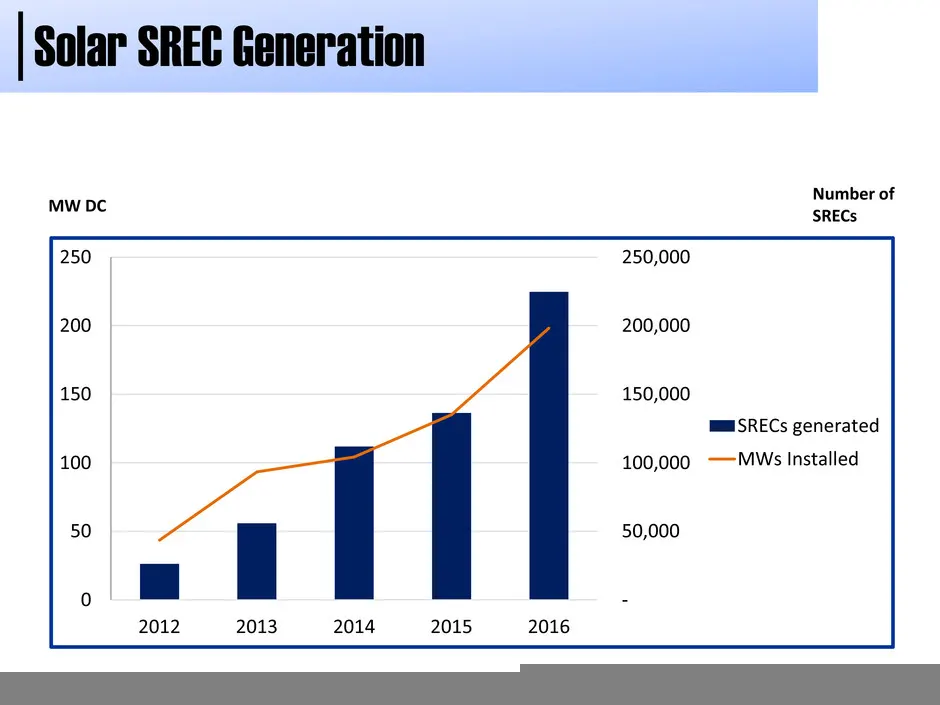
15 Solar SREC Generation Number of SRECs MW DC - 50,000 100,000 150,000 200,000 250,000 0 50 100 150 200 250 2012 2013 2014 2015 2016 SRECs generated MWs Installed
Slide 16: cary
cary sat as ence ae a, suits “eee, Responsible reise l1.cien fonfidence buss" SolarAgility LNG r i Partnel estate agit Sorc. gis” ran rsity.— al Orr AOE Renewables” gtr ae Bor”
Slide 17: SJI Capital Investment
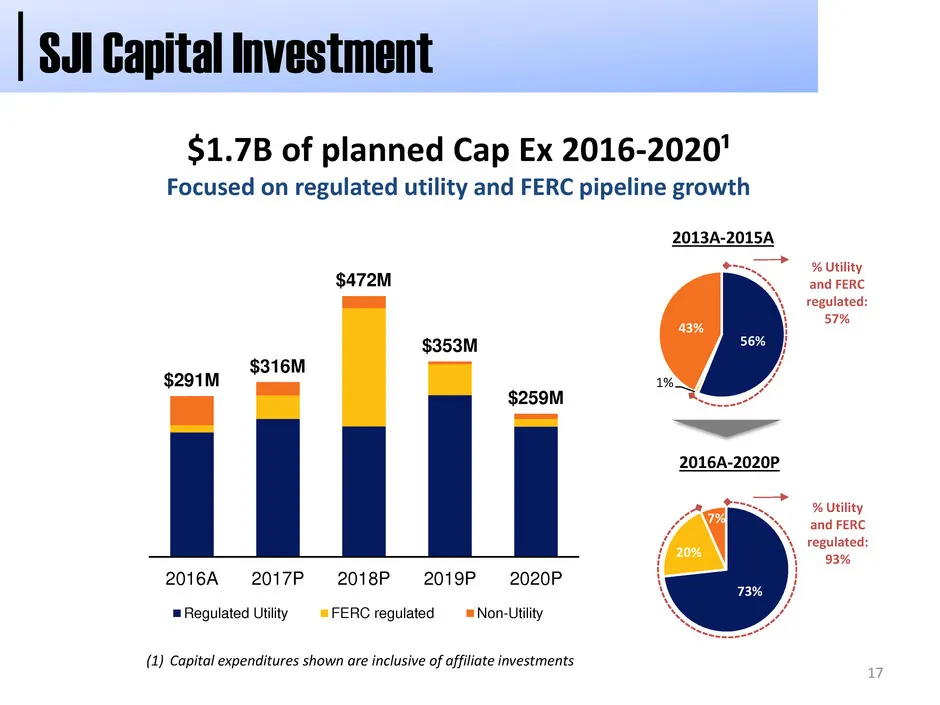
73% 20% 7% 56% 1% 43% 17 $1.7B of planned Cap Ex 2016-2020¹ Focused on regulated utility and FERC pipeline growth (1) Capital expenditures shown are inclusive of affiliate investments 2013A-2015A 2016A-2020P % Utility and FERC regulated: 57% % Utility and FERC regulated: 93% $291M $316M $472M $353M
Slide 18: Utility capital investment plan
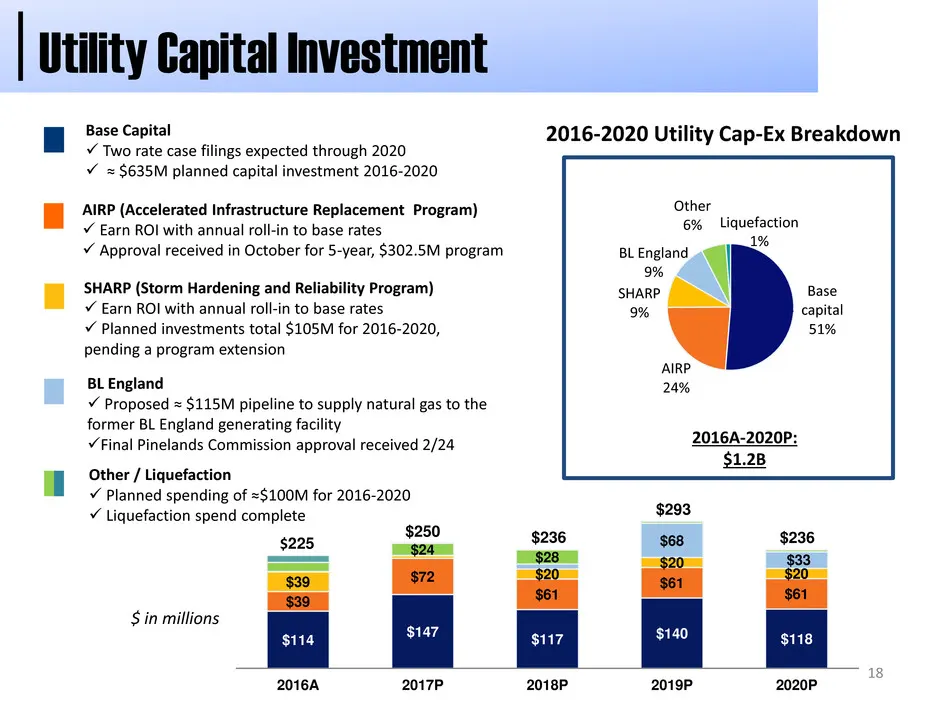
18 $114 $147 $117 $140 $118 $39 $72 $61 $61 $61 $39 $20 $20 $20 $68 $24 $28 $33 $250 $236 $293 $236 2016A 2017P 2018P 2019P 2020P $225 Base Capital Two rate case filings expected through 2020 ≈ $635M planned capital investment 2016-2020 Other / Liquefaction Planned spending of ≈$100M for 2016-
Slide 19: PennEast Pipeline Project
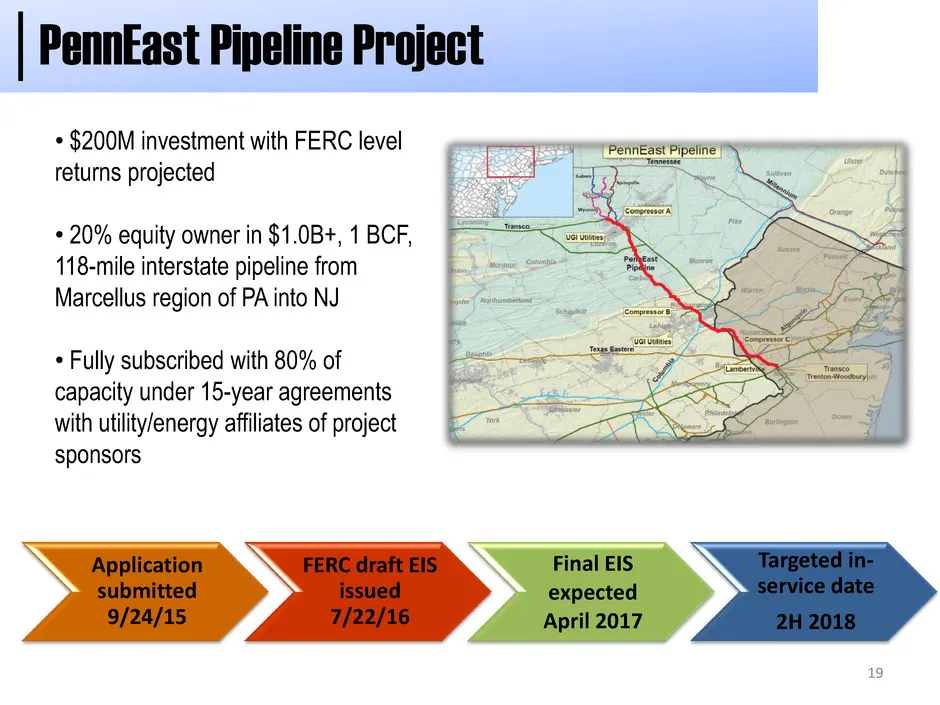
19 PennEast Pipeline Project • $200M investment with FERC level returns projected • 20% equity owner in $1.0B+, 1 BCF, 118-mile interstate pipeline from Marcellus region of PA into NJ • Fully subscribed with 80% of capacity under 15-year agreements with utility/energy affiliates of project sponsors
Slide 20: See
© ais See sees, Tn "See te, tn a ‘aitySustain Pip “innovati Ee Bay ‘Community FesponaibleGommunity Sie ge. urage Uulity Moje “Infrastructure stteg Seibibeion Aaity Goan Batter oe Ur cg Grawth Configence Ls rene, ‘ieee. ExeellenceFamily Cont Sal ENG Fa lveecawabgsn sia value sustain era aly Settee Gr
Source: SEC EDGAR · 8-K filed Mar 2, 2017
More decks from South Jersey Industries Inc
 FY2021 Earnings Presentation29 slides · Feb 24, 2022
 Q3 2021 Earnings Presentation31 slides · Nov 3, 2021
 Q2 2021 Earnings Presentation31 slides · Aug 4, 2021
 Investor Day (May 2021)88 slides · May 6, 2021
 FY2020 Earnings Presentation31 slides · Feb 24, 2021
 Q3 2020 Earnings Presentation37 slides · Nov 4, 2020