Comerica — Comerica Inc /New/ — Goldman Sachs US Financial Services Conference 2011
36 slides from Comerica's conference presentation, Dec 2, 2011
Slide 1: Comerica Incorporated Goldman Sachs US Financial Services Conference
Comerica Incorporated Goldman Sachs US Financial Services Conference December 6-7, 2011 Lars Anderson Vice Chairman, The Business Bank Ralph Babb Chairman and CEO Karen Parkhill Vice Chairman and CFO
Slide 2: Safe Harbor Statement
Safe Harbor Statement Any statements in this presentation that are not historical facts are forward-looking statements as defined in the Private Securities Litigation Reform Act of 1995. Words such as “anticipates,” “believes,” “feels,” “expects,” “estimates,” “seeks,” “strives,” “plans,” “intends,”
Slide 3: Comerica: A Brief Overview
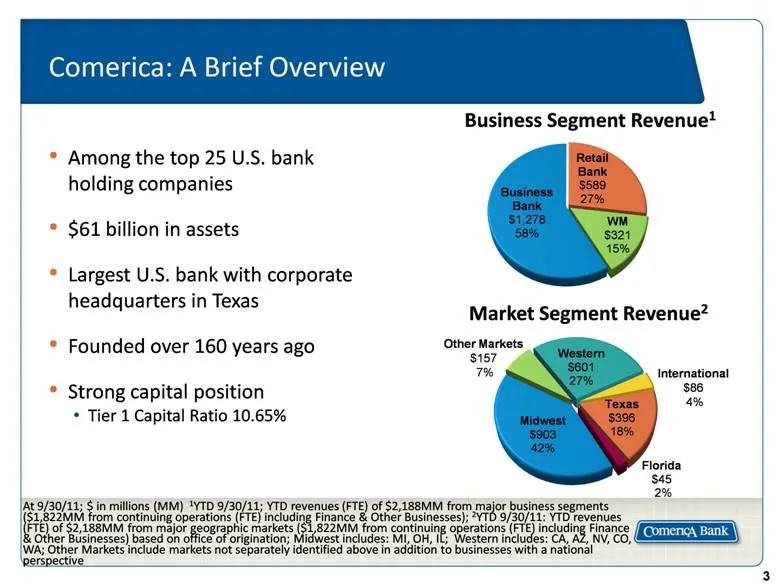
Comerica: A Brief Overview Among the top 25 U.S. bank holding companies $61 billion in assets Largest U.S. bank with corporate headquarters in Texas Founded over 160 years ago Strong capital position Tier 1 Capital Ratio 10.65% Business Segment Revenue1 Market Segment Revenue2 International $86 4% O
Slide 4: Our Core Businesses & Geographies
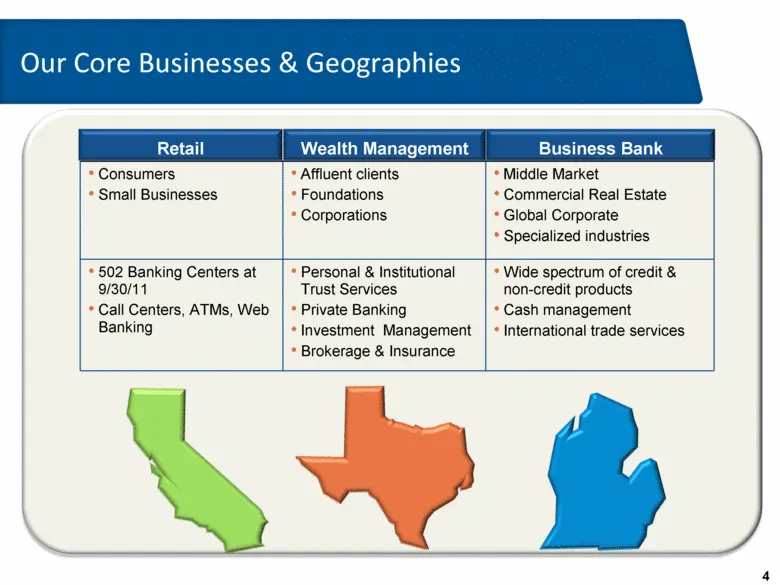
Our Core Businesses & Geographies Consumers Small Businesses Affluent clients Foundations Corporations Middle Market Commercial Real Estate Global Corporate Specialized industries 502 Banking Centers at 9/30/11 Call Centers, ATMs, Web Banking Personal & Institutional Trust Services Private Banking I
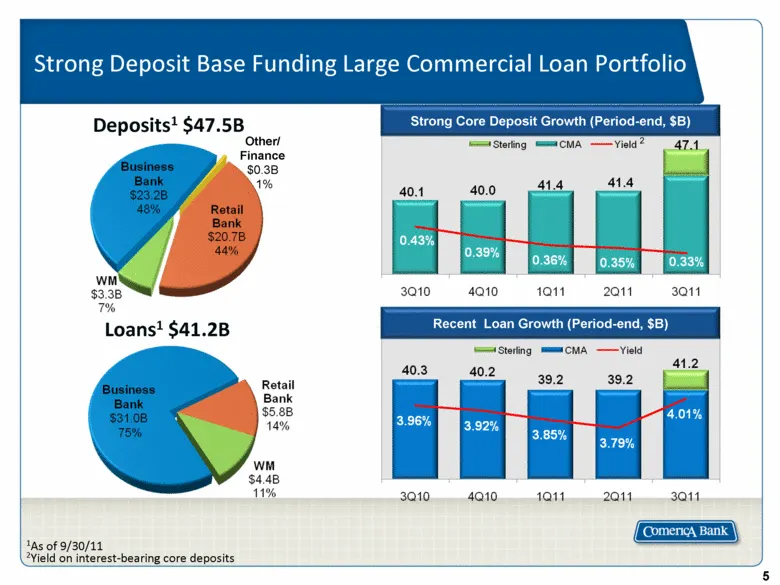
Slide 5: Strong Deposit Base Funding Large Commercial Loan Portfolio
Strong Deposit Base Funding Large Commercial Loan Portfolio Deposits1 $47.5B Other/ Finance $0.3B 1% Loans1 $41.2B 1As of 9/30/11 2Yield on interest-bearing core deposits Recent Loan Growth (Period-end, $B) Strong Core Deposit Growth (Period-end, $B) 2
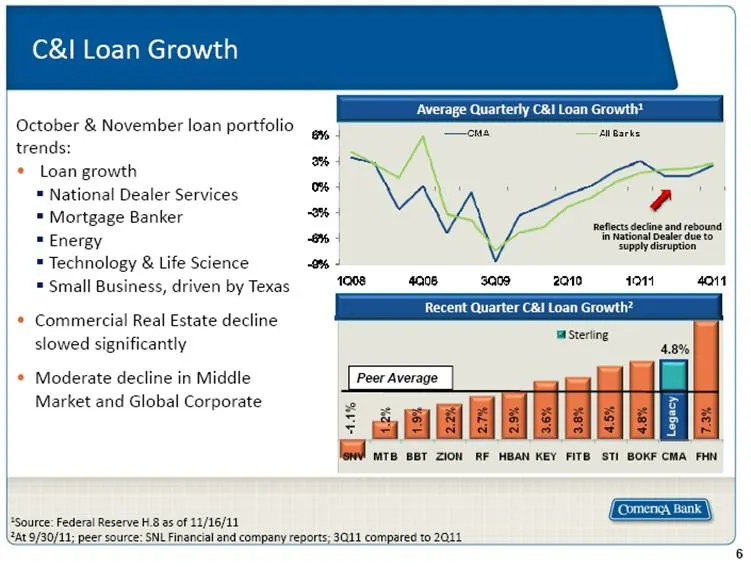
Slide 6: Loan Growth Outpacing Peers in Third Quarter
Loan Growth Outpacing Peers in Third Quarter 1Source: Federal Reserve H.8 as of 11/16/11 2At 9/30/11; peer source: SNL Financial and company reports; 3Q11 compared to 2Q11 Average Quarterly C&I Loan Growth1 Reflects decline and rebound in National Dealer due to supply disruption 2 Recent Quarter C&I
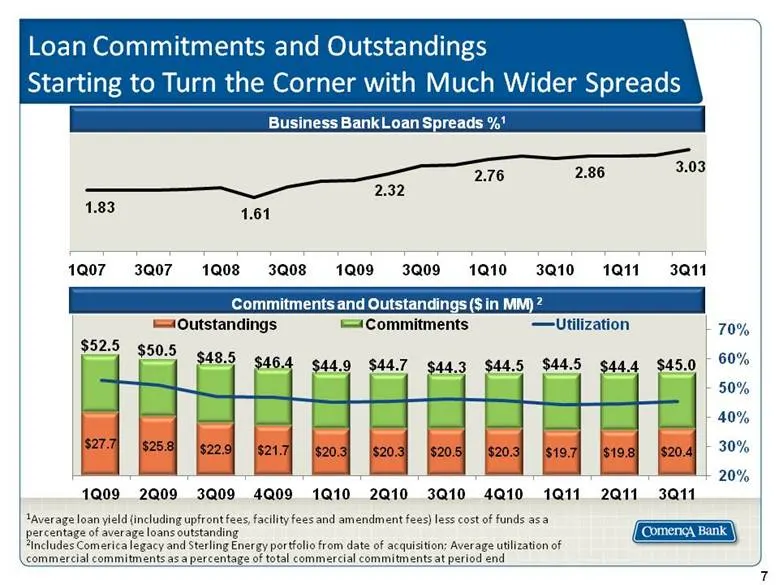
Slide 7: Loan Commitments and Outstandings Starting to Turn the Corner with Much Wider Spreads
Loan Commitments and Outstandings Starting to Turn the Corner with Much Wider Spreads Commitments and Outstandings ($ in MM) 2 1Average loan yield (including upfront fees, facility fees and amendment fees) less cost of funds as a percentage of average loans outstanding 2Includes Comerica legacy and
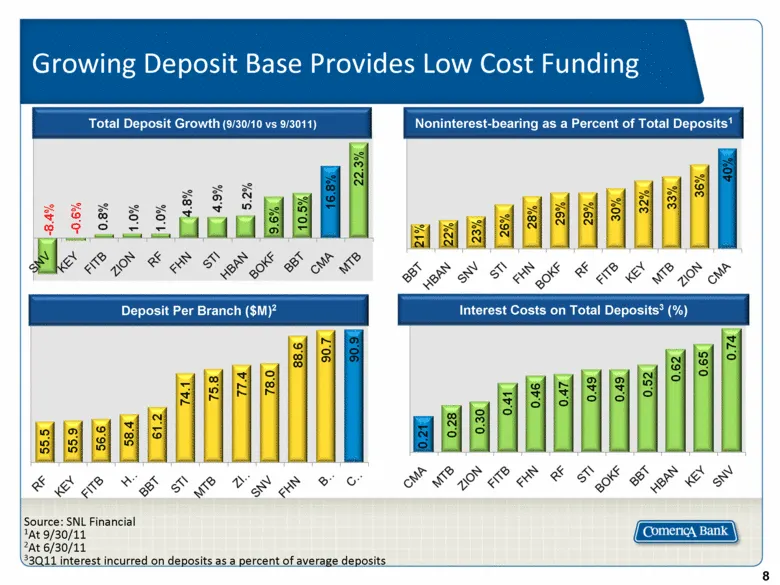
Slide 8: Growing Deposit Base Provides Low Cost Funding
Growing Deposit Base Provides Low Cost Funding Noninterest-bearing as a Percent of Total Deposits1 Total Deposit Growth (9/30/10 vs 9/3011) Interest Costs on Total Deposits3 (%) Deposit Per Branch ($M)2 Source: SNL Financial 1At 9/30/11 2At 6/30/11 33Q11 interest incurred on deposits as a percent of
Slide 9: Revenue Growth in a Low Rate Environment
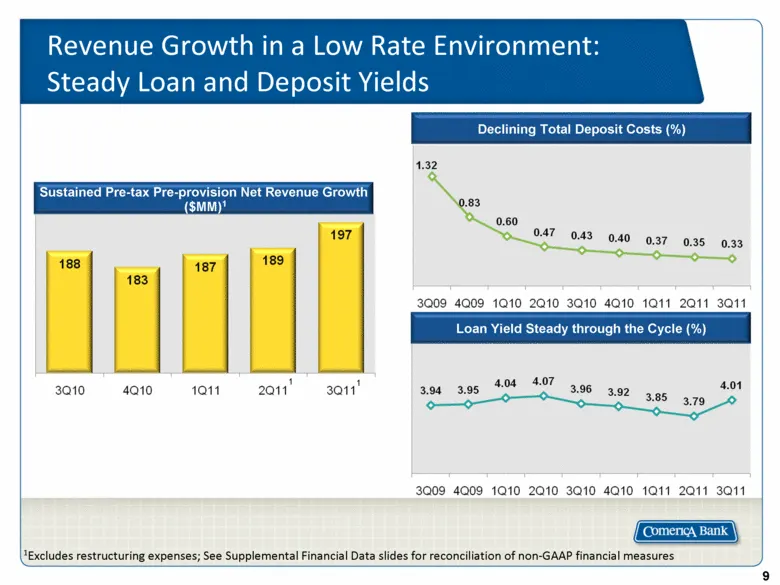
Revenue Growth in a Low Rate Environment: Steady Loan and Deposit Yields Declining Total Deposit Costs (%) Loan Yield Steady through the Cycle (%) Sustained Pre-tax Pre-provision Net Revenue Growth ($MM)1 1 1 1Excludes restructuring expenses; See Supplemental Financial Data slides for reconciliation
Slide 10: Remain Focused on Commercial Relationships in Geographic Footprint
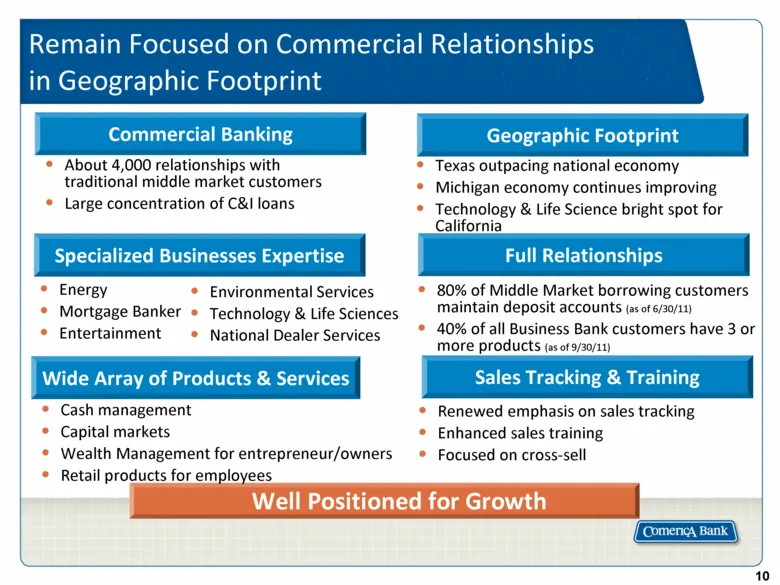
Energy Mortgage Banker Entertainment Remain Focused on Commercial Relationships in Geographic Footprint Texas outpacing national economy Michigan economy continues improving Technology & Life Science bright spot for California Renewed emphasis on sales tracking Enhanced sales training Focused on cro
Slide 11: Focus: National Dealer Services
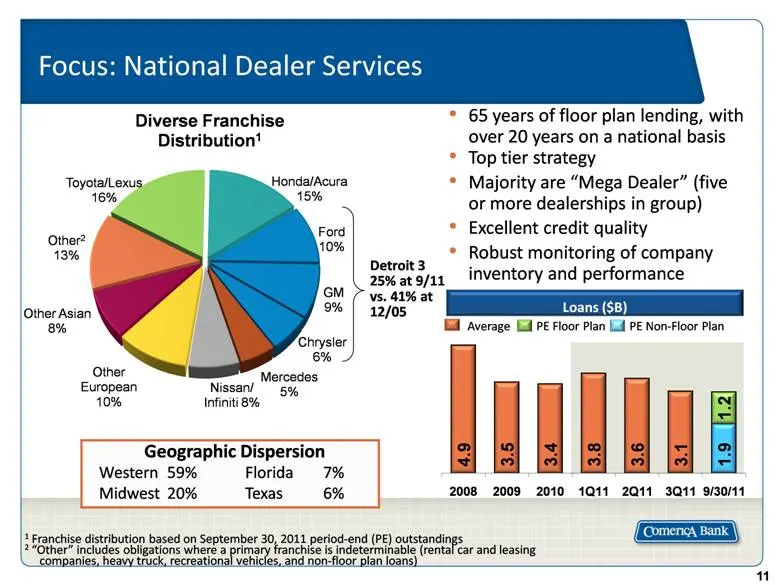
Focus: National Dealer Services Detroit 3 25% at 9/11 vs. 41% at 12/05 Geographic Dispersion Western 59% Florida 7% Midwest 20% Texas 6% 1 Franchise distribution based on September 30, 2011 period-end (PE) outstandings 2 “Other” includes obligations where a primary franchise is indeterminable (renta
Slide 12: Focus: Mortgage Banker Finance
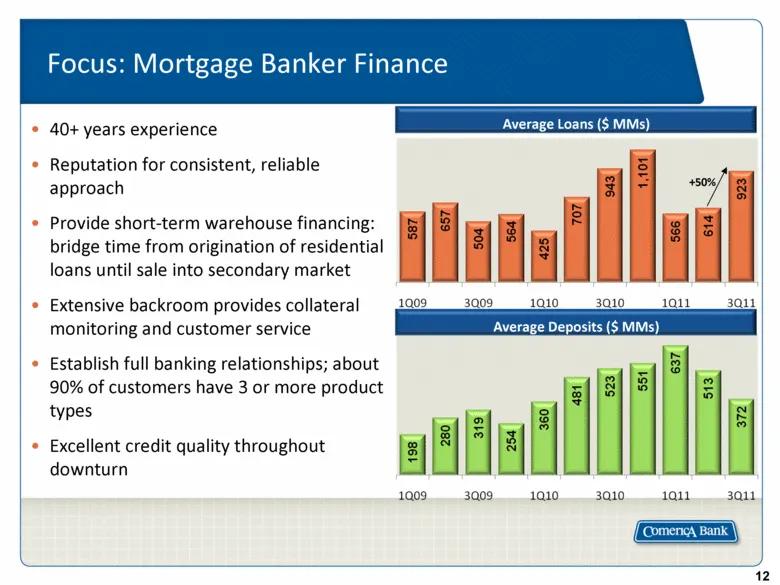
Focus: Mortgage Banker Finance 40+ years experience Reputation for consistent, reliable approach Provide short-term warehouse financing: bridge time from origination of residential loans until sale into secondary market Extensive backroom provides collateral monitoring and customer service Establish
Slide 13: Focus: Technology and Life Science
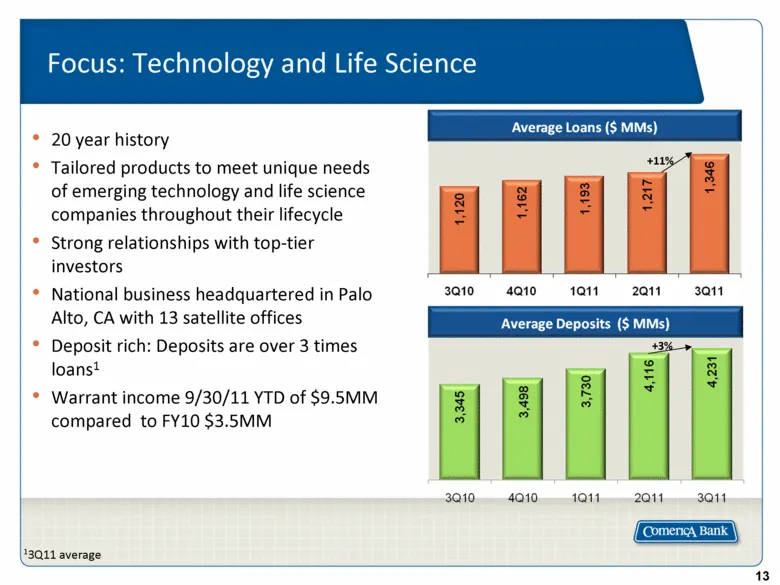
Focus: Technology and Life Science 20 year history Tailored products to meet unique needs of emerging technology and life science companies throughout their lifecycle Strong relationships with top-tier investors National business headquartered in Palo Alto, CA with 13 satellite offices Deposit rich:
Slide 14: Focus: Energy
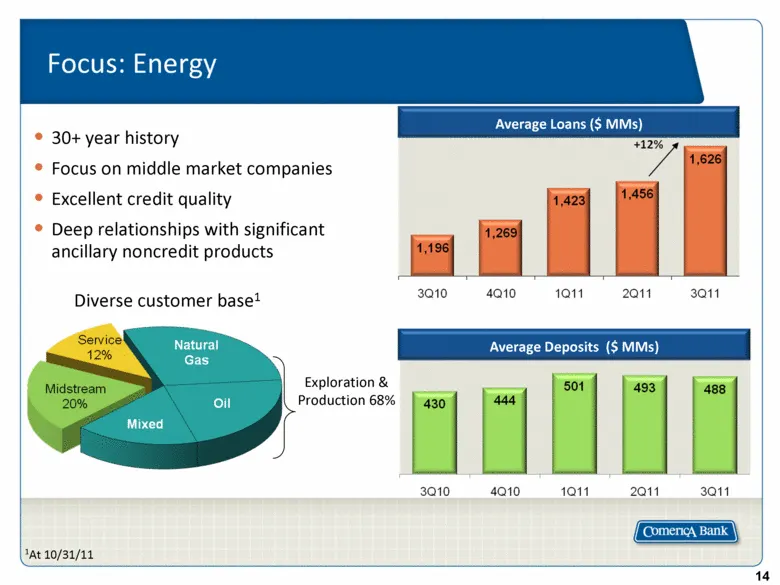
Focus: Energy 30+ year history Focus on middle market companies Excellent credit quality Deep relationships with significant ancillary noncredit products Exploration & Production 68% 1At 10/31/11 Average Loans ($ MMs) Average Deposits ($ MMs) Diverse customer base1
Slide 15: A Leaner, More Efficient Company
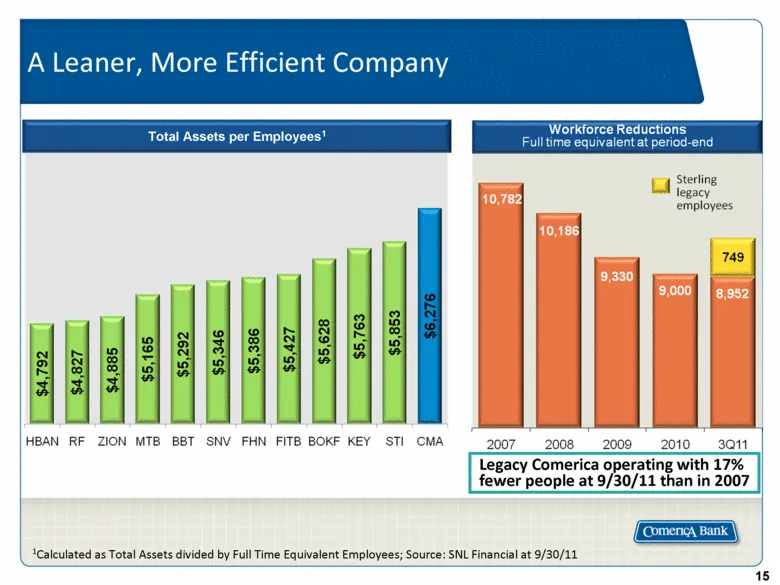
A Leaner, More Efficient Company 1Calculated as Total Assets divided by Full Time Equivalent Employees; Source: SNL Financial at 9/30/11 Legacy Comerica operating with 17% fewer people at 9/30/11 than in 2007 Total Assets per Employees1
Slide 16: Sterling Acquisition: Focused on Integration and Delivering Results
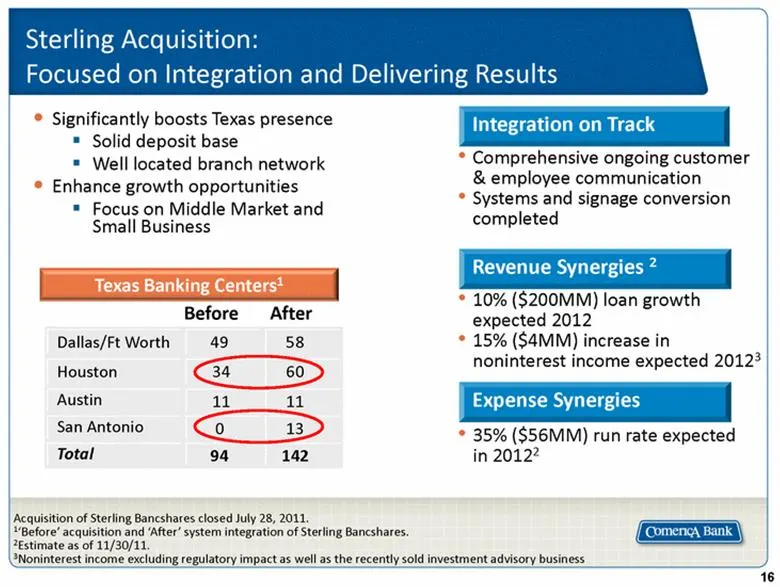
Sterling Acquisition: Focused on Integration and Delivering Results Comprehensive ongoing customer & employee communication Systems and signage conversion completed 10% ($200MM) loan growth expected 2012 15% ($4MM) increase in noninterest income expected 20123 35% ($56MM) run rate expected in 20122
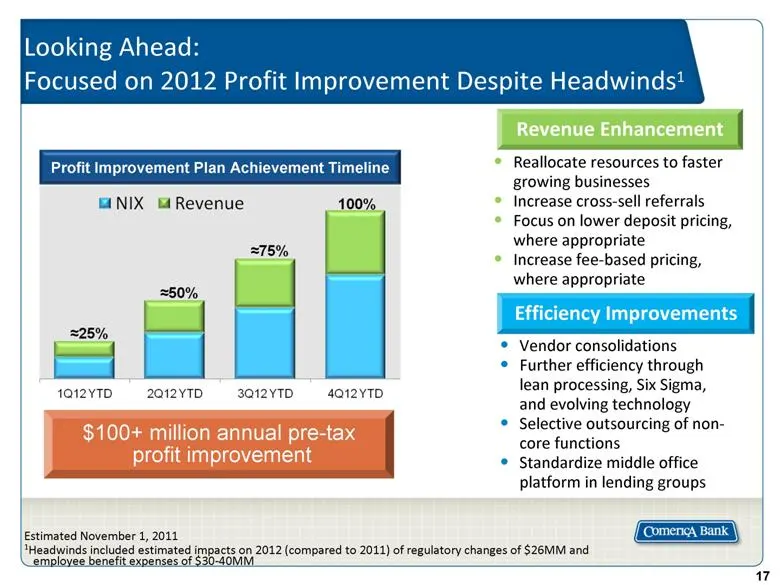
Slide 17: Looking Ahead: Focused on 2012 Profit Improvement Despite Headwinds
Looking Ahead: Focused on 2012 Profit Improvement Despite Headwinds1 Reallocate resources to faster growing businesses Increase cross-sell referrals Focus on lower deposit pricing, where appropriate Increase fee-based pricing, where appropriate Vendor consolidations Further efficiency through lean p
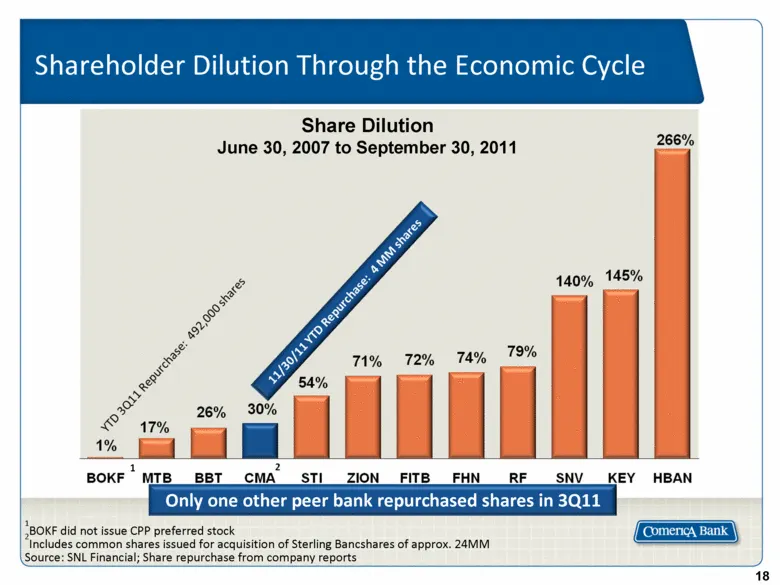
Slide 18: Share Dilution June 30, 2007 to September 30, 2011
Share Dilution June 30, 2007 to September 30, 2011 1BOKF did not issue CPP preferred stock 2Includes common shares issued for acquisition of Sterling Bancshares of approx. 24MM Source: SNL Financial; Share repurchase from company reports Shareholder Dilution Through the Economic Cycle 1 Only one oth
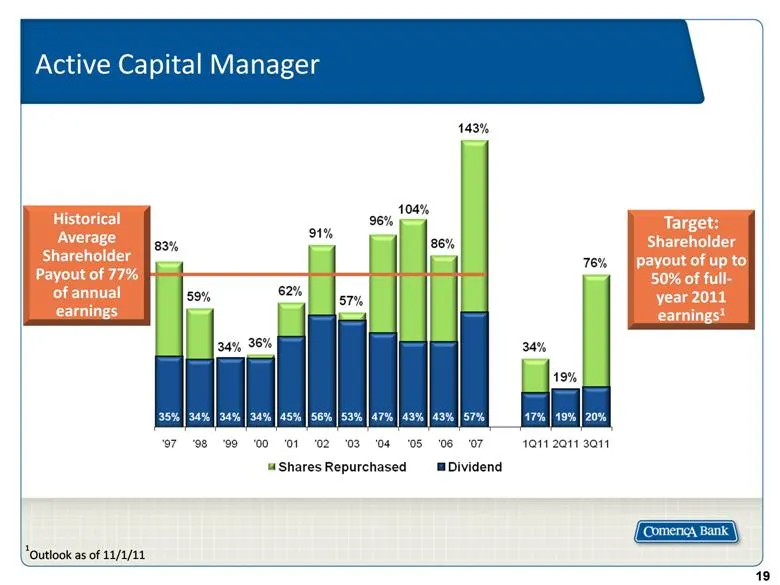
Slide 19: Active Capital Manager
Active Capital Manager Target: Shareholder payout of up to 50% of full-year 2011 earnings1 Historical Average Shareholder Payout of 77% of annual earnings 1Outlook as of 11/1/11
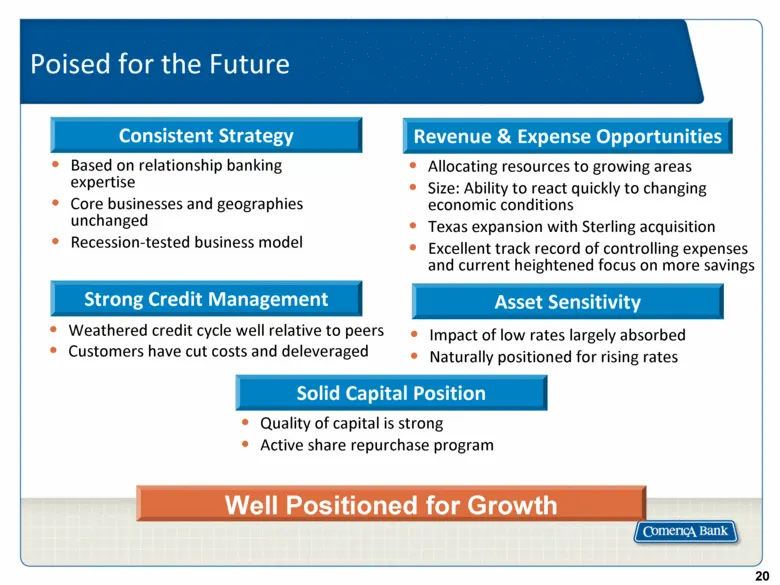
Slide 20: Poised for the Future
Poised for the Future Well Positioned for Growth Consistent Strategy Solid Capital Position Revenue & Expense Opportunities Based on relationship banking expertise Core businesses and geographies unchanged Recession-tested business model Quality of capital is strong Active share repurchase program A

Slide 21: Appendix
Appendix ComenicA Bank
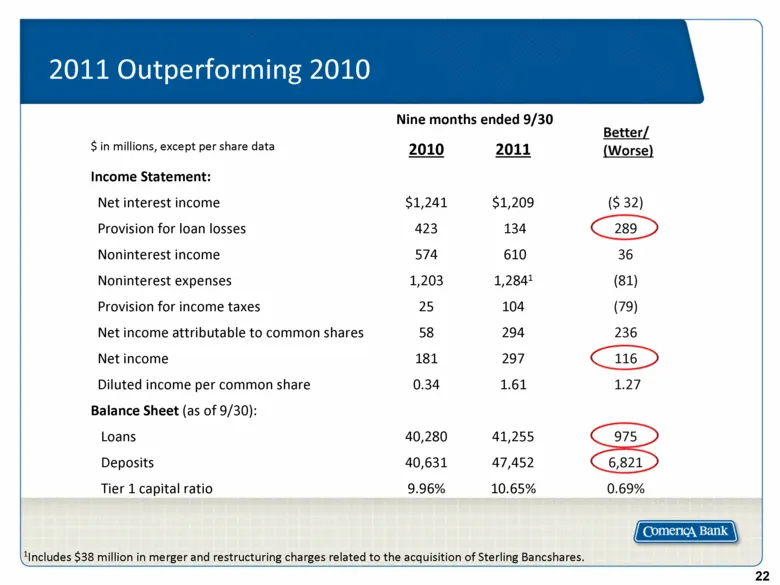
Slide 22: 2011 Outperforming 2010
Nine months ended 9/30 Better/(Worse) $ in millions, except per share data 2010 2011 Income Statement: Net interest income $1,241 $1,209 ($ 32) Provision for loan losses 423 134 289 Noninterest income 574 610 36 Noninterest expenses 1,203 1,2841 (81) Provision for income taxes 25 104 (79) Net income
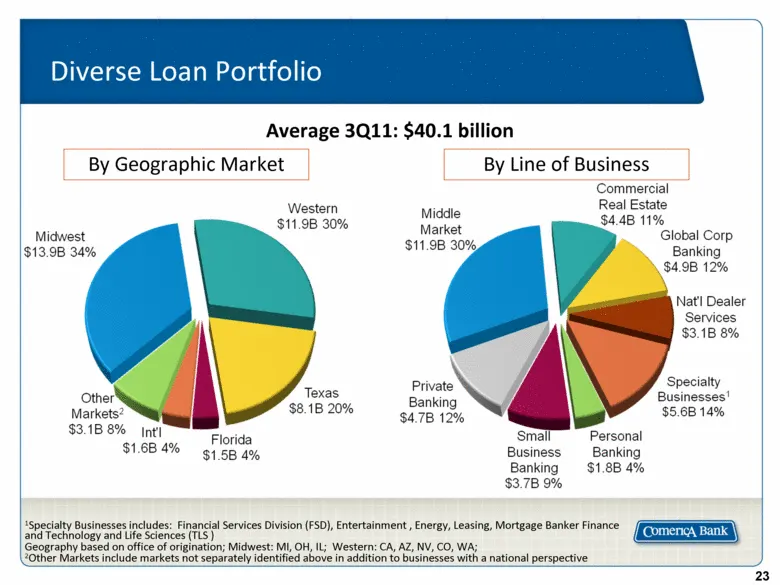
Slide 23: Diverse Loan Portfolio
Diverse Loan Portfolio 1Specialty Businesses includes: Financial Services Division (FSD), Entertainment , Energy, Leasing, Mortgage Banker Finance and Technology and Life Sciences (TLS ) Geography based on office of origination; Midwest: MI, OH, IL; Western: CA, AZ, NV, CO, WA; 2Other Markets includ
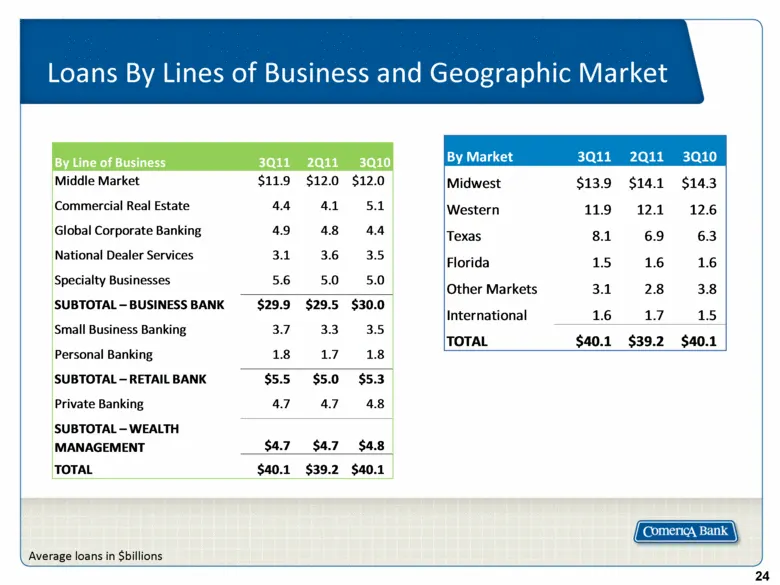
Slide 24: Loans By Lines of Business and Geographic Market
Loans By Lines of Business and Geographic Market Average loans in $billions By Market 3Q11 2Q11 3Q10 Midwest $13.9 $14.1 $14.3 Western 11.9 12.1 12.6 Texas 8.1 6.9 6.3 Florida 1.5 1.6 1.6 Other Markets 3.1 2.8 3.8 International 1.6 1.7 1.5 TOTAL $40.1 $39.2 $40.1 By Line of Business 3Q11 2Q11 3Q10 M
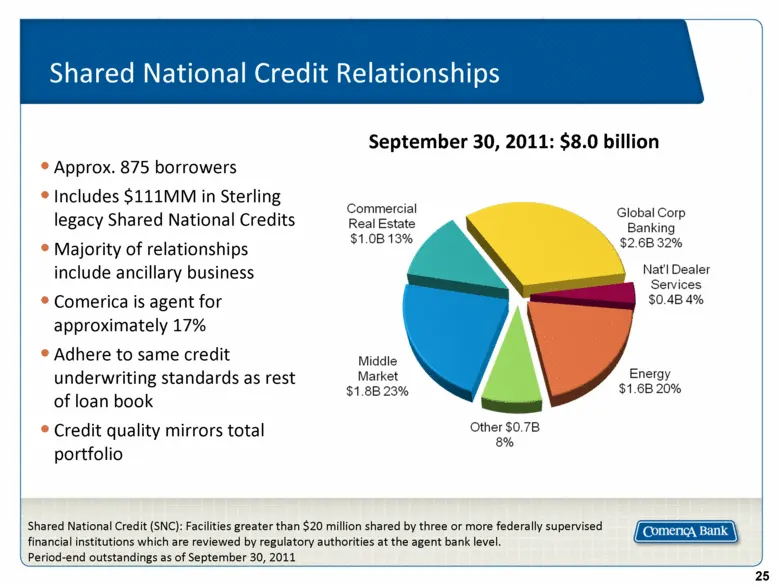
Slide 25: Shared National Credit Relationships
Shared National Credit Relationships Approx. 875 borrowers Includes $111MM in Sterling legacy Shared National Credits Majority of relationships include ancillary business Comerica is agent for approximately 17% Adhere to same credit underwriting standards as rest of loan book Credit quality mirrors
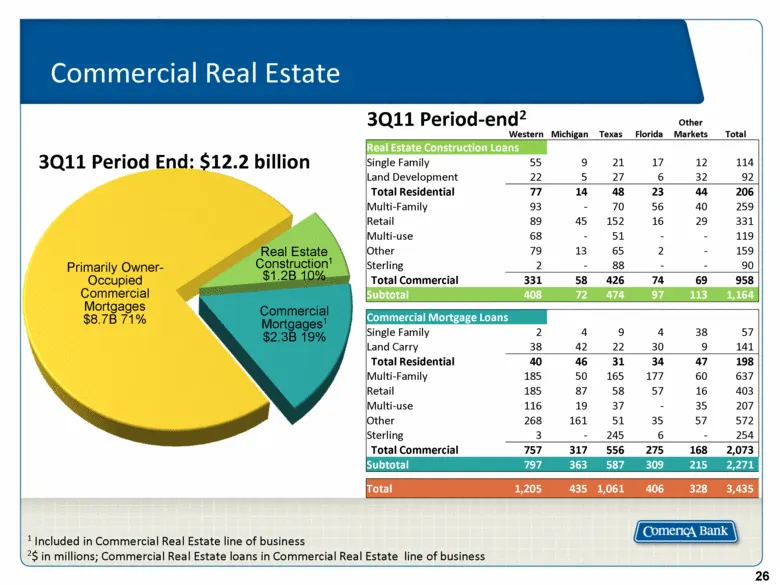
Slide 26: Commercial Real Estate Loans
Western Michigan Texas Florida Other Markets Total Real Estate Construction Loans Single Family 55 9 21 17 12 114 Land Development 22 5 27 6 32 92 Total Residential 77 14 48 23 44 206 Multi-Family 93 - 70 56 40 259 Retail 89 45 152 16 29 331 Multi-use 68 - 51 - - 119 Other 79 13 65 2 - 159 Sterling
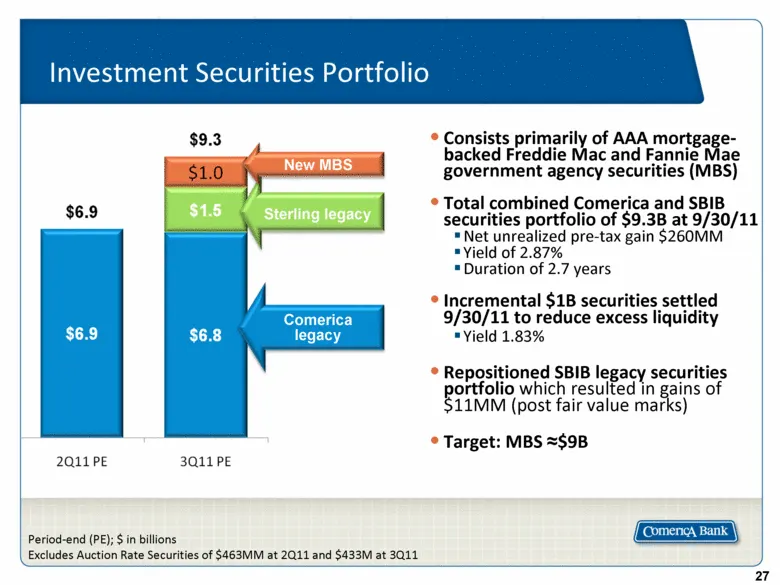
Slide 27: Investment Securities Portfolio
Investment Securities Portfolio Consists primarily of AAA mortgage-backed Freddie Mac and Fannie Mae government agency securities (MBS) Total combined Comerica and SBIB securities portfolio of $9.3B at 9/30/11 Net unrealized pre-tax gain $260MM Yield of 2.87% Duration of 2.7 years Incremental $1B se
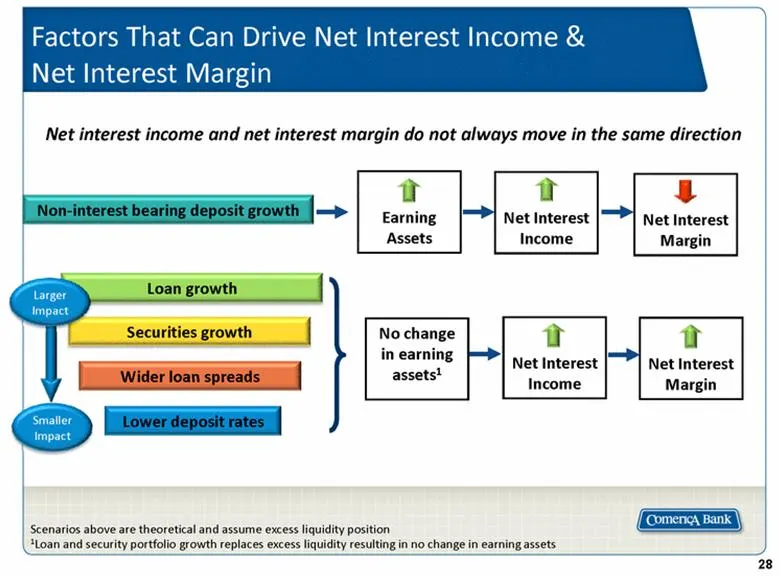
Slide 28: Factors That Can Drive Net Interest Income & Net Interest Margin
Loan growth Non-interest bearing deposit growth Net Interest Income Factors That Can Drive Net Interest Income & Net Interest Margin Net interest income and net interest margin do not always move in the same direction Securities growth Wider loan spreads Lower deposit rates No change in earning asse
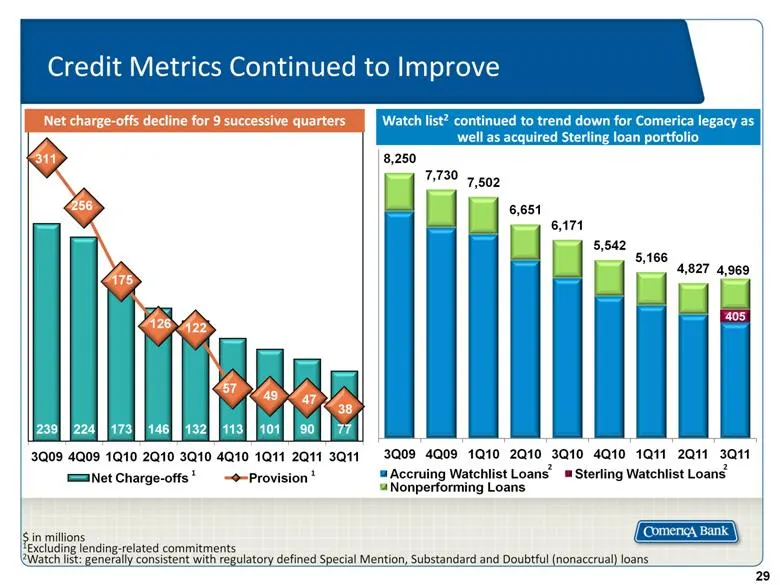
Slide 29: Credit Metrics Continued to Improve
Credit Metrics Continued to Improve $ in millions 1Excluding lending-related commitments 2Watch list: generally consistent with regulatory defined Special Mention, Substandard and Doubtful (nonaccrual) loans Watch list2 continued to trend down for Comerica legacy as well as acquired Sterling loan po
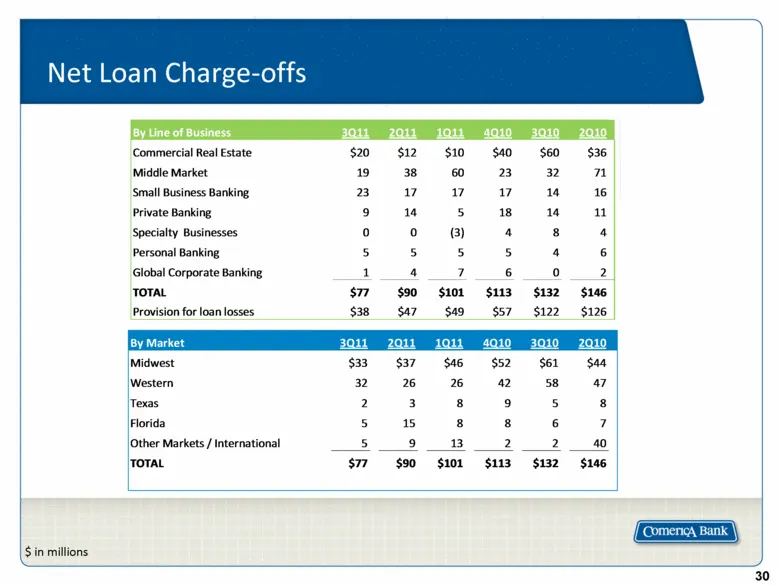
Slide 30: Net Loan Charge-offs
Net Loan Charge-offs $ in millions By Line of Business 3Q11 2Q11 1Q11 4Q10 3Q10 2Q10 Commercial Real Estate $20 $12 $10 $40 $60 $36 Middle Market 19 38 60 23 32 71 Small Business Banking 23 17 17 17 14 16 Private Banking 9 14 5 18 14 11 Specialty Businesses 0 0 (3) 4 8 4 Personal Banking 5 5 5 5 4 6
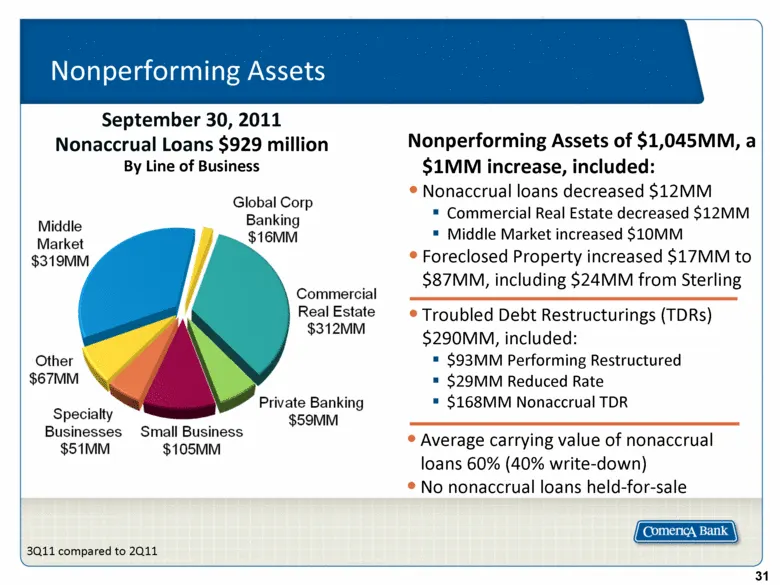
Slide 31: Nonperforming Assets
Average carrying value of nonaccrual loans 60% (40% write-down) No nonaccrual loans held-for-sale 3Q11 compared to 2Q11 Nonperforming Assets Nonperforming Assets of $1,045MM, a $1MM increase, included: Nonaccrual loans decreased $12MM Commercial Real Estate decreased $12MM Middle Market increased $1
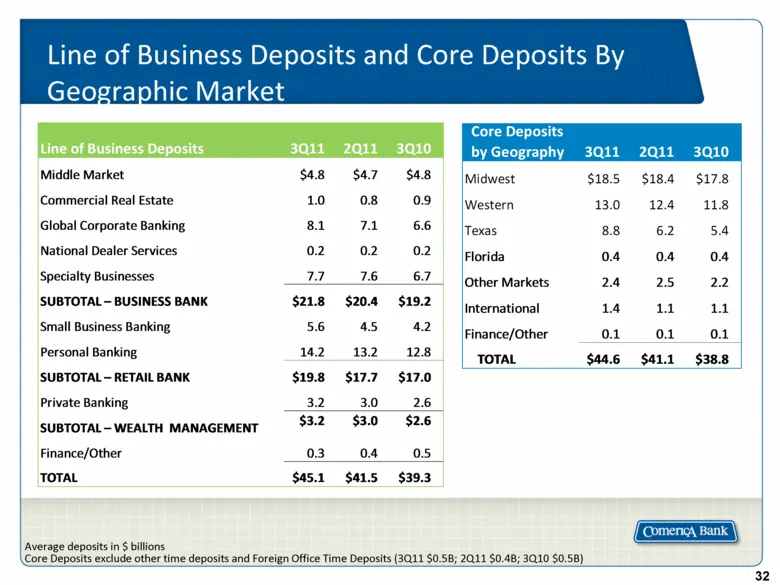
Slide 32: Line of Business Deposits and Core Deposits
Line of Business Deposits and Core Deposits By Geographic Market Average deposits in $ billions Core Deposits exclude other time deposits and Foreign Office Time Deposits (3Q11 $0.5B; 2Q11 $0.4B; 3Q10 $0.5B) Line of Business Deposits 3Q11 2Q11 3Q10 Middle Market $4.8 $4.7 $4.8 Commercial Real Estate
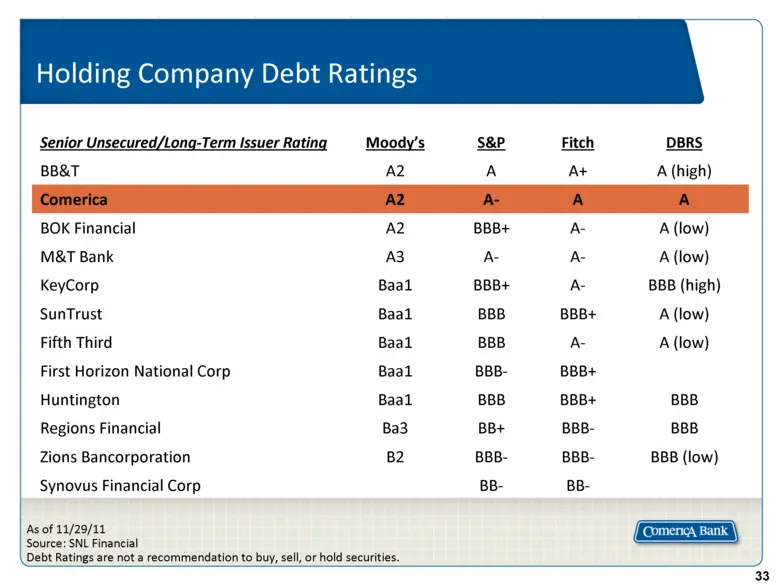
Slide 33: Senior Unsecured/Long-Term Issuer Rating
Senior Unsecured/Long-Term Issuer Rating Moody’s S&P Fitch DBRS BB&T A2 A A+ A (high) Comerica A2 A- A A BOK Financial A2 BBB+ A- A (low) M&T Bank A3 A- A- A (low) KeyCorp Baa1 BBB+ A- BBB (high) SunTrust Baa1 BBB BBB+ A (low) Fifth Third Baa1 BBB A- A (low) First Horizon National Corp Baa1 BBB- BBB
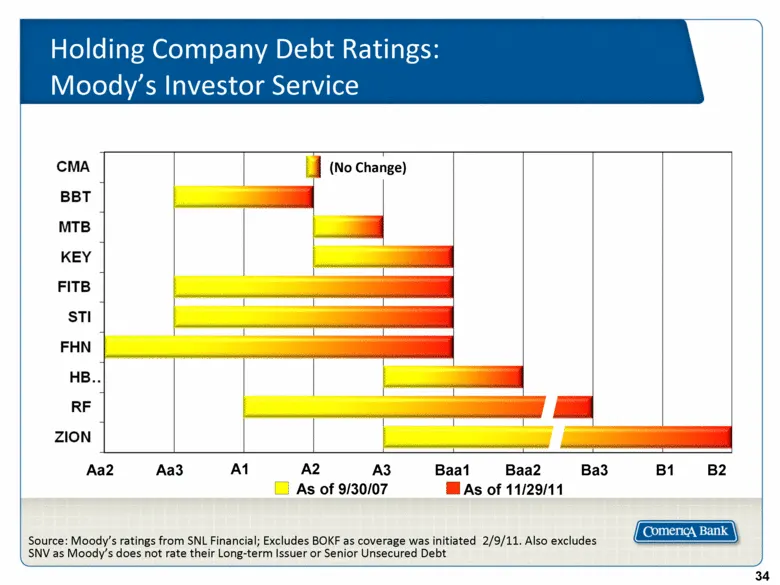
Slide 34: Holding Company Debt Ratings: Moody's Investor Service
Holding Company Debt Ratings: Moody’s Investor Service Aa2 A2 A3 Baa1 Baa2 Ba3 B2 A1 As of 11/29/11 As of 9/30/07 (No Change) Aa3 B1 Source: Moody’s ratings from SNL Financial; Excludes BOKF as coverage was initiated 2/9/11. Also excludes SNV as Moody’s does not rate their Long-term Issuer or Senior
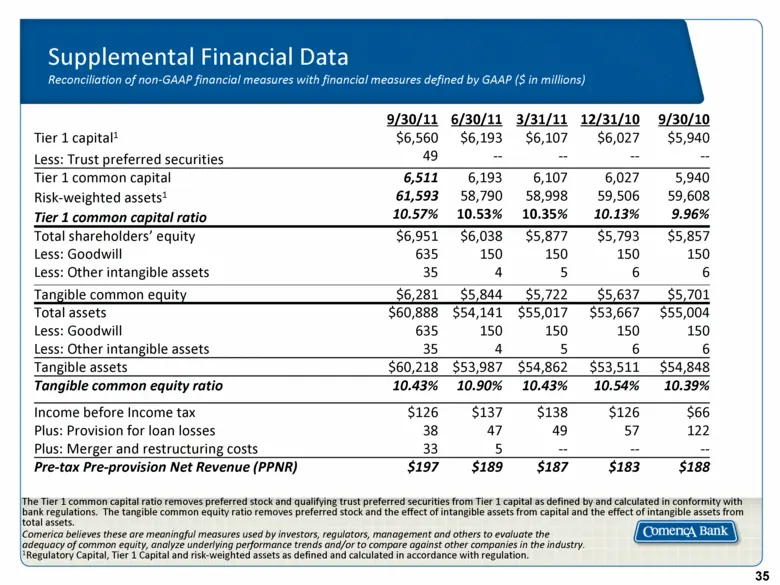
Slide 35: Supplemental Financial Data
Supplemental Financial Data Reconciliation of non-GAAP financial measures with financial measures defined by GAAP ($ in millions) The Tier 1 common capital ratio removes preferred stock and qualifying trust preferred securities from Tier 1 capital as defined by and calculated in conformity with bank

Slide 36: [LOGO]
[LOGO]
Source: SEC EDGAR · 8-K filed Dec 2, 2011
More decks from Comerica Incorporated
 Goldman Sachs Financial Services Conference 202520 slides · Dec 11, 2025
 Merger or Acquisition (October 2025)18 slides · Oct 6, 2025
 Barclays Global Financial Services Conference 202524 slides · Sep 8, 2025
 Q2 2025 Earnings Presentation24 slides · Jul 18, 2025
 Q1 2025 Earnings Presentation21 slides · Apr 21, 2025
 Q4 2024 Earnings Presentation24 slides · Jan 22, 2025