SVB Financial — Investor Day (February 2012)
155 slides from SVB Financial's investor day presentation, Feb 15, 2012

Slide 1: Investor Day
February 15, 2012 INVESTOR DAY SVB Financial Group Exhibit 99.1 February 15, 2012 INVESTOR DAY SVB Financial Group

Slide 2: Overview and Strategy
Overview and Strategy Greg Becker President & CEO February 15, 2012 2 Overview and Strategy

Slide 3: Safe Harbor Disclosure
Safe Harbor Disclosure › The presentations made at today’s meeting contain projections or other forward- looking statements regarding management’s expectations about the future events or the future financial performance of the Company, as well as future economic, market and tax conditions. Forward-l

Slide 4: What We Will Cover Today
4 What We Will Cover Today What We Will Cover Today

Slide 5: What We Will Cover Today
Who we are and what we do Our recent financial performance Our growth strategy and expectations Summary and milestones for 2012 – 2015

Slide 6: Other Things We Will Cover
6 Other Things We Will Cover Other Things We Will Cover

Slide 7: The cool things our clients do
The cool things our clients do Our Mission: “Increasing our clients’ probability of success”

Slide 8: But First, A Few Introductions
8 But First, A Few Introductions… But First, A Few Introductions…
Slide 9: Who You Will Hear From Today
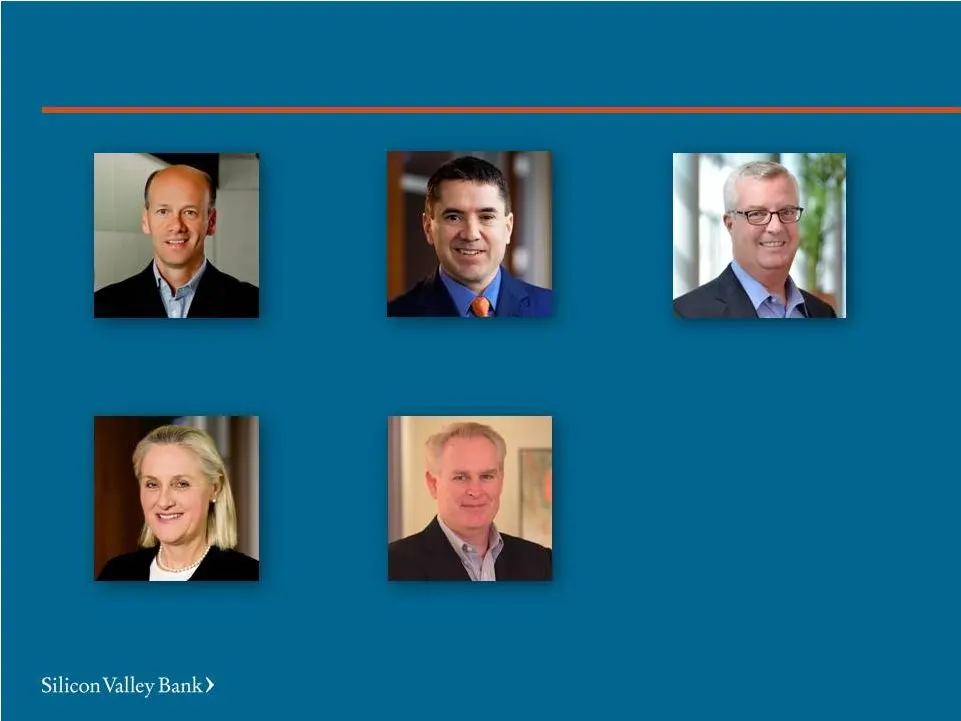
Greg Becker President & CEO Dave Jones Chief Credit Officer Joan Parsons Head of U.S. Banking Bruce Wallace Chief Operations Officer Mike Descheneaux Chief Financial Officer Who You Will Hear From Today
Slide 10: Other Members of Our Team
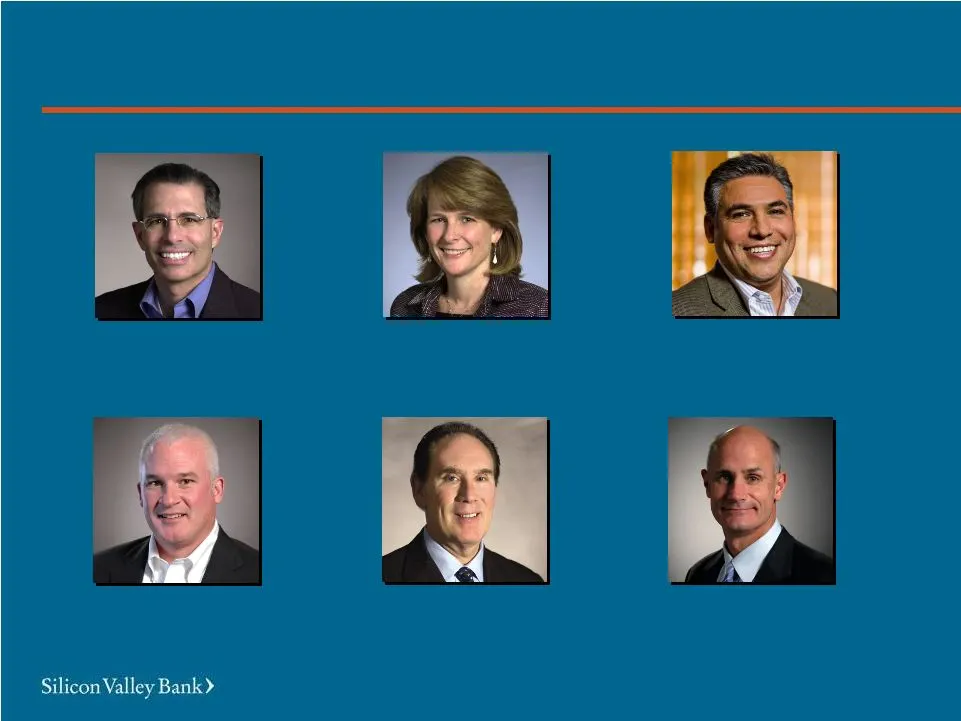
Marc Verissimo Chief Risk Officer Mary Dent General Counsel Brian Dennehy Chief Marketing Officer Chris Edmonds-Waters Head of Human Resources Harry Kellogg Vice Chairman of Silicon Valley Bank John China Head of Relationship Management Other Members of Our Team Other Members of Our Team
Slide 11: A Mix of SVB-Grown and Outside Talent
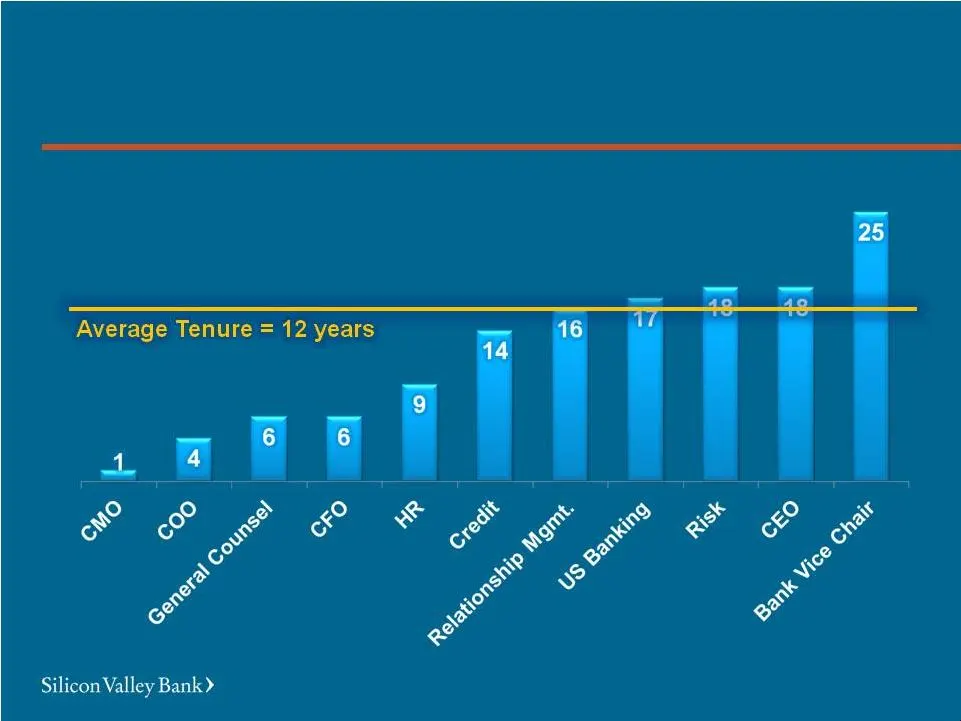
A Mix of SVB-Grown and Outside Talent A Mix of SVB-Grown and Outside Talent

Slide 12: About SVB
12 About SVB About SVB

Slide 13: Our Mission
13 Our Mission Our Mission

Slide 14: Our Mission
To increase our clients’ probability of success Build Deep Relationships Give Advice Make It Easy To Do Business With Us Solve Problems 14 To increase our clients’ probability of success

Slide 15: Our Vision
15 Our Vision Our Vision

Slide 16: Our Vision
To be the premier provider of financial services and thought leadership to innovation companies, of all sizes, and their investors, world-wide

Slide 17: Implementing Our Vision
Implementing Our Vision Right Touch Value Added Innovation and Thought Leadership Diversified Product Set Focus Inception to Infinity Global Network Implementing Our Vision

Slide 18: What Sets Us Apart?
18 What Sets Us Apart? What Sets Us Apart?

Slide 19: Differentiated
Differentiated Focus on “innovation” markets Mainly balance sheet lender Strong deposit franchise Diversified revenue streams Global reach Differentiated

Slide 20: The bank for innovation companies
bank for innovation companies More than 600 venture/ PE firm clients Global reputation Leader THE Leader

Slide 21: Established
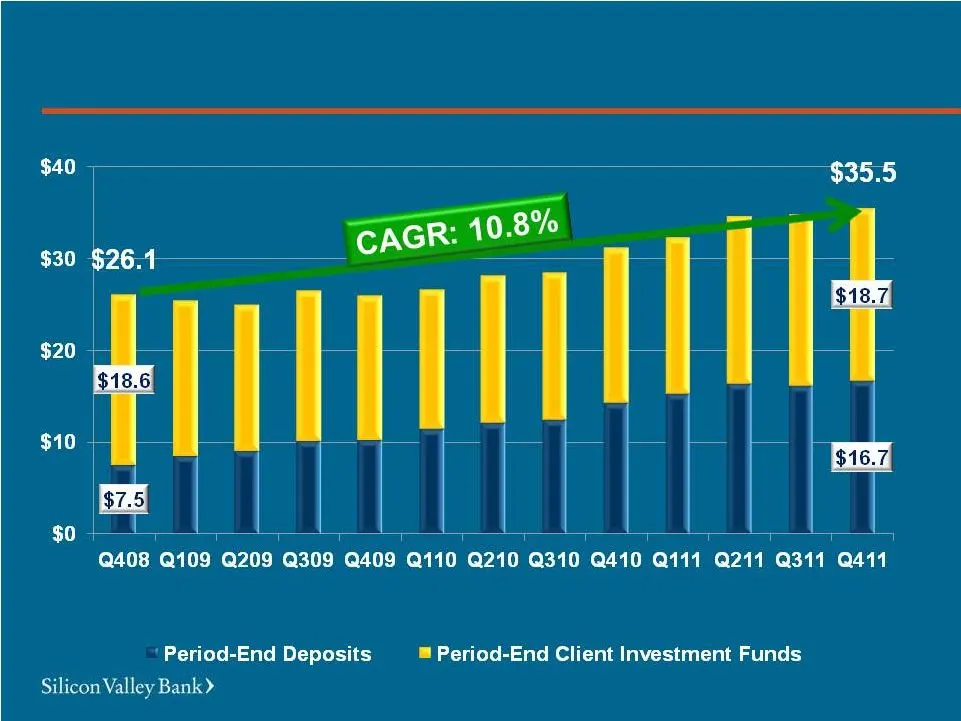
Established 30 years of supporting innovation 26 U.S. and 7 international offices $20.0 billion in total assets $35.5 billion in total client funds Established

Slide 22: A Look Back
A Look Back A Look Back
Slide 23: Our Balance Sheet Has Grown
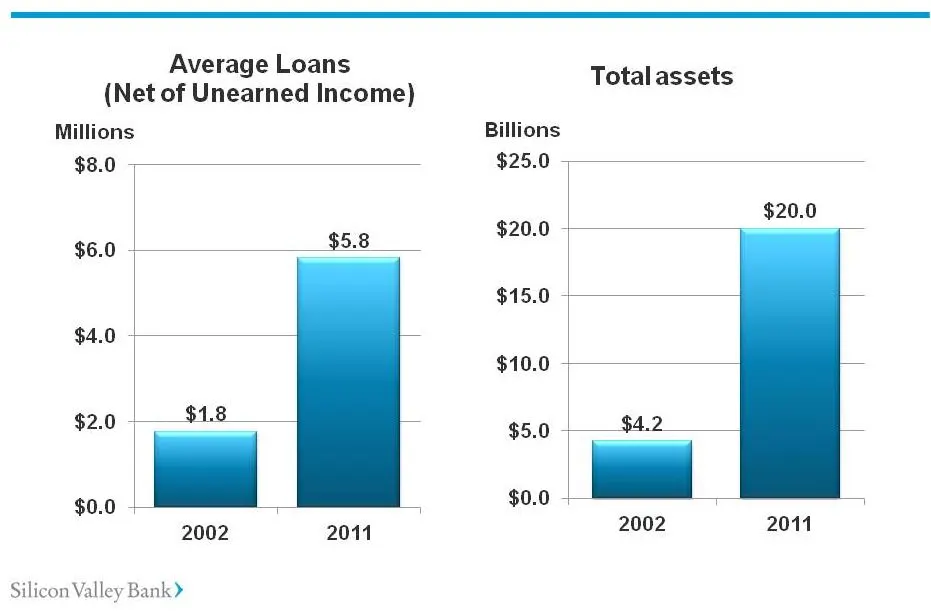
Our Balance Sheet Has Grown Our Balance Sheet Has Grown
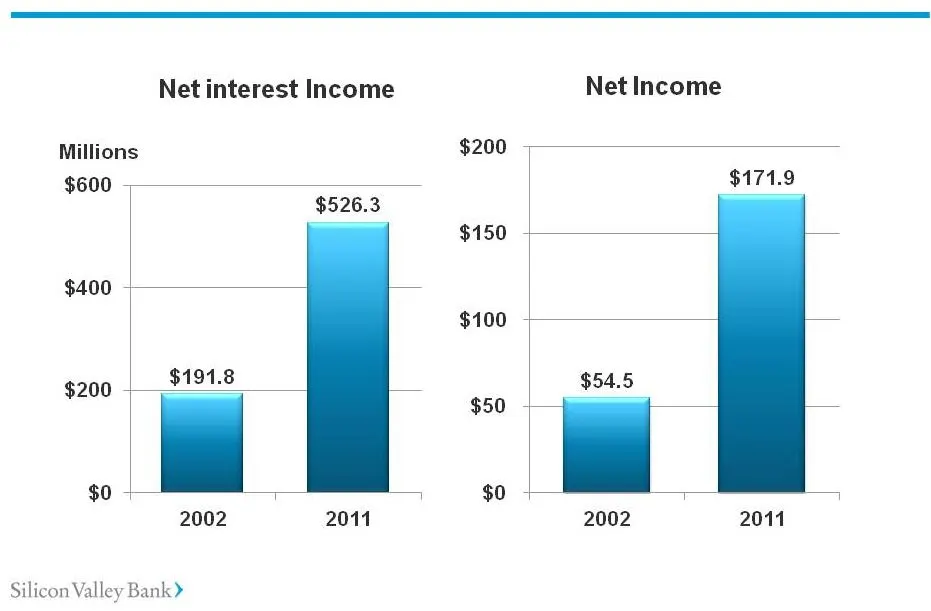
Slide 24: And Our Bottom Line Has, Too
And Our Bottom Line Has, Too And Our Bottom Line Has, Too

Slide 25: We Have Evolved
We Have Evolved… Venture backed startups Limited cash management Limited “private client services” Technology Domestic commercial banking 2002 We Have Evolved… Venture backed startups Limited cash management Limited “private client services” Technology Domestic commercial banking

Slide 26: By Focusing on What We Do Well
From start-up to $1B revenue Diversified Products & Services Dedicated Private Bank Innovation Global Banking 2011 By Focusing on What We Do Well From start-up to $1B revenue Diversified Products & Services Dedicated Private Bank Innovation Global Banking By Focusing on What We Do Well
Slide 27: Helping Clients Access Global Markets and Opportunities
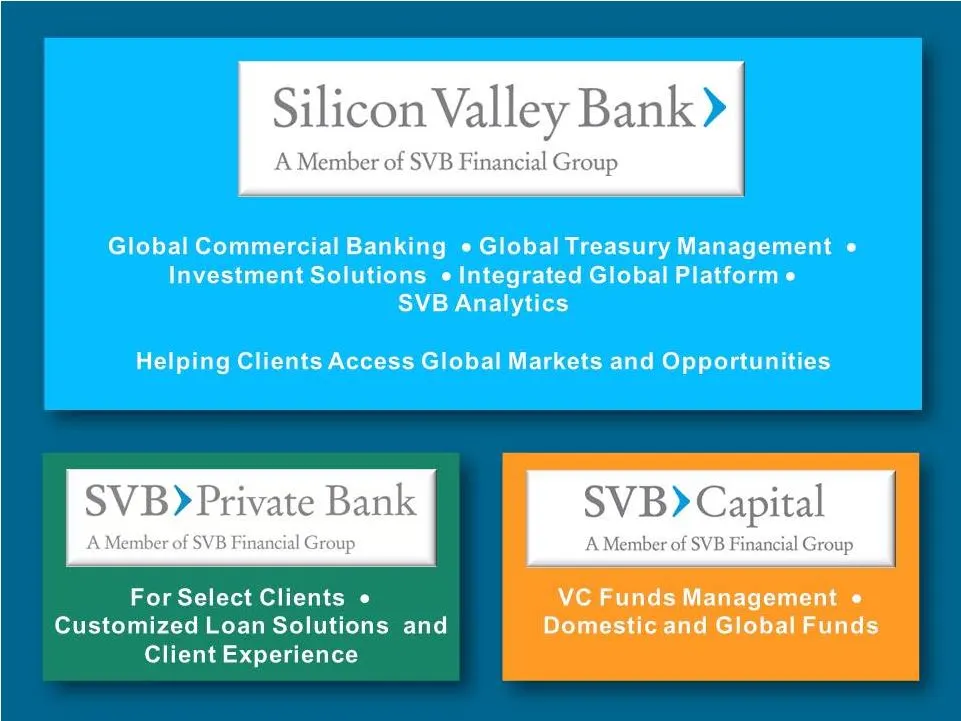
Global Commercial Banking ¢ Global Treasury Management e« Investment Solutions « Integrated Global Platform e SVB Analytics Helping Clients Access Global Markets and Opportunities For Select Clients « Customized Loan Solutions and Client Experience

Slide 28: Awards and Recognition
Awards and Recognition FORTUNE – 2012 Forbes – 2009, 2010 and 2011 Export-Import Bank of the U.S. – 2011 North Bay Business Journal Awards and Recognition Best Companies to Work For in the U.S. America’s 10 Best Banks Lender of the Year First U.S. commercial bank granted approval to open a Joint Ven

Slide 29: Who Are Our Clients?
29 Who Are Our Clients? (And What Do They Do?) Who Are Our Clients? (And What Do They Do?)

Slide 30: Client sectors
Networking Software Storage Life Science
Slide 31: Web and Social, Venture Capital and Private Equity
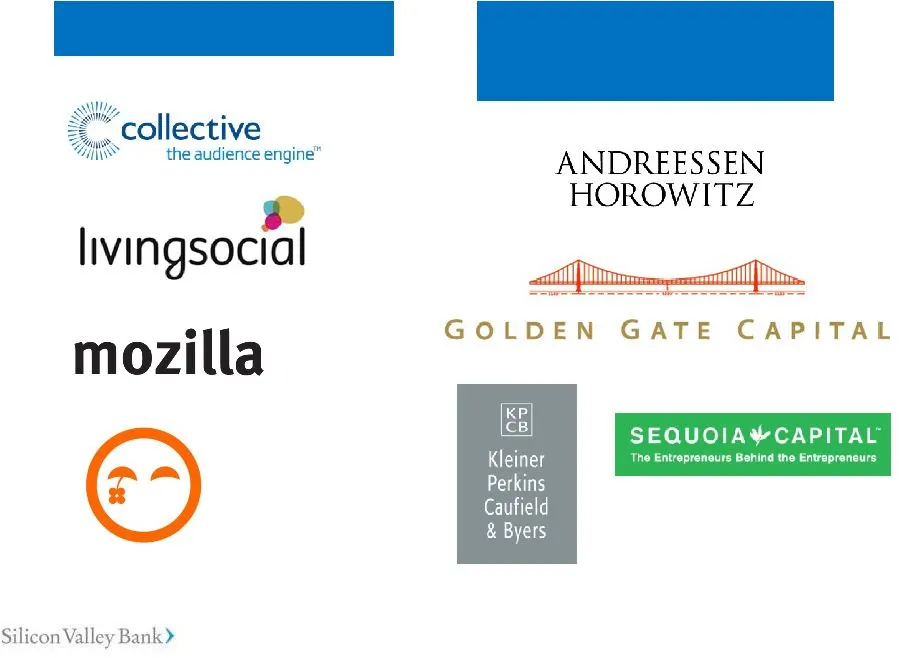
Web and Social Venture Capital and Private Equity
Slide 32: From startup to standout to global standard
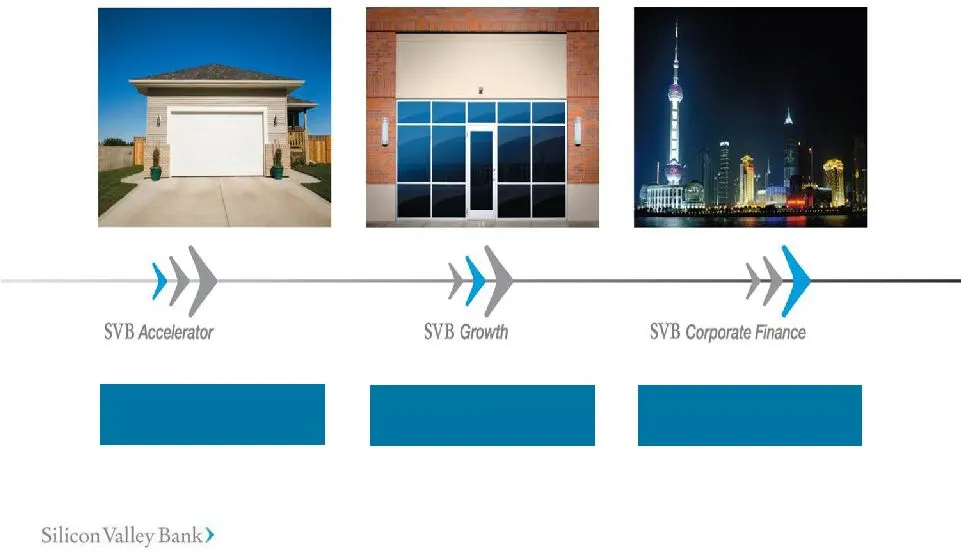
~50% Market Share <15% Market Share < 10% Market Share From startup to standout to global standard
Slide 33: What Do Our Clients Look Like?
What Do Our Clients Look Like? Growth Corporate Finance $5m $75m $75m + transition to Public Public or Private Market entry, continued R&D Global product rollout Specialized management and workforce management, risk Business risk – Private, VC-backed, Venture risk & Business Professional fully staff
Slide 34: How Do We Support Our Clients?
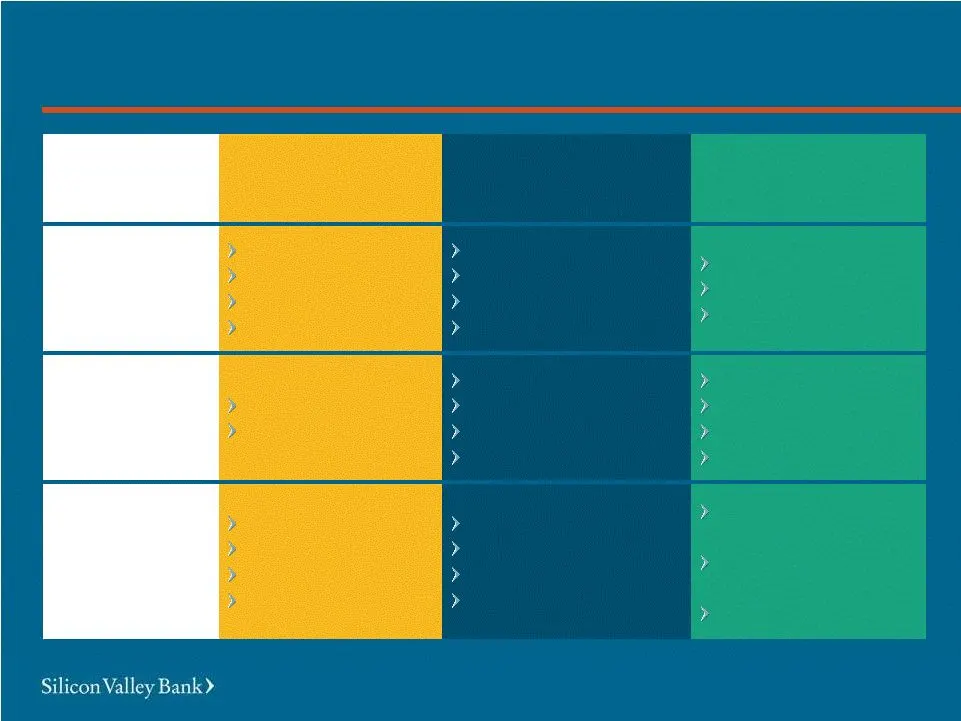
How Do We Support Our Clients? Growth Corporate Finance Investors Benchmarking M&A Networking Global Expansion M&A Networking Growth Capital Working Capital Mezzanine Debt M&A Financing Growth Capital Working Capital Mezzanine Debt M&A Financing Deposit Services F/X Cash Management Cards Global Inve
Slide 35: U.S. HQ and International Offices
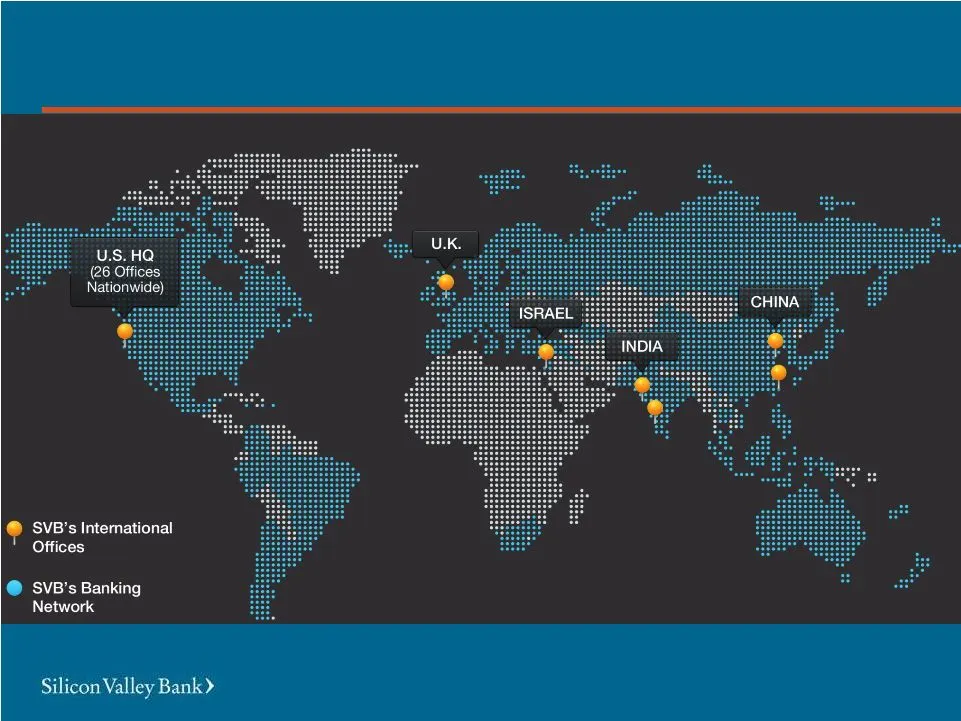
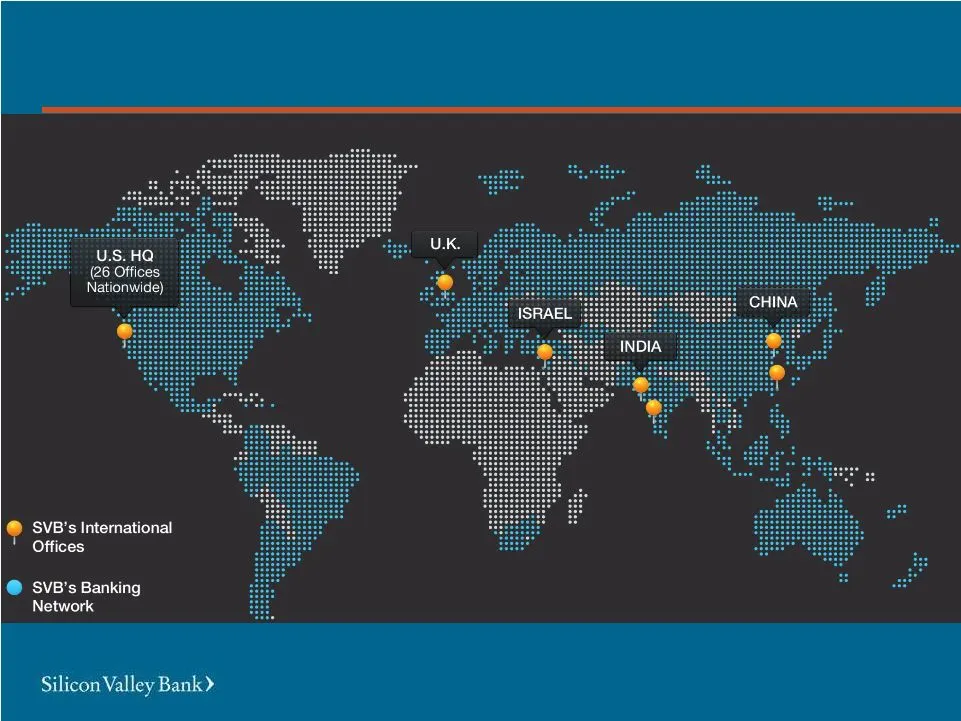
U.S. HQ (26 Offices Nationwide) ‘SVB's International Offices @ SVB’s Banking Network Silicon Valley Bank)

Slide 36: SVB Global Statistics
SVB Global Statistics >$300 million of loans 8% of total deposits $24 billion of F/X trades $31 billion of international wires SVB Global Statistics

Slide 37: Looking Forward
Looking Forward

Slide 38: What's changing now: Client Facing
What’s changing now Greater focus on “Mission” Creating a truly “global” organization Greater focus on individuals as clients Deeper cross-selling, increased “wallet share” Investing in talent (specialized expertise) What’s changing now Client Facing

Slide 39: What's changing now: Infrastructure/Support
What’s changing now Leveraging technology as a “true” differentiator Lowering base costs (e.g. Tempe) Adding and developing talent What’s changing now Infrastructure/Support
Slide 40: Diversified Growth Across the Business
Diversified Growth Across the Business GLOBAL PLATFORM New Global Core Banking System IT Backbone Upgrade Enhanced Global Payment System Enhanced On-line/Mobile Systems PRODUCT LINES Expanded Banking Network New Payment Solutions New Products & Services Enhanced Credit Solutions CLIENT NEEDS Client
Slide 41: Domestic Opportunity
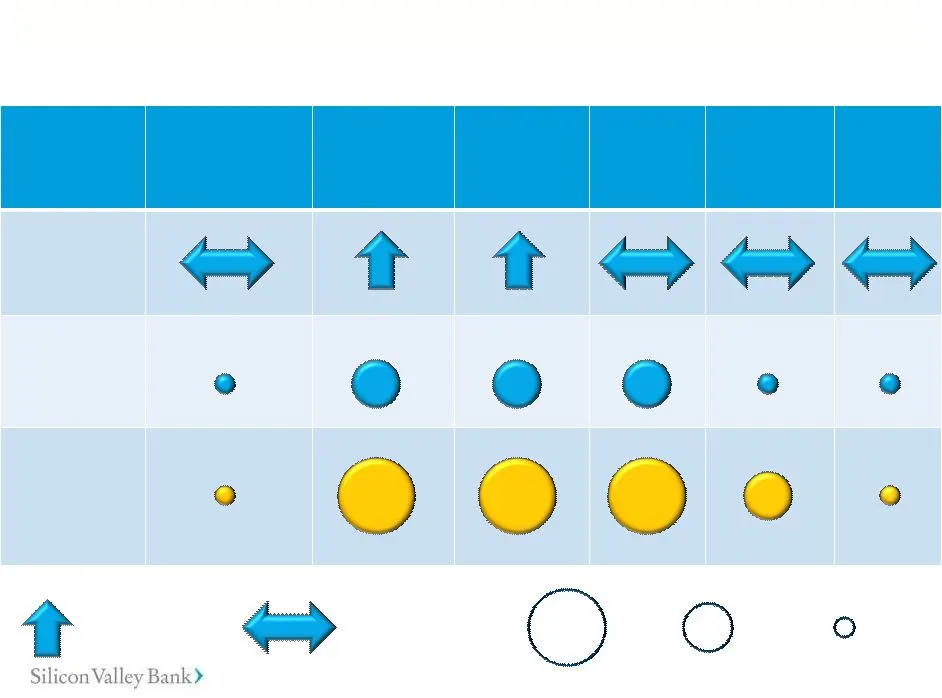
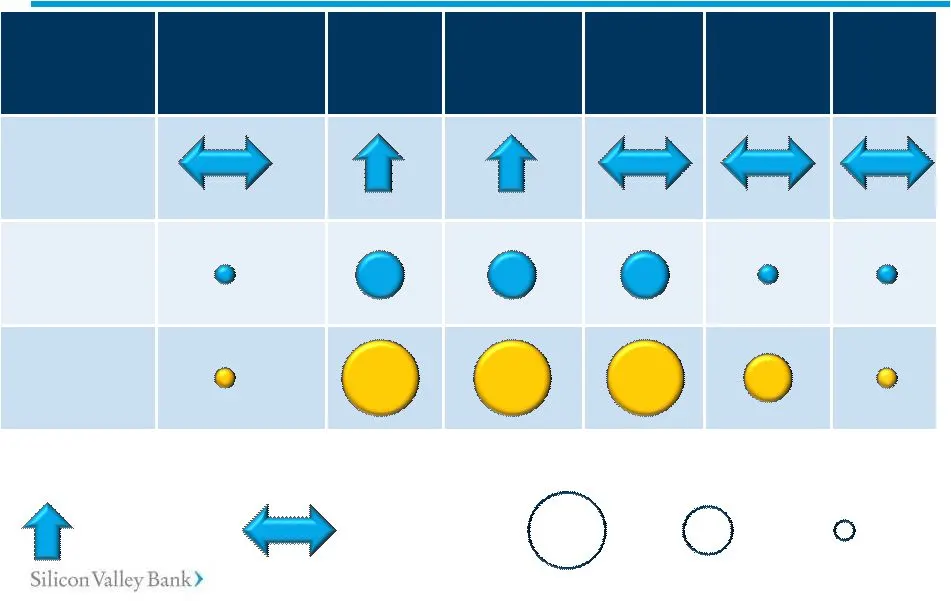
Accelerator Growth Corp Finance VC/PE Private Bank Wine Domestic Opportunity Domestic Opportunity Accelerator Growth Corp Finance VC/PE Private Bank Wine Market Direction SVB Opportunity 0-2 Years SVB Opportunity 3-5 Years High Medium Low Growing Market Stable market
Slide 42: Global Opportunity
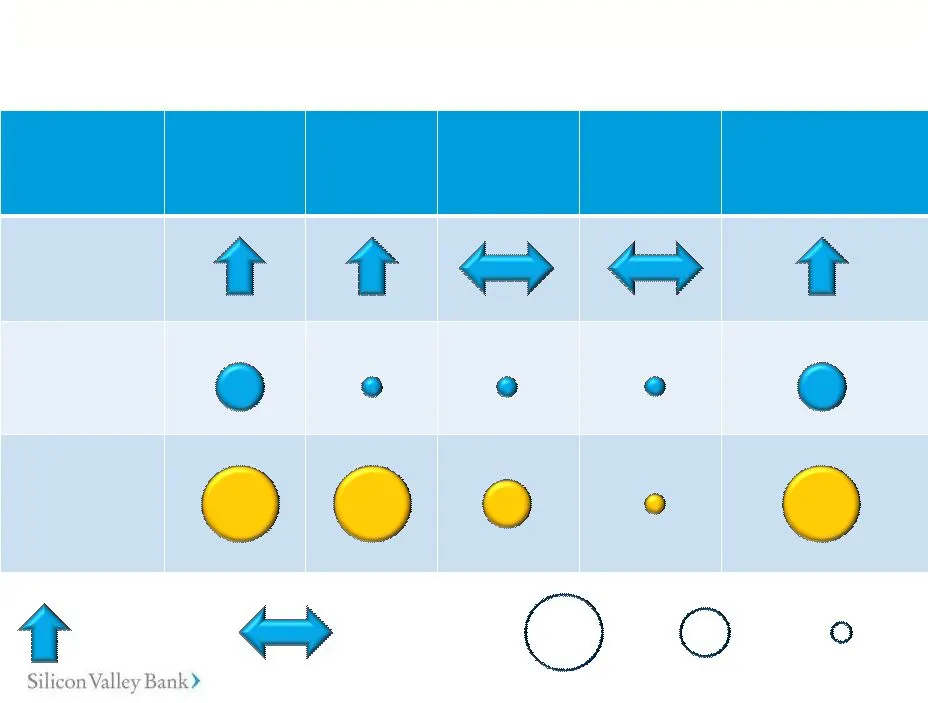
UK/ Europe China India Israel International VC/PE Global Opportunity Global Opportunity UK/ Europe China India Israel International VC/PE Market Direction SVB Opportunity 0-2 Years SVB Opportunity 3-5 Years High Medium Low Growing Market Stable market

Slide 43: Competitive Advantage
43 Competitive Advantage Competitive Advantage

Slide 44: SVB's Competitive Advantages
SVB’s Competitive Advantages Focus on our innovation sector Reputation and long-term commitment Innovation in products, services and delivery Remarkable client service and ease of use Ability to recruit, attract and retain the best people SVB’s Competitive Advantages

Slide 45: Financial Performance
45 Financial Performance Financial Performance
Slide 46: We Have Performed Well Against Our Peers
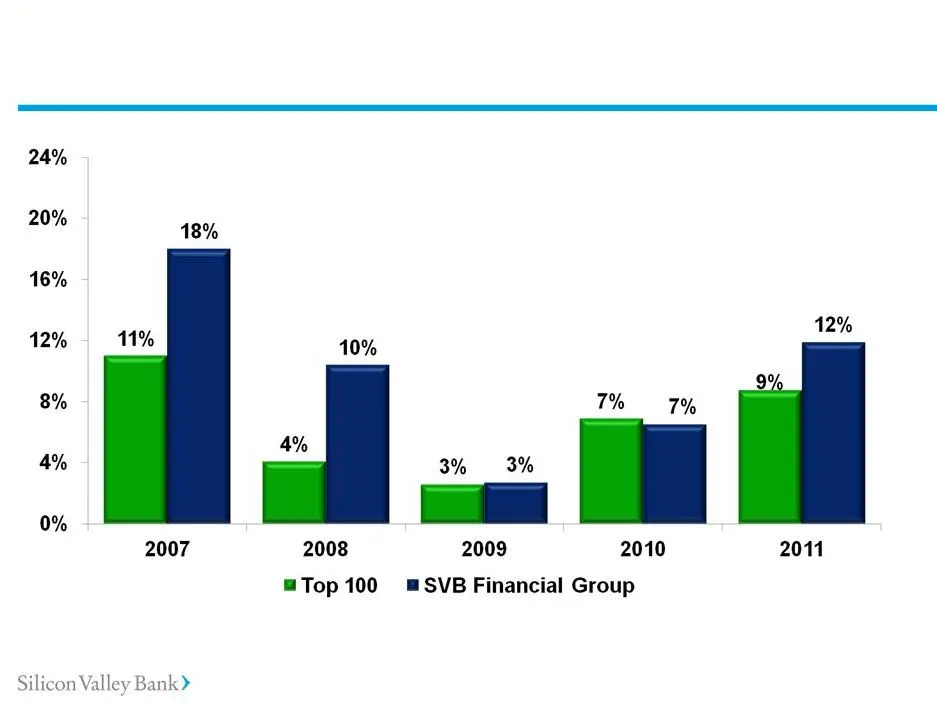
We Have Performed Well Against Our Peers We Have Performed Well Against Our Peers ROE Source for median ROE: SNL Financial

Slide 47: Financial Goals 2012–2015
Financial Goals 2012–2015 *”Core” excludes gains/losses on investment securities and gains/losses on equity warrants ~10%+ ROE in low rate environment ~15%+ in normal rate environment ~15%+ Core* EPS growth rate per year ~20%+ with increasing rates with flat rates Financial Goals 2012–2015 High-Perf

Slide 48: Takeaways
Takeaways We are evolving into a global bank. Our clients are innovative and high growth. Our model is unique and defensible. We have significant growth prospects and a plan for realizing them. We expect to deliver “high performing” financial results. Takeaways
Slide 49: SV B>
SV B> Silicon Valley Bank)

Slide 50: Financial Performance and Outlook
Financial Performance and Outlook Mike Descheneaux Chief Financial Officer February 15, 2012 Financial Performance and Outlook

Slide 51: Overview
Overview Recap of historical financial performance Insight into capital management SVB’s Outlook vs. The Street Overview

Slide 52: All-Time Highs/Bests in 2011
All-Time Highs/Bests in 2011 Assets Loans Available-For-Sale Investment Securities Deposits All-Time Highs/Bests in 2011

Slide 53: All-Time Highs/Bests in 2011
All-Time Highs/Bests in 2011 Net Income Earnings Per Share Net Interest Income Foreign Exchange Fees Credit Card Fees Net Charge-offs Expenses All-Time Highs/Bests in 2011

Slide 54: Historical Financial Performance
Historical Financial Performance Historical Financial Performance
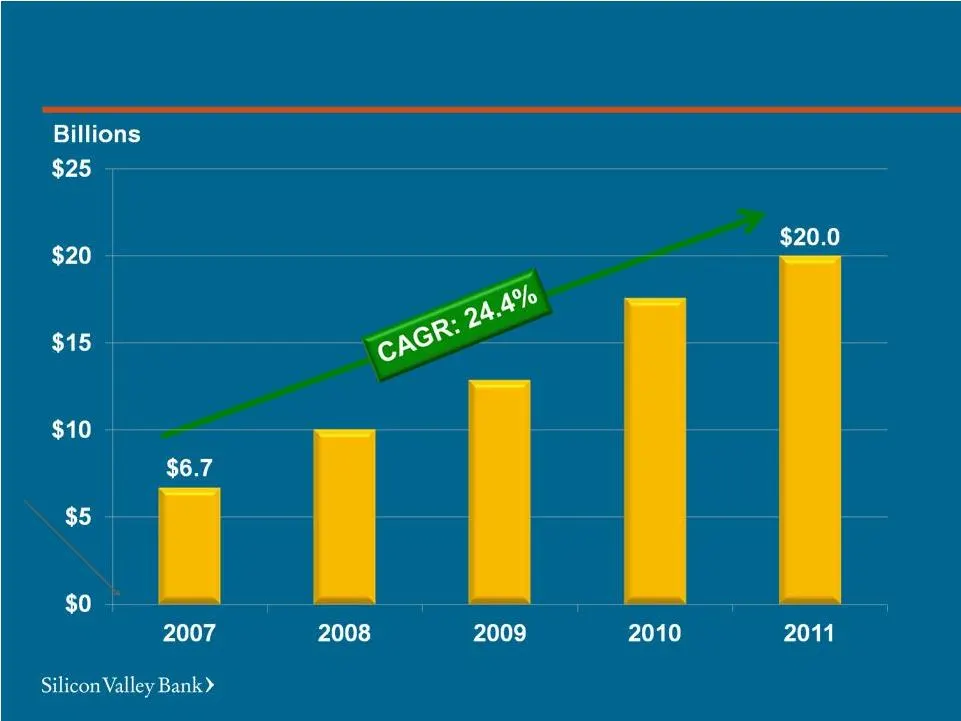
Slide 55: Assets at All-Time High
Assets at All-Time High Assets at All-Time High
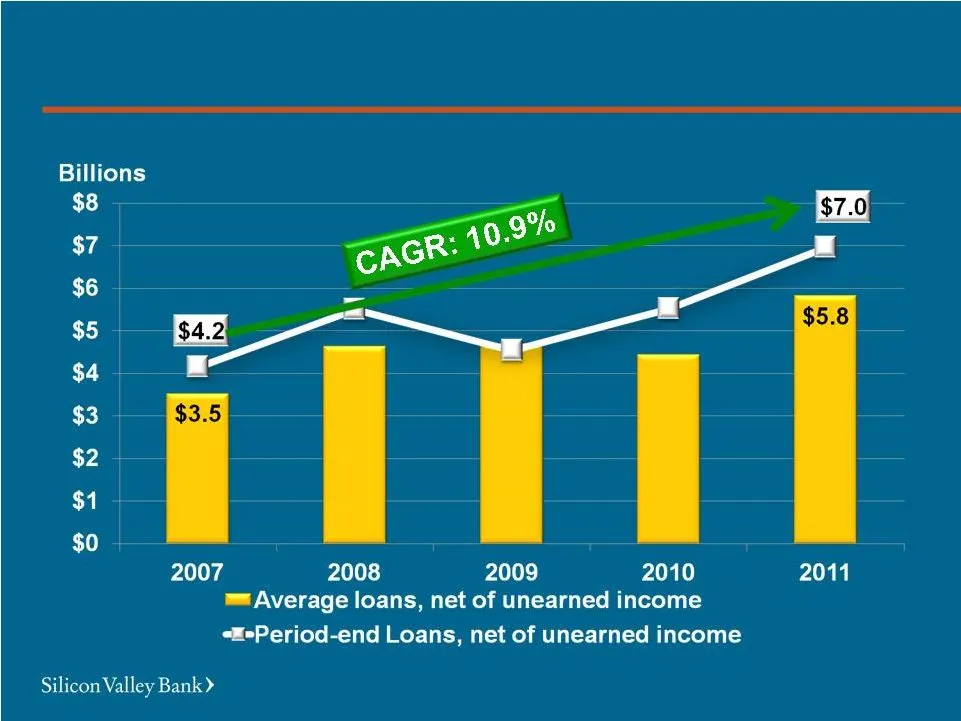
Slide 56: Loans at All-Time High
Loans at All-Time High Loans at All-Time High
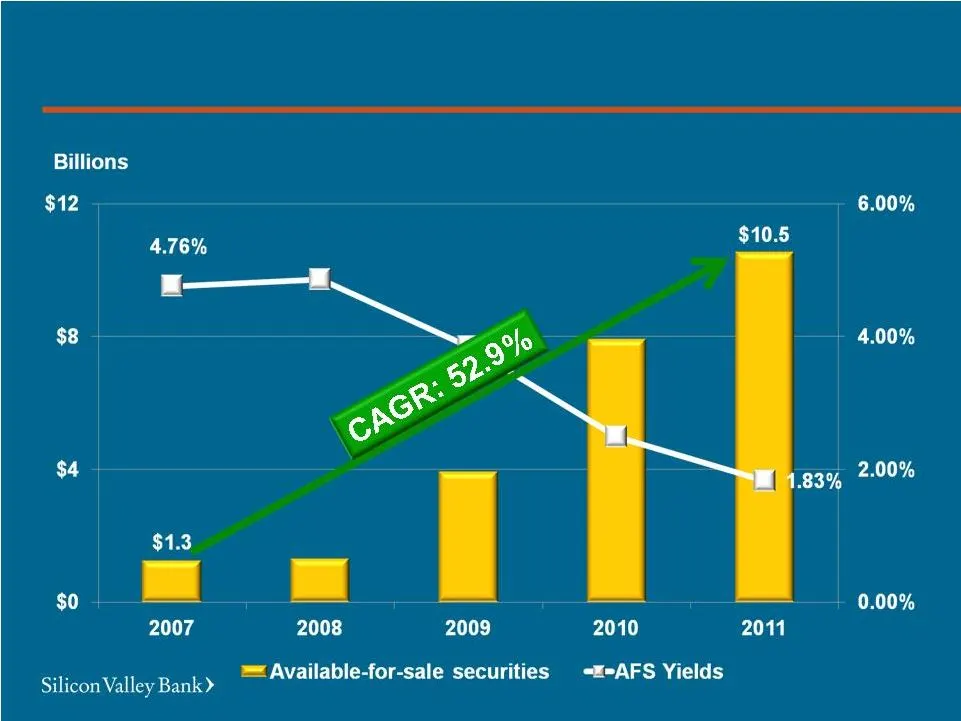
Slide 57: AFS Securities at All-Time High
AFS Securities at All-Time High Yield AFS Securities at All-Time High
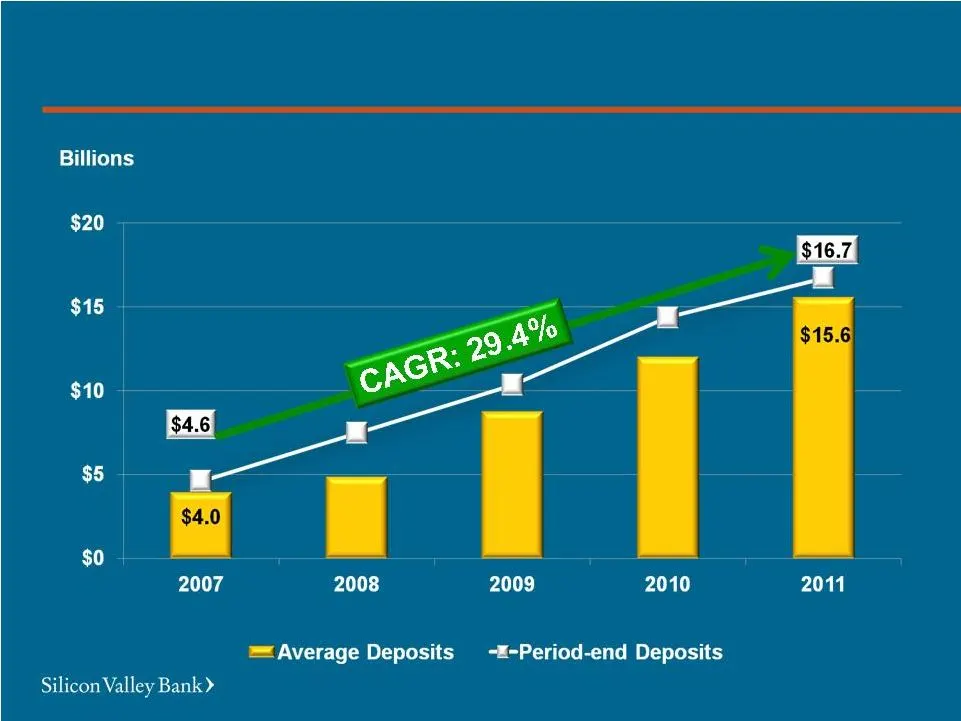
Slide 58: Deposits at All-Time High
Deposits at All-Time High Deposits at All-Time High
Slide 59: Strong Deposit (and Client Funds) Franchise
Strong Deposit (and Client Funds) Franchise Billions Strong Deposit (and Client Funds) Franchise

Slide 60: Strong Deposit (and Client Funds) Franchise
Strong Deposit (and Client Funds) Franchise Organic Factors Highly liquid clients Clients performing well New client acquisition Other Factors Safety of the balance sheet (unlimited FDIC insurance) Low rate environment Strong Deposit (and Client Funds) Franchise
Slide 61: Balance Sheet at 12/31/11: Assets
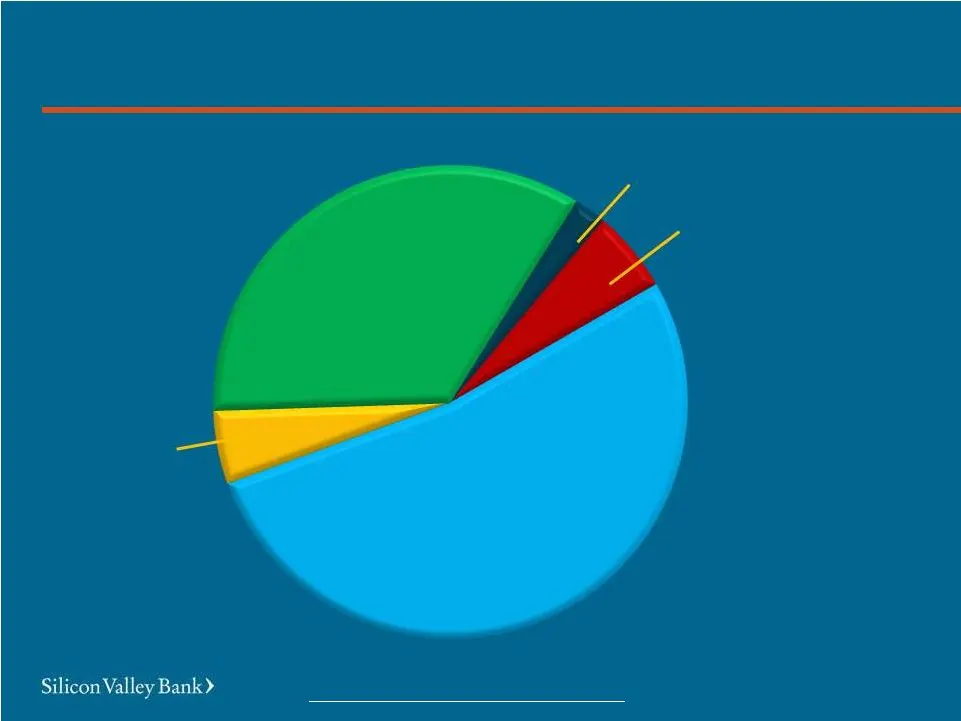
Balance Sheet at 12/31/11 Assets: $20.0B $10.5B AFS Securities $1.0B Non-Marketable Securities (VC Investments) * $6.9B Net Loans $0.4B Other Assets $1.1B Cash & Cash Equivalents * Net of non-controlling interests, non-marketable securities were $357 million. Non-GAAP Number. Please see our most rec
Slide 62: Balance Sheet at 12/31/11: Liabilities
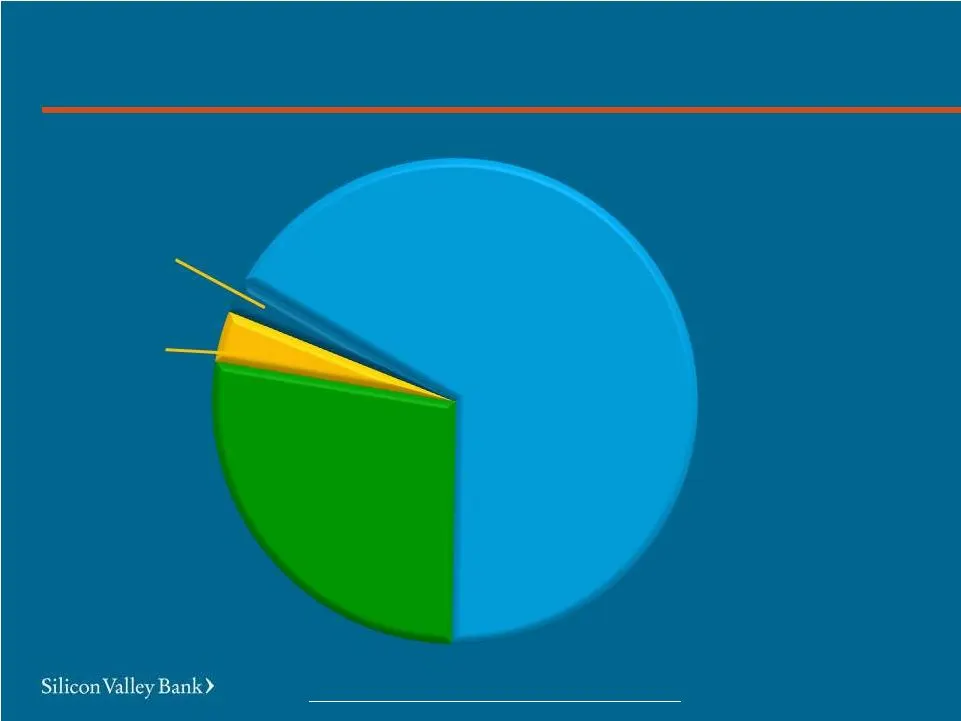
Balance Sheet at 12/31/11 Liabilities: $17.7B $11.9B Non-Interest-Bearing Deposits $4.8B Interest-Bearing Deposits $0.6B Long-Term Debt $0.4B Other Liabilities Balance Sheet at 12/31/11
Slide 63: Net Income at All-Time High
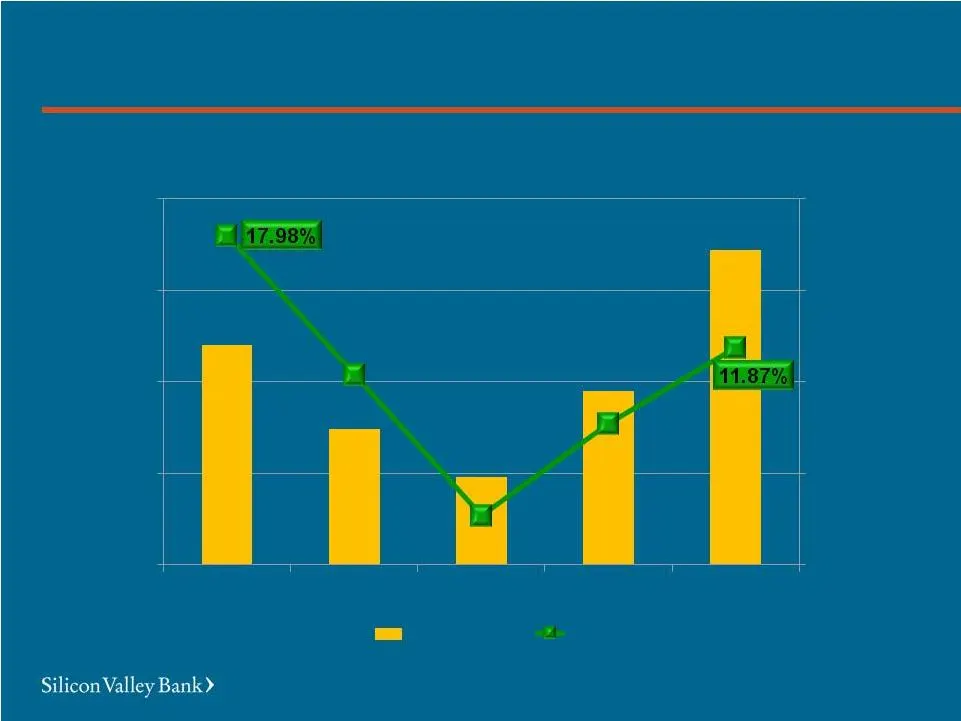
Net Income at All-Time High 0.0% 5.0% 10.0% 15.0% 20.0% $0 $50 $100 $150 $200 2007 2008 2009 2010 Net Income ROE Millions 2011 $120.3 $171.9 Net Income at All-Time High
Slide 64: Net Interest Income at All-Time High
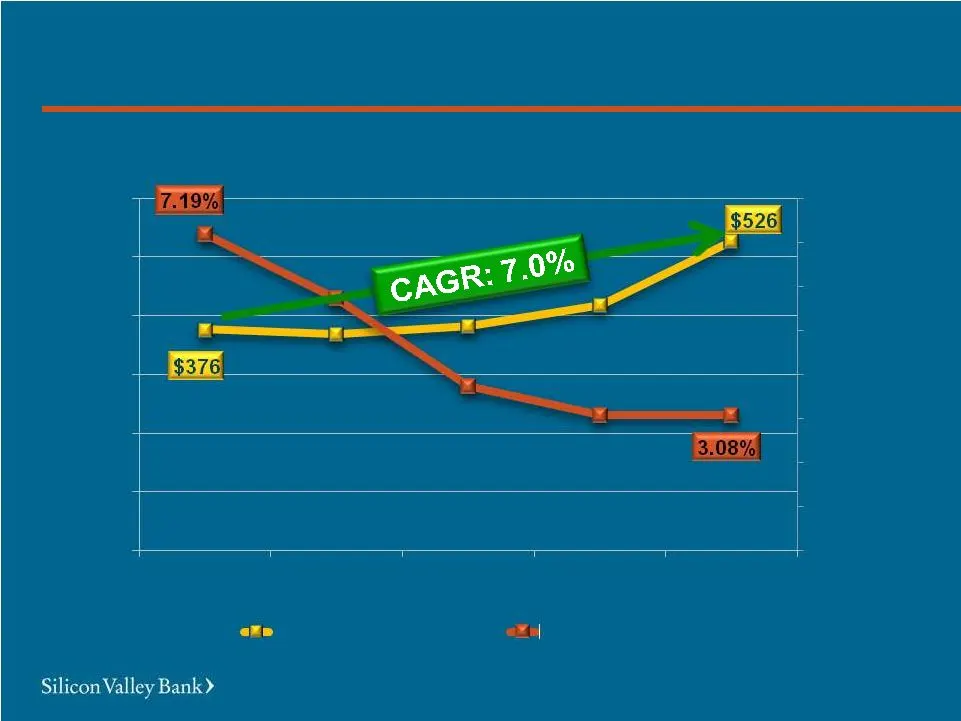
Net Interest Income At All-Time High 0.0% 1.0% 2.0% 3.0% 4.0% 5.0% 6.0% 7.0% 8.0% $0 $100 $200 $300 $400 $500 $600 2007 2008 2009 2010 Net interest Income Net Interest Margin Millions 2011 Net Interest Income At All-Time High
Slide 65: EPS at All-Time High
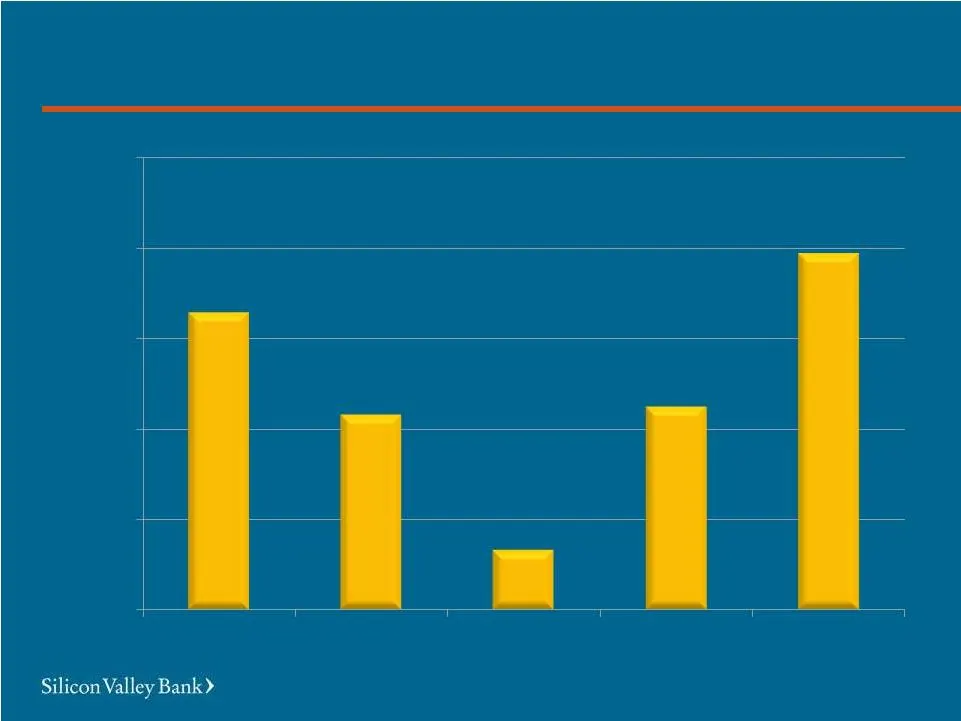
EPS at All-Time High $3.28 $3.94 $0.00 $1.00 $2.00 $3.00 $4.00 $5.00 2007 2008 2009 2010 2011 EPS at All-Time High
Slide 66: Warrant Income Highest Since 2000
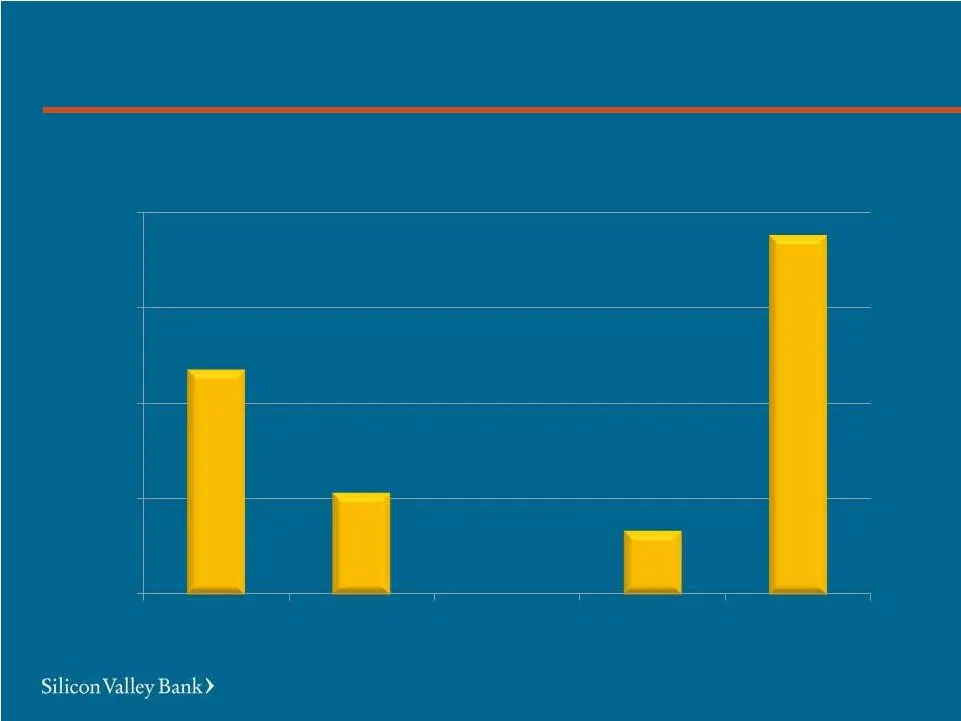
Warrant Income Highest Since 2000 $23.5 $37.4 $0 $10 $20 $30 $40 2007 2008 2009 2010 2011 Millions Warrant Income Highest Since 2000
Slide 67: Warrant Income Vs. the Nasdaq
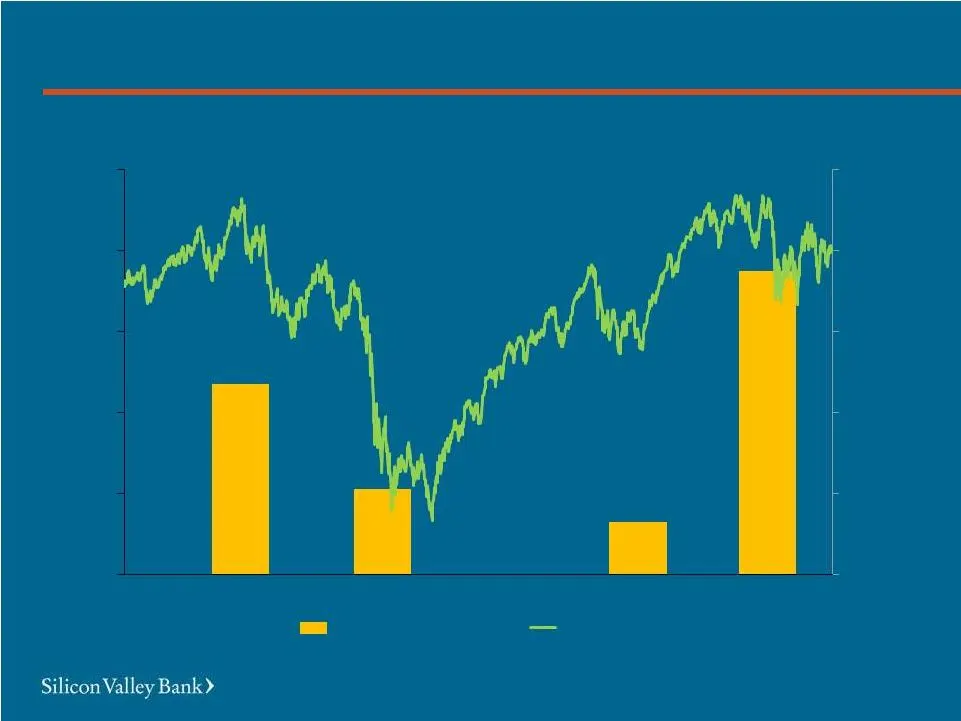
Warrant Income Vs. the Nasdaq Millions $0.0 $10.0 $20.0 $30.0 $40.0 $50.0 1,000 1,400 1,800 2,200 2,600 3,000 2007 2008 2009 2010 2011 Warrant Income Nasdaq Warrant Income Vs. the Nasdaq
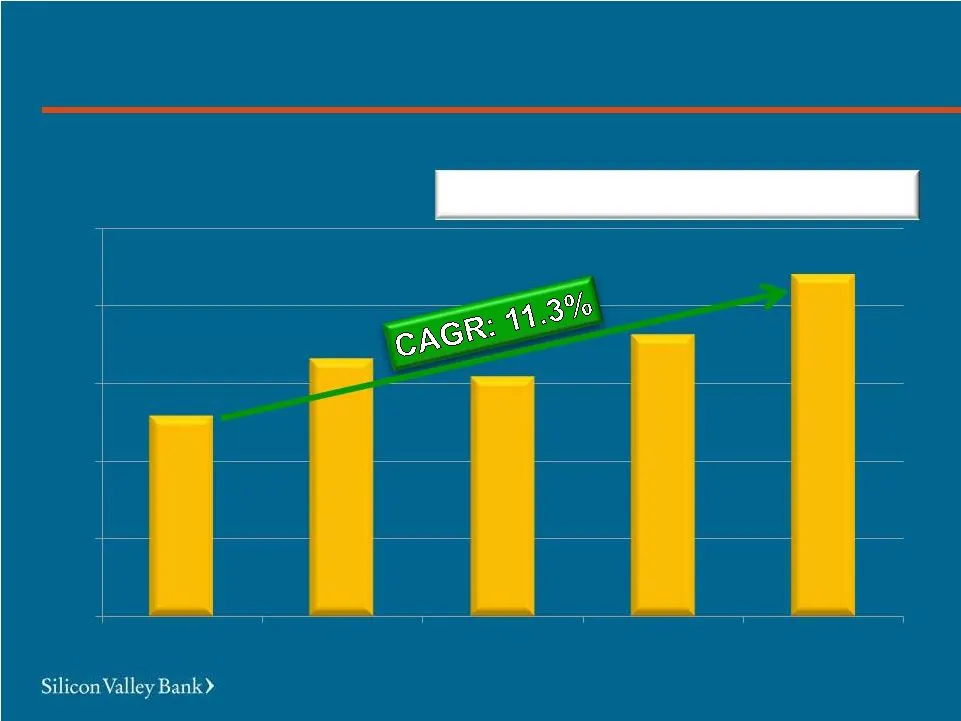
Slide 68: F/X Fee Income at All-Time High
F/X Fee Income at All-Time High $0 $10 $20 $30 $40 $50 2007 2008 2009 2010 2011 Millions $25.8 $43.9 F/X Fee Income at All-Time High 2011 FX Volumes = $24 Billion
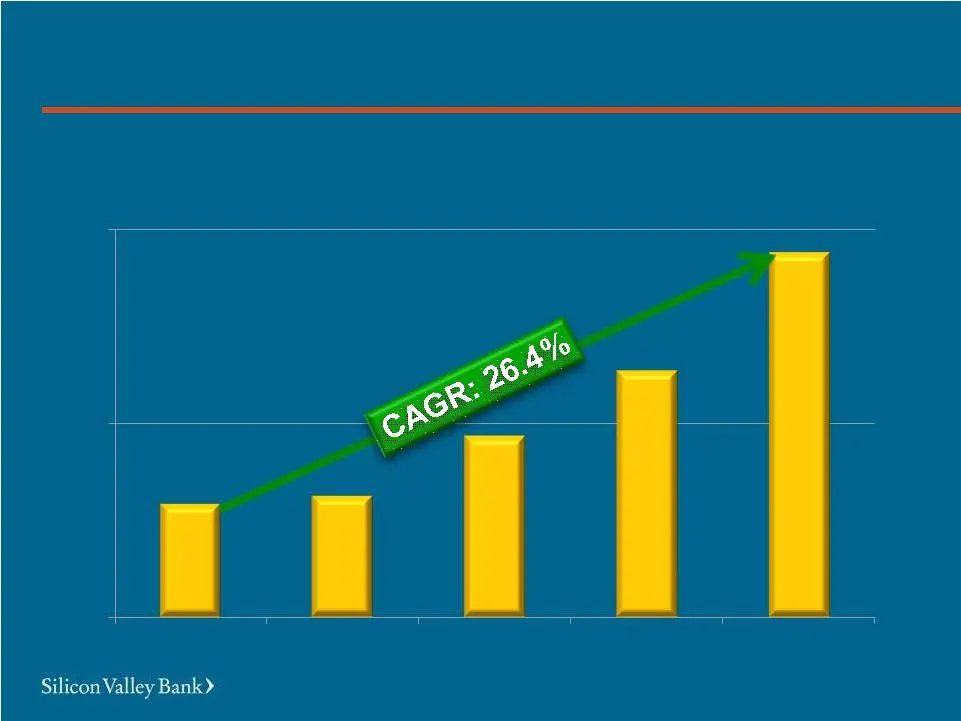
Slide 69: Credit Card Fee Income at All-Time High
Credit Card Fee Income at All-Time High $5.8 $18.7 $0 $10 $20 2007 2008 2009 2010 2011 Millions Credit Card Fee Income at All-Time High
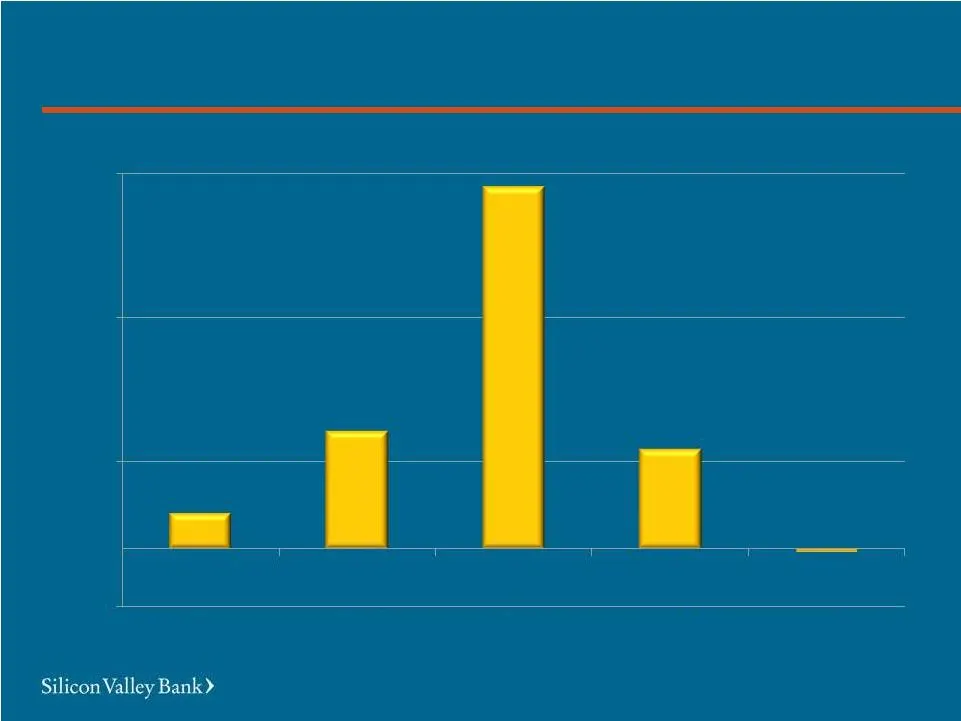
Slide 70: Net Charge-offs At Very Low Levels
Net Charge-offs At Very Low Levels Millions $12.3 $40.6 $125.1 $34.5 $1.2 $30 $80 $130 2007 2008 2009 2010 2011 - Net Charge-offs At Very Low Levels ($20)
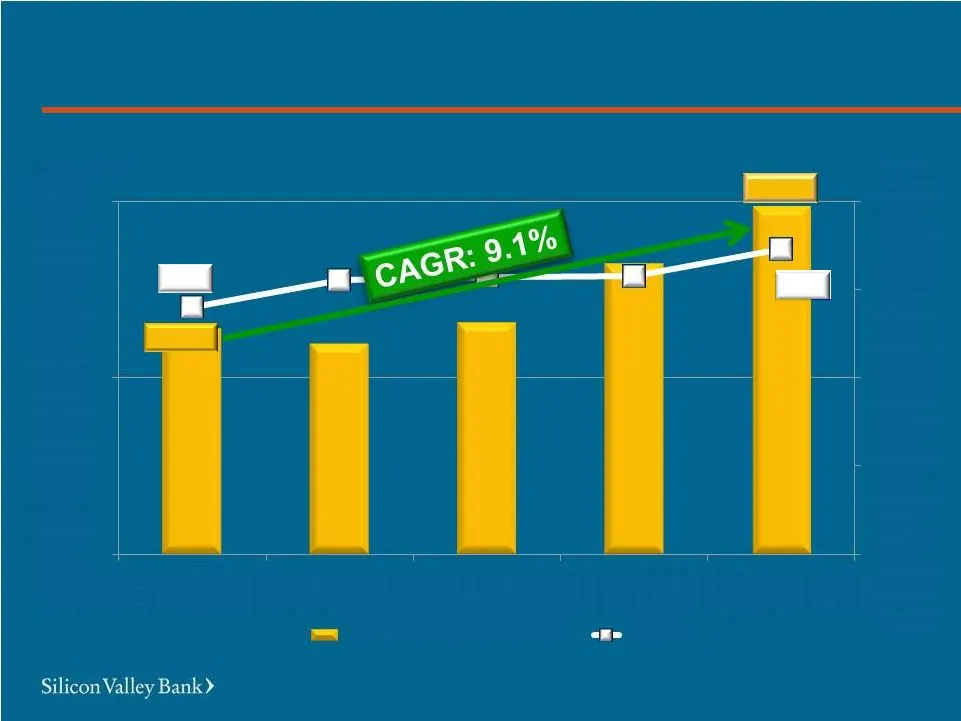
Slide 71: FTE Expenses at All-Time High
0 400 800 1200 1600 $0 $250 $500 2007 2008 2009 2010 2011 Millions FTE Expenses at All-Time High * Non-GAAP number. Please see our most recent financial releases for more information Non-Interest Expense* FTE $318.6 $492.2 1,145 1,451 Expenses at All-Time High
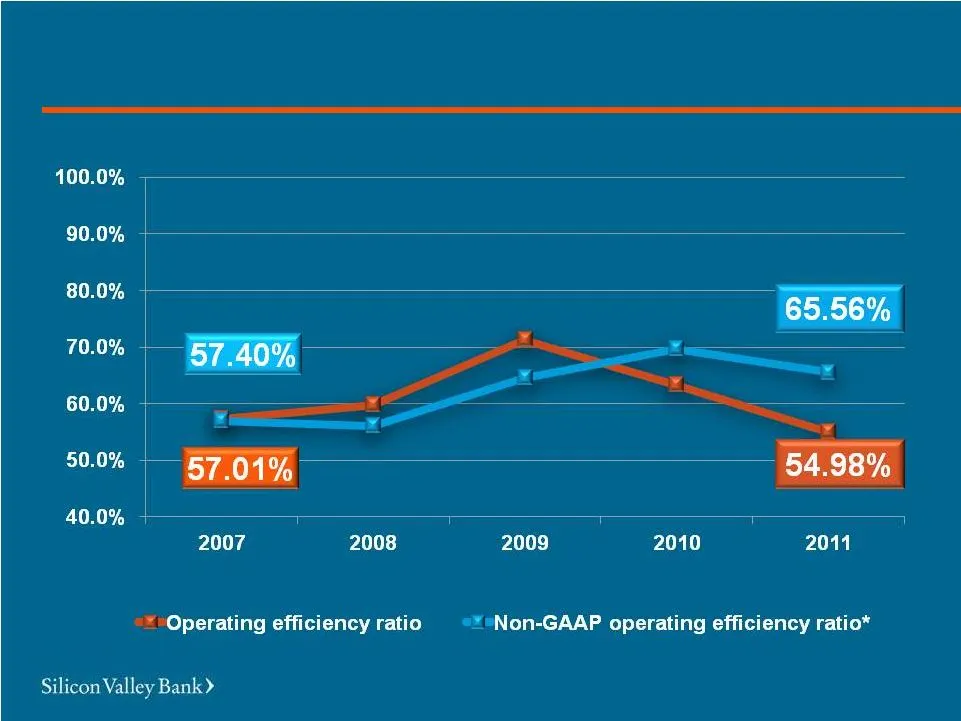
Slide 72: Operating Efficiency Ratio
Operating Efficiency Ratio * Non-GAAP number. Please refer to our most recent financial releases for more information Operating Efficiency Ratio
Slide 73: Financial Highlights: 2007 - 2011
2007 2008 2009 2010 2011 Financial Highlights: 2007 - 2011 Diluted Earnings Per Share $3.28 $2.16 $0.66 $2.24 $3.94 Net Income Available to Common Stockholders $120.3M $73.6M $22.7M $95.0M $171.9M Average Loans (Change) $3.5B (+22.2%) $4.6B (+31.5%) $4.7B (+1.4%) $4.4B (-5.6%) $5.8B (+31.1%) Average
Slide 74: Recent Quarterly Results
Q4 2010 Q1 2011 Q2 2011 Q3 2011 Q4 2011 Recent Quarterly Results (3) Represents net recoveries of $2.3M. (4) Represents net charge-offs of $30K. (5) Represents net recoveries of $2.5M. (1) Includes gains of $0.51/share or $22.5M (net of tax) from sales of AFS securities. (2) Includes gains of $0.04/

Slide 75: Silicon Valley Bank)
Silicon Valley Bank)
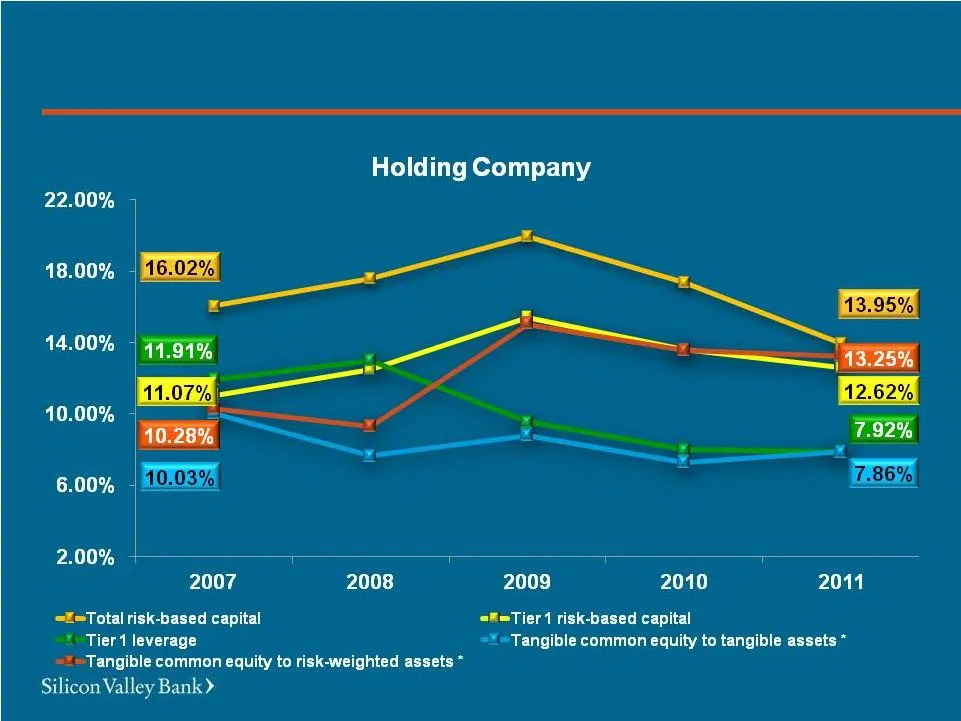
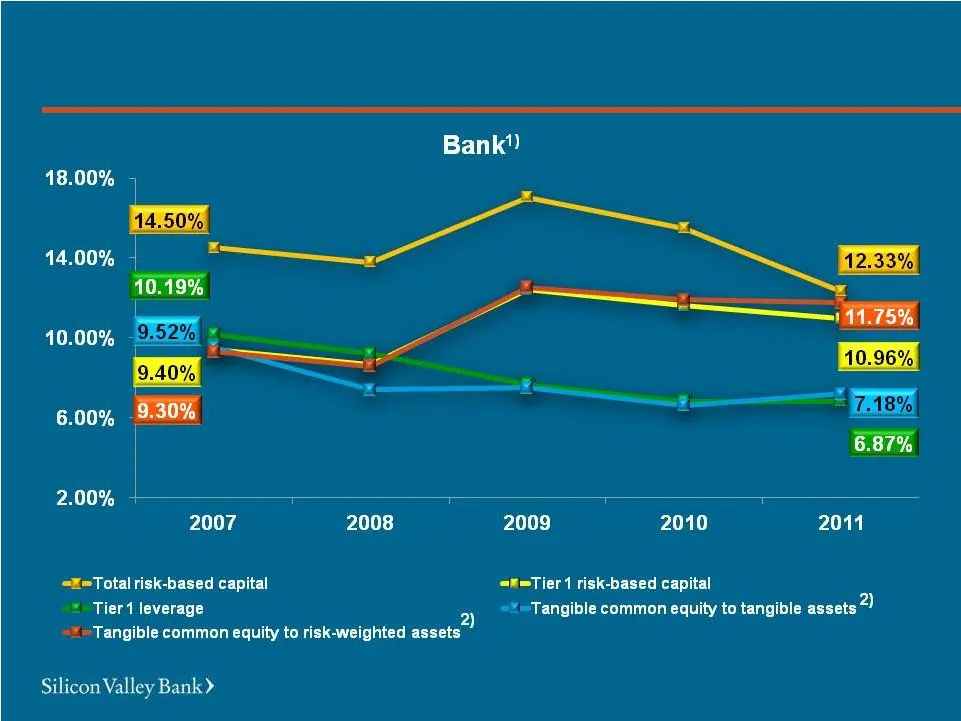
Slide 76: Solid Capital Ratios
Solid Capital Ratios • TCE/TA and TCE/RWA are non-GAAP numbers; please refer our most recent financial releases for more information. Solid Capital Ratios
Slide 77: Solid Capital Ratios
Solid Capital Ratios 1) All ratios, except TCE/TA and TCE/RWA are as reported in our most recent Bank Call Reports. Bank TCE/TA and TCE/RWA ratios are as reported in our most recent financial releases. 2) TCE/TA and TCE/RWA are non-GAAP numbers; please refer our most recent financial releases for mo
Slide 78: Asset Growth Drove Bank Leverage Ratio in 2011
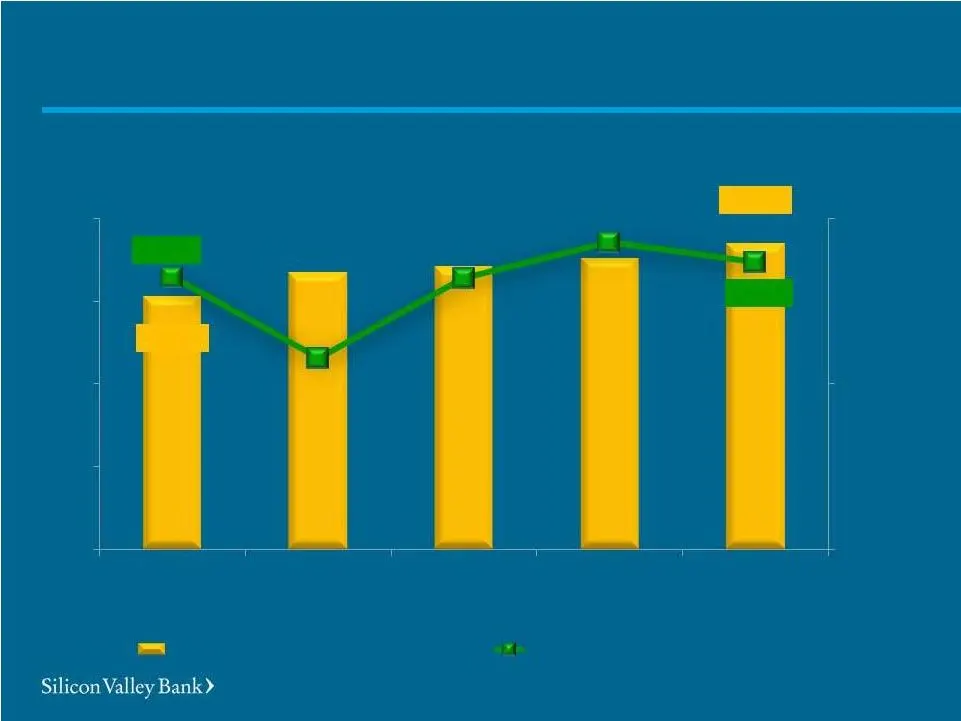
Asset Growth Drove Bank Leverage Ratio in 2011 6.00% 6.50% 7.00% $0 $5 $10 $15 $20 Q410 Q111 Q211 Q311 Q411 Billions Average Assets (Bank Only) Bank Tier 1 Leverage Ratio 6.82% 6.87% Asset Growth Drove Bank Leverage Ratio in 2011 $18.30 $15.40
Slide 79: Solid Earnings Stabilized the Ratio
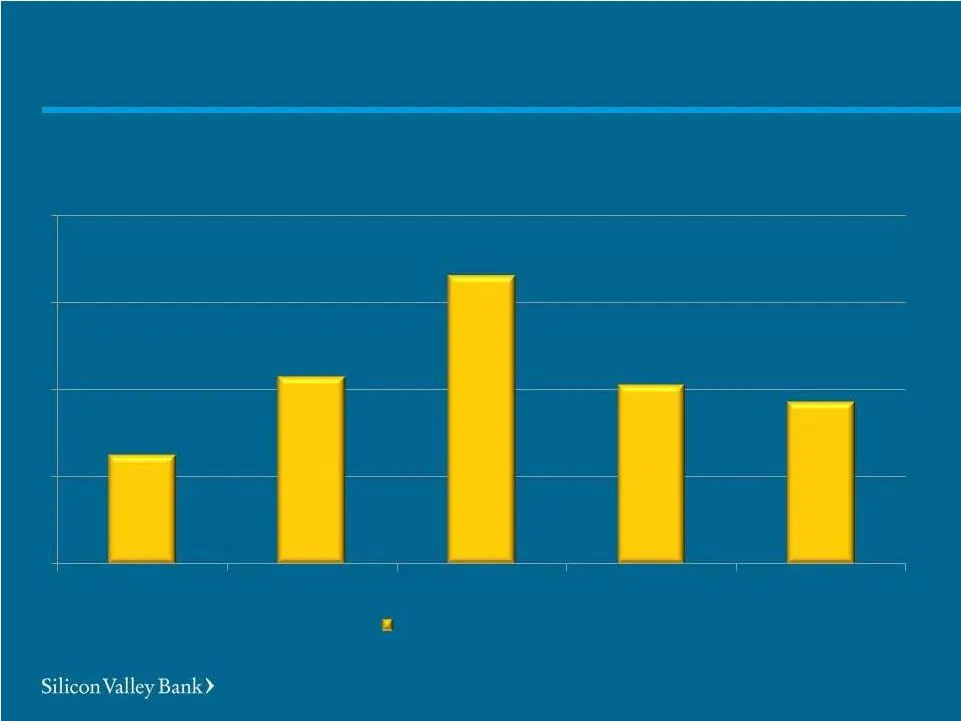
Solid Earnings Stabilized the Ratio Q410 Q111 Q211 Q311 Q411 Bank Quarterly Earnings Quarterly earnings $25.0M $37.0M Solid Earnings Stabilized the Ratio

Slide 80: Capital Management Levers
Capital Management Levers Continued earnings growth Targeted off-balance sheet initiatives Use of cash and investments at holding company Sales of AFS securities Debt issuance at holding company Equity issuance at holding company Capital Management Levers

Slide 81: SVB's Outlook vs. The Street
SVB’s Outlook vs. The Street SVB’s Outlook vs. The Street
Slide 82: Street Estimates: EPS and ROE
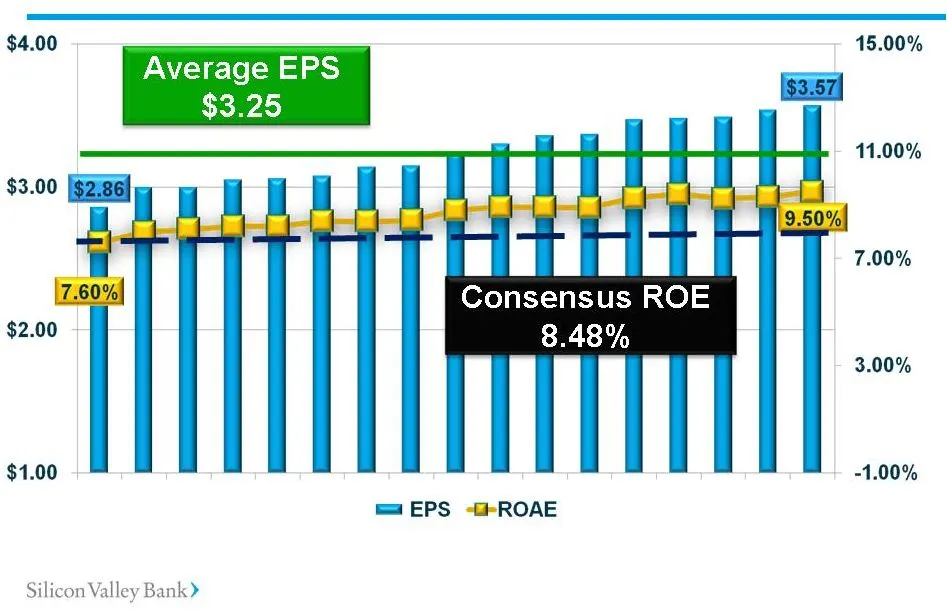
Street Estimates: EPS and ROE* Street Estimates: EPS and ROE* * Based on published reports providing estimates as of 02/01/12. Certain estimates and adjustments have been made where necessary. Please refer to analyst reports before forming any conclusions.
Slide 83: Our 2012 Outlook
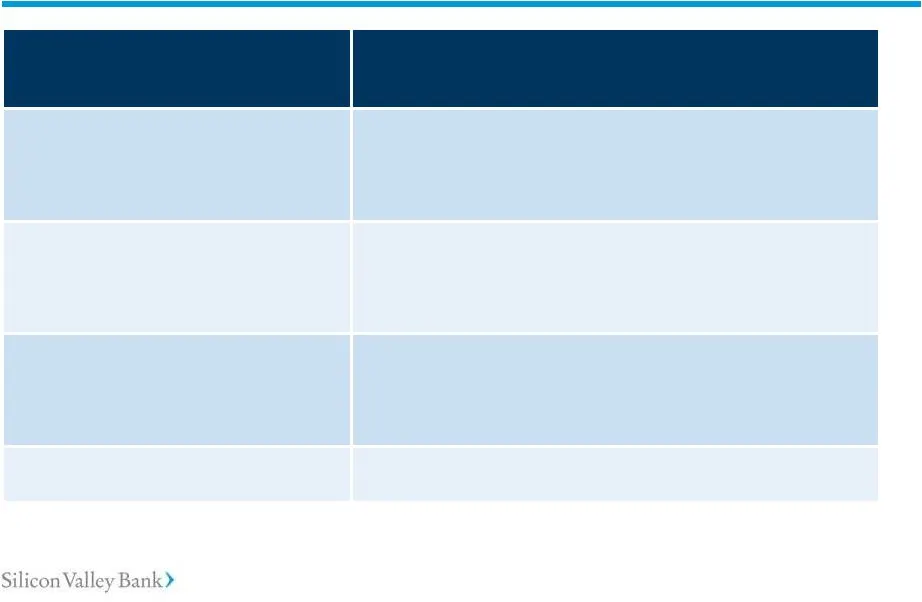
Business Driver 2012 outlook * Business Driver Average loans Mid twenties percent increase Average deposits Low teens percent increase Net interest income High teens percent increase Net interest margin Between 3.20% and 3.30% Our 2012 Outlook Our 2012 Outlook * Outlook is for the full year 2012 as
Slide 84: Our 2012 Outlook
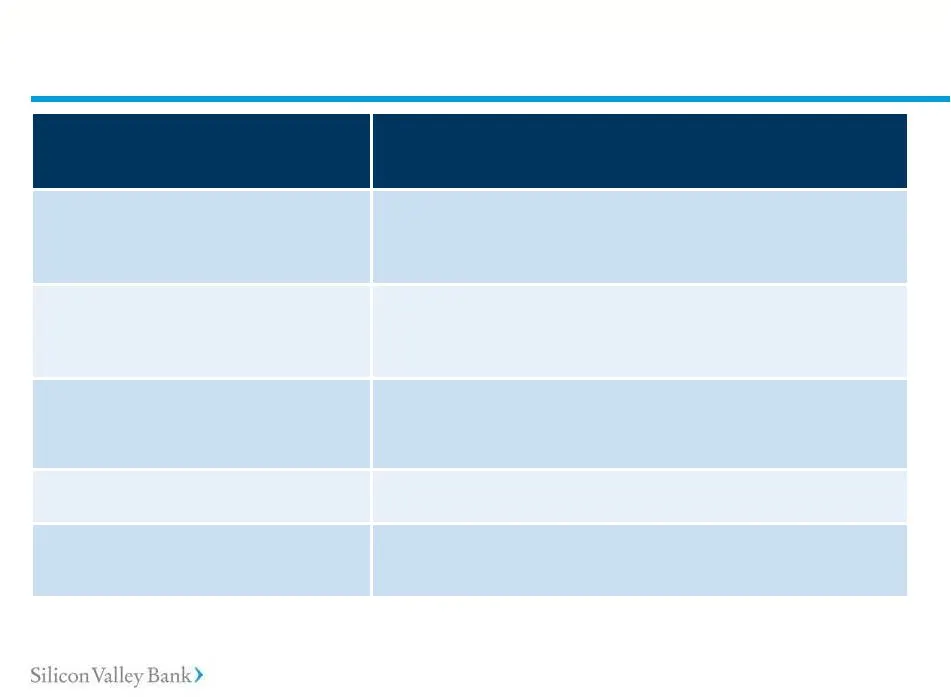
Business Driver 2012 outlook 1) Business Driver Allowance for loan losses 2) Comparable to 2011 levels of 1.23% Net loan charge-offs Between 0.40% and 0.70% of average total gross loans Non-performing loans 3) Lower than 2011 levels of 0.52% “Core” Fees 4) Mid teens percent increase Non-Interest Exp
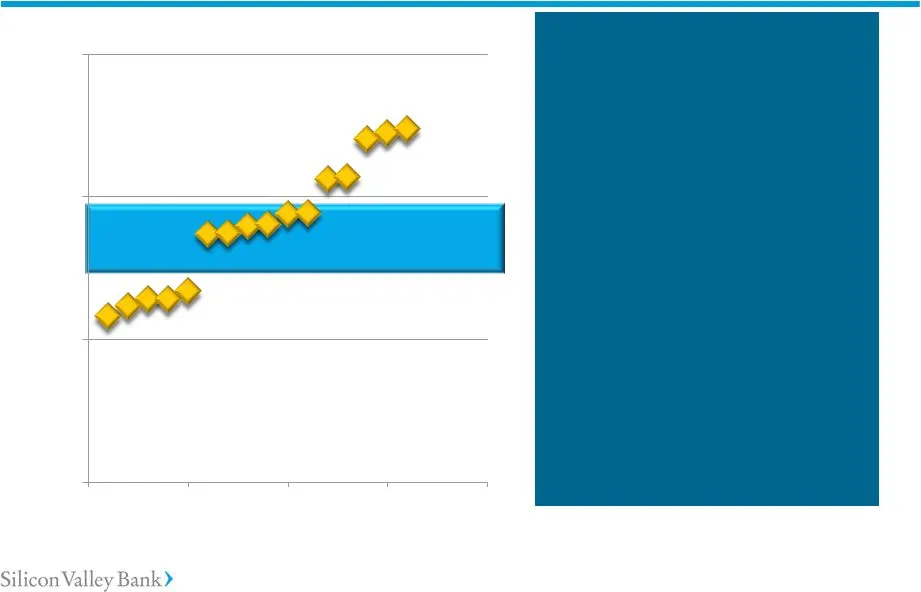
Slide 85: Street Estimates vs. SVB: Average Loans
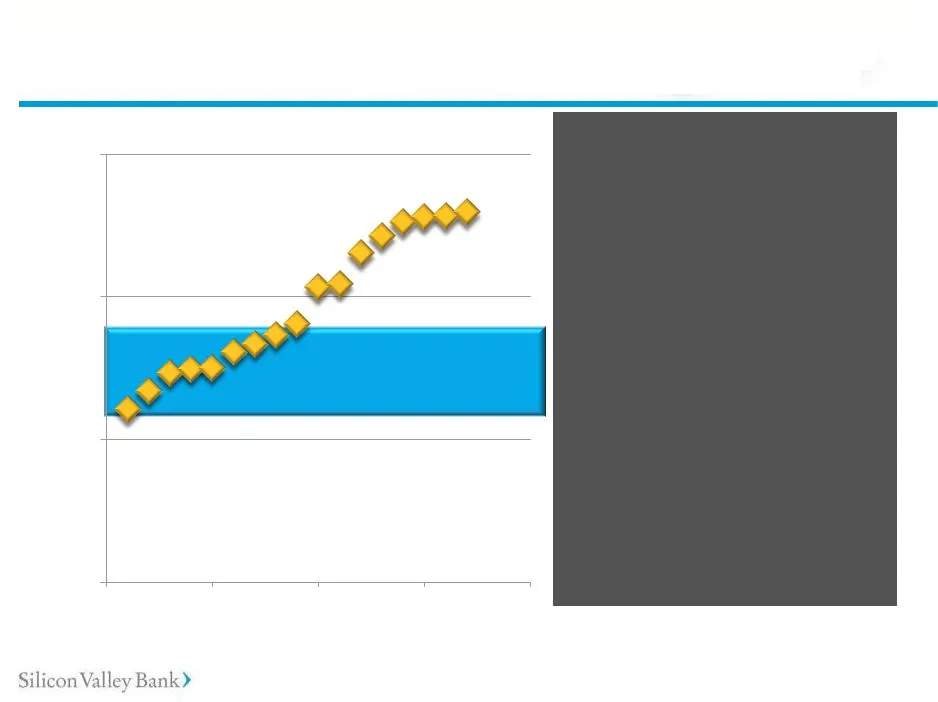
SVB’s 2012 Outlook: 22.1% 35.9% 10.0% 20.0% 30.0% 40.0% Mid 20% Growth SVB’s Outlook * Based on published reports providing estimates as of 02/01/12. Certain estimates and adjustments have been made where necessary. Please refer to analyst reports before forming any conclusions. Street Estimates vs.
Slide 86: Drivers: Average Loans
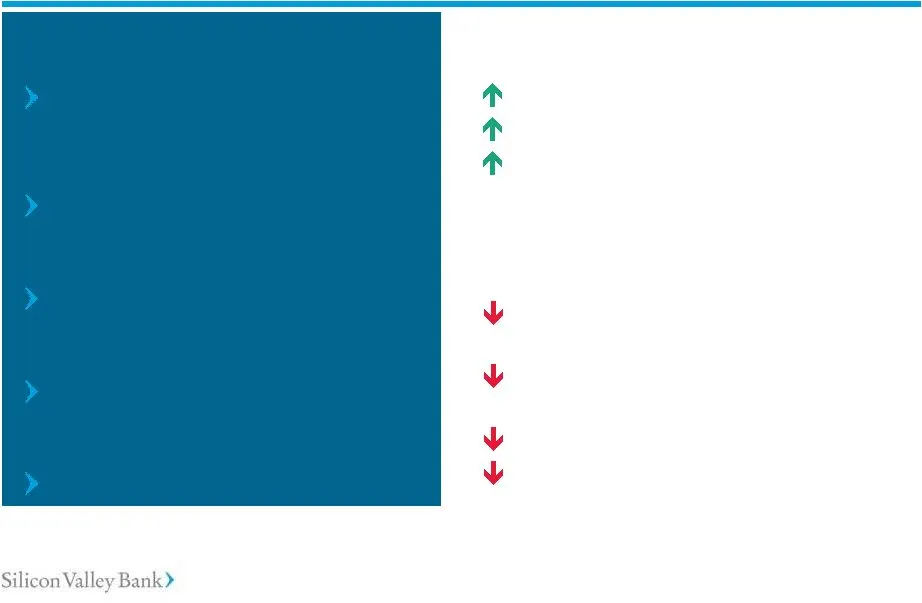
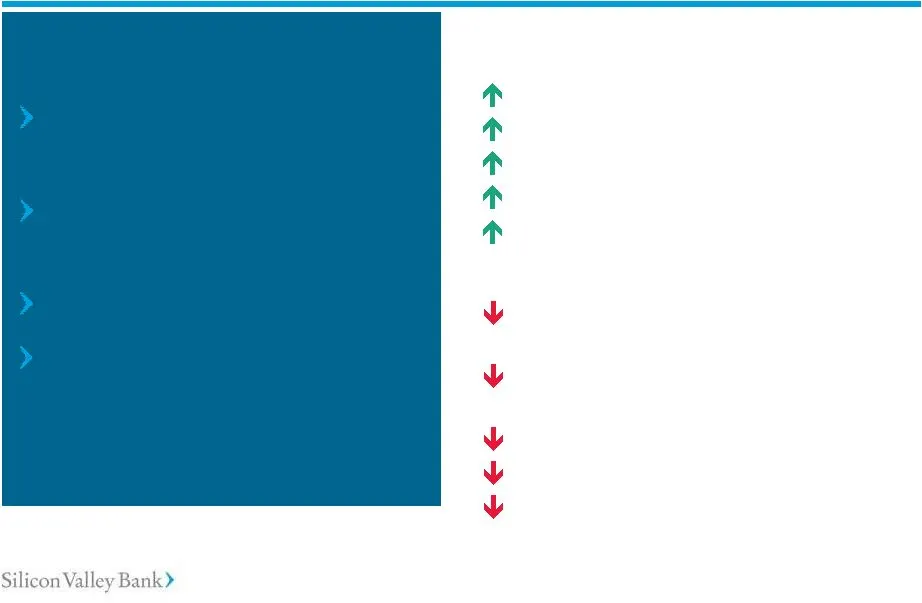
Our Assumptions growth in 2012 among our clients spending markets Modest economic Continued strength Continued healthy tech Stabilizing IPO/M&A Stabilizing VC investment Upside Downside pre-recession levels Drivers: Average Loans Drivers: Average Loans Strong economic growth Strong IPO/M&A markets V
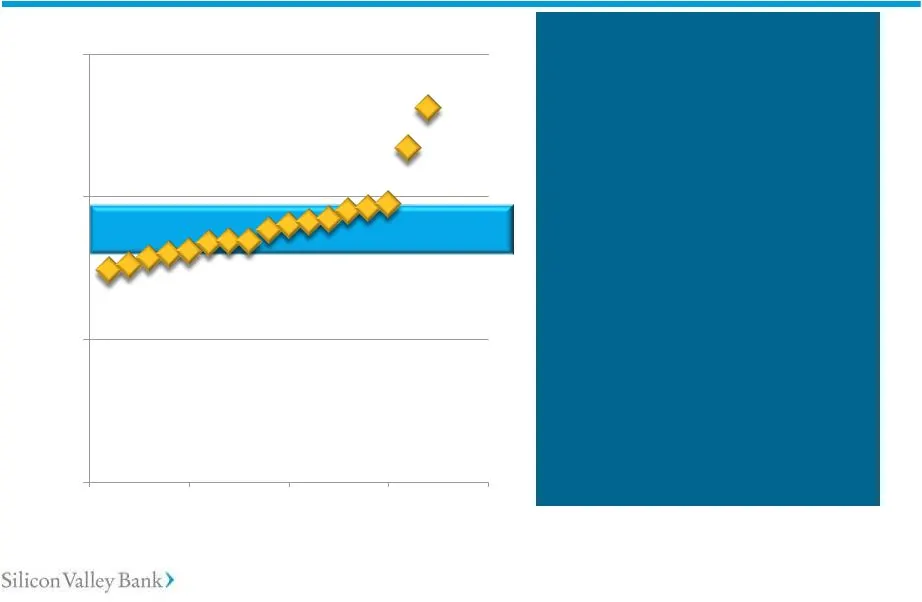
Slide 87: Street Estimates vs. SVB: Average Deposits
SVB’s 2012 Outlook: 10.8% 17.4% 5.0% 10.0% 15.0% 20.0% Low teens % Growth SVB’s Outlook * Based on published reports providing estimates as of 02/01/12. Certain estimates and adjustments have been made where necessary. Please refer to analyst reports before forming any conclusions. Street Estimates
Slide 88: Drivers: Average Deposits
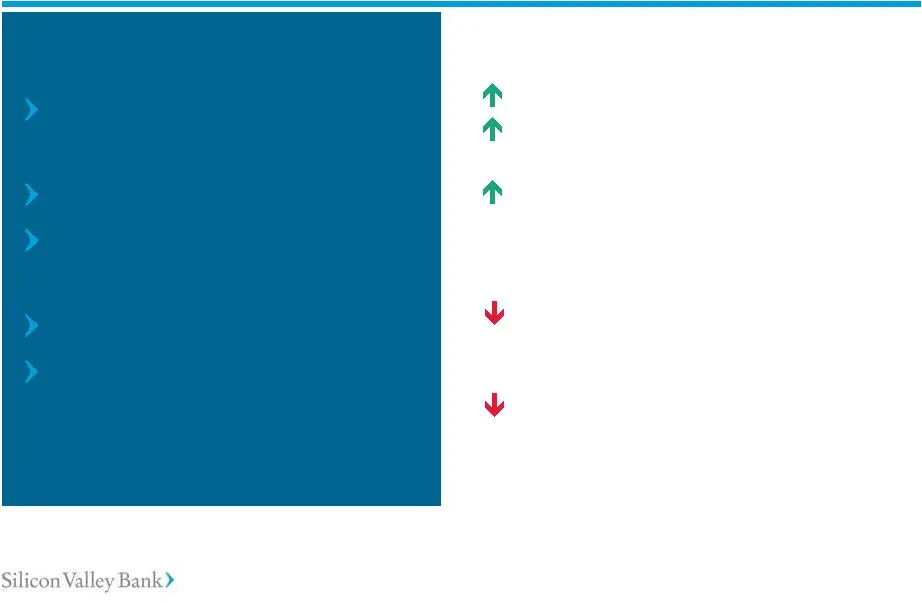
Our Assumptions Modest economic growth in 2012 VC Investment improves but remains low Strong tech spending Success of initiatives to increase off-balance sheet funds Drivers: Average Deposits Higher Deposit Drivers Strong economic growth Increased VC Fundraising Increased IPO activity Continued low
Slide 89: Street Estimates vs. SVB: Net Interest Income
SVB’s 2012 Outlook: 14.8% 26.2% 0.0% 10.0% 20.0% 30.0% High teens % Growth Outlook * Based on published reports providing estimates as of 02/01/12. Certain estimates and adjustments have been made where necessary. Please refer to analyst reports before forming any conclusions. SVB’s Street Estimates
Slide 90: Drivers: Net Interest Income
Our Assumptions No increase in Fed Funds rate in 2012 Slower deposit growth Steady investment rates and duration Mid-20s% loan growth Success in moving funds off the balance sheet Drivers: Net Interest Income Drivers: Net Interest Income Upside Rising rate environment Continued strong deposit growth
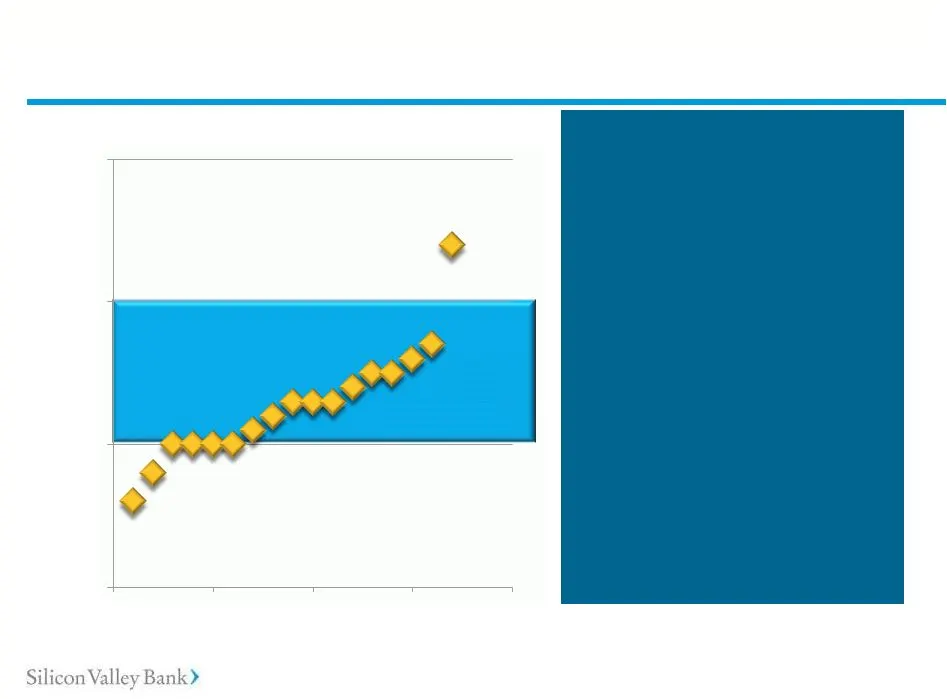
Slide 91: Street Estimates vs. SVB: Net Interest Margin
SVB’s 2012 Outlook: SVB’s Outlook Between 3.20% and 3.30% * Based on published reports providing estimates as of 02/01/12. Certain estimates and adjustments have been made where necessary. Please refer to analyst reports before forming any conclusions. 3.16% 3.27% 3.34% 3.10% 3.20% 3.30% 3.40% Stree
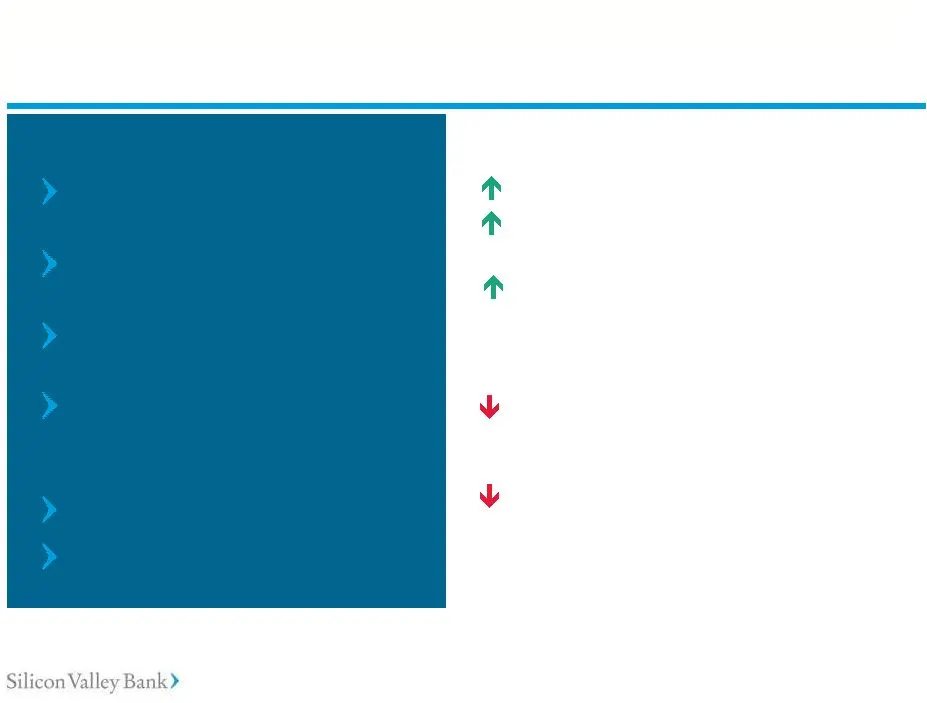
Slide 92: Drivers: Net Interest Margin
No increase in Fed Funds rate in 2012 Slower deposit growth overall Steady investment rates and duration Modest extension of investment portfolio duration Mid-20s% loan growth Success in moving funds off the balance sheet Our Assumptions Drivers: Net Interest Margin Rising rate environment Demand de
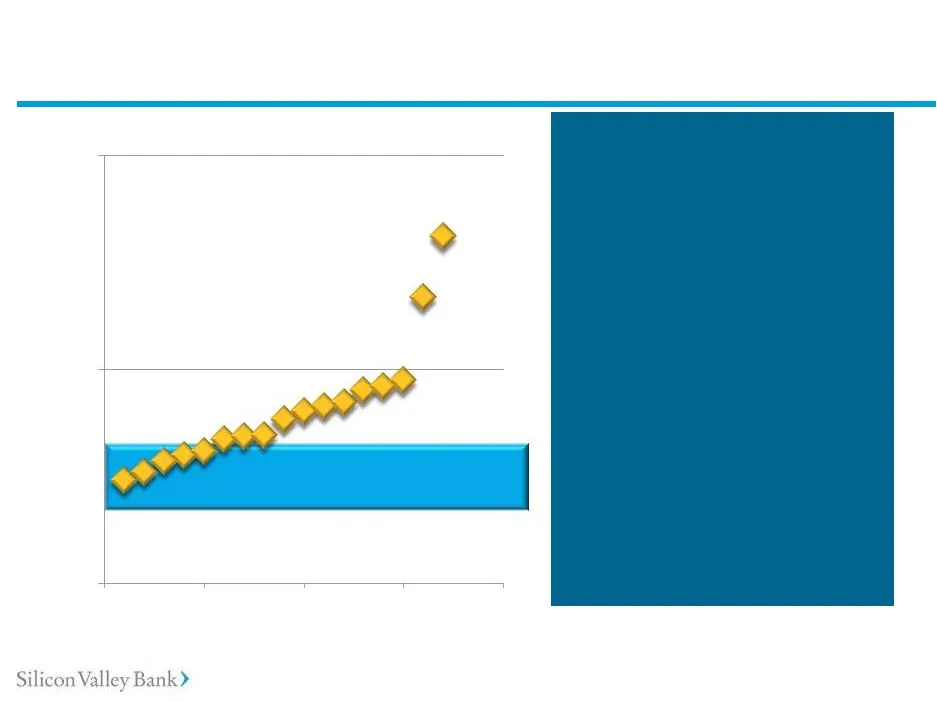
Slide 93: Street Estimates vs. SVB: Core Fee Income
SVB’s 2012 Outlook: Mid teens % Growth • “Core” is defined as fees for deposit services, letters of credit, business credit card, client investment, and foreign exchange, in aggregate. Based on published reports providing estimates as of 02/01/12. Certain estimates and adjustments have been made whe
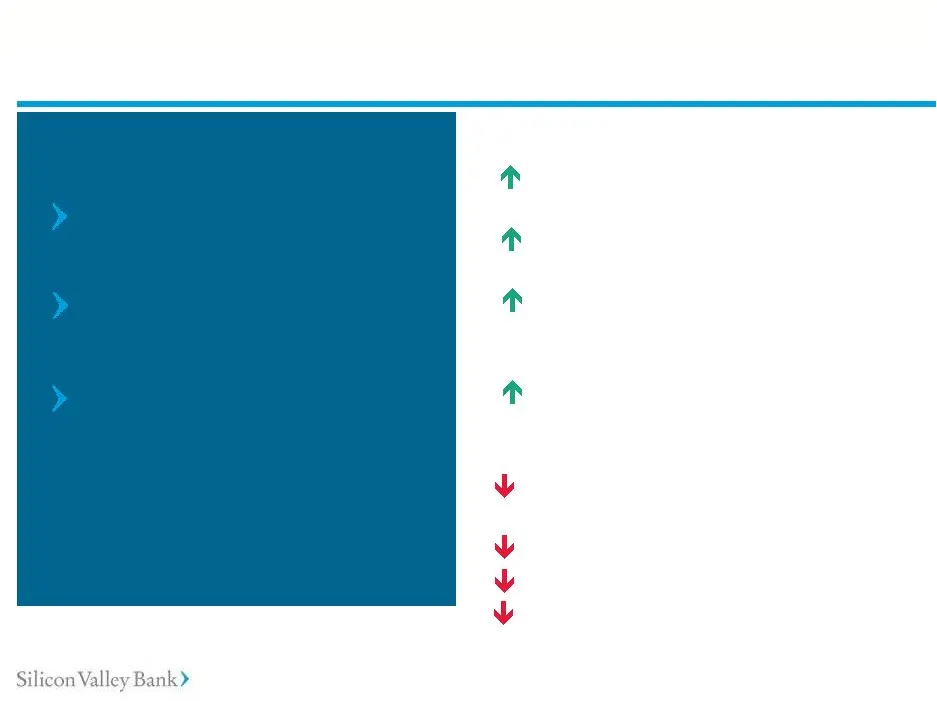
Slide 94: Drivers: Core Fee Income
Modest economic growth in 2012 Continued strength among our clients Continued solid demand for FX and credit card products Our Assumptions Drivers: “Core” Fee Income Significant economic improvement Significantly stronger large client acquisition Significant increase in demand for non-credit product
Slide 95: Street Estimates vs. SVB: Non-interest Expense
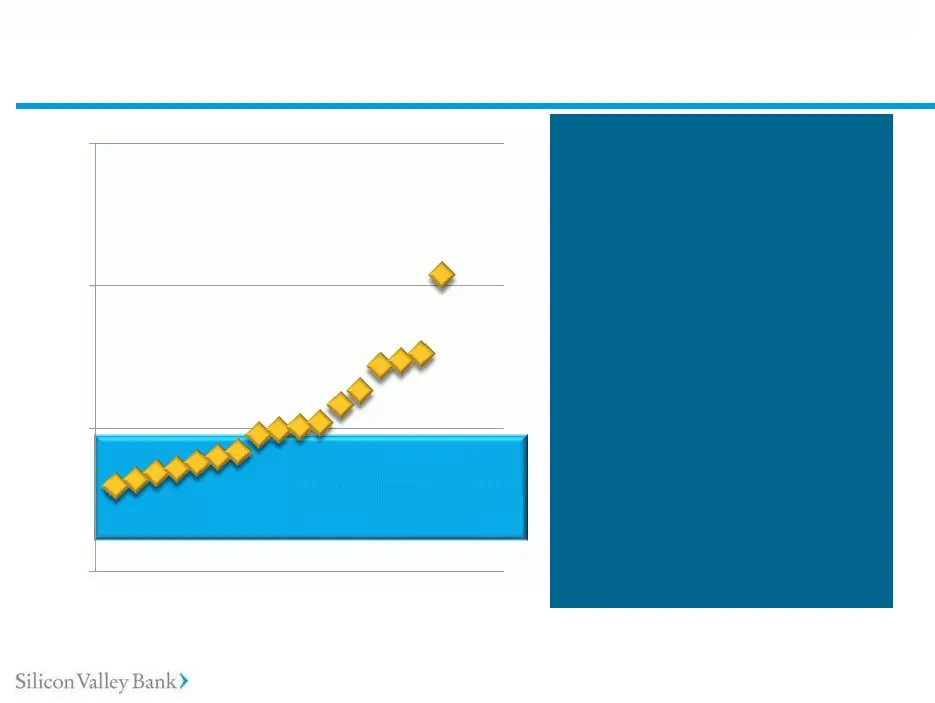
SVB’s 2012 Outlook: SVB’s Outlook Street Estimates vs. SVB: Non-interest Expense* Street Estimates vs. SVB: Non-interest Expense* High single digits % growth • Excludes expenses related to non-controlling interests. Based on published reports providing estimates as of 02/01/12. Certain estimates and
Slide 96: Drivers: Non-Interest Expense
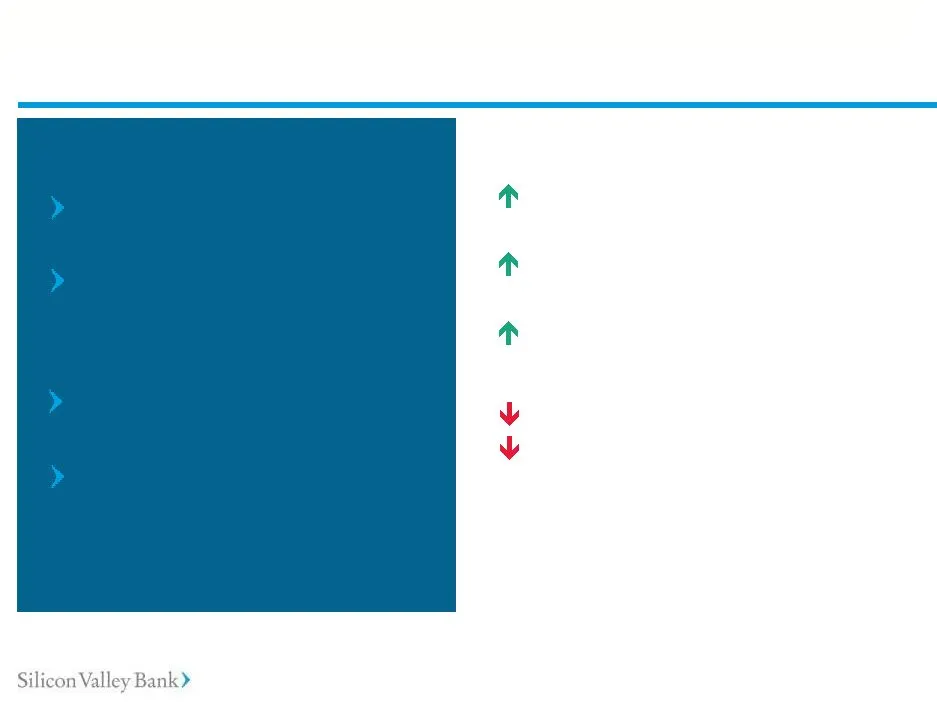
Our Assumptions Compensation at Increased headcount related to business development Building infrastructure to service global needs Impact of efficiency measures (Tempe) targeted levels Drivers: Non-Interest Expense Accelerators Exceptional business Rapid business/ headcount Higher credit costs Dece
Slide 97: Street Estimates vs. SVB: Net Charge-Offs
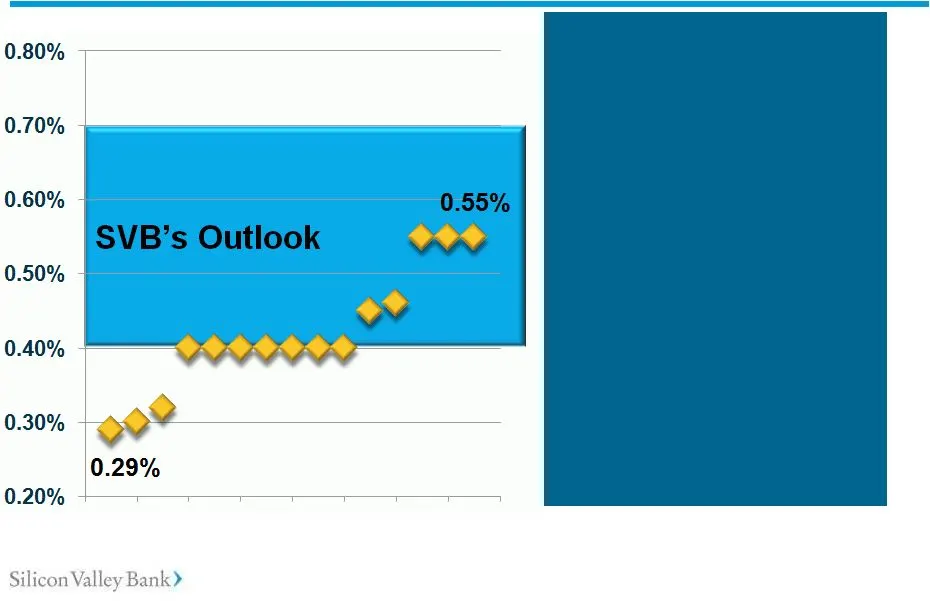
SVB’s 2012 Outlook: Street Estimates vs. SVB: Net Charge-Offs* Street Estimates vs. SVB: Net Charge-Offs* Between 0.40% to 0.70% of average total gross loans * Based on published reports providing estimates as of 02/01/12. Certain estimates and adjustments have been made where necessary. Please refe
Slide 98: Drivers: NCOs/Loans
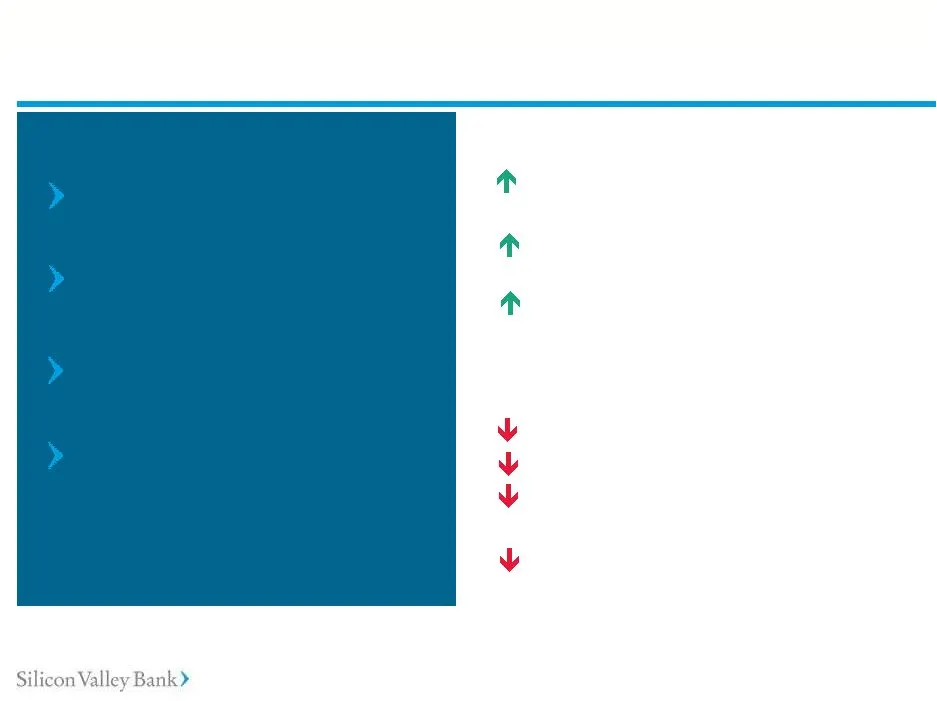
Modest economic growth in 2012 Continued strength among our clients VC Investment improves but remains low Solid pace of M&A for our clients Our Assumptions Drivers: NCOs/Loans Drivers: NCOs/Loans Strong economic improvement Significant increase in VC investment Significant increase in M&A/IPO activ
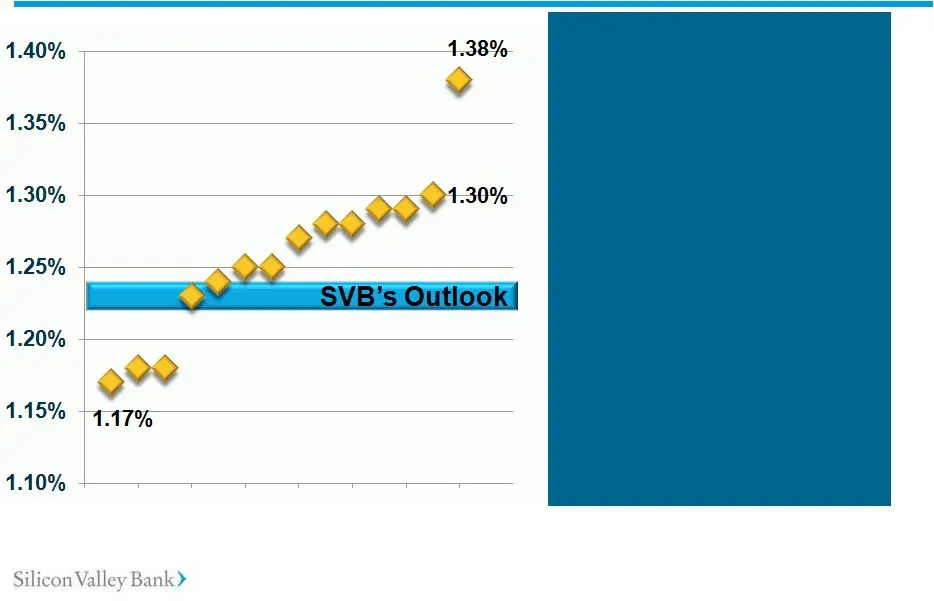
Slide 99: Street Estimates vs. SVB: ALLL
SVB 2012 Outlook: Street Estimates vs. SVB: ALLL* Street Estimates vs. SVB: ALLL* Comparable to 2011 Levels of 1.23% *SVB outlook is for ALLL for total gross performing loans as a percentage of total gross performing loans. Based on published reports providing estimates as of 02/01/12. Certain estim
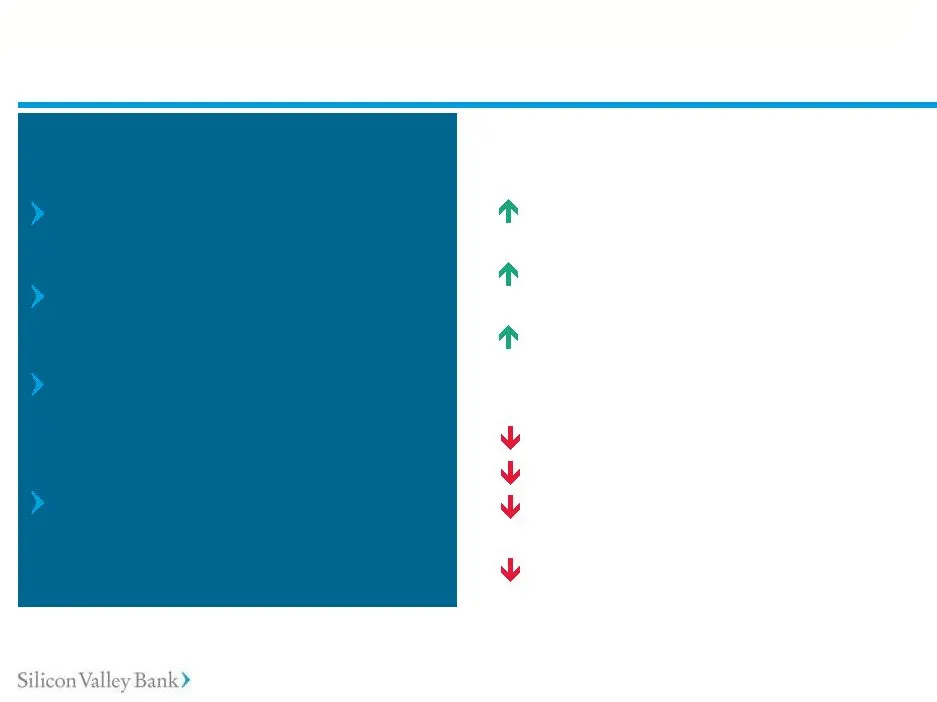
Slide 100: Drivers: ALLL
Strong client performance Modest economic growth VC Investment improves but remains low Strong tech spending Our Assumptions Drivers: ALLL Drivers: ALLL Positive Strong economic improvement Significant increase in VC investment Significant increase in M&A/IPO activity Negative Economic deterioration
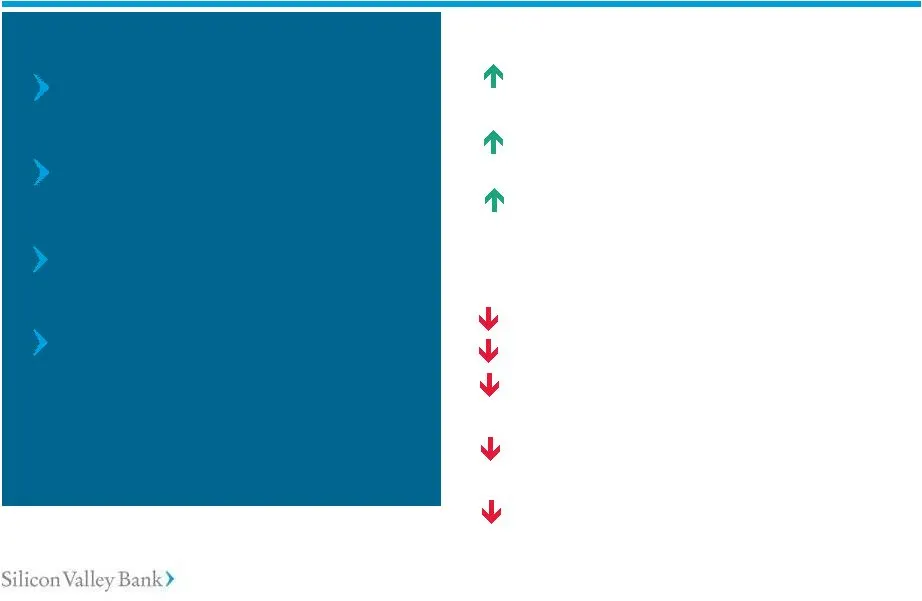
Slide 101: Investment Securities and Equity Warrant Drivers
Strong client performance Modest economic growth Modest improvement in VC investment Angels/Corporate venture continue to expand their role Our Assumptions Investment Securities and Equity Warrant Drivers Strong economic improvement Significant increase in VC investment Significant increase in M&A/I

Slide 102: Upside Drivers for ROE
Upside Drivers for ROE Rising interest rates Economic recovery Loan growth Non-credit income Efficiency ratio (operating leverage) Investments in the platform to support growth Recovering M&A and IPO activity Warrant gains Private Equity & VC-related investments Upside Drivers for ROE
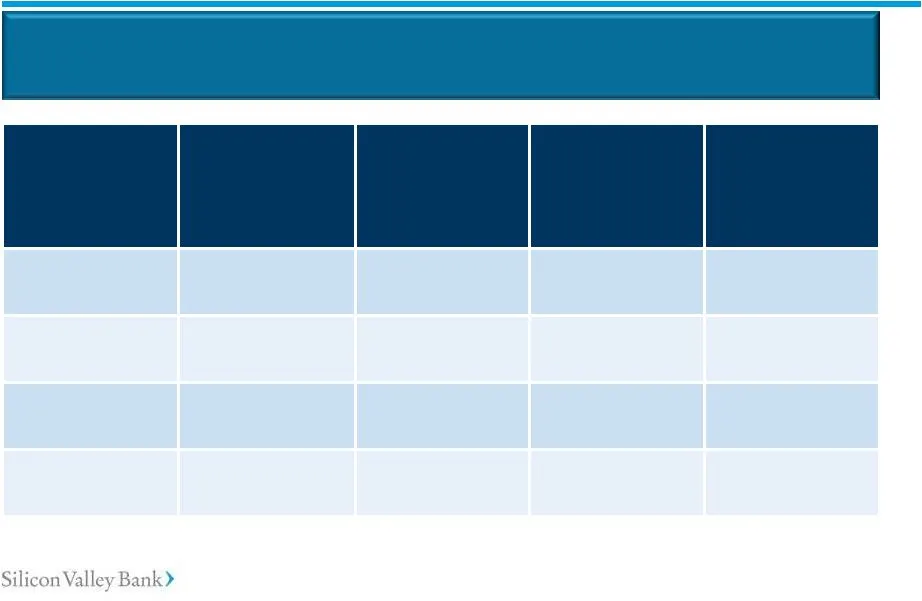
Slide 103: Higher Loan Balances Will Benefit Us
Growth in Overall Loan Balances ($$) Changes in Net Interest Income (tax effected) Incremental EPS Effect Incremental ROE Effect Net Interest Margin Effect We expect each $250 million increase in loan volume to contribute approximately $0.23 to EPS* Higher Loan Balances Will Benefit Us Higher Loan B
Slide 104: Rate Increases Will Benefit Us Significantly
Changes in Fed Funds Rate (basis points) Changes in Net Interest Income (tax effected) Incremental EPS Effect Incremental ROE Effect Net Interest Margin Effect We expect each 25 bps increase in the Fed Funds rate to contribute approximately $5 – $9 million to Net Interest Income* Rate Increases Will

Slide 105: Takeaways
Takeaways Our earnings are primarily driven by core banking activities We have consistently performed well over the long term We remain focused on managing expense growth We expect solid growth in 2012 Longer term, we expect improved leverage from investments in our platform Takeaways
Slide 106: SV B>
SV B> Silicon Valley Bank)

Slide 107: Loans: What's Driving Growth?
Loans: What’s Driving Growth? Dave Jones – Chief Credit Officer Joan Parsons – Head of U.S. Banking February 15, 2012 Loans: What’s Driving Growth?
Slide 108: Our Loan Portfolio Reflects Our Focus
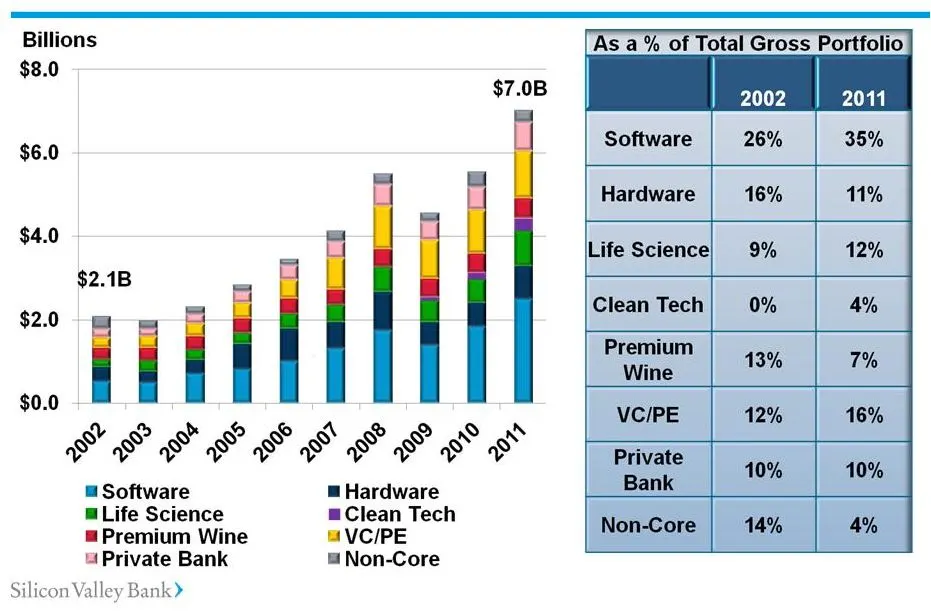
Our Loan Portfolio Reflects Our Focus Our Loan Portfolio Reflects Our Focus

Slide 109: What's Happened in 10 Years?
What’s Happened in 10 Years? We have increased our share of larger, more stable credit clients Early stage loans have become a smaller portion of the portfolio Average loan size has increased from $0.6M to $1.8M Credit quality has become more stable What’s Happened in 10 Years?
Slide 110: A Diversified, Well-Performing Portfolio
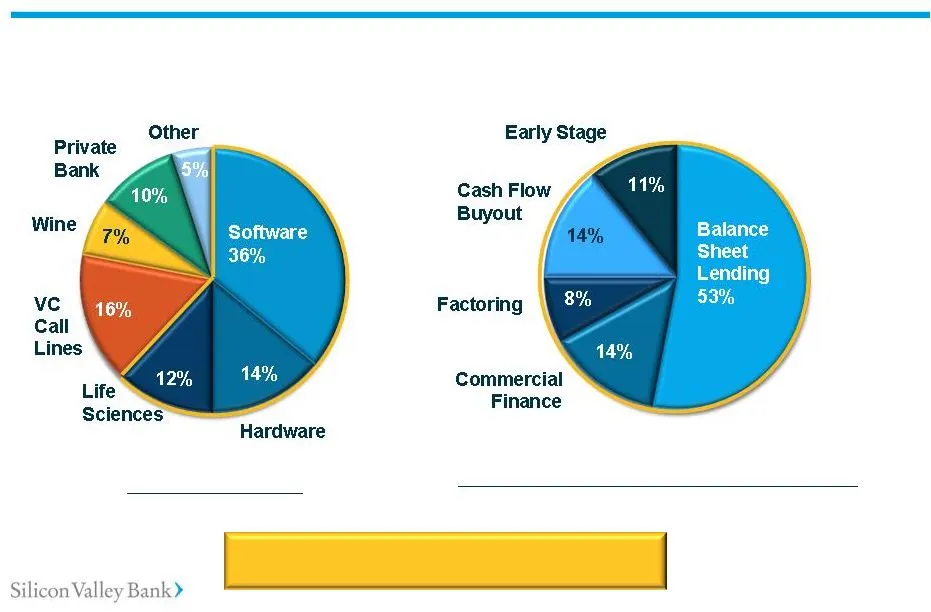
Focused but well diversified within technology lending Total Loan Portfolio $7.0 Billion as of 12/31/11 A Diversified, Well-Performing Portfolio A Diversified, Well-Performing Portfolio Early Stage Loans $487 Million (7% of Total Portfolio) Technology and Life Sciences Portfolio Only $4.3 Billion (6

Slide 111: Loan Growth Drivers
Loan Growth Drivers 111 Loan Growth Drivers

Slide 112: Recent Loan Growth Drivers
Recent Loan Growth Drivers Segmentation Global expansion Private Bank Recent Loan Growth Drivers SVB Growth Initiatives Continued client activity and momentum

Slide 113: Larger Clients Are Driving Growth
Larger Clients Are Driving Growth Larger Clients Are Driving Growth
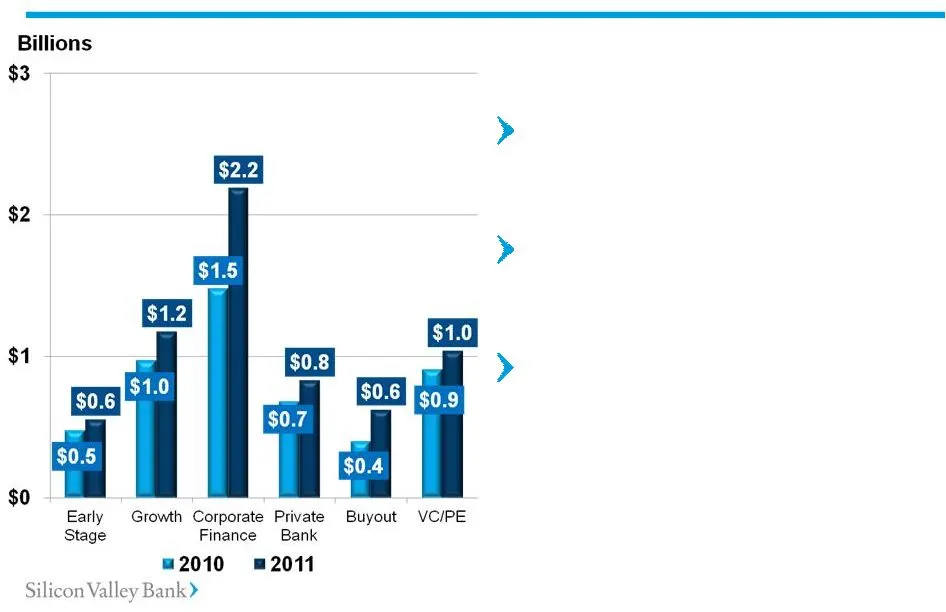
Slide 114: Loan Growth Dynamics
Loan Growth Dynamics Loan Growth Dynamics Increase in average loan size Higher utilization of commitments Change in client mix

Slide 115: Larger Loans
Larger Loans 115 Larger Loans
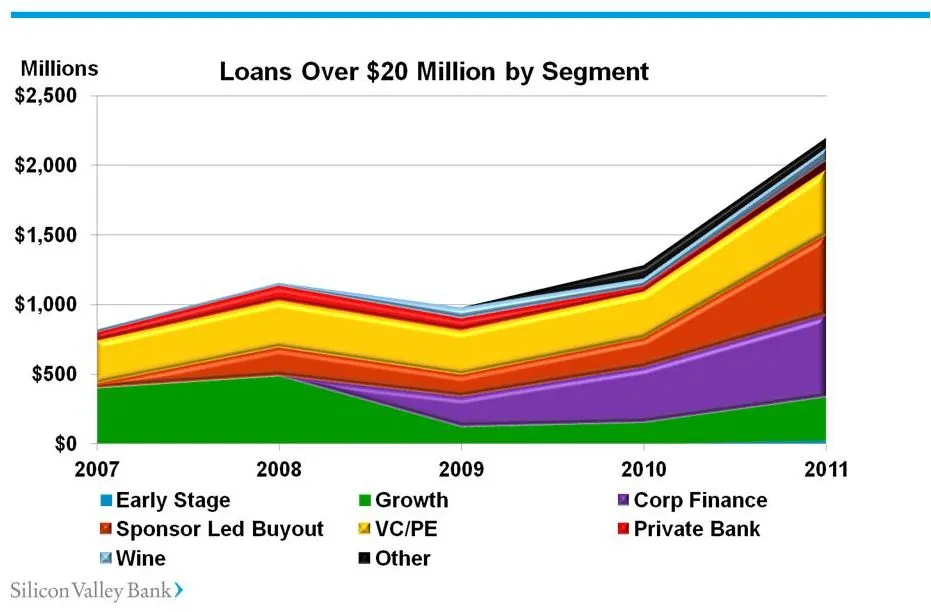
Slide 116: Dynamic Larger Loan Balances
Dynamic Larger Loan Balances Dynamic Larger Loan Balances
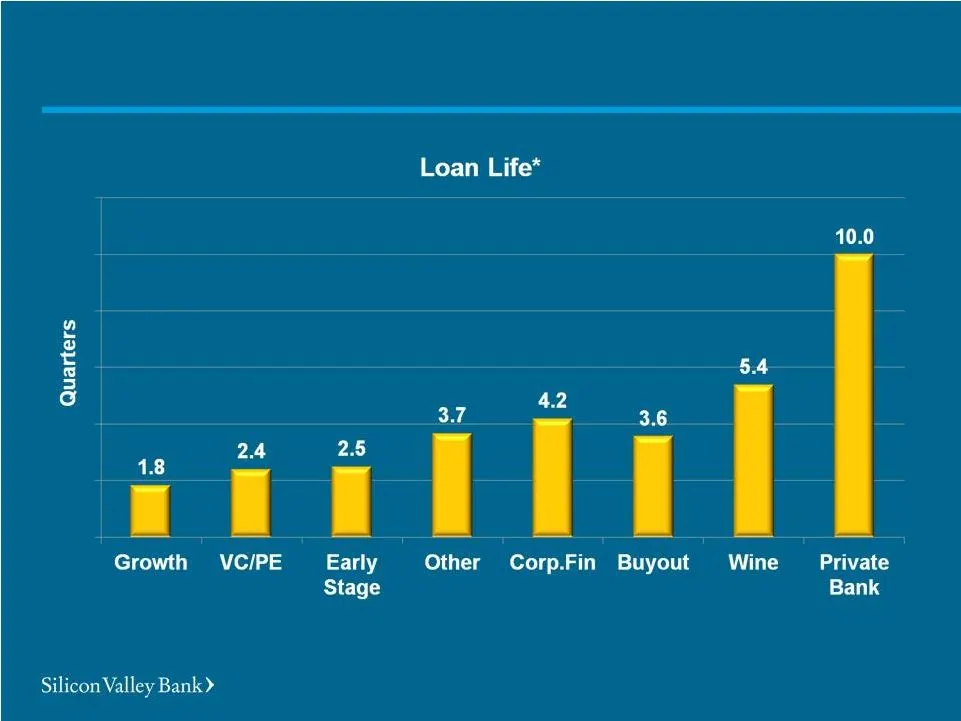
Slide 117: Dynamic Larger Loan Balances
Dynamic Larger Loan Balances *Average life over 20 quarters of loans larger than $20MM by Segment Dynamic Larger Loan Balances
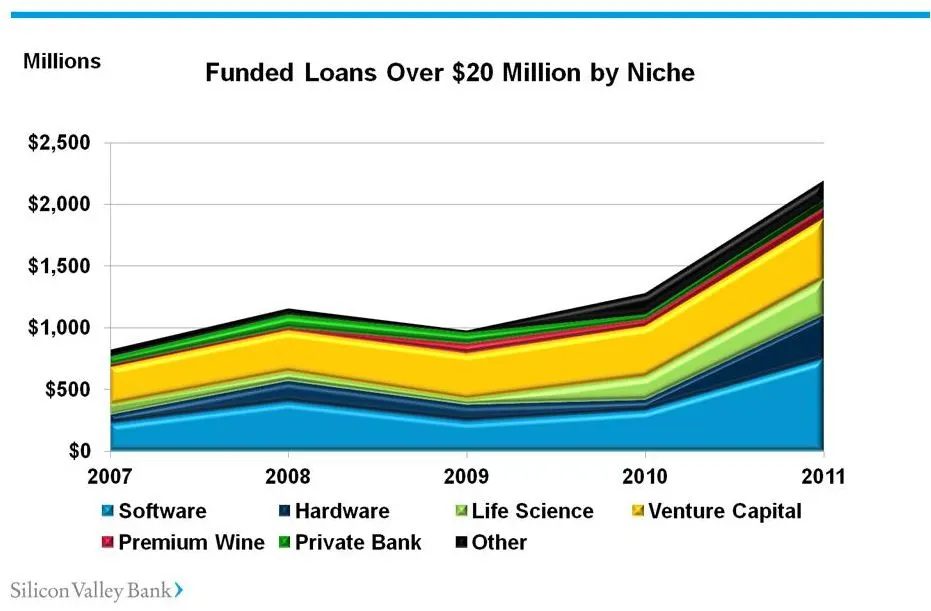
Slide 118: Dynamic Larger Loan Balances
Dynamic Larger Loan Balances Dynamic Larger Loan Balances
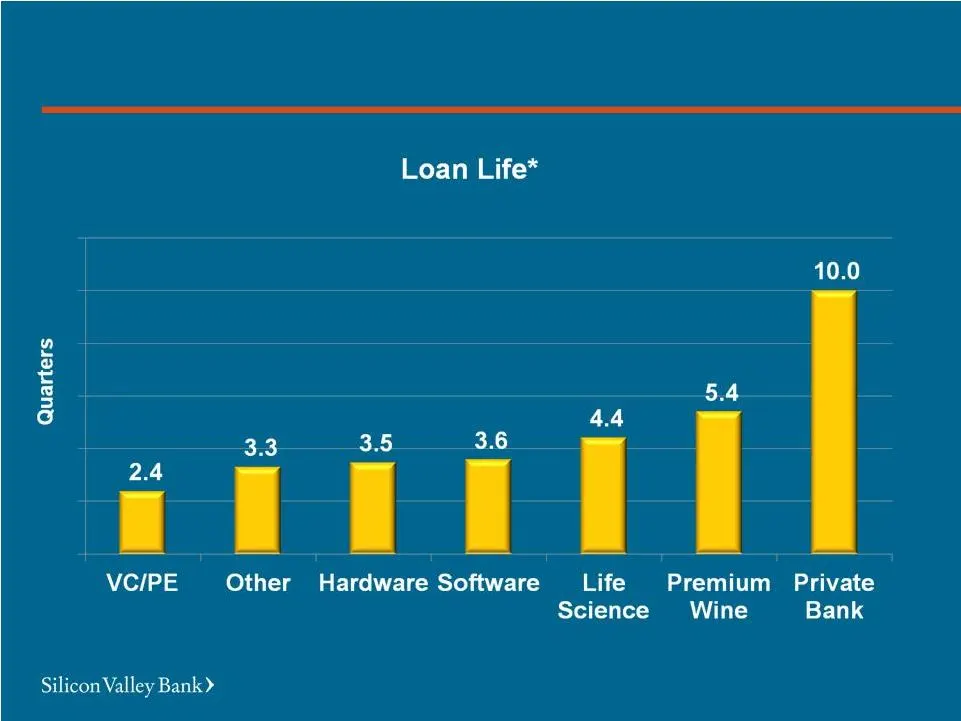
Slide 119: Dynamic Larger Loan Balances
Dynamic Larger Loan Balances *Average life over 20 quarters of loans larger than $20MM Dynamic Larger Loan Balances
Slide 120: Larger Clients Deliver Higher ROE
Early Stage Growth Corporate Finance Larger Clients Deliver Higher ROE Larger Clients Deliver Higher ROE Average loan size $0.5 million $2.3 million $6.6 million Use of non-credit products Low High High Global activity Low High High
Slide 121: Domestic Opportunity
Accelerator Growth Corp Finance VC/PE Private Bank Wine Domestic Opportunity Domestic Opportunity Market Direction SVB Opportunity 0-2 Years SVB Opportunity 3-5 Years High Medium Low Growing Market Stable market

Slide 122: Credit Quality
Credit Quality Credit Quality
Slide 123: Low Historic Credit Costs
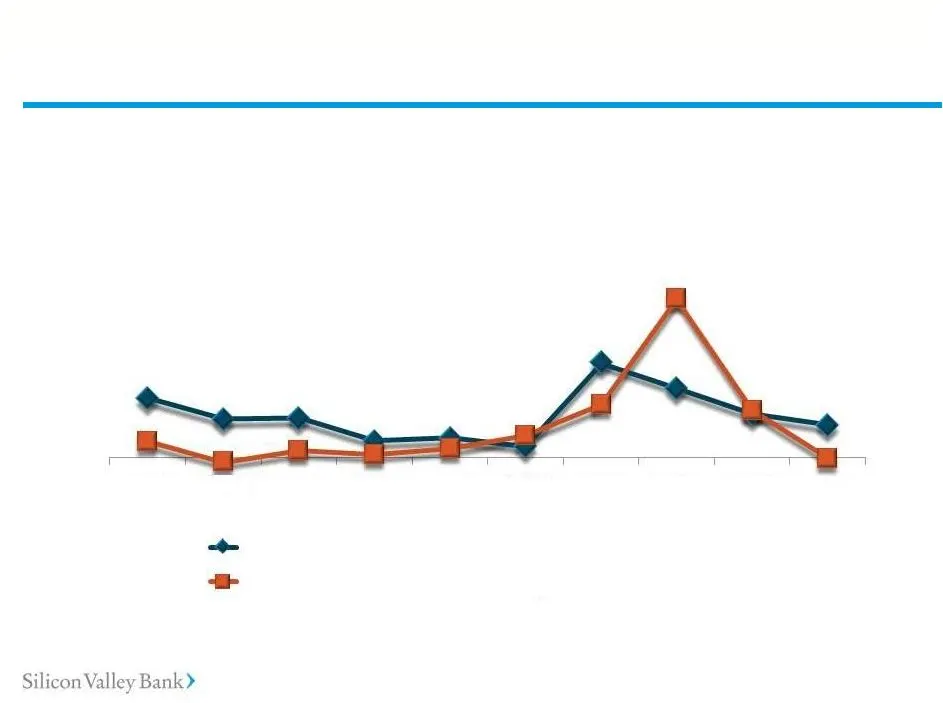
Low Historic Credit Costs Low Historic Credit Costs 1% 0% 1% 2% 3% 4% 5% 2002 2003 2004 2005 2006 2007 2008 2009 2010 2011 NPLs as % of Total Gross Loans NCOs as % of Total Average Gross Loans NCOs: Historical Average: 0.51% Outlook: 0.40% - 0.70% NPLs: Historical Average: 0.69% Outlook: <0.52%
Slide 124: Positive Outlook for Credit Quality
Business Driver 2012 outlook 1) Positive Outlook for Credit Quality Positive Outlook for Credit Quality Outlook Outlook 1) Outlook is for the full year 2012 as compared to the full year 2011. Please see our most recent financial releases for more information. 2) Allowance for total gross performing

Slide 125: Longer-Term Credit Drivers
Longer-Term Credit Drivers Continued positive client performance and strength in client industries Gradual economic recovery Solid pace of M&A for our clients Continued early-stage investment Longer-Term Credit Drivers

Slide 126: Takeaways
Takeaways High-quality, diversified loan portfolio Recent growth from larger loans to larger clients These clients typically have more stable credit experiences and use more fee- based products Early-stage smaller, but remains strategic Significant growth from segmentation and global initiatives Tak

Slide 127: Building a Scalable Platform For Growth
Building a Scalable Platform For Growth Bruce Wallace Chief Operations Officer February 15, 2012 Building a Scalable Platform For Growth

Slide 128: Overview
Overview Focus on key growth areas What we’re doing to grow Investing in people, products and infrastructure New global capabilities How we’re working with clients Results: today and in the future Overview
Slide 129: Diversified Growth Across the Business
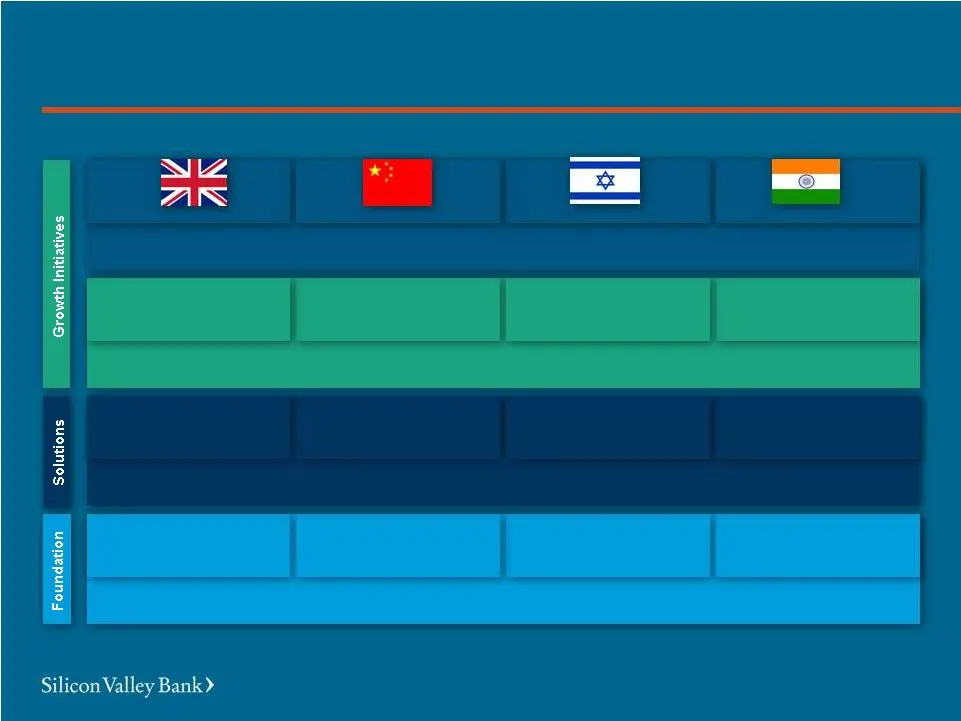
Diversified Growth Across the Business UK and Europe China Israel India GLOBAL MARKETS & REACH Growth Segment Corporate Finance Segment Private Bank Client Experience CLIENT NEEDS New Products & Services Enhanced Credit Solutions Expanded Banking Network New Payment Solutions PRODUCT LINES New Globa

Slide 130: What We're Doing to Grow
What We’re Doing to Grow What We’re Doing to Grow Investing in people Developing new products and services Enhancing our infrastructure …GLOBALLY

Slide 131: Silicon Valley Bank)
Silicon Valley Bank)

Slide 132: Investing in People
Investing in People Global banking experience Domain expertise Global shared services model Investing in People

Slide 133: Supporting Our Global Expansion
Supporting Our Global Expansion New Senior Management Positions Head of Global Transaction Banking Head of Product Development and Head of Global Treasury Sales Head of Global Payment Solutions Channel Delivery Supporting Our Global Expansion

Slide 134: Products & Services
Products & Services Products & Services

Slide 135: Products & Services
Products & Services Products & Services

Slide 136: New Products & Services
New Products & Services Mobile Merchant Services Enterprise Sweep accounts (off-balance sheet) Smart Data Expense Management New Products & Services

Slide 137: New Products & Services
New Products & Services Smart Chip Payment Solutions Global Payment Services Offshore RMB (Global Treasury Services) New Products & Services

Slide 138: Enhancing Our Infrastructure
Enhancing Our Infrastructure Enhancing Our Infrastructure

Slide 139: Enhancing Our Infrastructure
Enhancing Our Infrastructure Global banking platform Integrated channel delivery solutions Industry-leading client experience Strengthening our IT and information security Enhancing Our Infrastructure
Slide 140: Investment in Our Growth
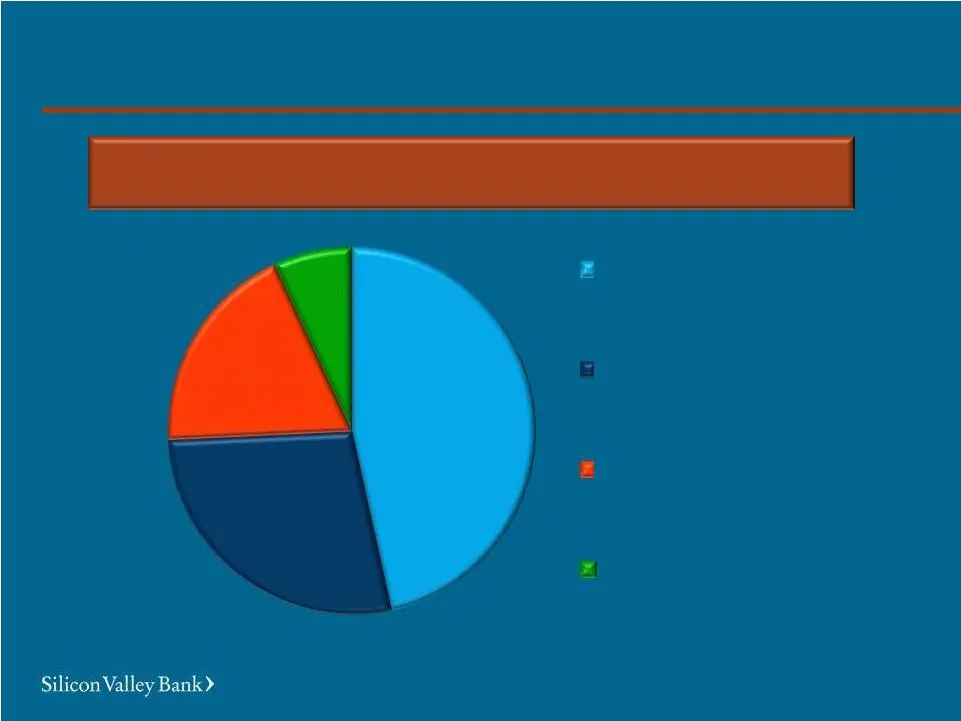
Enterprise Infrastructure Channel Delivery Global Expansion Investment in Our Growth Other 47% 28% 19% 7% Project Portfolio Spend = 15% of Total Operations and IT Budget in 2011 Investment in Our Growth Project Portfolio Spend = 15% of Total Operations and IT Budget in 2011
Slide 141: What Do We Expect in 2012?
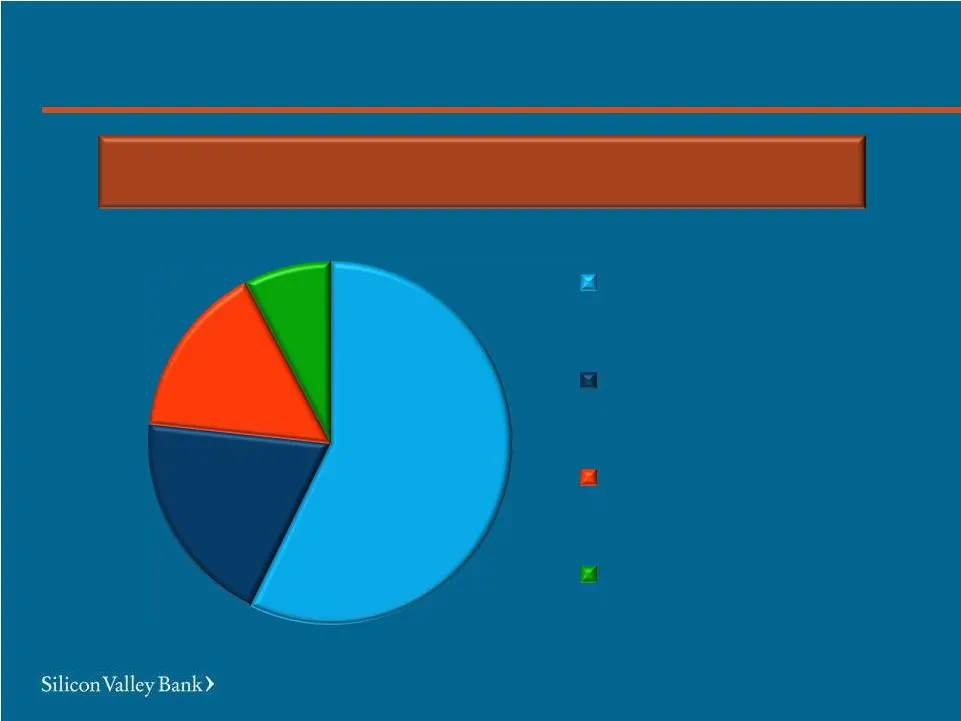
What Do We Expect in 2012? Projected Project Portfolio Spend = 19% of Total Operations and IT Budget in 2012 Other 59% 20% 16% 8% Enterprise Infrastructure Global Expansion Channel Delivery What Do We Expect in 2012? Projected Project Portfolio Spend = 19% of Total Operations and IT Budget in 2012
Slide 142: How It Translates into Our Capabilities
How It Translates into Our Capabilities CAGR 2009-2011 (Dollar volumes) How It Translates into Our Capabilities CAGR 2009-2011 (Dollar volumes) Foreign Exchange Trades 35% International Payments 75% Global Treasury Accounts 40% Multi-Currency Balances 62% Card Transactions 73%
Slide 143: How It Translates into Our Capabilities
How It Translates into Our Capabilities How It Translates into Our Capabilities

Slide 144: How We're Working With Clients
How We’re Working With Clients How We’re Working With Clients
Slide 145: Our Global Platform Is Driving Growth
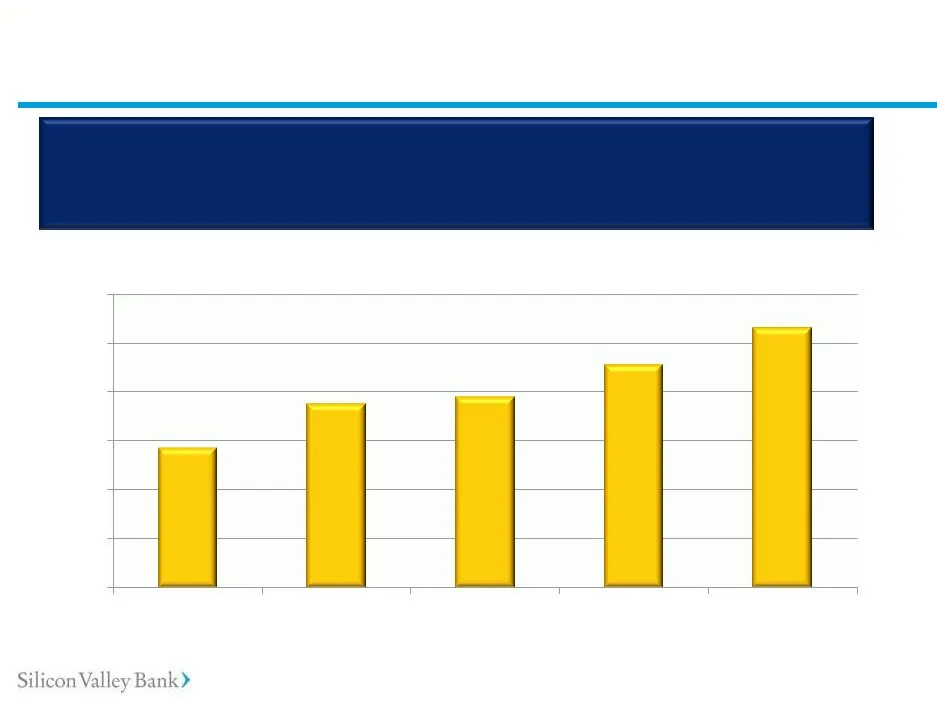
Global Treasury Management and Payment Services continue to be critical to long-term earnings growth Our Global Platform Is Driving Growth Our Global Platform Is Driving Growth $57 $106 $0 $20 $40 $60 $80 $100 $120 2007 2008 2009 2010 2011 Millions

Slide 146: Numbers Don't Tell the Whole Story
Numbers Don’t Tell the Whole Story Revenues and relationships we would not have captured without global presence Cross-border activity Higher per-client use of international products Increased client activity enabled by a single global platform Numbers Don’t Tell the Whole Story Our investments are

Slide 147: Takeaways
Takeaways We are investing in a scalable infrastructure for growth Our investments are enabling us to provide global products and services to clients Client service and client experience remain key competitive advantages for us Takeaways
Slide 148: SV B>
SV B> Silicon Valley Bank)

Slide 149: Summary and Milestones
Summary and Milestones Greg Becker - President & Chief Executive Officer Mike Descheneaux - Chief Financial Officer February 15, 2012 Summary and Milestones

Slide 150: What We Covered Today
What We Covered Today Who we are and what we do Our recent financial performance Our growth strategy and expectations The cool things our clients do. What We Covered Today

Slide 151: Financial Goals 2012–2015
Financial Goals 2012–2015 * “Core” excludes gains/losses on investment securities and gains/losses on equity warrants ~10%+ ROE in low rate environment ~15%+ in normal rate environment ~15%+ Core * EPS growth rate per year with flat rates ~20%+ with increasing rates Financial Goals 2012–2015 High-Pe

Slide 152: What Else Do We Track?
What Else Do We Track? Net Promoter Score Employee engagement Revenue growth (excluding warrants and securities)/expense growth Product penetration Market share

Slide 153: Summary
Summary We are a differentiated global bank with a long history of outperformance We have consistently made the right decisions to foster long-term growth Our focus on innovation markets offers us a unique opportunity for growth Summary

Slide 154: Summary
Summary Our experience, expertise and capabilities give us a significant competitive advantage We have the ability and the means to execute on our growth plans Summary
Slide 155: SV B>
SV B> Silicon Valley Bank)
Source: SEC EDGAR · 8-K filed Feb 15, 2012
More decks from SVB Financial Group
 Investor Presentation (February 2024)8 slides · Feb 9, 2024
 Presentation (January 2024)35 slides · Jan 10, 2024
 IPO Roadshow (March 2023)30 slides · Mar 9, 2023
 Merger or Acquisition (January 2021)15 slides · Jan 4, 2021
 Q1 2020 Earnings Presentation54 slides · May 4, 2020
 Q1 2020 Earnings Presentation37 slides · Apr 23, 2020