Plains Exploration & Production Company
Plains Exploration & Production — Howard Weil 33rd Annual Energy Conference 2005
36 slides from Plains Exploration & Production's conference presentation, Apr 4, 2005
Slide 1: Howard Weil 33rd Annual Energy Conference
Howard Weil 33rd Annual Energy Conference April 2005
Slide 2: Forward Looking Statements
Forward Looking Statements Except for the historical information contained herein, the matters discussed in this presentation are forward-looking statements that involve certain assumptions and known and unknown risks, uncertainties and other factors that could cause our actual results to differ mat
Slide 3: Company History
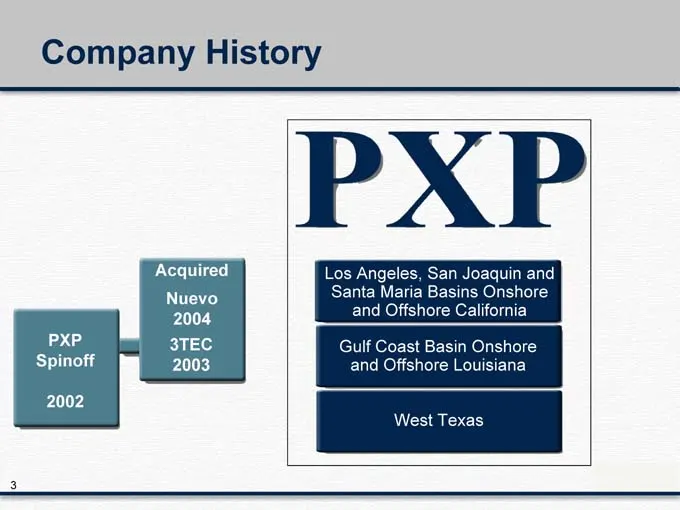
Company History PXP Spinoff Acquired Nuevo 3TEC Los Angeles, San Joaquin and Santa Maria Basins Onshore and Offshore California Gulf Coast Basin Onshore and Offshore Louisiana West Texas
Slide 4: Large Durable Oil Resource Base
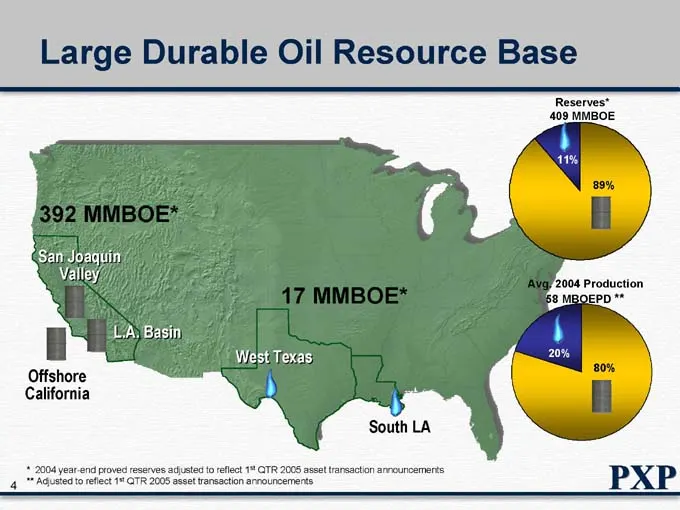
Large Durable Oil Resource Base 392 MMBOE* San Joaquin Valley Offshore California L.A. Basin 17 MMBOE* West Texas South LA Reserves* 409 MMBOE 11% 89% Avg. 2004 Production 58 MBOEPD ** 20% 80% * 2004 year-end proved reserves adjusted to reflect 1st QTR 2005 asset transaction announcements ** Adjuste
Slide 5: PXP: Uniquely Positioned to Create Value
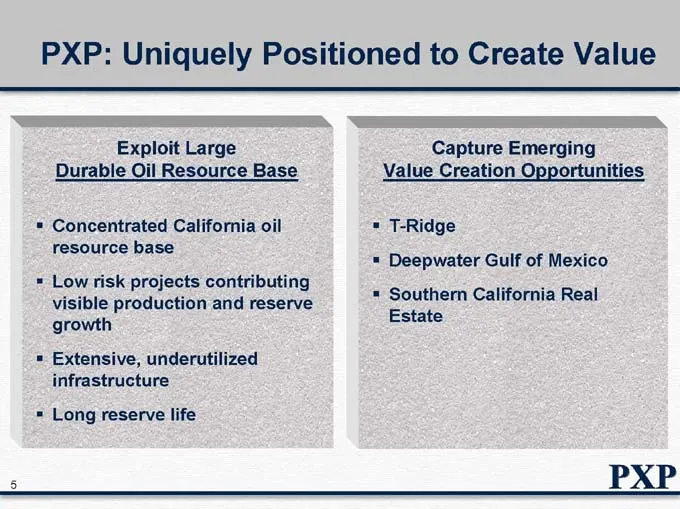
PXP: Uniquely Positioned to Create Value Exploit Large Durable Oil Resource Base Concentrated California oil resource base Low risk projects contributing visible production and reserve growth Extensive, underutilized infrastructure Long reserve life Capture Emerging Value Creation Opportunities T-Ri
Slide 6: PXP—Western Development Unit
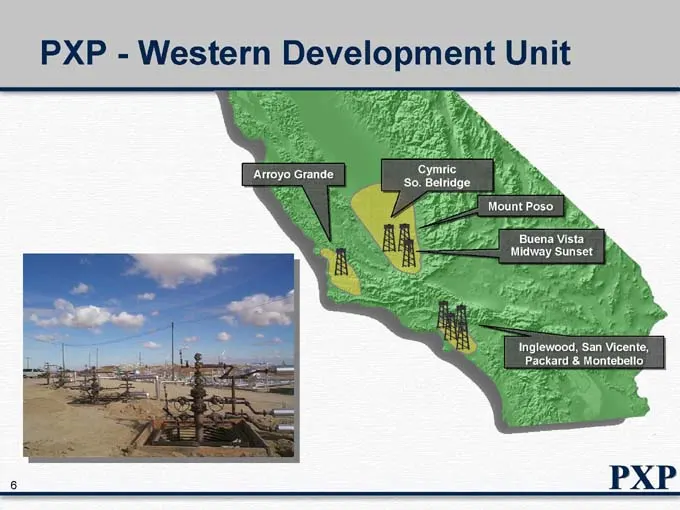
PXP—Western Development Unit Arroyo Grande Cymric So. Belridge Mount Poso Buena Vista Midway Sunset Inglewood, San Vicente, Packard & Montebello
Slide 7: California's Historical Oil Production
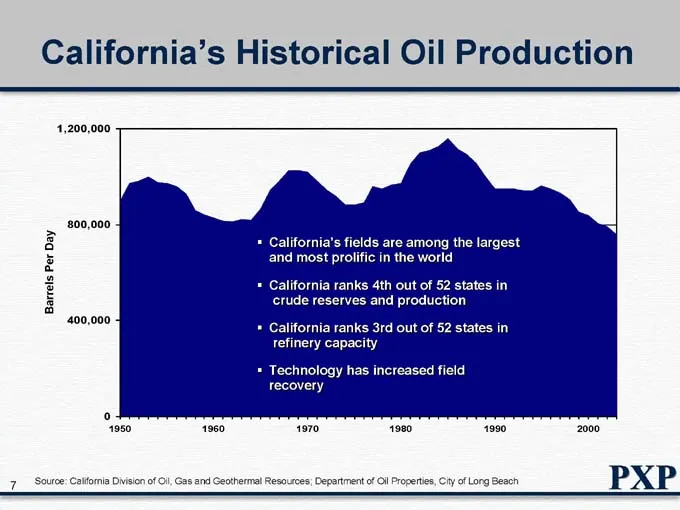
California’s Historical Oil Production Barrels Per Day 1,200,000 800,000 400,000 1950 1960 1970 1980 1990 2000 California’s fields are among the largest and most prolific in the world California ranks 4th out of 52 states in crude reserves and production California ranks 3rd out of 52 states in refi
Slide 8: San Joaquin Valley—Regional Cross Section
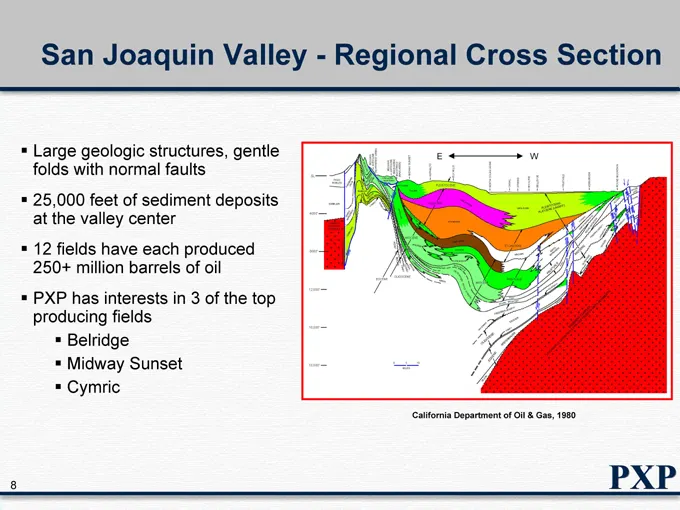
San Joaquin Valley—Regional Cross Section Large geologic structures, gentle folds with normal faults 25,000 feet of sediment deposits at the valley center 12 fields have each produced 250+ million barrels of oil PXP has interests in 3 of the top producing fields Belridge Midway Sunset Cymric Califor
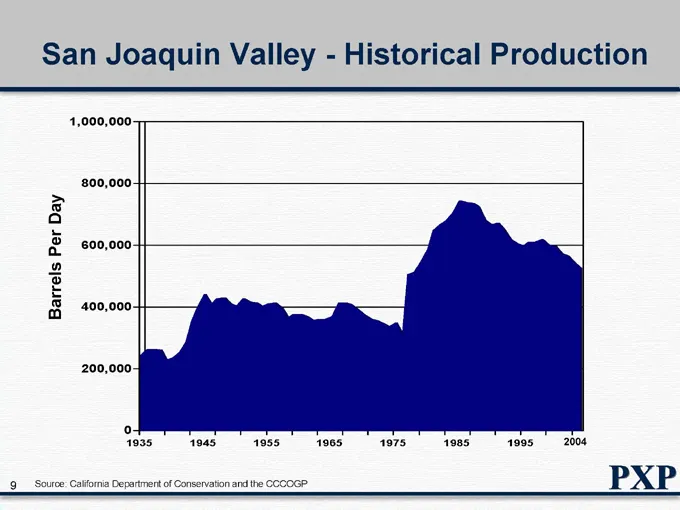
Slide 9: San Joaquin Valley—Historical Production
San Joaquin Valley—Historical Production Barrels Per Day 1,000,000 800,000 600,000 400,000 200,000 0 1935 1945 1955 1965 1975 1985 1995 2004 Source: California Department of Conservation and the CCCOGP
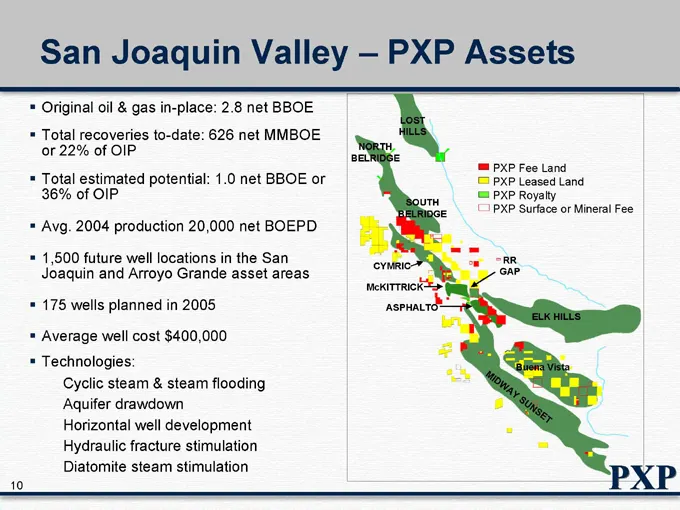
Slide 10: San Joaquin Valley – PXP Assets
San Joaquin Valley – PXP Assets Original oil & gas in-place: 2.8 net BBOE Total recoveries to-date: 626 net MMBOE or 22% of OIP Total estimated potential: 1.0 net BBOE or 36% of OIP Avg. 2004 production 20,000 net BOEPD 1,500 future well locations in the San Joaquin and Arroyo Grande asset areas 175
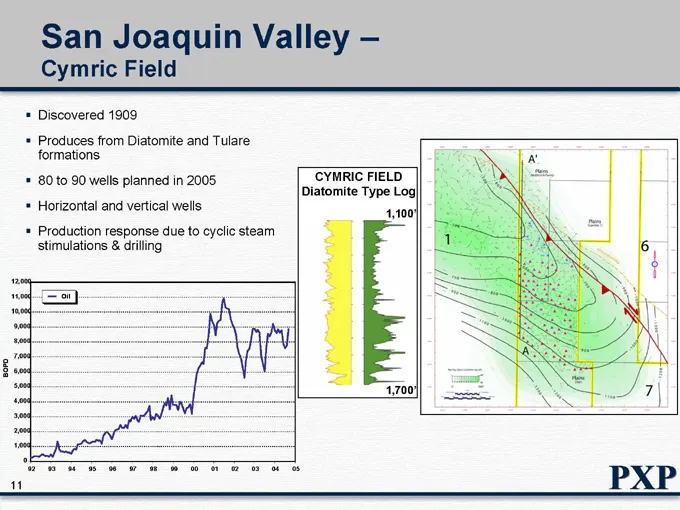
Slide 11: San Joaquin Valley – Cymric Field
San Joaquin Valley – Cymric Field Discovered 1909 Produces from Diatomite and Tulare formations 80 to 90 wells planned in 2005 Horizontal and vertical wells Production response due to cyclic steam stimulations & drilling BOPD 12,000 11,000 10,000 9,000 8,000 7,000 6,000 5,000 4,000 3,000 2,000 1,000
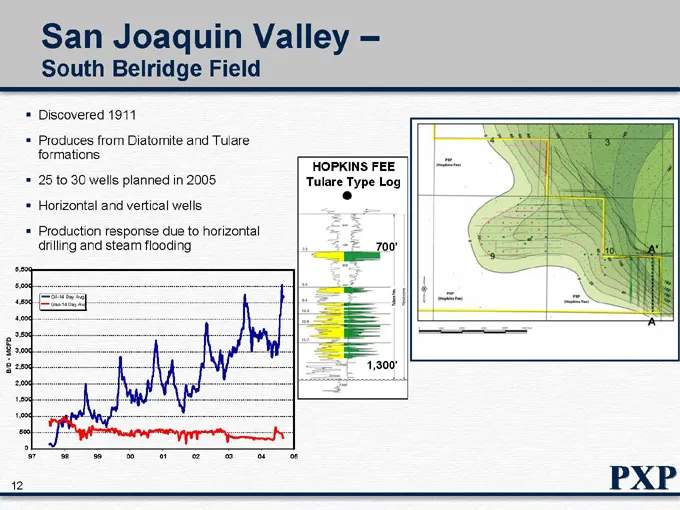
Slide 12: San Joaquin Valley – South Belridge Field
San Joaquin Valley – South Belridge Field Discovered 1911 Produces from Diatomite and Tulare formations 25 to 30 wells planned in 2005 Horizontal and vertical wells Production response due to horizontal drilling and steam flooding B/D—MCFD 5,500 5,000 4,500 4,000 3,500 3,000 2,500 2,000 1,500 1,000
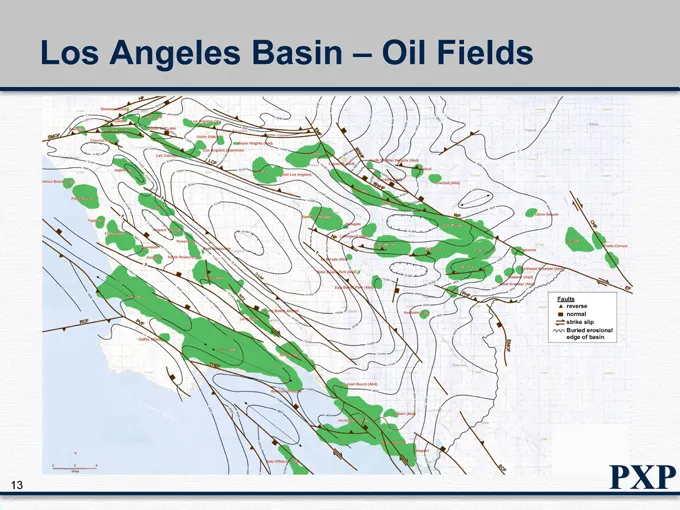
Slide 13: Los Angeles Basin – Oil Fields
Los Angeles Basin – Oil Fields
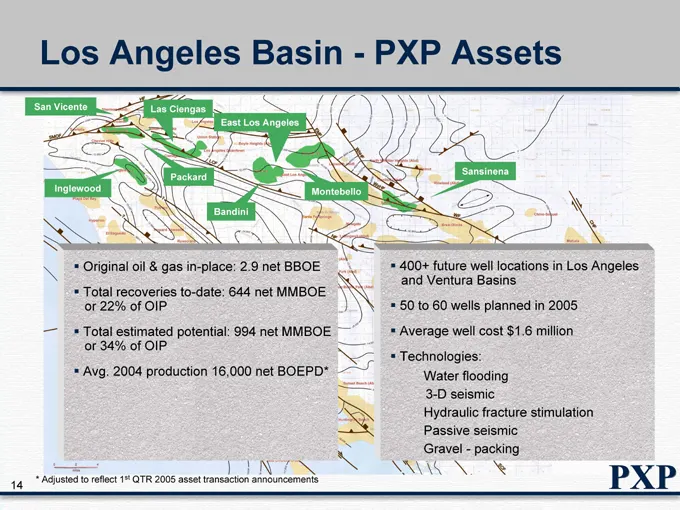
Slide 14: Los Angeles Basin—PXP Assets
Los Angeles Basin—PXP Assets San Vicente Inglewood Las Ciengas Packard East Los Angeles Bandini Montebello Sansinena Original oil & gas in-place: 2.9 net BBOE Total recoveries to-date: 644 net MMBOE or 22% of OIP Total estimated potential: 994 net MMBOE or 34% of OIP Avg. 2004 production 16,000 net
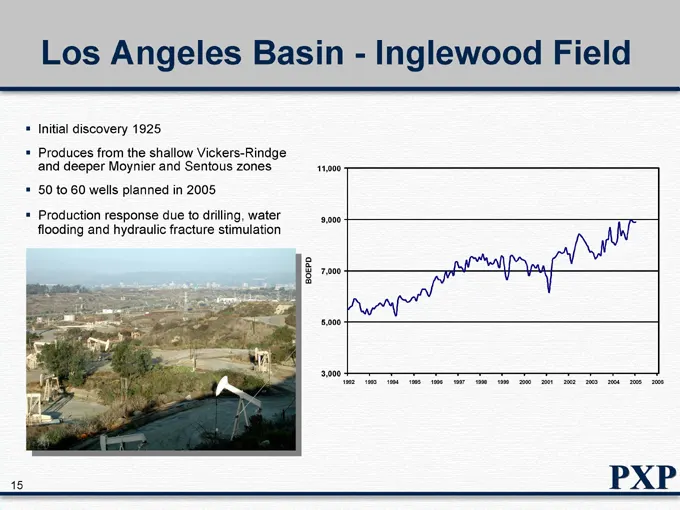
Slide 15: Los Angeles Basin—Inglewood Field
Los Angeles Basin—Inglewood Field Initial discovery 1925 Produces from the shallow Vickers-Rindge and deeper Moynier and Sentous zones 50 to 60 wells planned in 2005 Production response due to drilling, water flooding and hydraulic fracture stimulation BOEPD 11,000 9,000 7,000 5,000 3,000 1992 1993
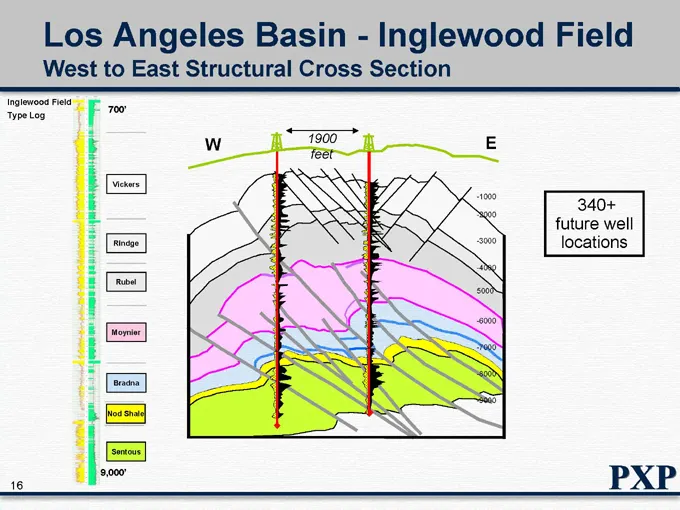
Slide 16: Inglewood Field West to East Structural Cross Section
Los Angeles Basin—Inglewood Field West to East Structural Cross Section Inglewood Field Type Log 700’ Vickers Rindge Rubel Moynier Bradna Nod Shale Sentous 9,000’ W 1900 feet E -1000 -2000 -3000 -4000 5000 -6000 -7000 -8000 -9000 340+ future well locations
Slide 17: Eastern Development Unit
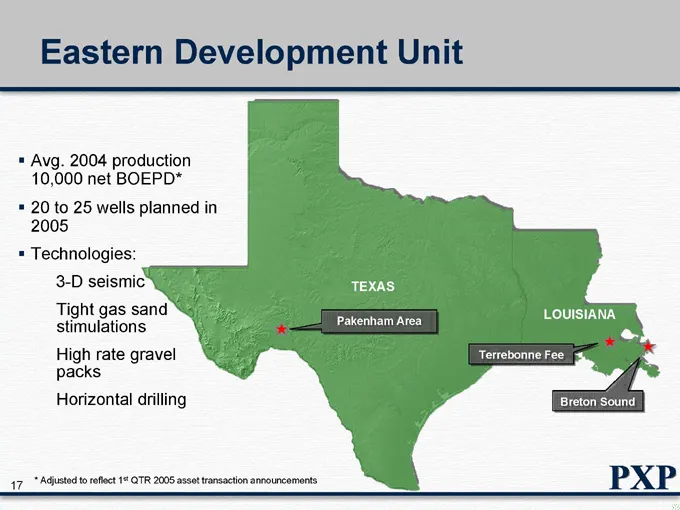
Eastern Development Unit Avg. 2004 production 10,000 net BOEPD* 20 to 25 wells planned in 2005 Technologies: 3-D seismic Tight gas sand stimulations High rate gravel packs Horizontal drilling TEXAS Pakenham Area LOUISIANA Terrebonne Fee Breton Sound * Adjusted to reflect 1st QTR 2005 asset transacti
Slide 18: PXP—Reserve Replacement Statistics
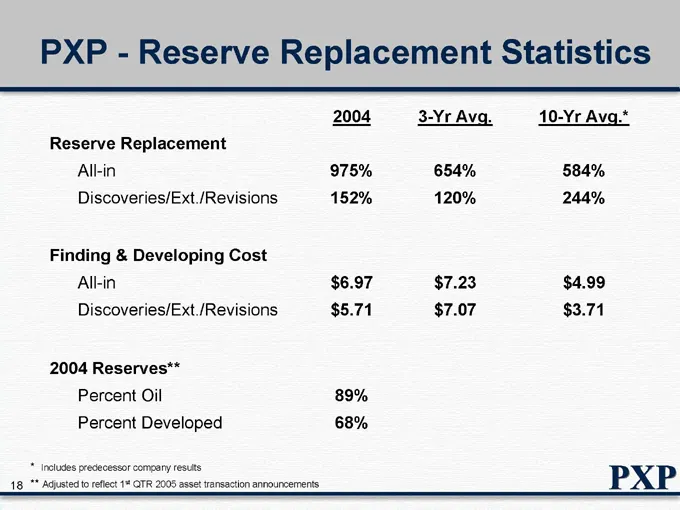
PXP—Reserve Replacement Statistics 2004 3-Yr Avg. 10-Yr Avg.* Reserve Replacement All-in 975% 654% 584% Discoveries/Ext./Revisions 152% 120% 244% Finding & Developing Cost All-in $6.97 $7.23 $4.99 Discoveries/Ext./Revisions $5.71 $7.07 $3.71 2004 Reserves** Percent Oil 89% Percent Developed 68% * In
Slide 19: PXP—Emerging Growth Opportunities
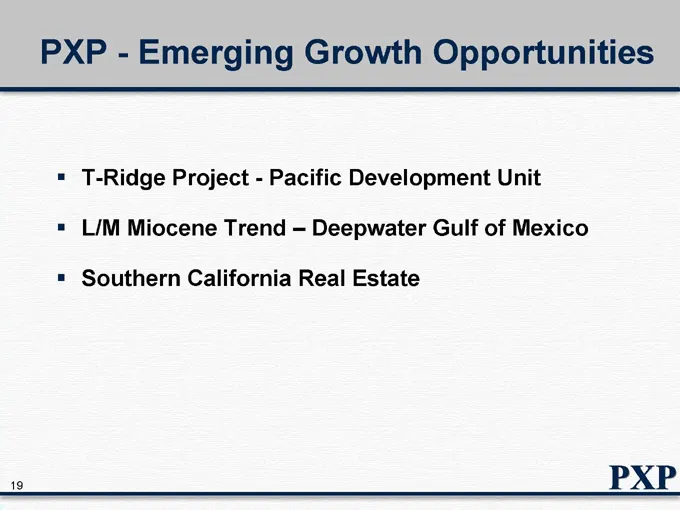
PXP—Emerging Growth Opportunities T-Ridge Project—Pacific Development Unit L/M Miocene Trend – Deepwater Gulf of Mexico Southern California Real Estate
Slide 20: Emerging Growth: Pacific Development Unit
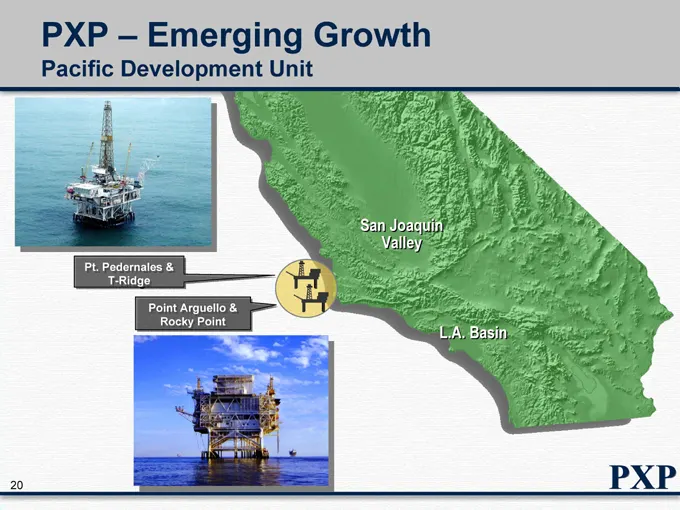
PXP – Emerging Growth Pacific Development Unit Pt. Pedernales &. T-Ridge T- Point Arguello & Rocky Point San Joaquin Valley L.A. Basin
Slide 21: Emerging Growth: Pacific Development Unit
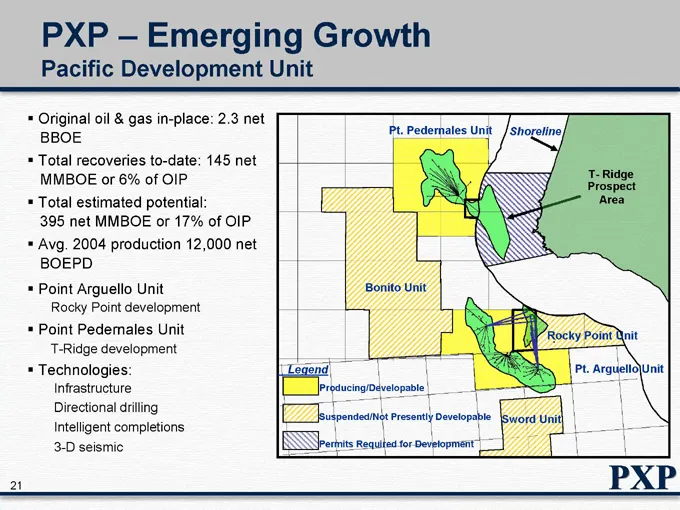
PXP – Emerging Growth Pacific Development Unit Original oil & gas in-place: 2.3 net BBOE Total recoveries to-date: 145 net MMBOE or 6% of OIP Total estimated potential: 395 net MMBOE or 17% of OIP Avg. 2004 production 12,000 net BOEPD Point Arguello Unit Rocky Point development Point Pedernales Unit
Slide 22: Pacific Development Unit: Rocky Point Type Log
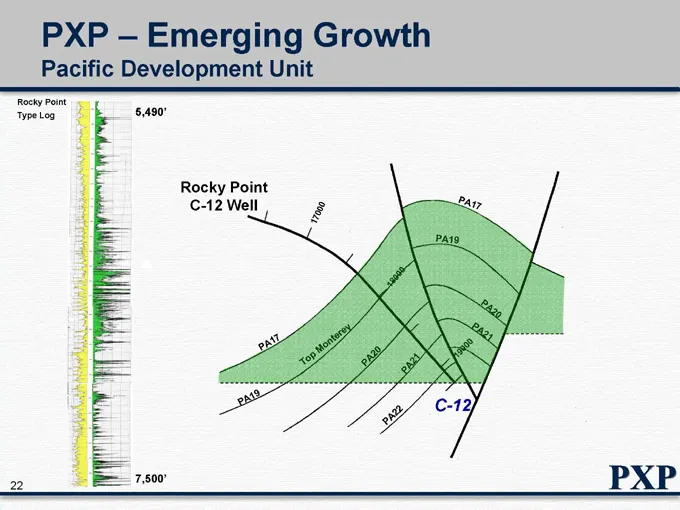
PXP – Emerging Growth Pacific Development Unit Rocky Point Type Log 5,490’ 7,500’ Rocky Point C-12 Well PA17 PA19 Top Monterey PA20 PA21 PA22 PA17 PA19 PA20 PA21 19 000 C-12
Slide 23: Pacific Development Unit: T-Ridge Project
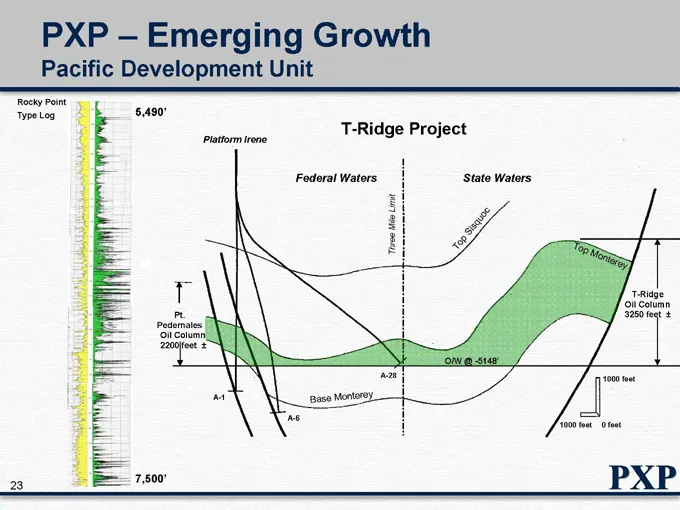
PXP – Emerging Growth Pacific Development Unit Rocky Point Type Log T-Ridge Project 5,490’ Platform Irene Pt. Pedernales Oil Column 2200 feet ± Federal Waters Three Mile Limit A-28 Base Monterey A-1 A-6 State Waters Top Sisquoc O/W @ -5148’ Top Monterey T-Ridge Oil Column 3250 feet ± 1000 feet 1000
Slide 24: Emerging Growth: Exploration Unit
PXP – Emerging Growth Exploration Unit L/M Miocene Trend – Deepwater Gulf of Mexico Focus on North America resource trends
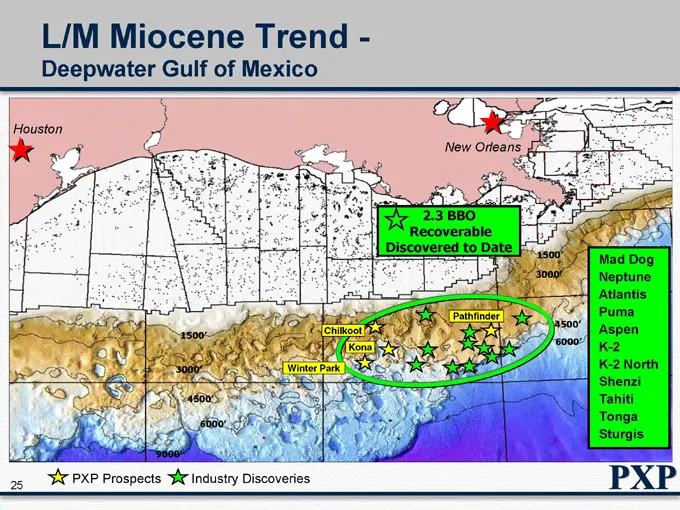
Slide 25: L/M Miocene Trend - Deepwater Gulf of Mexico
L/M Miocene Trend - Deepwater Gulf of Mexico Houston New Orleans 9000’ 2.3 BBO Recoverable Discovered to Date 1500’ 3000’ 4500’ 6000’ Winter Park Chilkoot Kona Pathfinder 1500’ 3000’ 4500’ 6000’ Mad Dog Neptune Atlantis Puma Aspen K-2 K-2 North Shenzi Tahiti Tonga Sturgis PXP Prospects Industry Disc
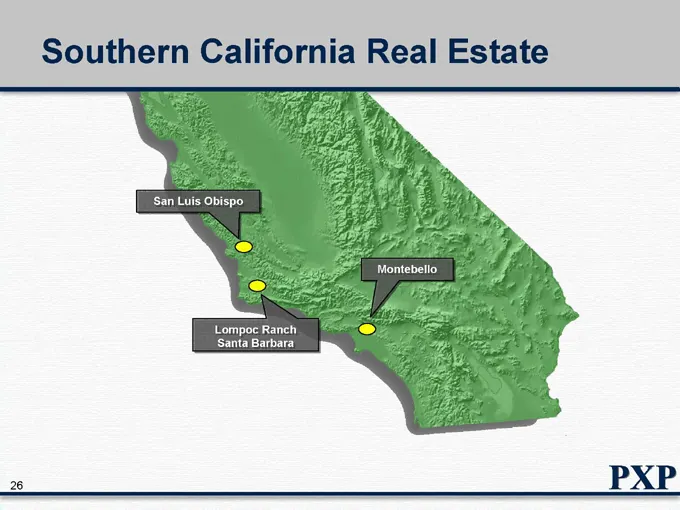
Slide 26: Southern California Real Estate
Southern California Real Estate San Luis Obispo Montebello Lompoc Ranch Santa Barbara
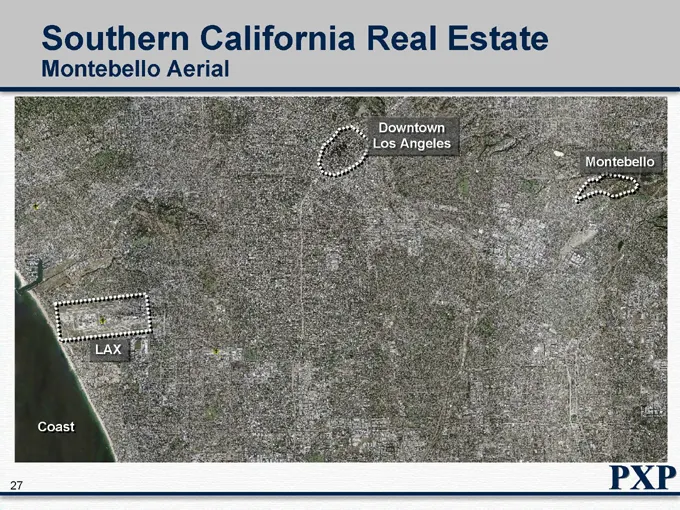
Slide 27: Southern California Real Estate: Montebello
Southern California Real Estate Montebello Aerial Downtown Los Angeles Montebello LAX Coast
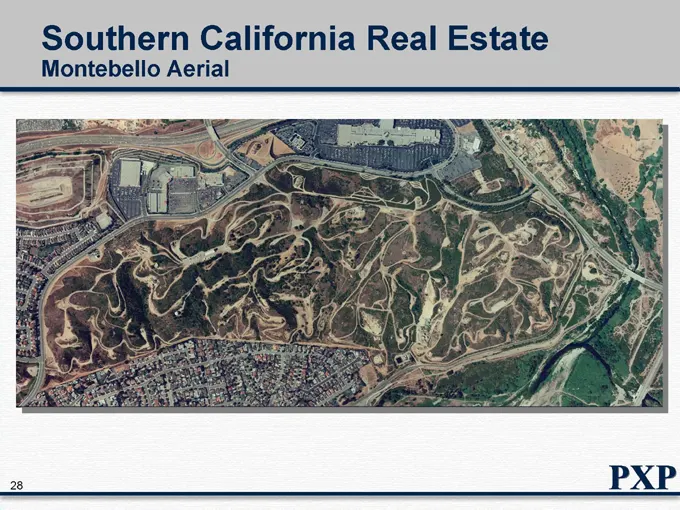
Slide 28: Southern California Real Estate: Montebello Aerial
Southern California Real Estate Montebello Aerial
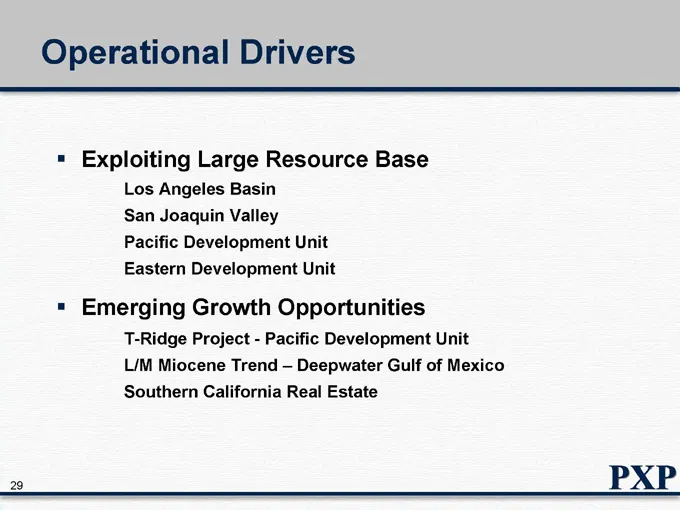
Slide 29: Operational Drivers
Operational Drivers Exploiting Large Resource Base Los Angeles Basin San Joaquin Valley Pacific Development Unit Eastern Development Unit Emerging Growth Opportunities T-Ridge Project—Pacific Development Unit L/M Miocene Trend – Deepwater Gulf of Mexico Southern California Real Estate
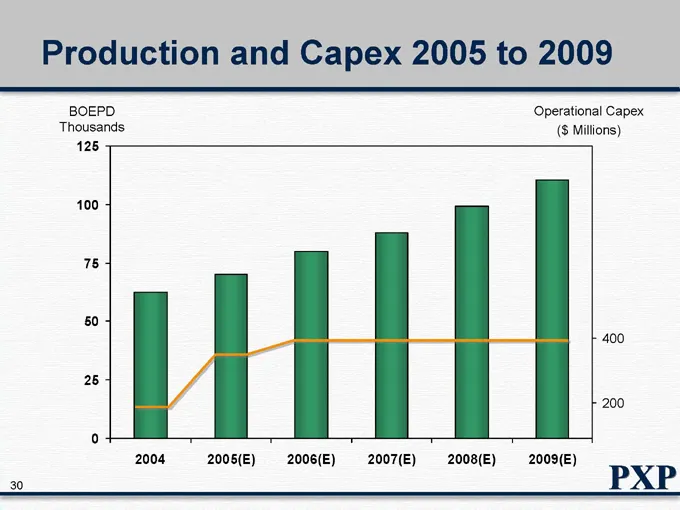
Slide 30: Production and Capex 2005 to 2009
Production and Capex 2005 to 2009 BOEPD Operational Capex Thousands ($ Millions) 125 100 75 2004 2005(E) 2006(E) 2007(E) 2008(E) 2009(E)
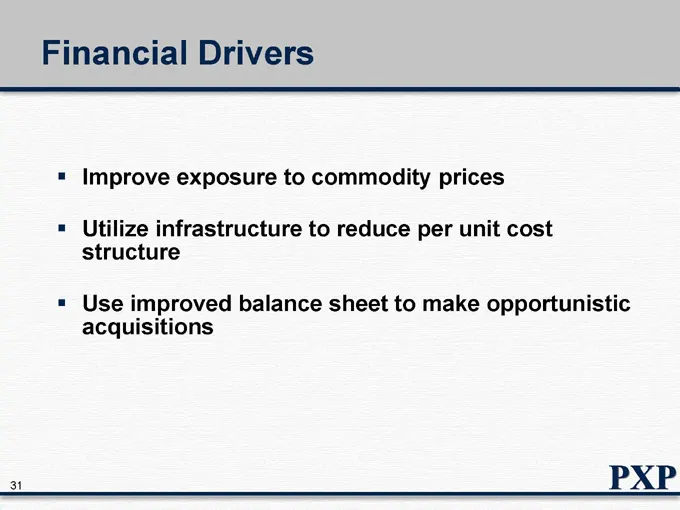
Slide 31: Financial Drivers
Financial Drivers Improve exposure to commodity prices Utilize infrastructure to reduce per unit cost structure Use improved balance sheet to make opportunistic acquisitions
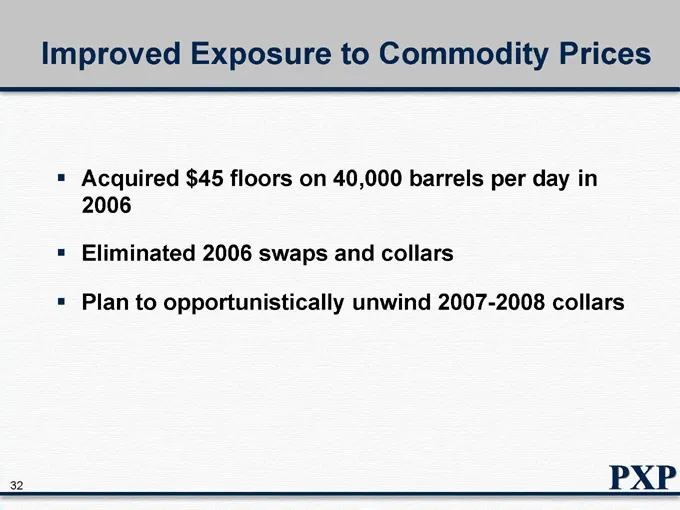
Slide 32: Improved Exposure to Commodity Prices
Improved Exposure to Commodity Prices Acquired $45 floors on 40,000 barrels per day in 2006 Eliminated 2006 swaps and collars Plan to opportunistically unwind 2007-2008 collars
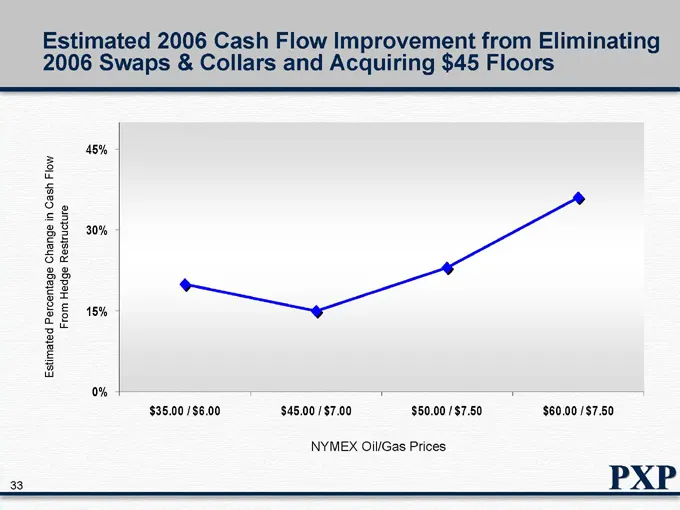
Slide 33: Estimated 2006 Cash Flow Improvement from Hedge Restructure
Estimated 2006 Cash Flow Improvement from Eliminating 2006 Swaps & Collars and Acquiring $45 Floors Estimated Percentage Change in Cash Flow From Hedge Restructure 45% 30% 15% 0% $35.00 / $6.00 $45.00 / $7.00 $50.00 / $7.50 $60.00 / $7.50 NYMEX Oil/Gas Prices
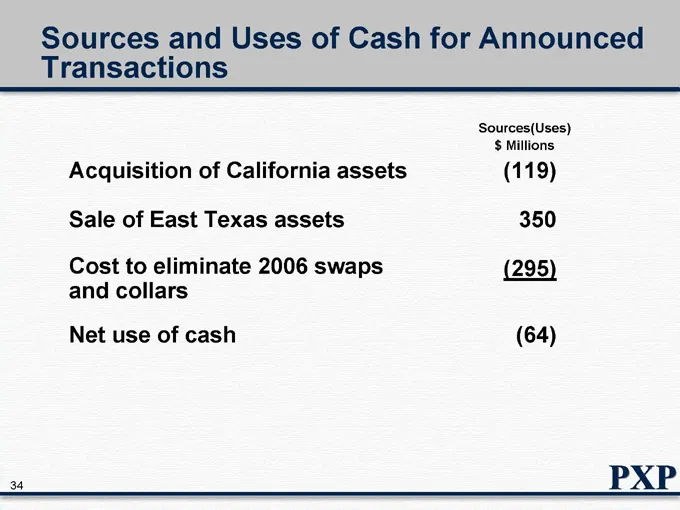
Slide 34: Sources and Uses of Cash for Announced Transactions
Sources and Uses of Cash for Announced Transactions Sources(Uses) $ Millions Acquisition of California assets (119) Sale of East Texas assets 350 Cost to eliminate 2006 swaps and collars (295) Net use of cash (64)
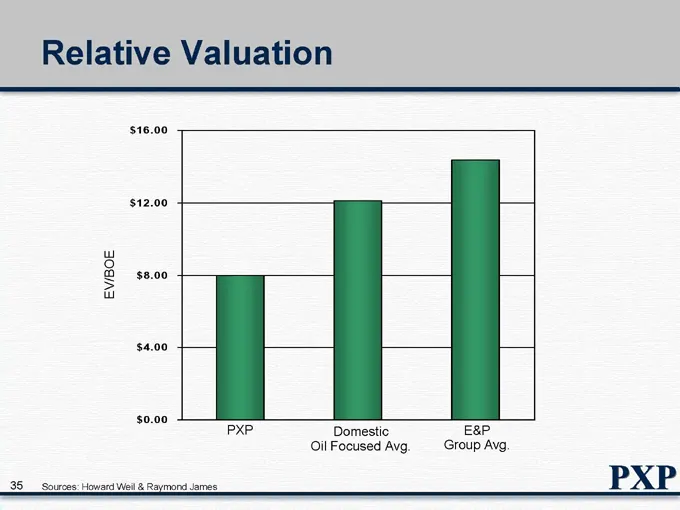
Slide 35: Relative Valuation
Relative Valuation EV/BOE $16.00 $12.00 $8.00 $4.00 $0.00 PXP Domestic E&P Oil Focused Avg. Group Avg. Sources: Howard Weil & Raymond James
Slide 36: Howard Weil 33rd Annual Energy Conference
Howard Weil 33rd Annual Energy Conference April 2005 N Y S E : P X P w w w . p l a i n s x p . c o m
Source: SEC EDGAR · 8-K filed Apr 4, 2005
More decks from Plains Exploration & Production Company
 Global Metals, Mining & Steel Conference 201333 slides · May 14, 2013
 Q1 2013 Earnings Presentation46 slides · Apr 19, 2013
 Merger or Acquisition (February 2013)35 slides · Feb 25, 2013
 2013 Credit Suisse Energy Summit10 slides · Feb 5, 2013
 Merger or Acquisition (January 2013)30 slides · Jan 17, 2013
 Credit Suisse 2012 Energy Summit32 slides · Feb 7, 2012