STORE Capital — Investor Presentation (August 2017)
47 slides from STORE Capital's investor presentation, Aug 4, 2017
Slide 1: Foundational Distinction: 2017 Second Quarter Investor Presentation
S|TIO|RIE 9 capital Foundational Distinction 2017 Second Quarter Investor Presentation
Slide 2: Disclaimer
Disclaimer This presentation contains forward-looking statements within the meaning of Section 27A of the Securities Act of 1933, as amended, or the Securities Act, and Section 21E of the Securities Exchange Act of 1934, as amended, or the Exchange Act. Such forward-looking statements include, witho
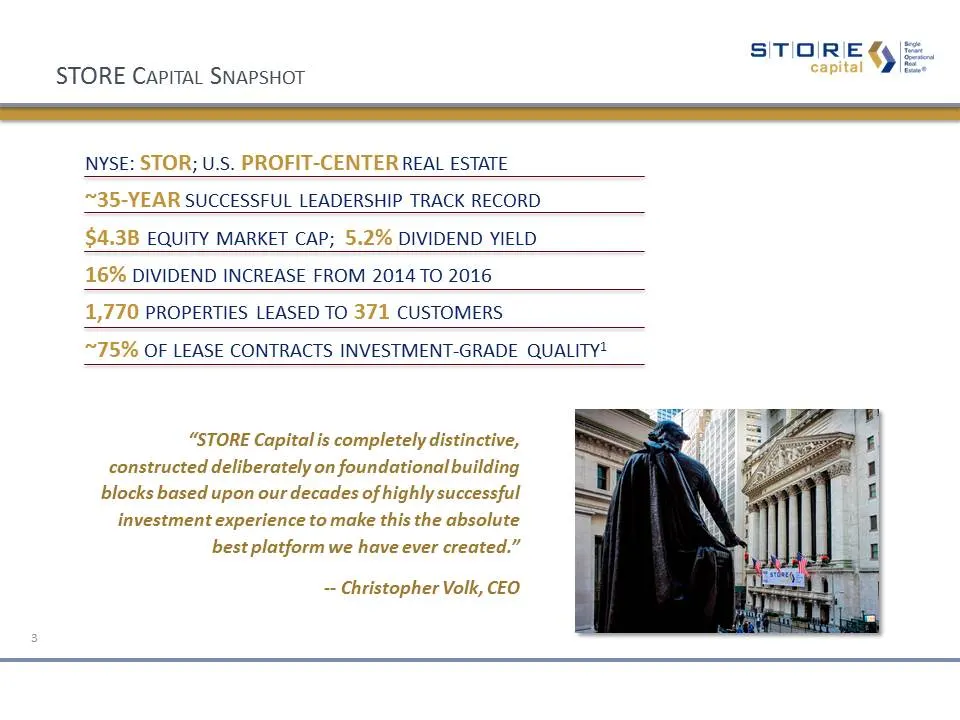
Slide 3: STORE Capital Snapshot
STORE Capital Snapshot NYSE: STOR; U.S. PROFIT-CENTER REAL ESTATE ~35-YEAR SUCCESSFUL LEADERSHIP TRACK RECORD $4.3B EQUITY MARKET CAP; 5.2% DIVIDEND YIELD16% DIVIDEND INCREASE FROM 2014 TO 20161,770 PROPERTIES LEASED TO 371 CUSTOMERS ~75% OF LEASE CONTRACTS INVESTMENT-GRADE QUALITY1 “STORE Capital i
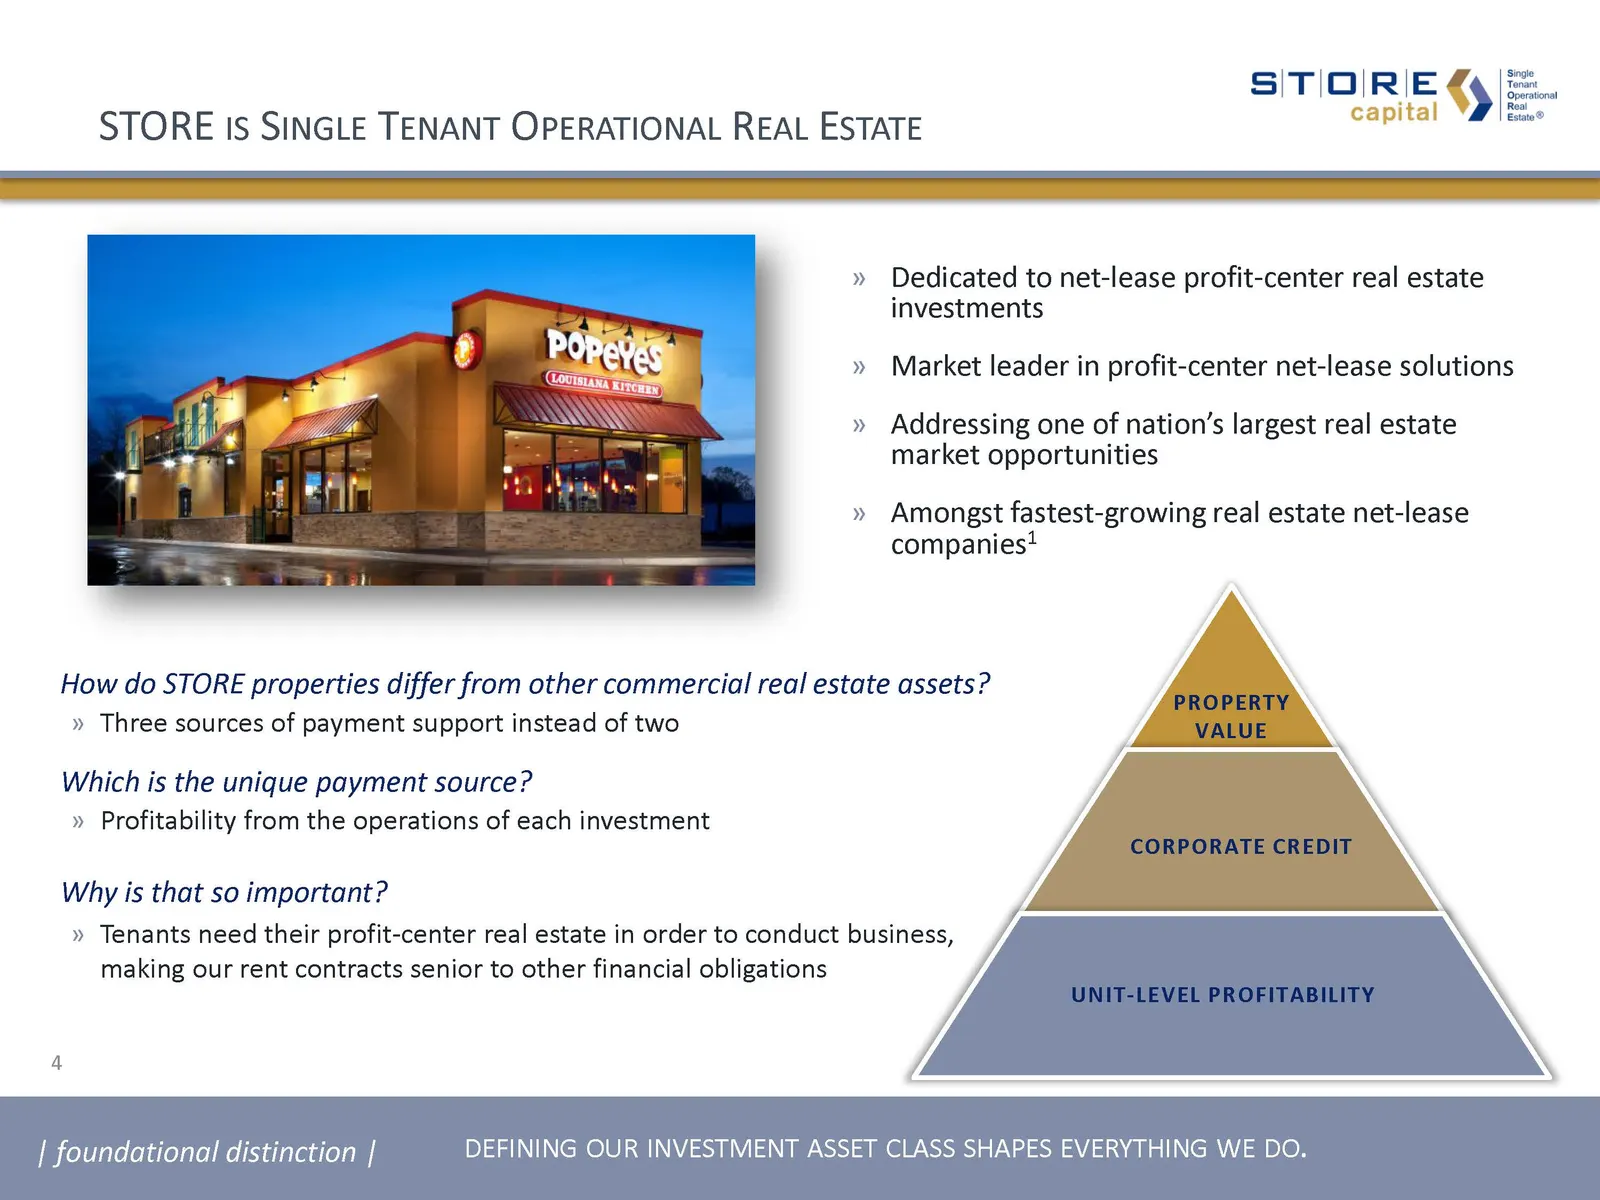
Slide 4: Dedicated to net-lease profit-center real estate investments
Dedicated to net-lease profit-center real estate investmentsMarket leader in profit-center net-lease solutionsAddressing one of nation’s largest real estate market opportunitiesAmongst fastest-growing real estate net-lease companies1 Why is that so important?Tenants need their profit-center real est
Slide 5: Broad-Based Market Need
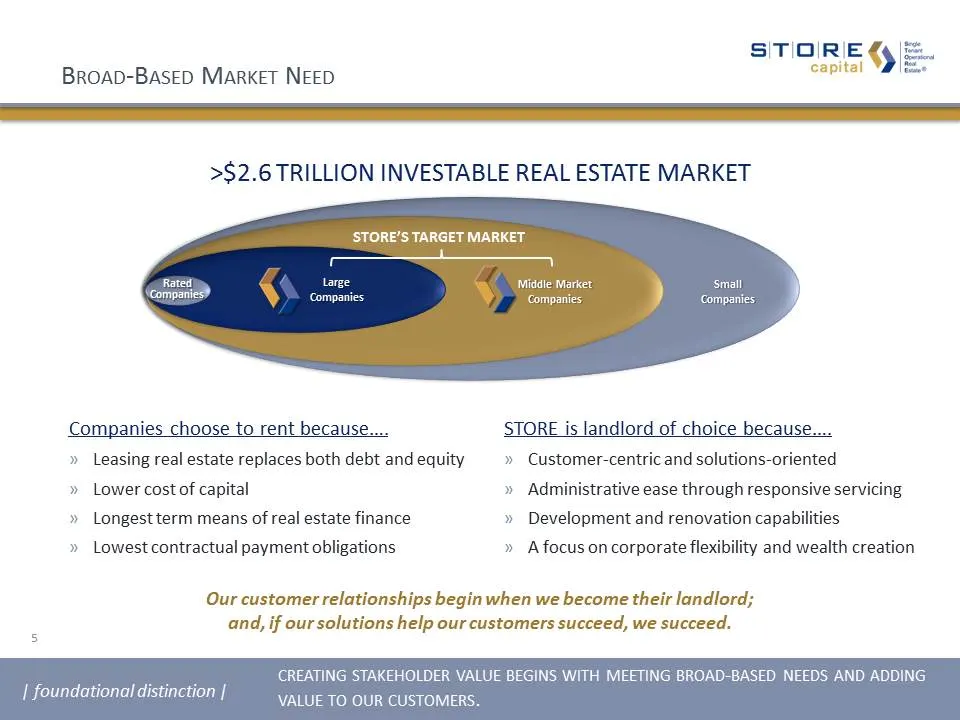
Broad-Based Market Need 5 Rated Large Middle Market Companies choose to rent because….Leasing real estate replaces both debt and equityLower cost of capitalLongest term means of real estate financeLowest contractual payment obligations STORE is landlord of choice because….Customer-centric and soluti
Slide 6: Internal Ownership: B2B Origination Platform
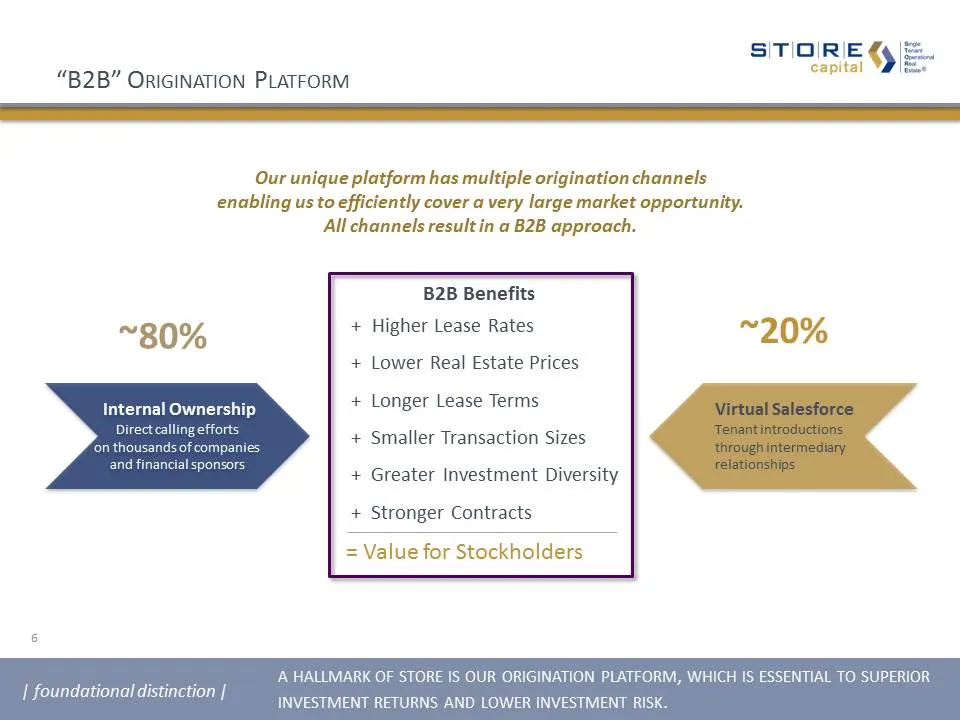
Internal OwnershipDirect calling efforts on thousands of companies and financial sponsors ~80% ~20% B2B Benefits + Higher Lease Rates+ Lower Real Estate Prices+ Longer Lease Terms+ Smaller Transaction Sizes + Greater Investment Diversity+ Stronger Contracts Our unique platform has multiple originati
Slide 7: Investment Portfolio Built Brick by Brick
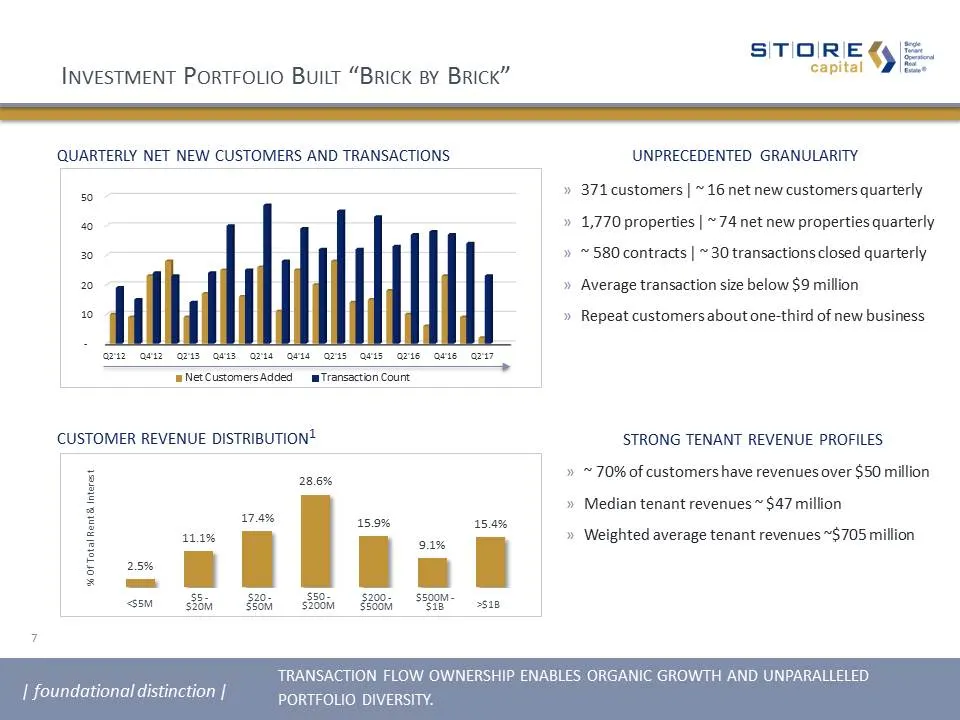
Investment Portfolio Built “Brick by Brick” quarterly net new customers and transactions unprecedented granularity | foundational distinction | transaction flow ownership enables organic growth and unparalleled portfolio diversity. 7 customer revenue distribution1 % Of Total Rent & Interest 371 cust
Slide 8: Lease Contracts Define Investment Risk
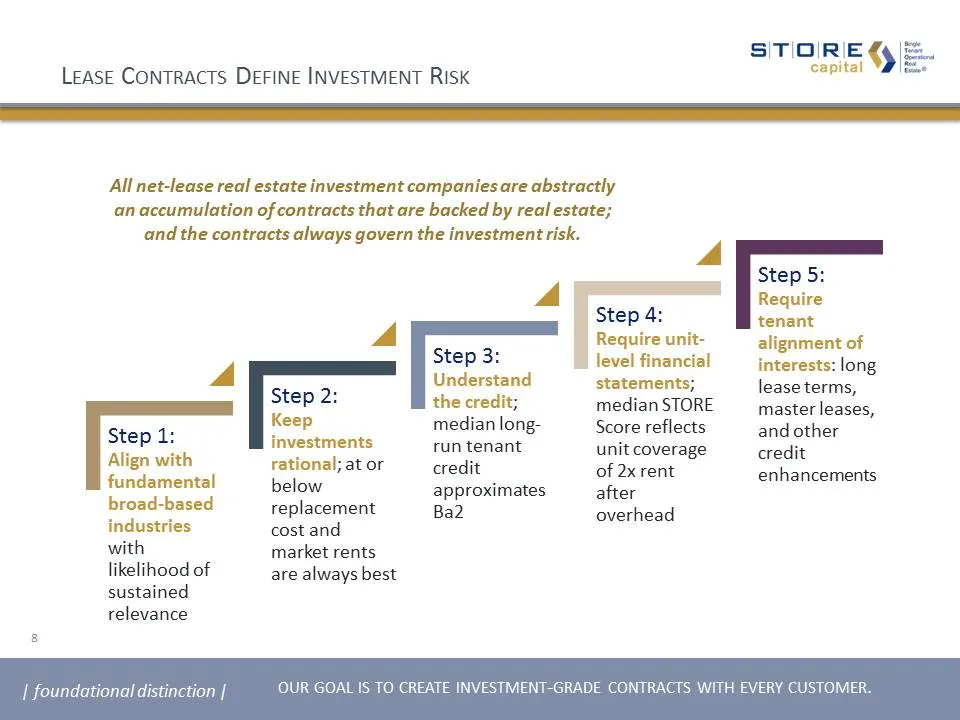
Lease Contracts Define Investment Risk All net-lease real estate investment companies are abstractly an accumulation of contracts that are backed by real estate; and the contracts always govern the investment risk. | foundational distinction | our goal is to create investment-grade contracts with ev
Slide 9: Capital Structure Leadership
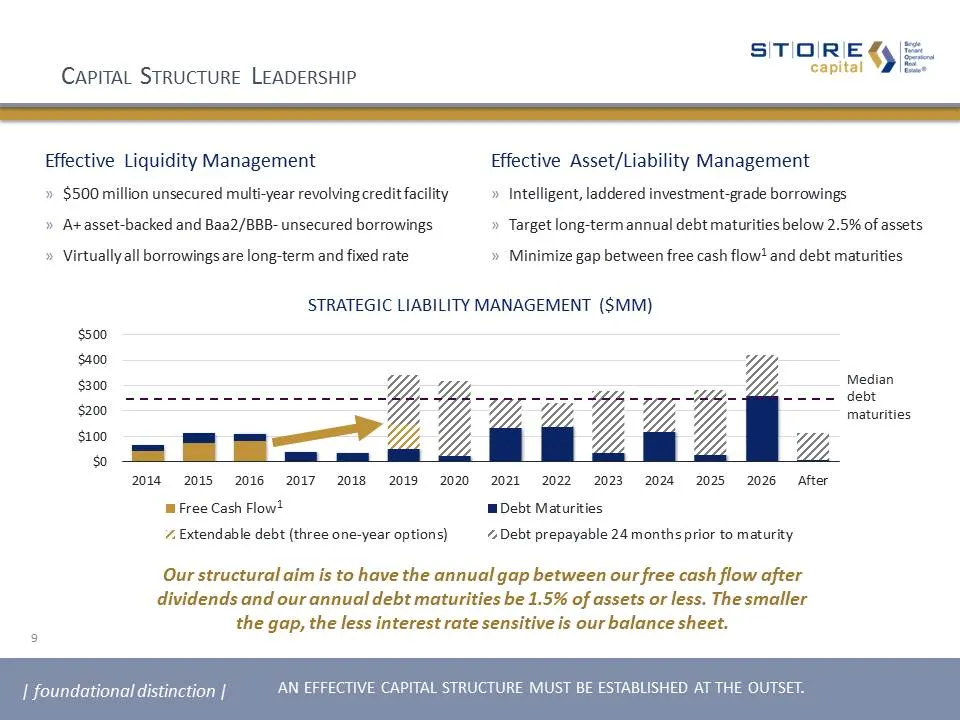
Capital Structure Leadership | foundational distinction | an effective capital structure must be established at the outset. 9 Effective Liquidity Management$500 million unsecured multi-year revolving credit facilityA+ asset-backed and Baa2/BBB- unsecured borrowingsVirtually all borrowings are long-t
Slide 10: Complementary Investment-Grade Debt Options
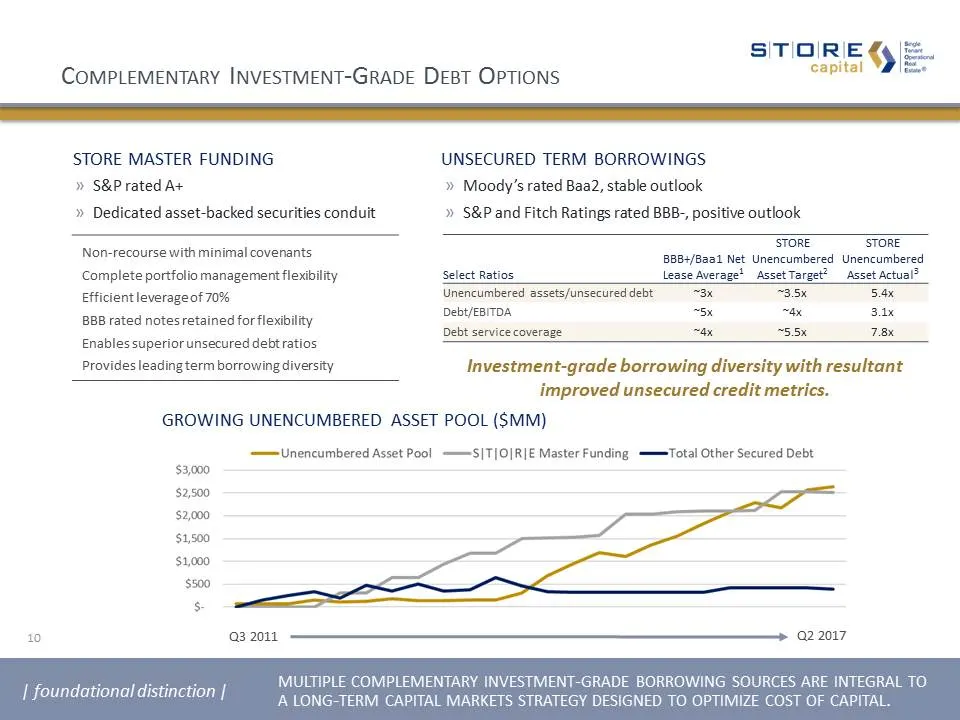
Complementary Investment-Grade Debt Options growing unencumbered asset pool ($MM) store master funding S&P rated A+Dedicated asset-backed securities conduit unsecured term borrowings | foundational distinction | multiple complementary investment-grade borrowing sources are integral to a long-term ca
Slide 11: Internal Growth Strategy
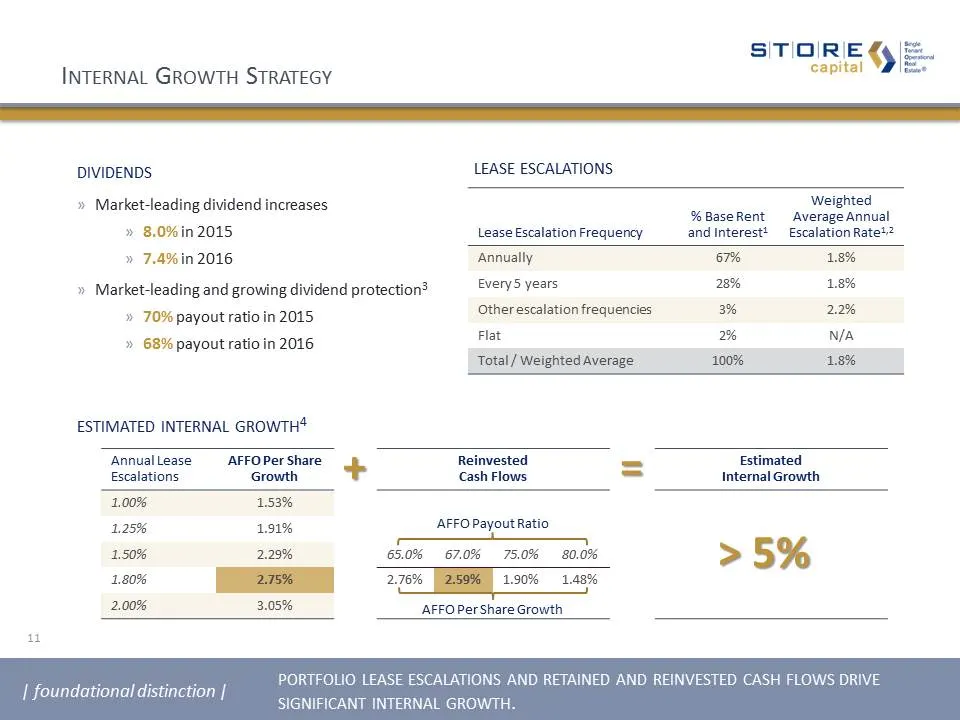
11 Internal Growth Strategy Lease Escalation Frequency % Base Rent and Interest1 Weighted Average Annual Escalation Rate1,2 Annually 67% 1.8% Every 5 years 28% 1.8% Other escalation frequencies 3% 2.2% Flat 2% N/A Total / Weighted Average 100% 1.8% lease escalations dividends Market-leading dividend
Slide 12: Unrivaled Leadership
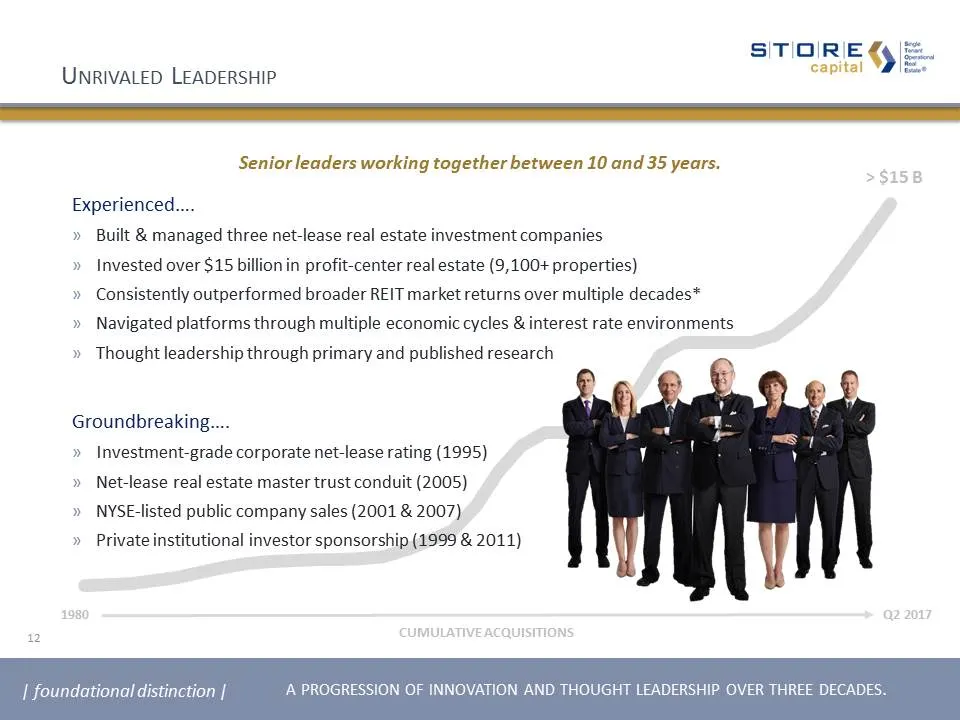
12 Unrivaled Leadership Experienced….Built & managed three net-lease real estate investment companiesInvested over $15 billion in profit-center real estate (9,100+ properties)Consistently outperformed broader REIT market returns over multiple decades*Navigated platforms through multiple economic cyc
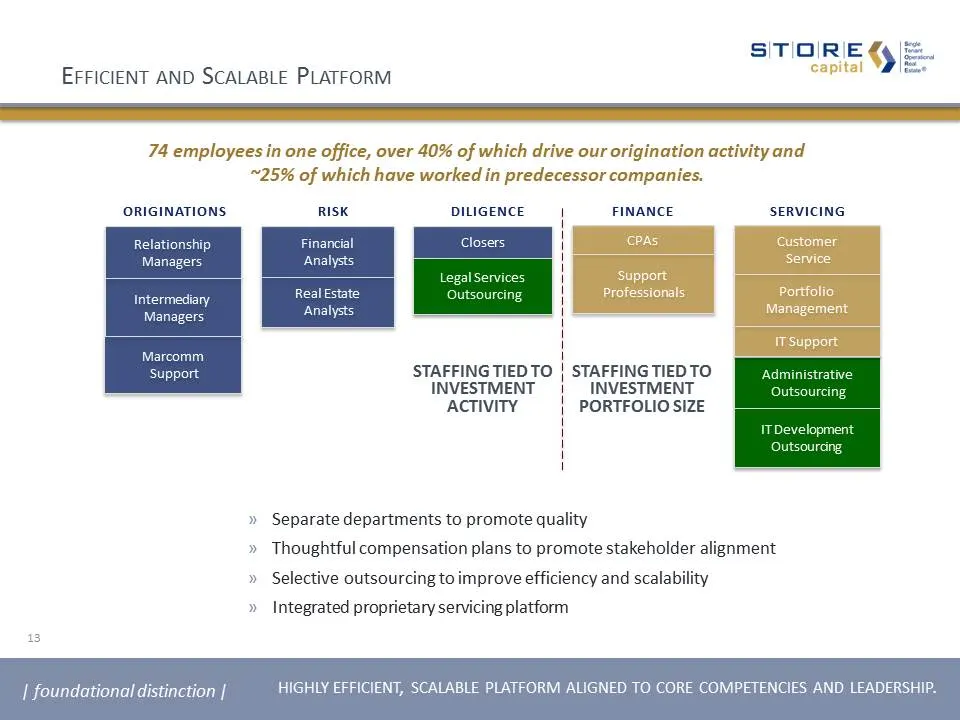
Slide 13: Efficient and Scalable Platform
74 employees in one office, over 40% of which drive our origination activity and ~25% of which have worked in predecessor companies. originations servicing diligence finance risk RelationshipManagers Intermediary Managers Closers Financial Analysts Real Estate Analysts CPAs Support Professionals Cus
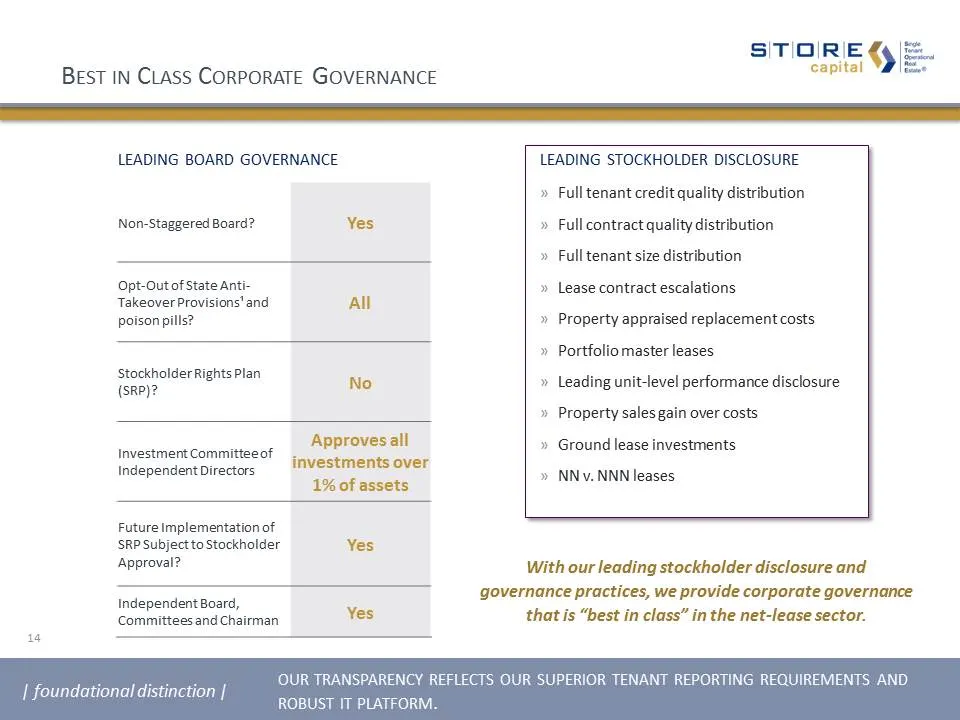
Slide 14: Best in Class Corporate Governance
Best in Class Corporate Governance Non-Staggered Board? Yes Opt-Out of State Anti-Takeover Provisions¹ and poison pills? All Stockholder Rights Plan (SRP)? No Investment Committee of Independent Directors Approves all investments over 1% of assets Future Implementation of SRP Subject to Stockholder
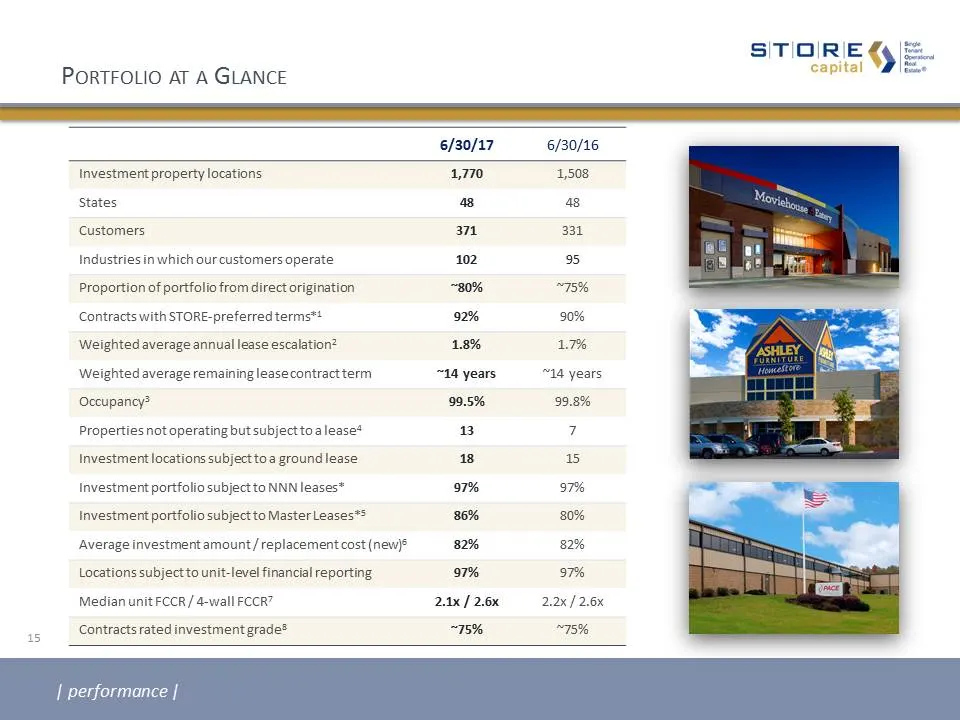
Slide 15: Portfolio at a Glance
Portfolio at a Glance 6/30/17 6/30/16 Investment property locations 1,770 1,508 States 48 48 Customers 371 331 Industries in which our customers operate 102 95 Proportion of portfolio from direct origination ~80% ~75% Contracts with STORE-preferred terms*1 92% 90% Weighted average annual lease escal
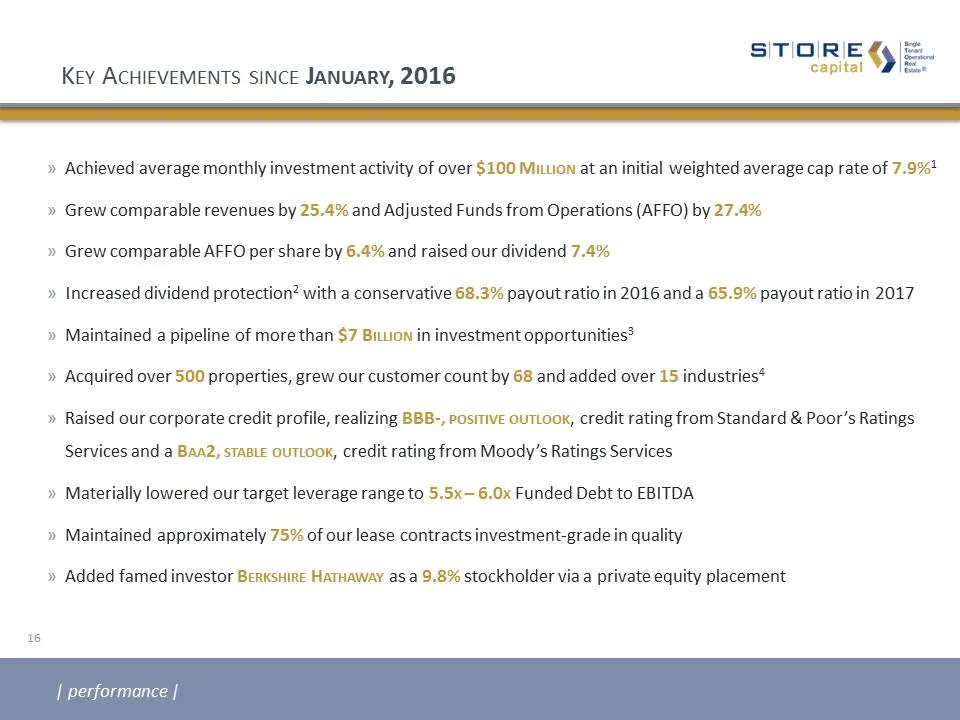
Slide 16: Key Achievements since January, 2016
Key Achievements since January, 2016 Achieved average monthly investment activity of over $100 Million at an initial weighted average cap rate of 7.9%1 Grew comparable revenues by 25.4% and Adjusted Funds from Operations (AFFO) by 27.4%Grew comparable AFFO per share by 6.4% and raised our dividend 7
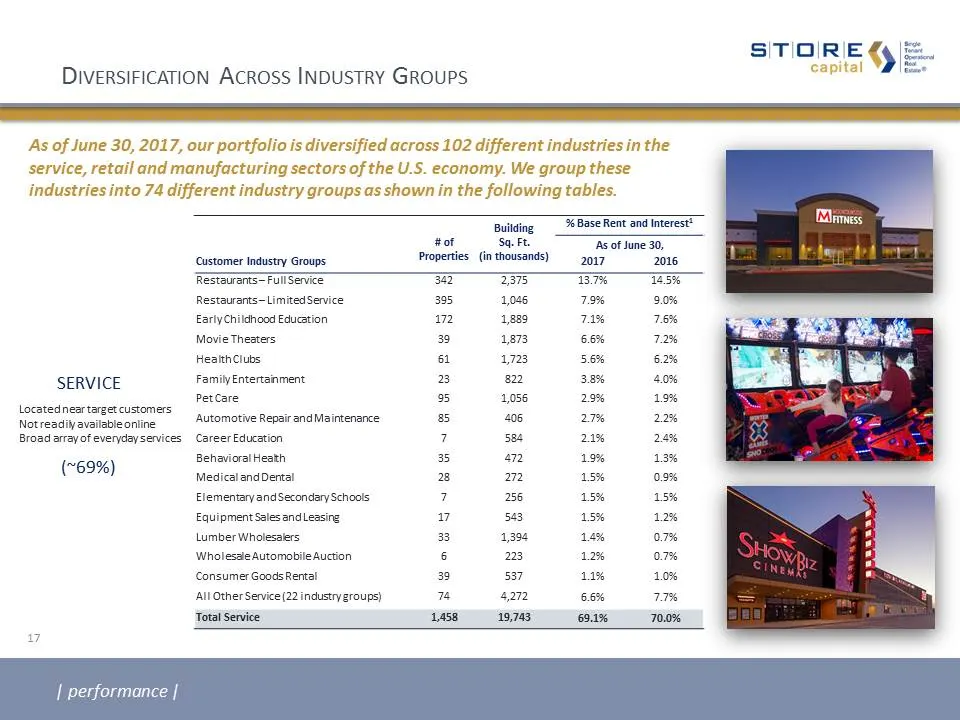
Slide 17: Diversification Across Industry Groups
Diversification Across Industry Groups 17 Building % Base Rent and Interest1 # ofProperties Sq. Ft. (in thousands) As of June 30, Customer Industry Groups 2017 2016 Restaurants – Full Service 342 2,375 13.7% 14.5% Restaurants – Limited Service 395 1,046 7.9% 9.0% Early Childhood Education 172 1,889
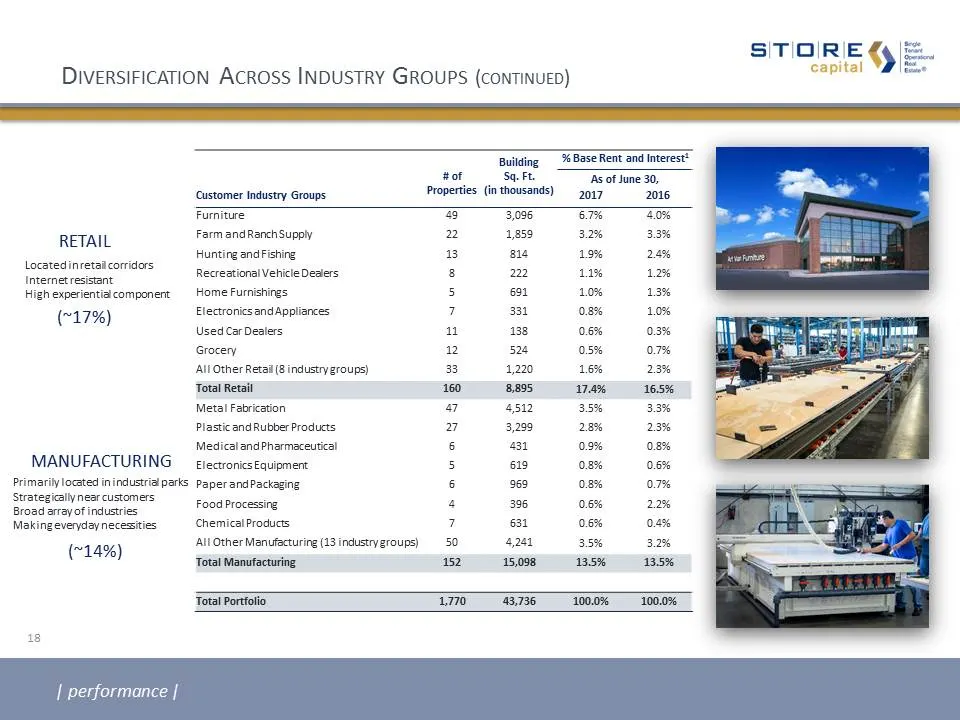
Slide 18: Diversification Across Industry Groups (continued)
Diversification Across Industry Groups (continued) 18 Building % Base Rent and Interest1 # ofProperties Sq. Ft. (in thousands) As of June 30, Customer Industry Groups 2017 2016 Furniture 49 3,096 6.7% 4.0% Farm and Ranch Supply 22 1,859 3.2% 3.3% Hunting and Fishing 13 814 1.9% 2.4% Recreational Veh
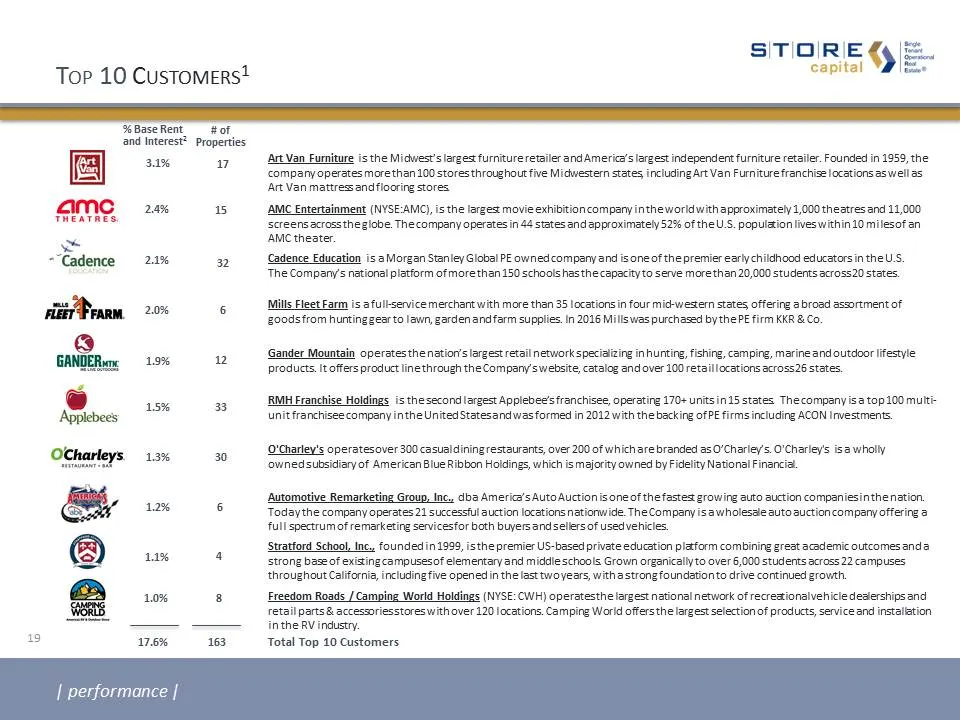
Slide 19: Top Customers
19 Top 10 Customers1 AMC Entertainment (NYSE:AMC), is the largest movie exhibition company in the world with approximately 1,000 theatres and 11,000 screens across the globe. The company operates in 44 states and approximately 52% of the U.S. population lives within 10 miles of an AMC theater. Gande
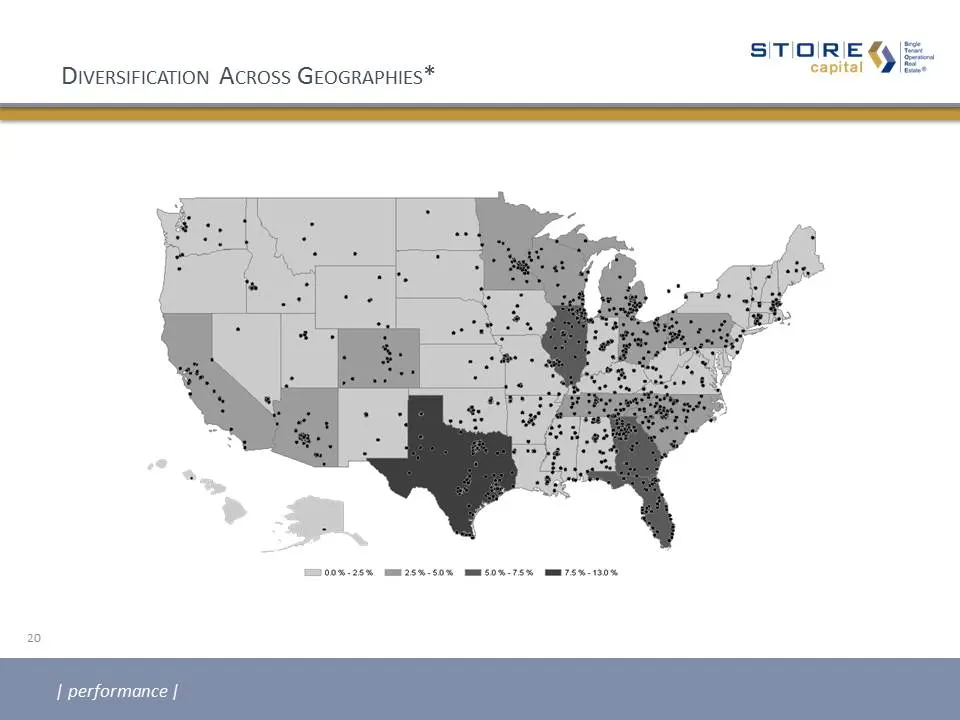
Slide 20: Diversification Across Geographies
Diversification Across Geographies* | performance | 20
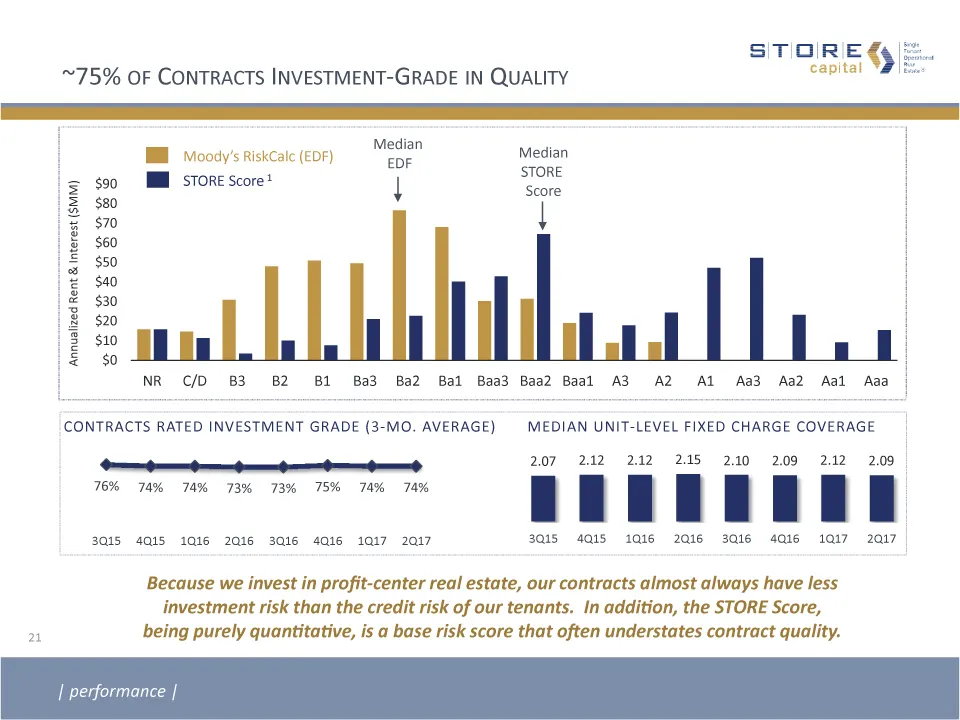
Slide 21: ~75% of Contracts Investment-Grade in Quality
~75% of Contracts Investment-Grade in Quality Because we invest in profit-center real estate, our contracts almost always have less investment risk than the credit risk of our tenants. In addition, the STORE Score, being purely quantitative, is a base risk score that often understates contract quali
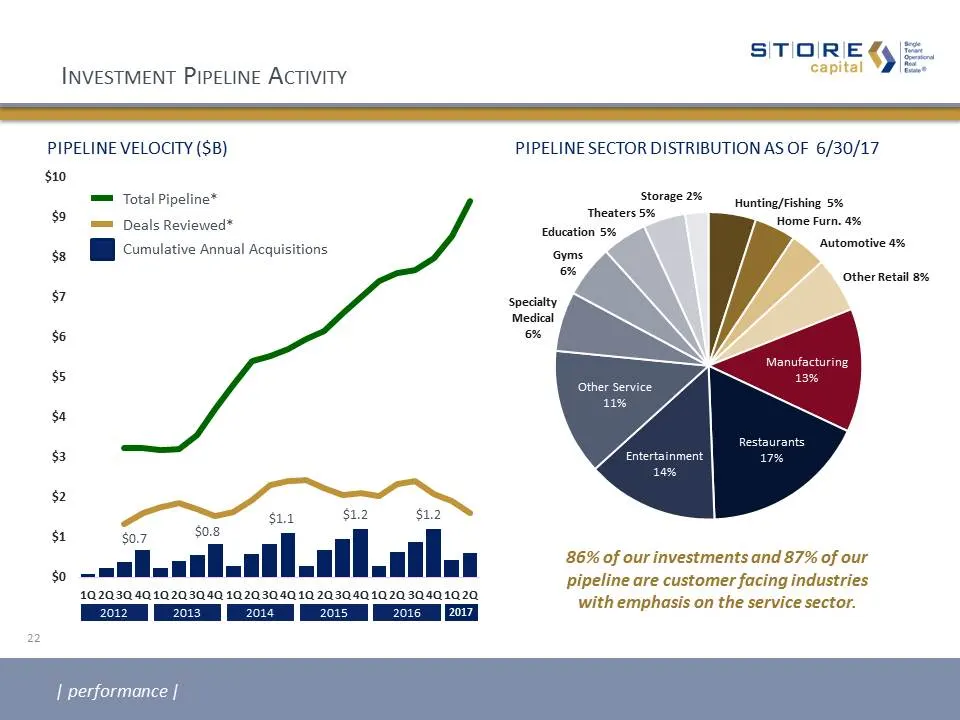
Slide 22: Investment Pipeline Activity
| performance | PIPELINE VELOCITY ($B) Total Pipeline* Deals Reviewed* Cumulative Annual Acquisitions 2012 2013 2014 2015 2016 PIPELINE SECTOR DISTRIBUTION AS OF 6/30/17 Investment Pipeline Activity 22 | performance | $0.7 $0.8 $1.1 $1.2 $1.2 2017 86% of our investments and 87% of our pipeline are c
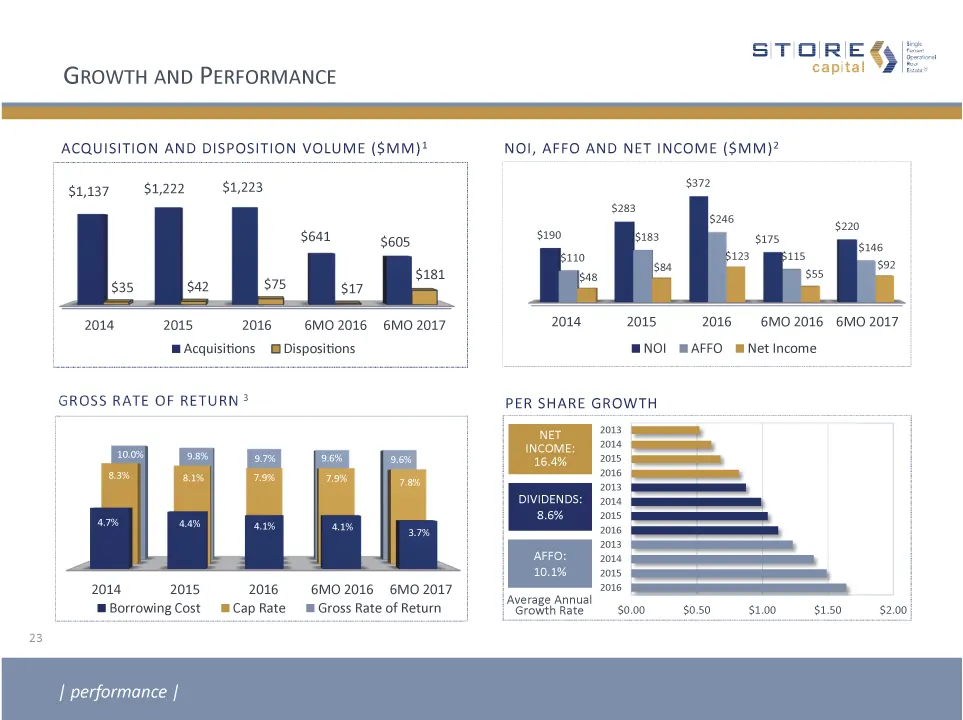
Slide 23: Growth and Performance
23 NOI, AFFO AND NET INCOME ($MM)2 Growth and Performance | performance | PER SHARE GROWTH NET INCOME:16.4% DIVIDENDS:8.6% AFFO:10.1% Average Annual Growth Rate ACQUISITION AND DISPOSITION VOLUME ($MM)1 GROSS RATE OF RETURN 3 5.6% 5.3% 5.4% 5.6% 4.1% 4.7% 4.4% 4.1% 9.6% 8.3% 8.1% 7.9% 7.9% 10.0% 9.8
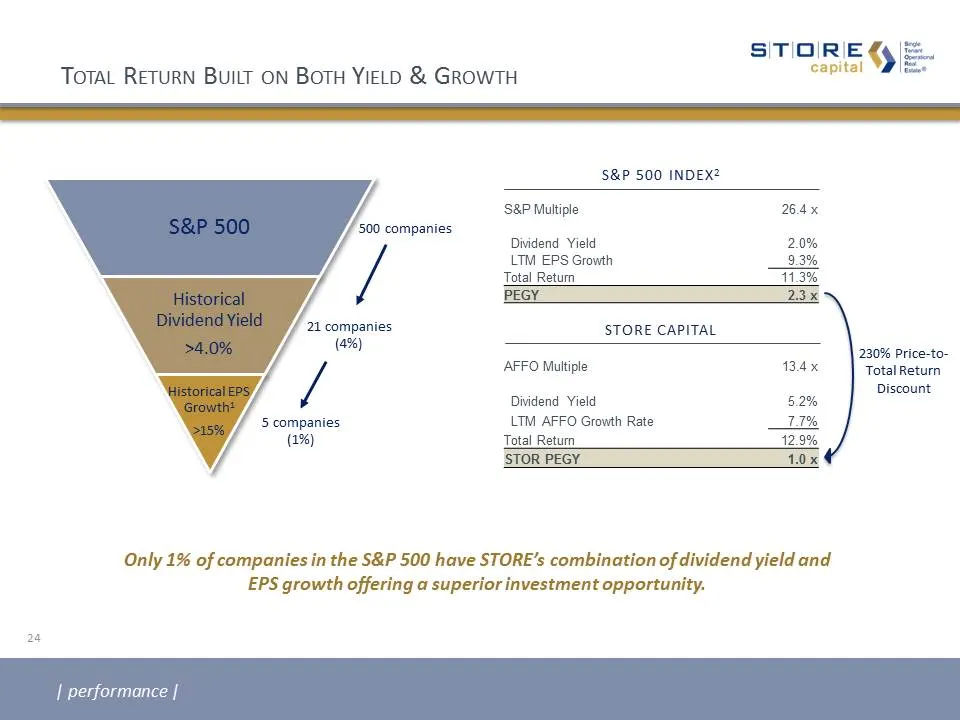
Slide 24: Total Return Built on Both Yield & Growth
Total Return Built on Both Yield & Growth | performance | 24 500 companies 21 companies(4%) 5 companies(1%) Only 1% of companies in the S&P 500 have STORE’s combination of dividend yield and EPS growth offering a superior investment opportunity. 230% Price-to-Total Return Discount S&P 500 INDEX2 S&P
Slide 25: Margins of Safety
Margins of Safety Portfolio QualityApproximately 75% investment-gradeMaster leases 86% of the time97% property-level financial statementsMarket-leading investment diversityInvestments average 82% of replacement costInvestment yields above NAV auction yields Financial StrengthA highly protected divid
Slide 26: Distinction
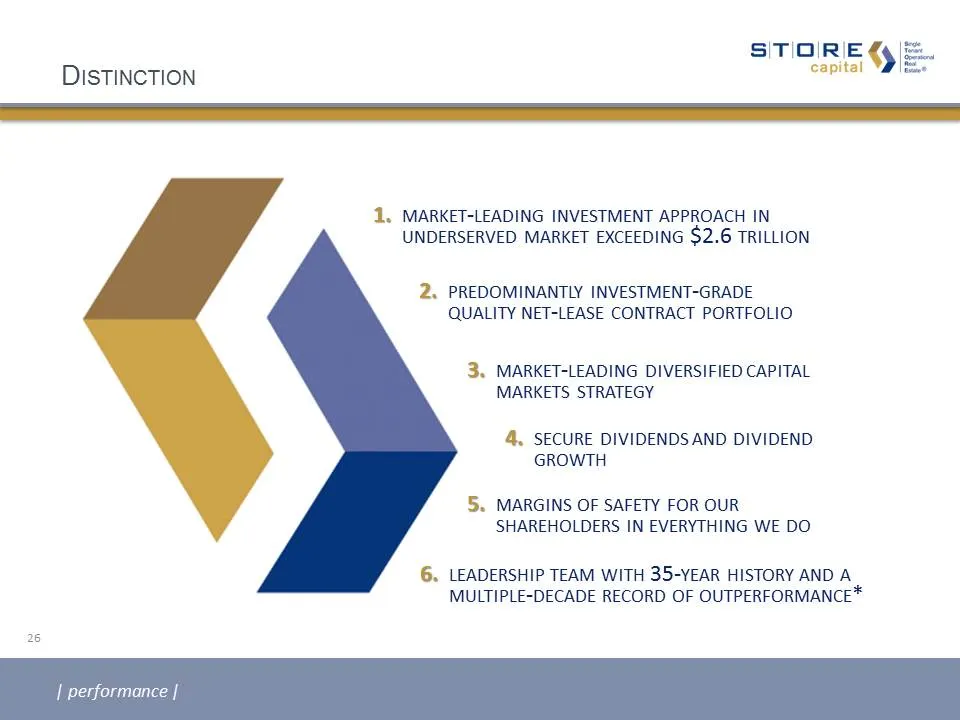
Distinction market-leading investment approach in underserved market exceeding $2.6 trillion 1. predominantly investment-grade quality net-lease contract portfolio 2. market-leading diversified capital markets strategy 3. secure dividends and dividend growth 4. margins of safety for our shareholders
Slide 27: Appendix
S|TIO|RIE 9 capital Appendix
Slide 28: Management Team Performance
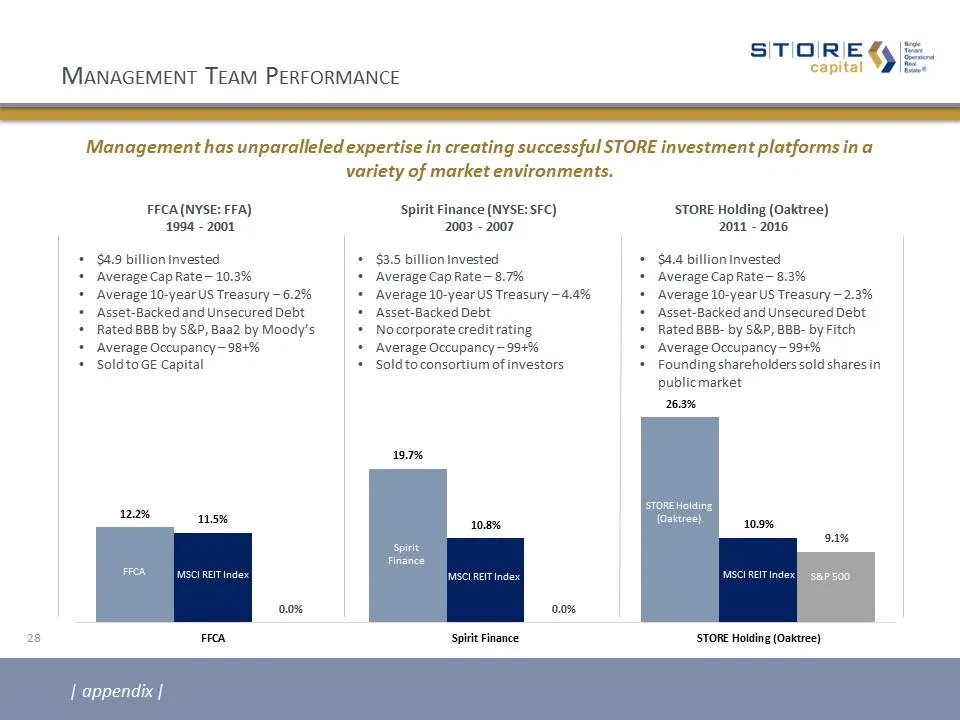
FFCA (NYSE: FFA) 1994 - 2001 Spirit Finance (NYSE: SFC) 2003 - 2007 STORE Holding (Oaktree) 2011 - 2016 Management Team Performance | appendix | Management has unparalleled expertise in creating successful STORE investment platforms in a variety of market environments. 28 $4.9 billion Invested Avera
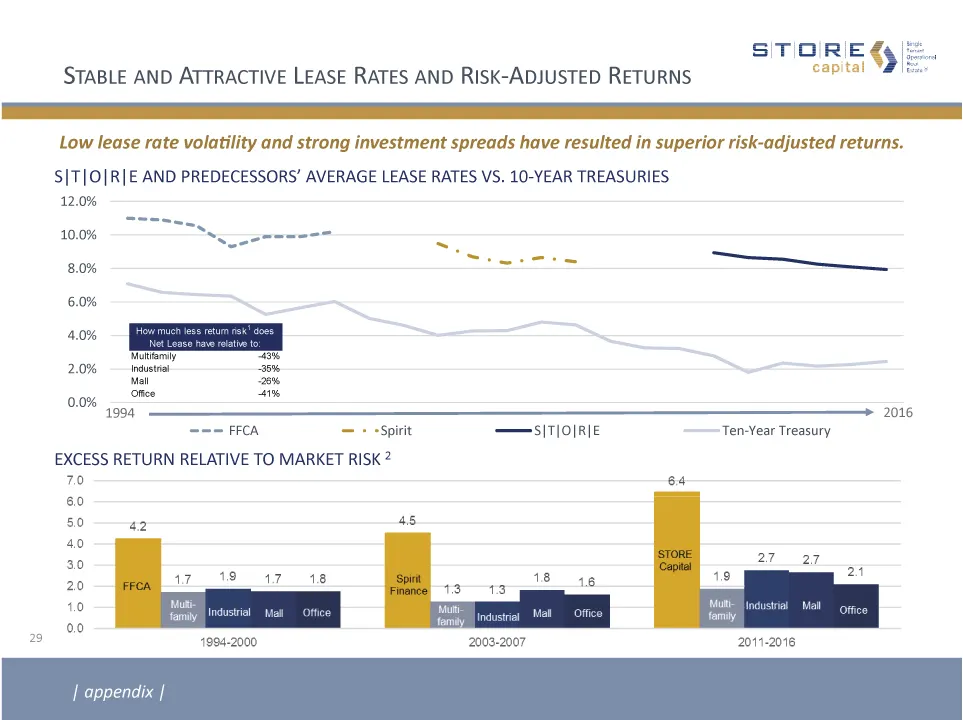
Slide 29: Stable and Attractive Lease Rates and Risk-Adjusted Returns
| appendix | 29 1994 2016 Stable and Attractive Lease Rates and Risk-Adjusted Returns Low lease rate volatility and strong investment spreads have resulted in superior risk-adjusted returns. S|T|O|R|E and predecessors’ average Lease Rates vs. 10-Year Treasuries Excess Return relative to Market Risk
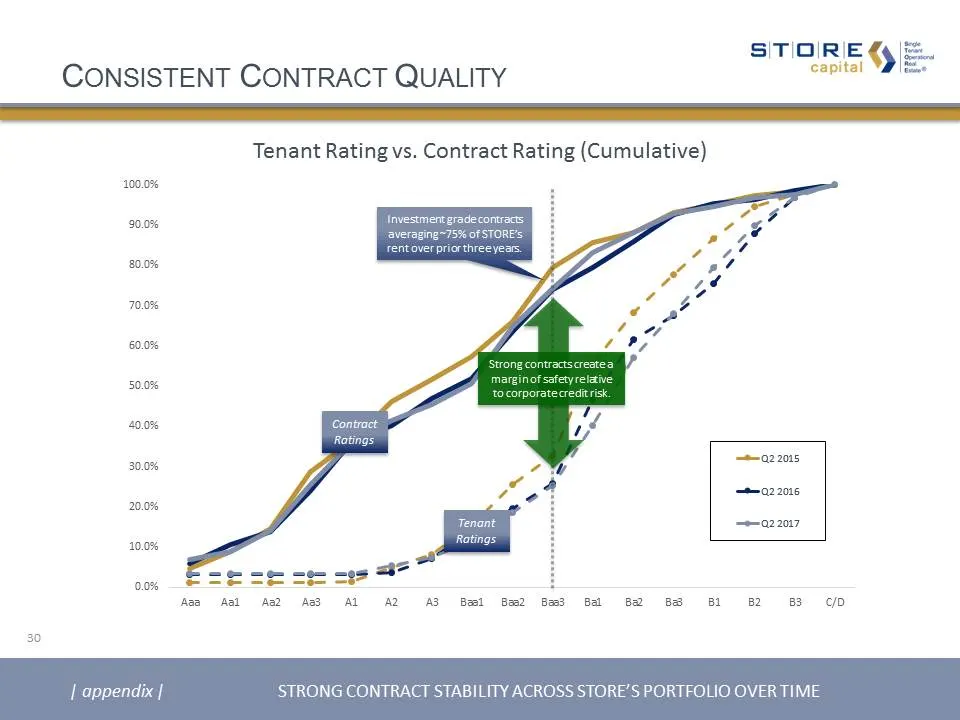
Slide 30: Consistent Contract Quality
Consistent Contract Quality STRONG CONTRACT STABILITY ACROSS STORE’S PORTFOLIO OVER TIME | appendix | 30 Investment grade contracts averaging ~75% of STORE’s rent over prior three years. Tenant Rating vs. Contract Rating (Cumulative) Strong contracts create a margin of safety relative to corporate c
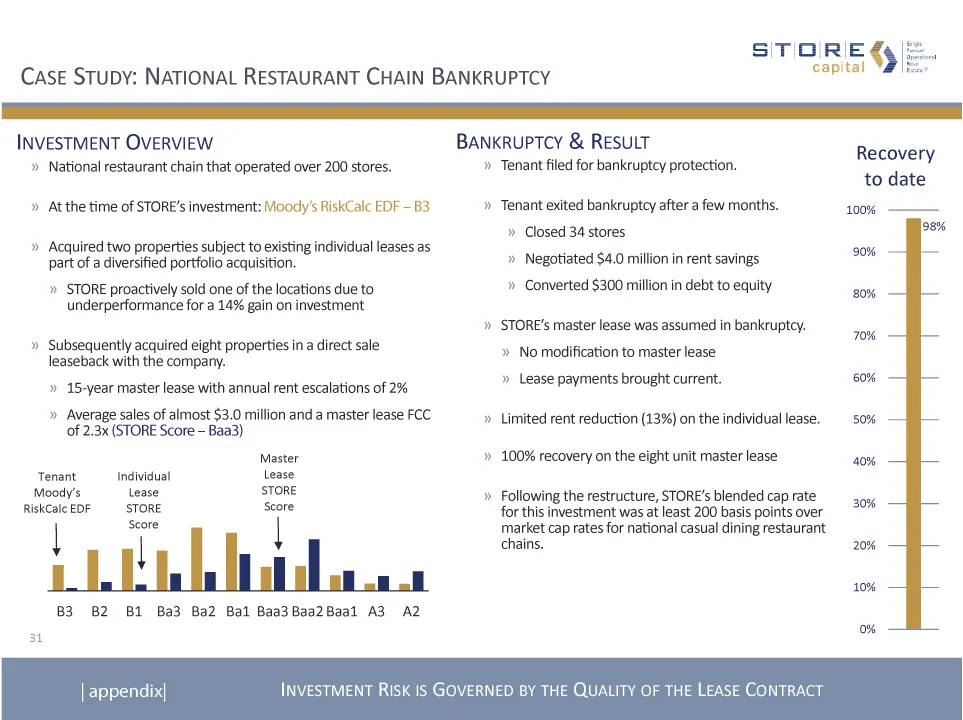
Slide 31: Case Study: National Restaurant Chain Bankruptcy
Case Study: National Restaurant Chain Bankruptcy Investment Overview National restaurant chain that operated over 200 stores.At the time of STORE’s investment: Moody’s RiskCalc EDF – B3Acquired two properties subject to existing individual leases as part of a diversified portfolio acquisition.STORE
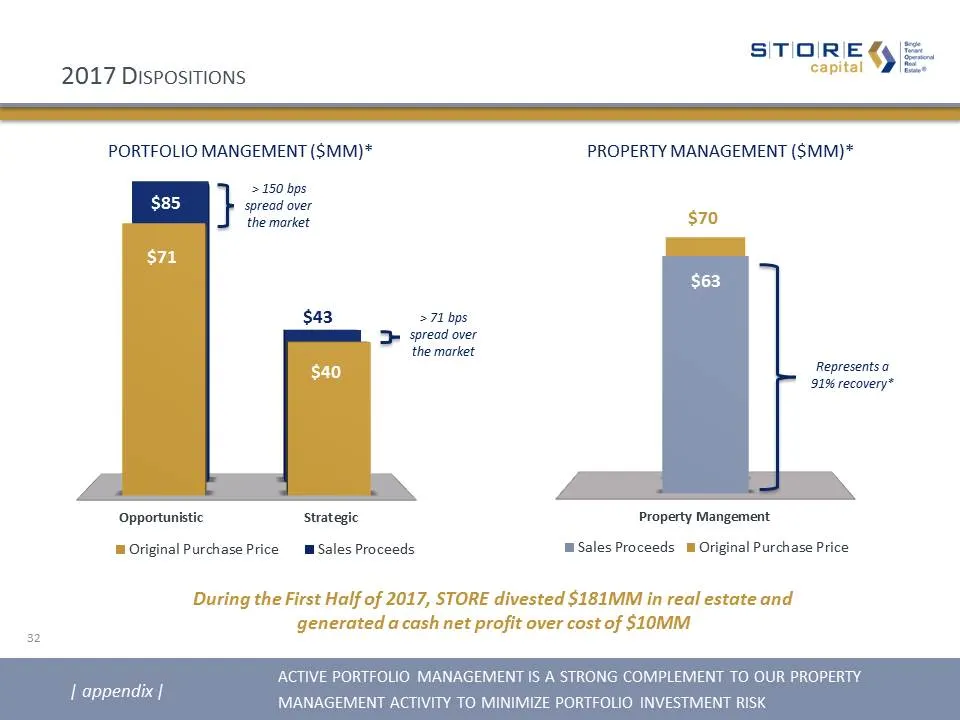
Slide 32: 2017 Dispositions
2017 Dispositions | appendix | active portfolio management is a strong complement to our property management activity to minimize portfolio investment risk During the First Half of 2017, STORE divested $181MM in real estate and generated a cash net profit over cost of $10MM > 150 bps spread over the
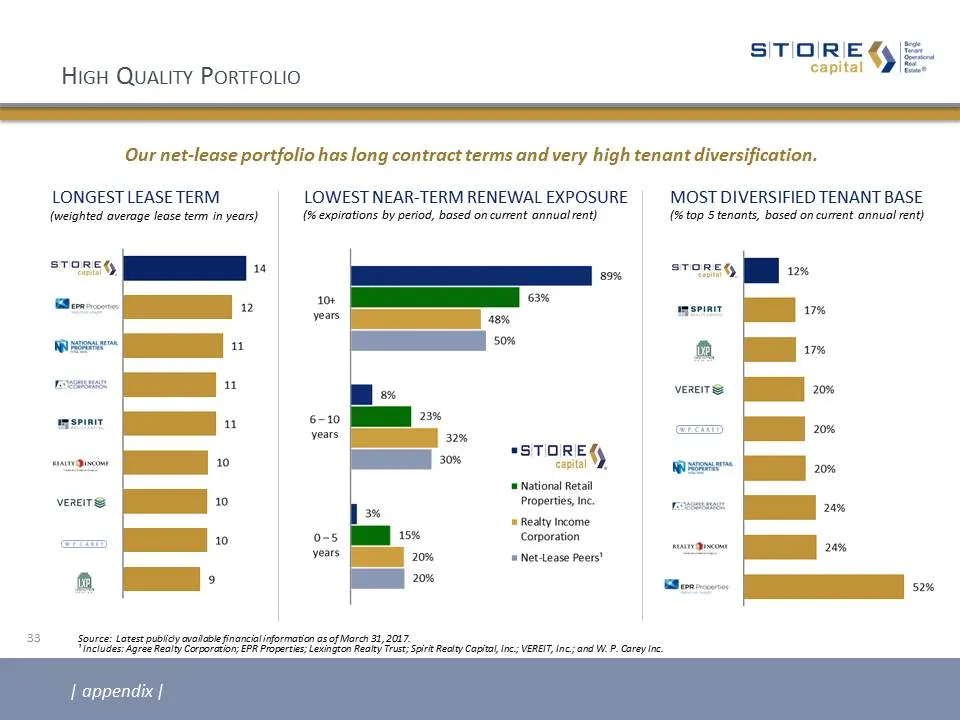
Slide 33: Most Diversified Tenant Base
Most Diversified Tenant Base Source: Latest publicly available financial information as of March 31, 2017. ¹ Includes: Agree Realty Corporation; EPR Properties; Lexington Realty Trust; Spirit Realty Capital, Inc.; VEREIT, Inc.; and W. P. Carey Inc. (weighted average lease term in years) Longest Leas
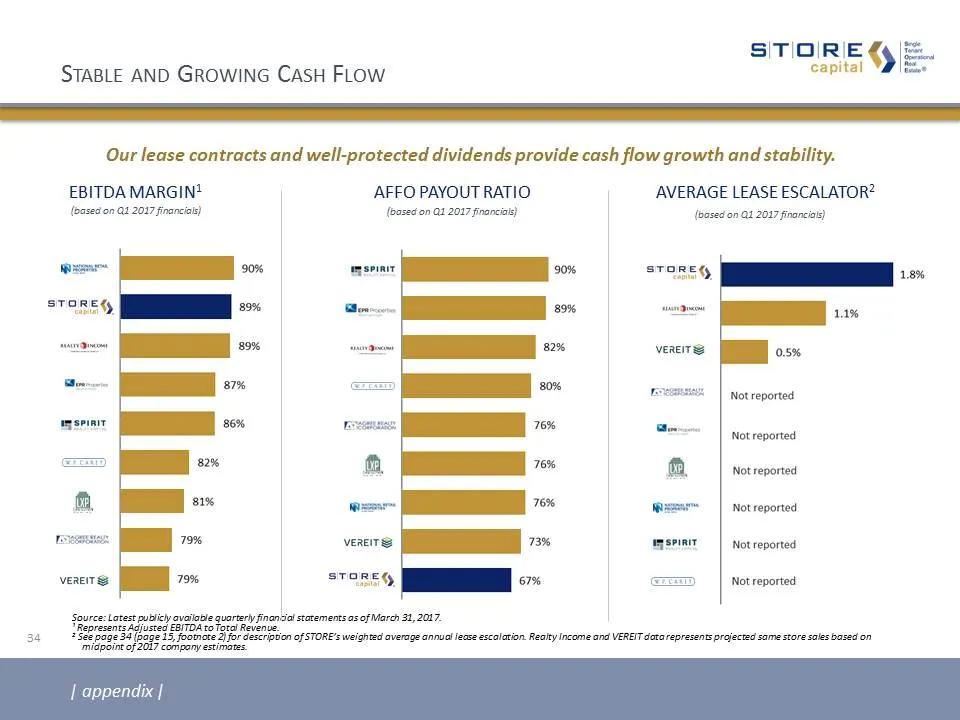
Slide 34: Stable and Growing Cash Flow
ebitda margin1 Average Lease escalator2 Source: Latest publicly available quarterly financial statements as of March 31, 2017. ¹ Represents Adjusted EBITDA to Total Revenue.2 See page 34 (page 15, footnote 2) for description of STORE’s weighted average annual lease escalation. Realty Income and VERE
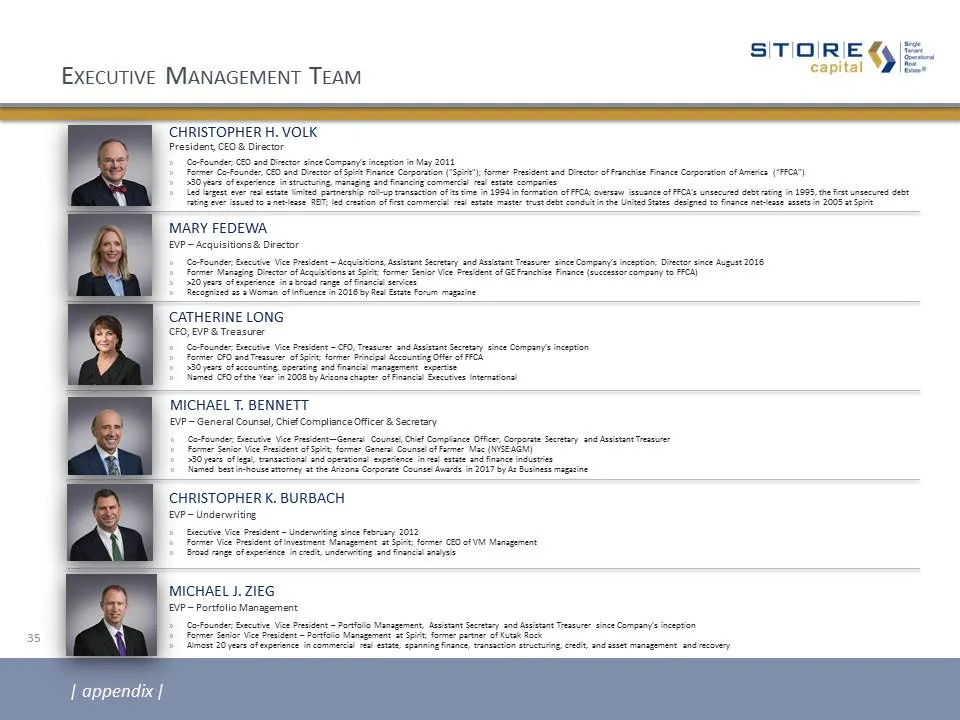
Slide 35: Executive Management Team
MARY FEDEWAEVP – Acquisitions & DirectorCo-Founder; Executive Vice President – Acquisitions, Assistant Secretary and Assistant Treasurer since Company’s inception; Director since August 2016Former Managing Director of Acquisitions at Spirit; former Senior Vice President of GE Franchise Finance (succ
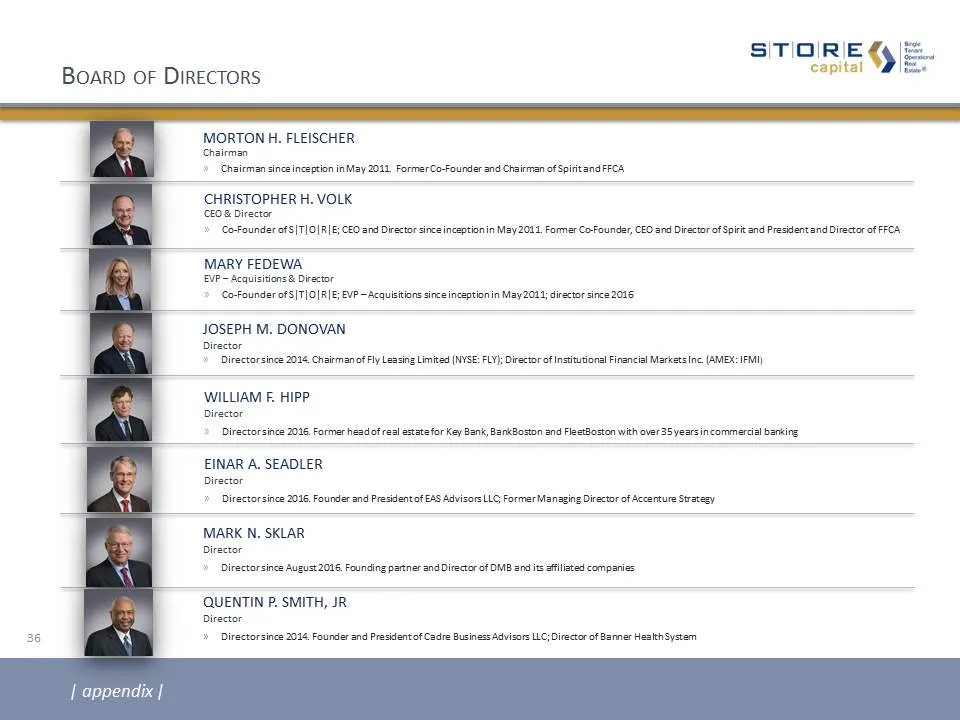
Slide 36: Board of Directors
36 Board of Directors | appendix | MORTON H. FLEISCHERChairmanChairman since inception in May 2011. Former Co-Founder and Chairman of Spirit and FFCA MARY FEDEWAEVP – Acquisitions & DirectorCo-Founder of S|T|O|R|E; EVP – Acquisitions since inception in May 2011; director since 2016 William F. HippDi
Slide 37: Footnotes
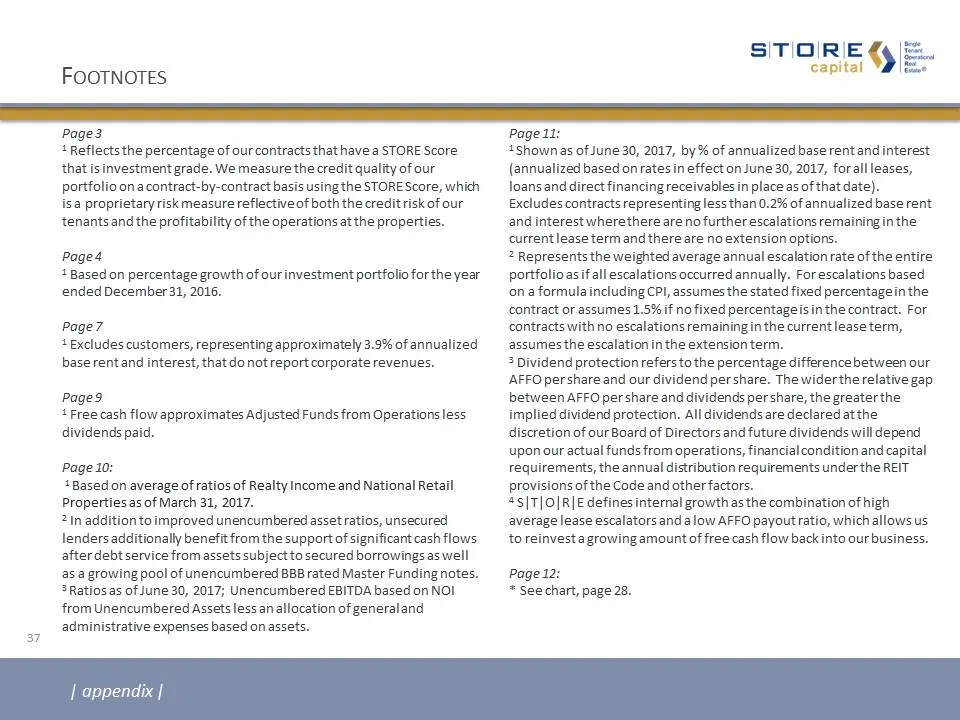
37 Footnotes Page 31 Reflects the percentage of our contracts that have a STORE Score that is investment grade. We measure the credit quality of our portfolio on a contract-by-contract basis using the STORE Score, which is a proprietary risk measure reflective of both the credit risk of our tenants
Slide 38: Footnotes
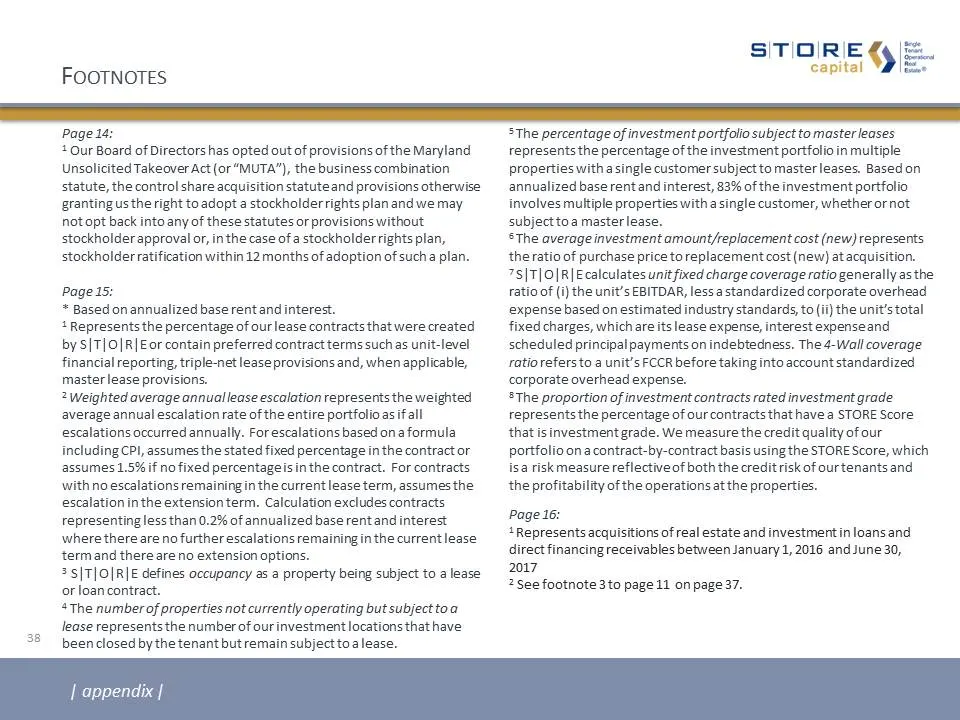
Footnotes | appendix | 38 5 The percentage of investment portfolio subject to master leases represents the percentage of the investment portfolio in multiple properties with a single customer subject to master leases. Based on annualized base rent and interest, 83% of the investment portfolio involv
Slide 39: Footnotes
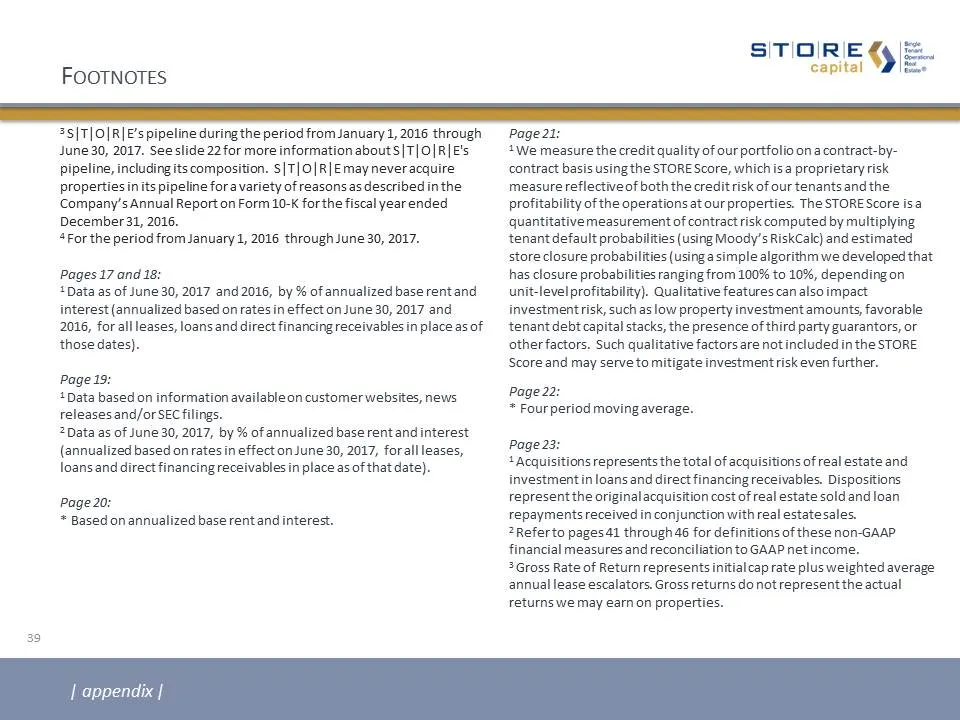
Footnotes | appendix | 39 3 S|T|O|R|E’s pipeline during the period from January 1, 2016 through June 30, 2017. See slide 22 for more information about S|T|O|R|E's pipeline, including its composition. S|T|O|R|E may never acquire properties in its pipeline for a variety of reasons as described in the
Slide 40: Footnotes
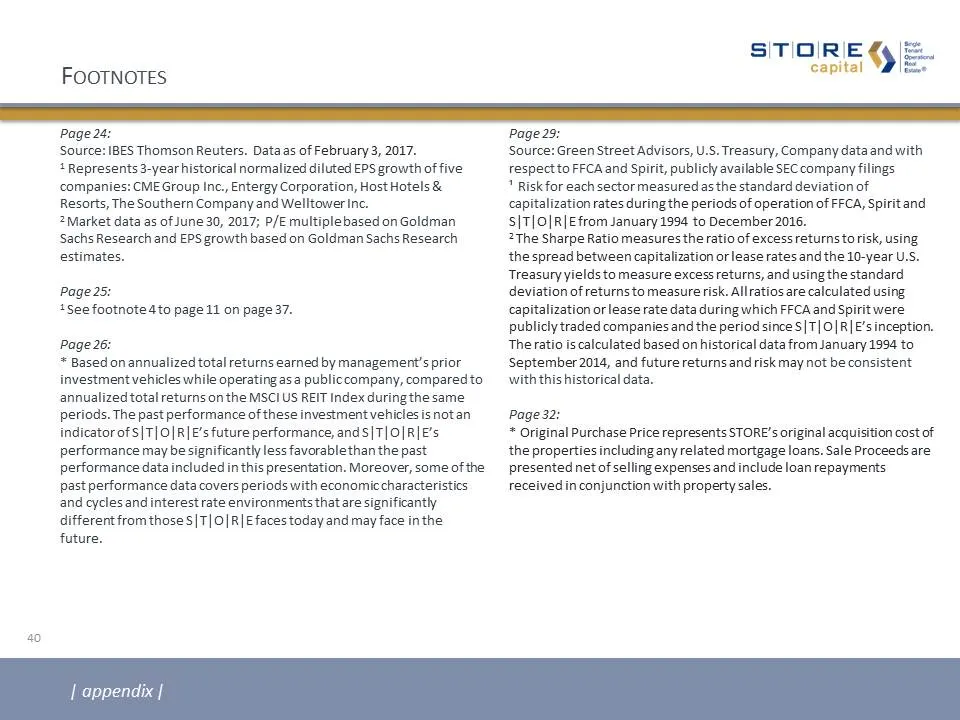
Footnotes | appendix | 40 Page 24:Source: IBES Thomson Reuters. Data as of February 3, 2017.1 Represents 3-year historical normalized diluted EPS growth of five companies: CME Group Inc., Entergy Corporation, Host Hotels & Resorts, The Southern Company and Welltower Inc.2 Market data as of June 30,
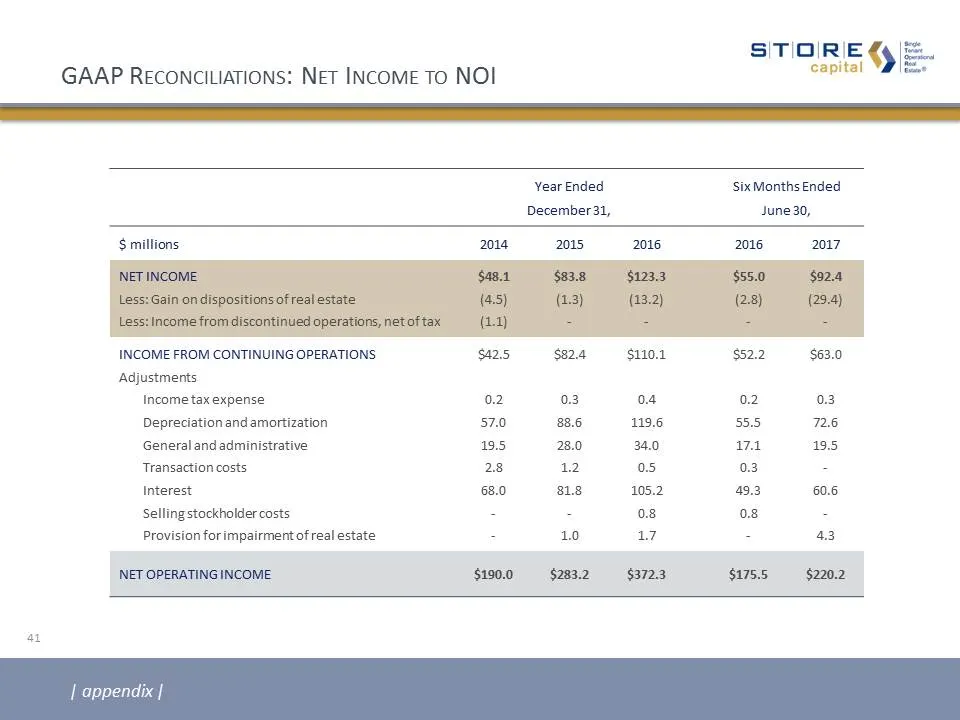
Slide 41: GAAP Reconciliations: Net Income to NOI
GAAP Reconciliations: Net Income to NOI Year EndedDecember 31, Six Months EndedJune 30, $ millions 2014 2015 2016 2016 2017 NET INCOMELess: Gain on dispositions of real estateLess: Income from discontinued operations, net of tax $48.1(4.5)(1.1) $83.8(1.3)- $123.3(13.2)- $55.0(2.8)- $92.4(29.4)- INCO
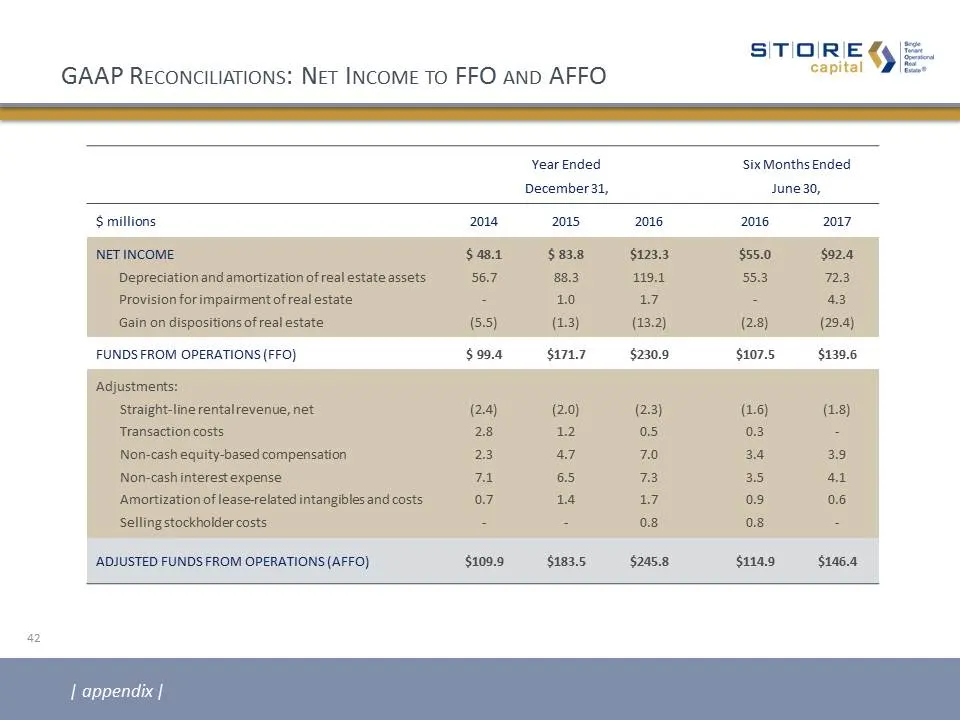
Slide 42: GAAP Reconciliations: Net Income to FFO and AFFO
GAAP Reconciliations: Net Income to FFO and AFFO Year EndedDecember 31, Six Months EndedJune 30, $ millions 2014 2015 2016 2016 2017 NET INCOME Depreciation and amortization of real estate assets Provision for impairment of real estate Gain on dispositions of real estate $ 48.156.7-(5.5) $ 83.888.31
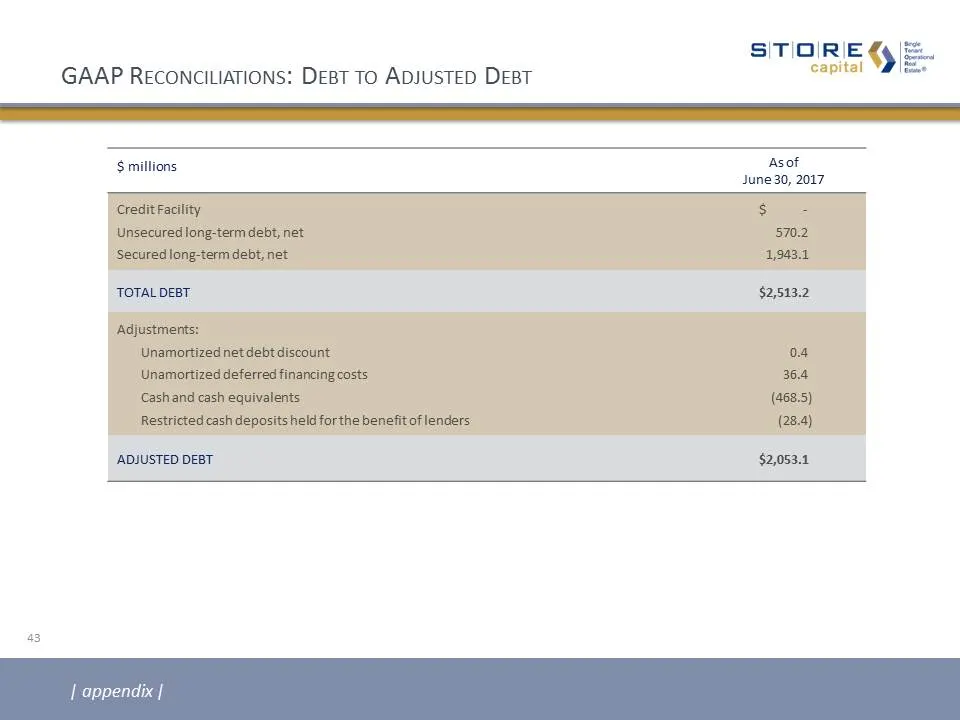
Slide 43: GAAP Reconciliations: Debt to Adjusted Debt
GAAP Reconciliations: Debt to Adjusted Debt $ millions As ofJune 30, 2017 Credit FacilityUnsecured long-term debt, netSecured long-term debt, net $ - 570.2 1,943.1 TOTAL DEBT $2,513.2 Adjustments:Unamortized net debt discountUnamortized deferred financing costsCash and cash equivalentsRestricted cas
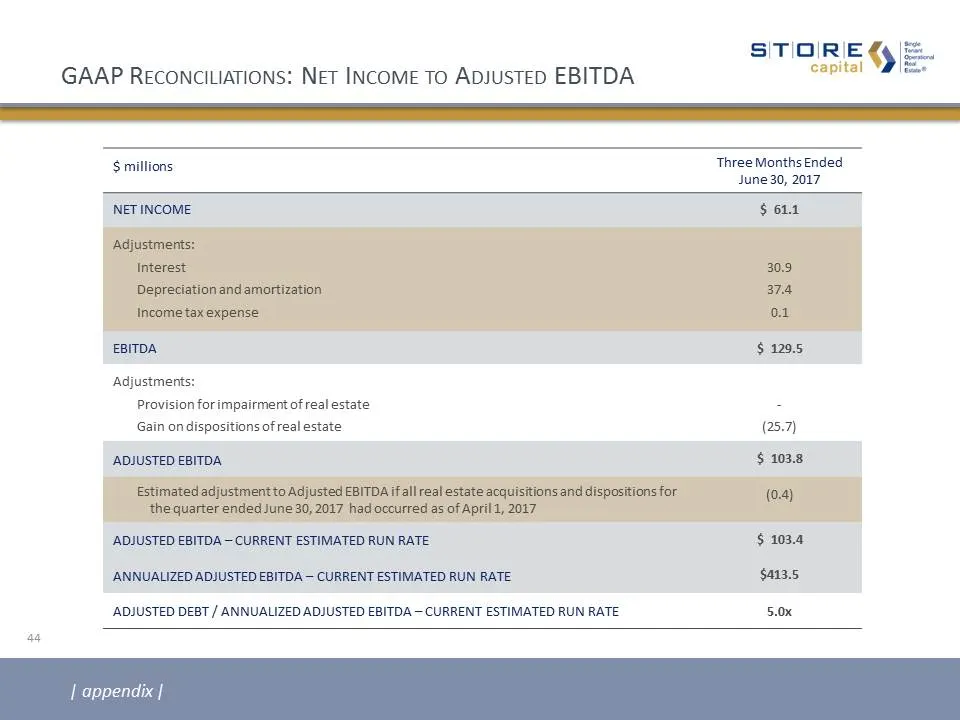
Slide 44: GAAP Reconciliations: Net Income to Adjusted EBITDA
GAAP Reconciliations: Net Income to Adjusted EBITDA $ millions Three Months Ended June 30, 2017 NET INCOME $ 61.1 Adjustments:InterestDepreciation and amortizationIncome tax expense 30.937.40.1 EBITDA $ 129.5 Adjustments:Provision for impairment of real estateGain on dispositions of real estate -(25
Slide 45: Supplemental Reporting Measures
Supplemental Reporting Measures Funds from Operations, or FFO, and Adjusted Funds from Operations, or AFFO Our reported results are presented in accordance with U.S. generally accepted accounting principles, or GAAP. We also disclose Funds from Operations, or FFO, and Adjusted Funds from Operations,
Slide 46: Supplemental Reporting Measures (Continued)
Supplemental Reporting Measures (Continued) EBITDA, Adjusted EBITDA, Annualized Adjusted EBITDA and Adjusted DebtEBITDA represents earnings before interest, taxes, depreciation and amortization.Adjusted EBITDA represents EBITDA modified to include other adjustments to GAAP net income for transaction
Slide 47: STORE Capital
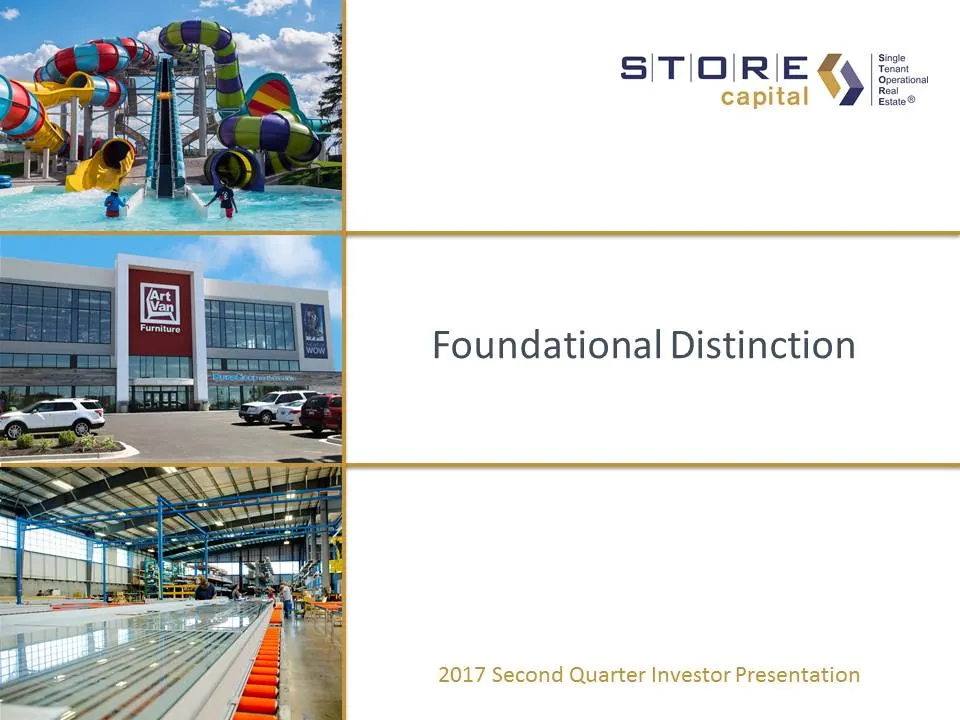
S|TIO|RIE 9 capital Foundational Distinction 2017 Second Quarter Investor Presentation
Source: SEC EDGAR · 8-K filed Aug 4, 2017
More decks from STORE Capital Corp
 Q2 2023 Earnings Presentation10 slides · Aug 4, 2023
 Q2 2022 Earnings Presentation26 slides · Aug 3, 2022
 Q2 2022 Earnings Presentation22 slides · Aug 3, 2022
 Q1 2022 Earnings Presentation26 slides · May 4, 2022
 Q1 2022 Earnings Presentation22 slides · May 4, 2022
 Q4 2021 Earnings Presentation33 slides · Feb 23, 2022