Nationwide Health Properties Inc
Nationwide Health Properties — Investor Presentation (December 2003)
81 slides from Nationwide Health Properties's investor presentation, Dec 1, 2003

Slide 1: Nationwide Health Properties, Inc.
NHP NHP NATIONWIDE HEALTH PROPERTIES, INC. NYSE:NHP www.nhp-reit.com
Slide 2: Disclaimer
FFO is a non-GAAP measure that we tab on the menu DISCLAIMER or comparable terms or the negative thereof. All forward- A reconciliation between FFO and net income, the News, Filings, Governance . www.nhp-reit.com Certain information contained in this presentation includes forward-looking statements,
Slide 3: Presentation Overview
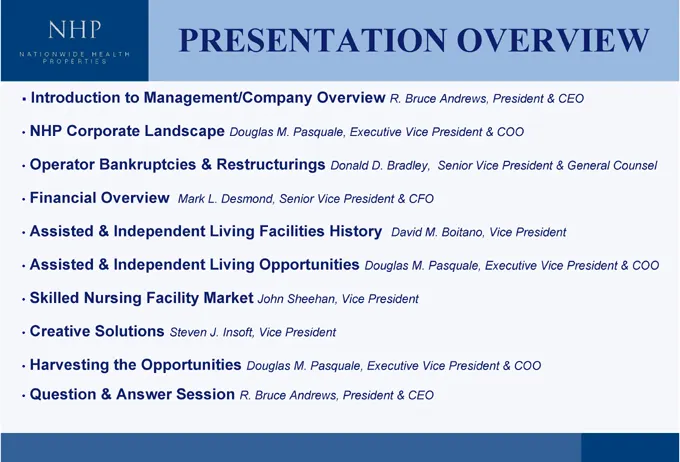
• COO Counsel & CEO General President & • President Vice • COO President COO President Vice & OVERVIEW & Vice Executive President Andrews, President Senior Boitano, Pasquale, M. Vice Bruce Vice CFO M. CEO • R. Bradley, & David & Executive D. President Douglas President Executive President Donald His
Slide 4: Investor Highlights
• HIGHLIGHTS Systems • Profile Monitoring Oriented INVESTOR Fundamentals Company Grade Yield Portfolio Operator Portfolio Dividend Opportunities Industry Quality Conservative Investment High Extensive Experienced Management Great • • • • • • •
Slide 5: Criteria of Investment
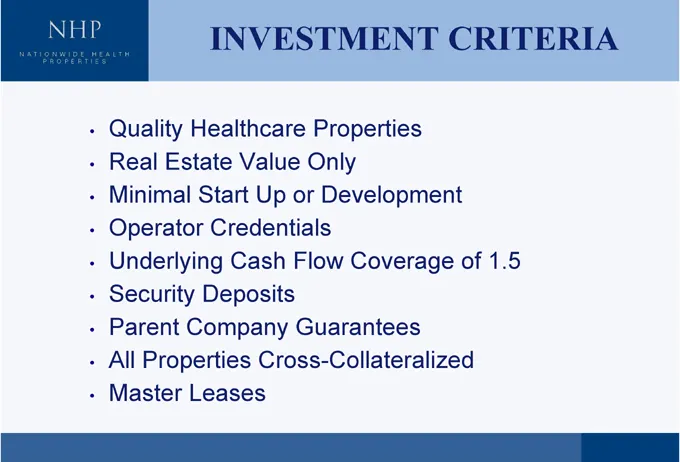
• 1.5 • CRITERIA of • Properties Development Coverage Only Flow Guarantees or Cross-Collateralized INVESTMENT Value Up Credentials Cash Deposits Healthcare Estate Start Company Properties Leases Quality Real Minimal Operator Underlying Security Parent All Master • • • • • • • •
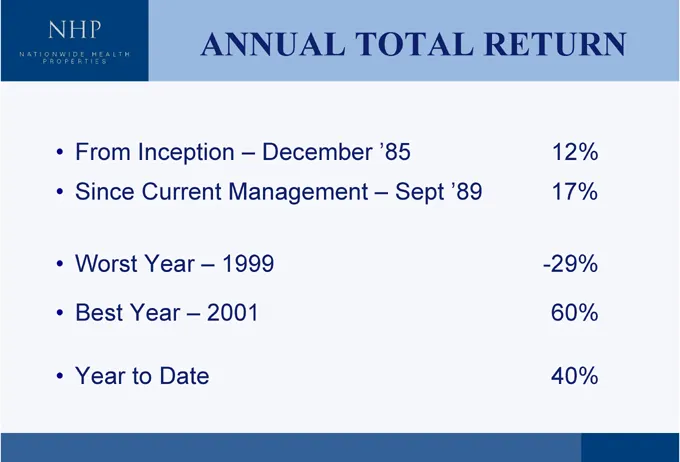
Slide 6: Annual Total Return
12% 17% -29% 60% 40% Sept ‘89 December ‘85 ANNUAL TOTAL RETURN From Inception – Since Current Management – 1999 2001 Worst Year – Best Year – Year to Date • • • • •
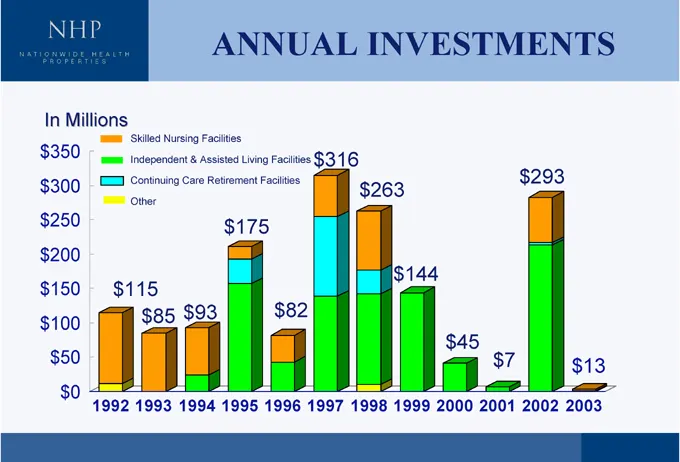
Slide 7: Annual Investments
$13 $293 $7 $45 $144 $263 $316 $82 ANNUAL INVESTMENTS $175 $93 Skilled Nursing Facilities Independent & Assisted Living Facilities Continuing Care Retirement Facilities Other $85 $115 1992 1993 1994 1995 1996 1997 1998 1999 2000 2001 2002 2003 In Millions $350 $300 $250 $200 $150 $100 $50 $0

Slide 8: NHP Corporate Landscape
NHP NHP Corporate Landscape
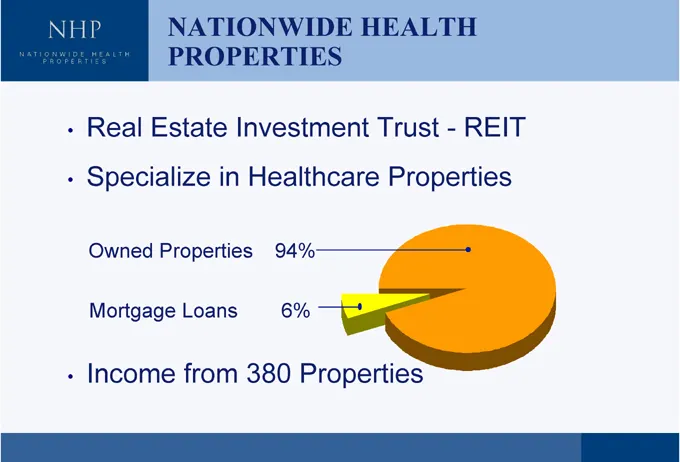
Slide 9: Nationwide Health Properties
• REIT • Properties • HEALTH Trust Properties Healthcare 94% 6% Investment 380 • NATIONWIDE PROPERTIES in Properties Loans from Estate Real Specialize Owned Mortgage Income • •
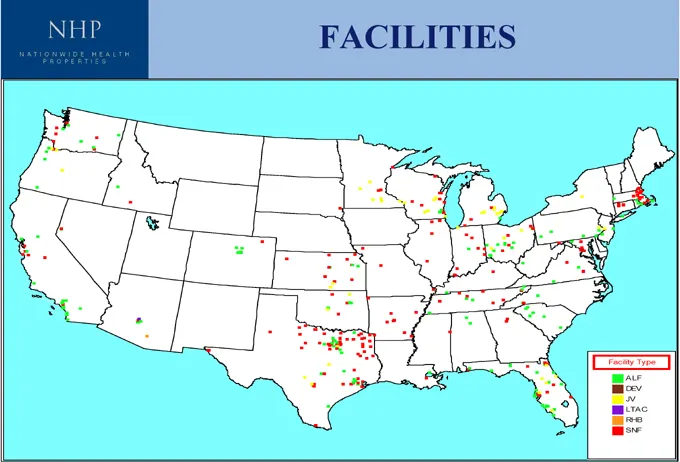
Slide 10: Facilities by Facility Type
Facility Type ALF DEV JV LTAC RHB SNF FACILITIES
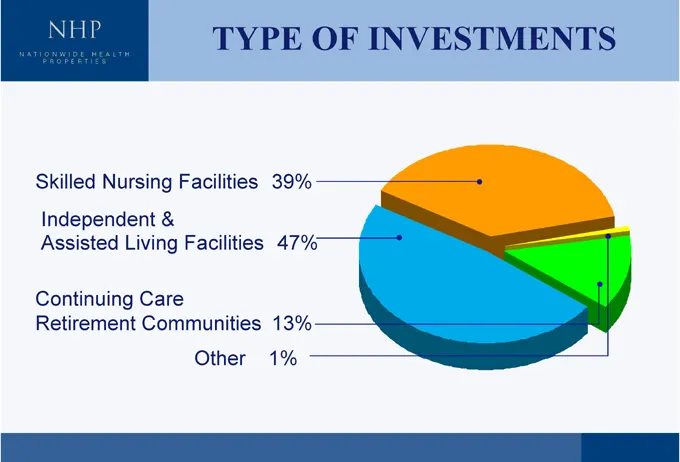
Slide 11: Type of Investments
TYPE OF INVESTMENTS 39% 47% 13% 1% Assisted Living Facilities Other Skilled Nursing Facilities Independent & Continuing Care Retirement Communities
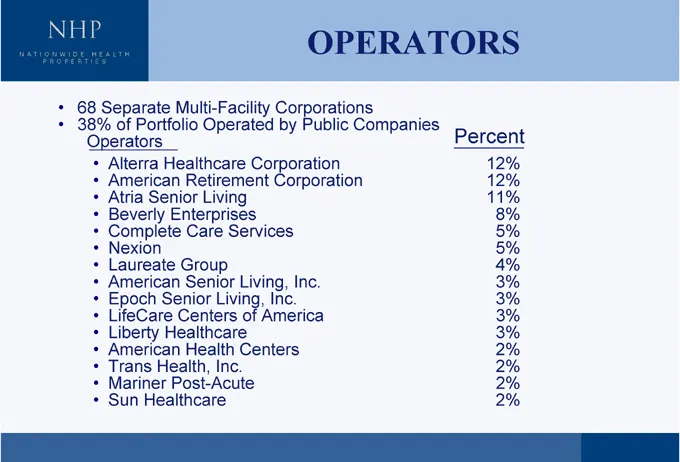
Slide 12: Operators
• Percent 12%12%11%8%5%5%4%3%3%3%3%2%2%2%2% • OPERATORS Companies • Public Inc. Corporationsby CorporationCorporation Inc.America Services Living,Living,of Centers Operated Living Inc. Multi-Facility HealthcareRetirement EnterprisesCare GroupSeniorSeniorCentersHealthcareHealthHealth,Post-Acute Portf
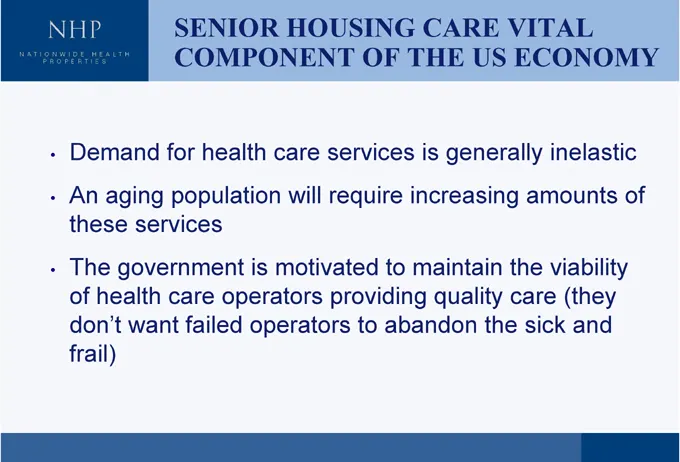
Slide 13: Senior Housing: A Vital Component of the Health Care Economy
• of inelastic amounts viability (they and • VITAL ECONOMY the care sick • US generally quality the CARE THE is increasing maintain OF to abandon services require providing to HOUSING care will motivated health is operators operators SENIOR COMPONENT population care failed for services aging governm
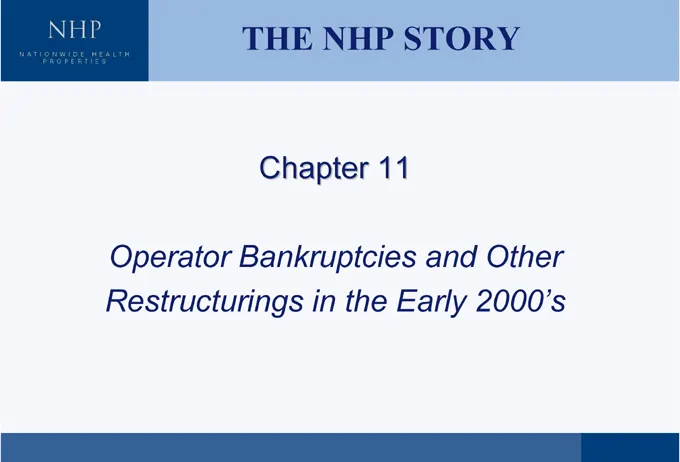
Slide 14: The NHP Story
THE NHP STORY Chapter 11 Operator Bankruptcies and Other Restructurings in the Early 2000’s
Slide 15: Overview
OVERVIEW What Happened to NHP & Its Markets In the Early 2000’s? • Where Are We Now with Our Bankruptcies and Other Restructurings? • What Restructuring Lessons Have We Learned? •
Slide 16: What Happened to NHP & Its Markets in the Early 2000s
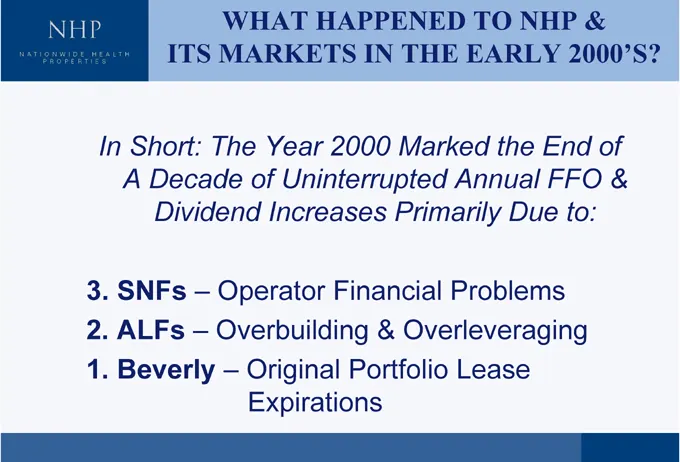
Original Portfolio Lease Expirations WHAT HAPPENED TO NHP & Operator Financial Problems Overbuilding & Overleveraging – ITS MARKETS IN THE EARLY 2000’S? A Decade of Uninterrupted Annual FFO & Dividend Increases Primarily Due to: – –In Short: The Year 2000 Marked the End of SNFs ALFs Beverly 3. 2. 1.
Slide 17: Operator #3: SNF Financial Problems
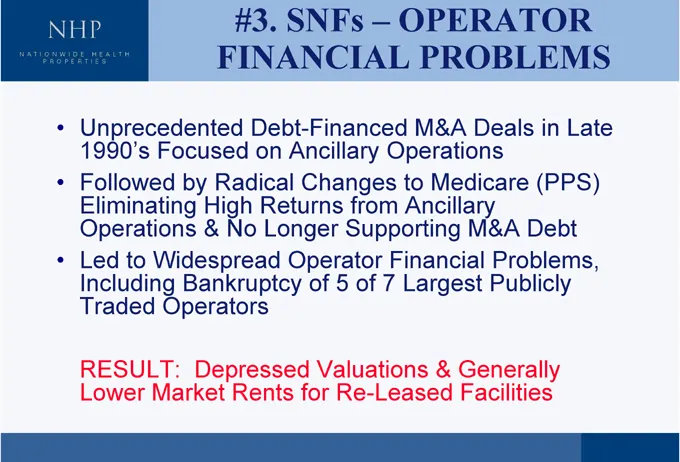
OPERATOR #3. SNFs – FINANCIAL PROBLEMS Unprecedented Debt-Financed M&A Deals in Late 1990’s Focused on Ancillary Operations Followed by Radical Changes to Medicare (PPS) Eliminating High Returns from Ancillary Operations & No Longer Supporting M&A Debt Led to Widespread Operator Financial Problems,
Slide 18: Operator #2: Overbuilding & Overleveraging
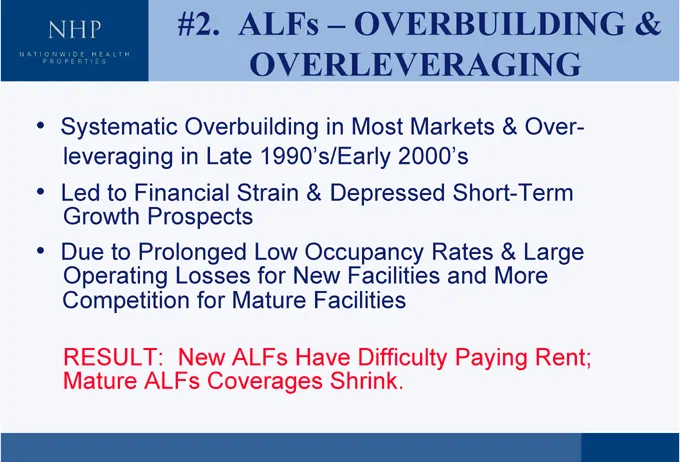
OVERBUILDING & OVERLEVERAGING Depressed Short-Term ALFs – #2. New ALFs Have Difficulty Paying Rent; Systematic Overbuilding in Most Markets & Over- leveraging in Late 1990’s/Early 2000’s Led to Financial Strain &Growth Prospects Due to Prolonged Low Occupancy Rates & LargeOperating Losses for New Fa
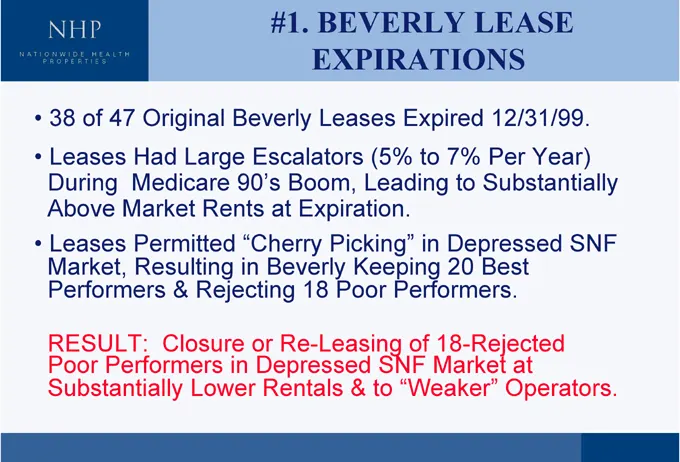
Slide 19: #1 Beverly Lease Expirations
#1. BEVERLY LEASE EXPIRATIONS Medicare 90’s Boom, Leading to Substantially Closure or Re-Leasing of 18-Rejected • 38 of 47 Original Beverly Leases Expired 12/31/99. • Leases Had Large Escalators (5% to 7% Per Year) During Above Market Rents at Expiration. • Leases Permitted “Cherry Picking” in Depre
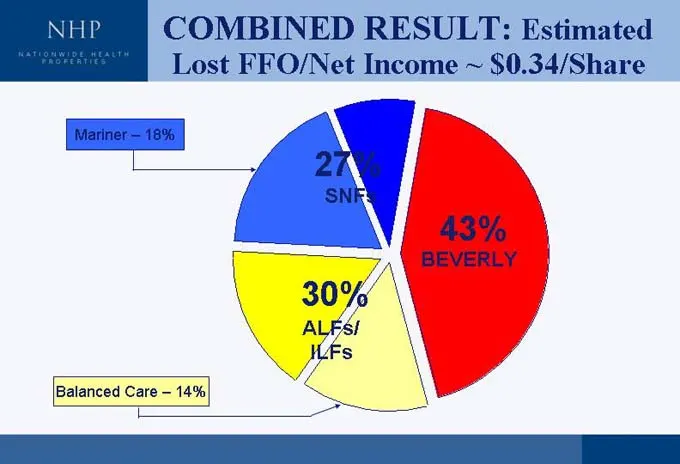
Slide 20: Combined Result: Estimated Lost FFO
43% BEVERLY COMBINED RESULT: 27% SNFs 30% ALFs/ ILFs Estimated Lost FFO ~ $0.34/Share 14% 18% Mariner – Balanced Care –/Net Income
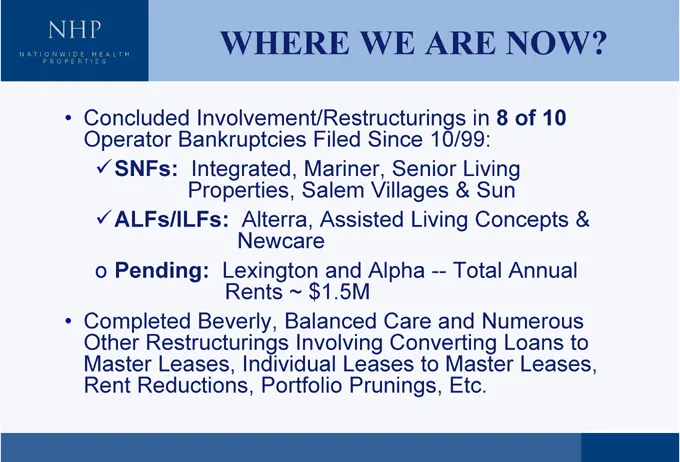
Slide 21: Where Are We Now?
• & to • 10 Leases, NOW? of Annual Loans • 8 Sun Concepts Numerous in Living • Total and MasterEtc. • ARE 10/99: Senior Living — Convertingto WE Since Villages Alpha Care LeasesPrunings, Filed Mariner,Salem Assisted and$1.5M Involving Alterra,Newcare ~ Balanced IndividualPortfolio WHERE Involvement/
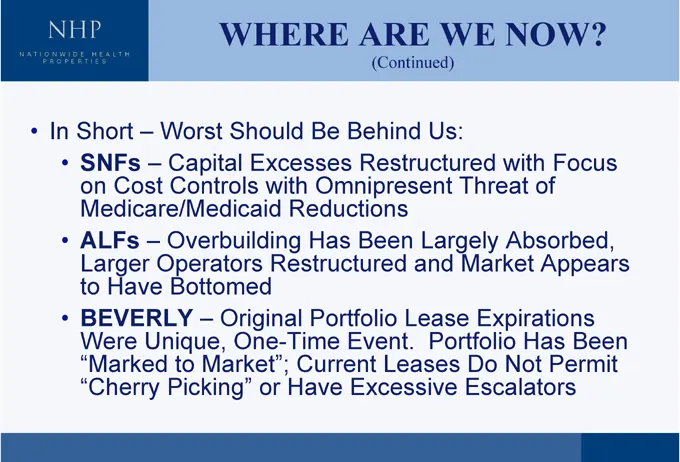
Slide 22: Where Are We Now? (Continued)
• Focus Appears BeenPermit NOW? of Absorbed, Has with Expirations Not WE Threat Market PortfolioDoEscalators (Continued) Us: Restructured Largelyand Lease Leases ARE Behind Omnipresent Been Event. Excessive Be Reductions HasRestructured Portfolio CurrentHave WHERE Should Excesseswith OriginalOne-Tim
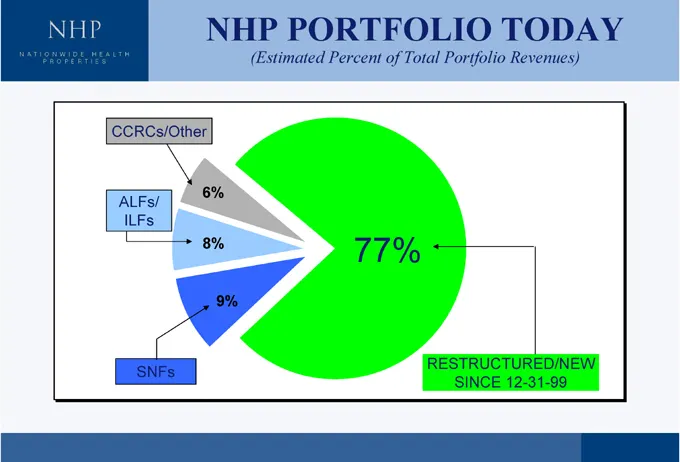
Slide 23: NHP Portfolio Today: Restructured/New Since 12-31-99
RESTRUCTURED/NEW SINCE 12-31-99 (Estimated Percent of Total Portfolio Revenues) 77% NHP PORTFOLIO TODAY 9% 6% 8% CCRCs/Other ALFs/ ILFs SNFs
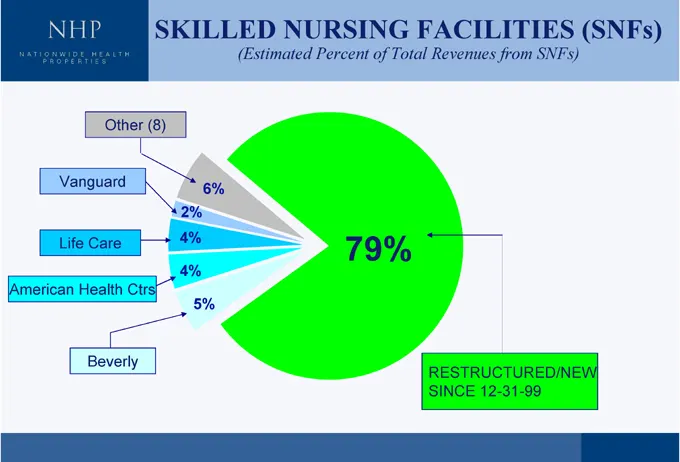
Slide 24: Skilled Nursing Facilities: Restructured/New
RESTRUCTURED/NEW SINCE 12-31-99 (Estimated Percent of Total Revenues from SNFs) 79% 6% 5% SKILLED NURSING FACILITIES (SNFs) 2% 4% 4% Other (8) Beverly Vanguard Life Care American Health Ctrs
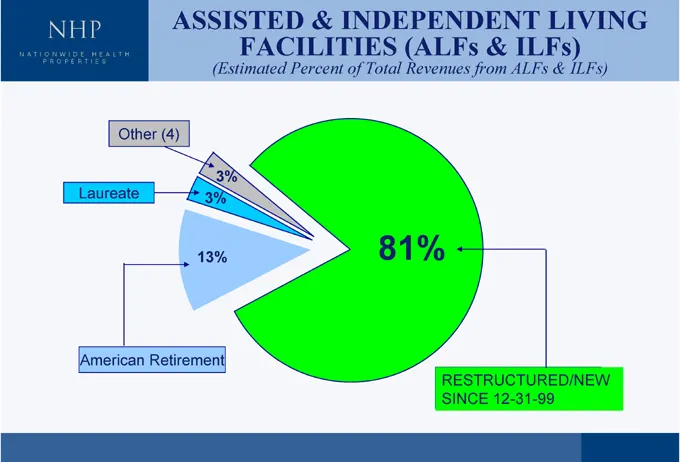
Slide 25: Assisted & Independent Living: Restructured/New
RESTRUCTURED/NEW SINCE 12-31-99 FACILITIES (ALFs & ILFs) 81% ASSISTED & INDEPENDENT LIVING (Estimated Percent of Total Revenues from ALFs & ILFs) 3% 3% 13% Other (4) American Retirement Laureate
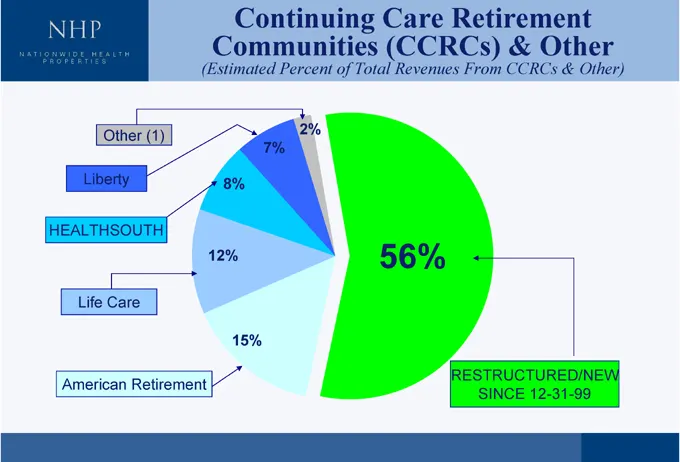
Slide 26: CCRCs & Other: Restructured/New
RESTRUCTURED/NEW SINCE 12-31-99 56% 2% Continuing Care Retirement 7% Communities (CCRCs) & Other 8% 15% (Estimated Percent of Total Revenues From CCRCs & Other) 12% Other (1) Liberty HEALTHSOUTH Life Care American Retirement
Slide 27: % of Revenues by Operator
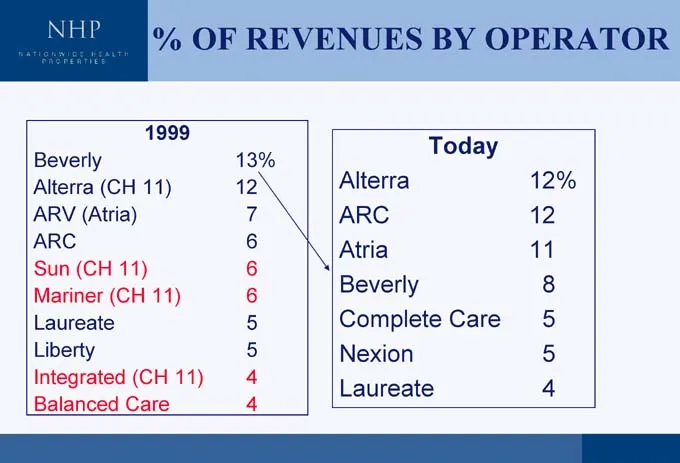
12% 12 11 8 5 5 4 Today Alterra ARC Atria Beverly Complete Care Nexion Laureate % OF REVENUES BY OPERATOR 13% 12 7 6 6 6 5 5 4 4 1999 Beverly Alterra (CH 11) ARV (Atria) Sun (CH 11) Mariner (CH 11) ARC Laureate Liberty Integrated (CH 11) Balanced Care
Slide 28: What Restructuring Lessons Have We Learned?
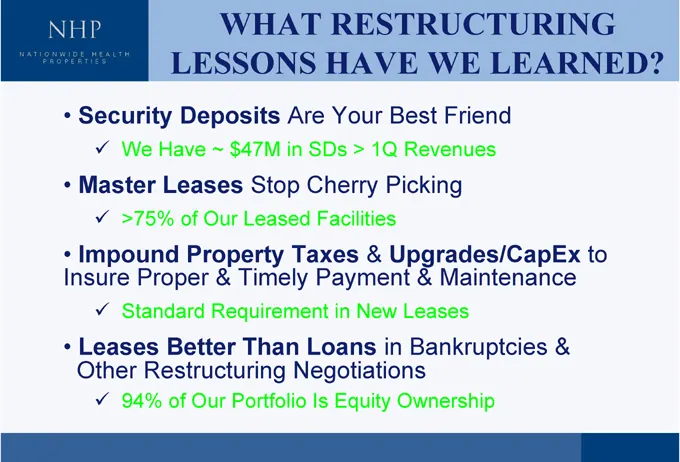
• to • LEARNED? & • WE Friend Maintenance • Best Revenues Picking Upgrades/CapEx& Leases Bankruptcies Ownership • 1Q in • & New > • RESTRUCTURING HAVE Your Facilities Payment in Equity • Are SDs Cherry Taxes LoansNegotiations Is • in Stop Leased Timely Than Portfolio • WHAT $47M • Our Property& Requ
Slide 29: Lessons Learned (Continued)
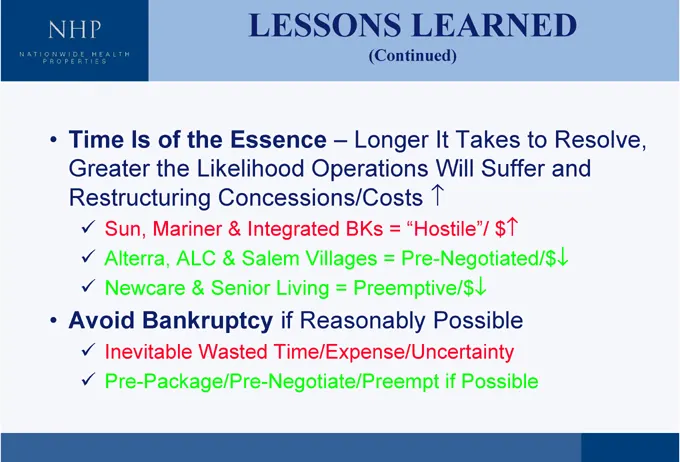
• Resolve, and .. to • . • Suffer $ • Takes . Possible • Will if • LEARNED It . “Hostile”/ Pre-Negotiated/$ Possible (Continued) Longer = = Preemptive/$ BKs • Operations Villages = Reasonably • LESSONS Essence Integrated Salem Living if Time/Expense/Uncertainty • Likelihood Concessions/Costs & & Sen
Slide 30: Lessons Learned (Continued)
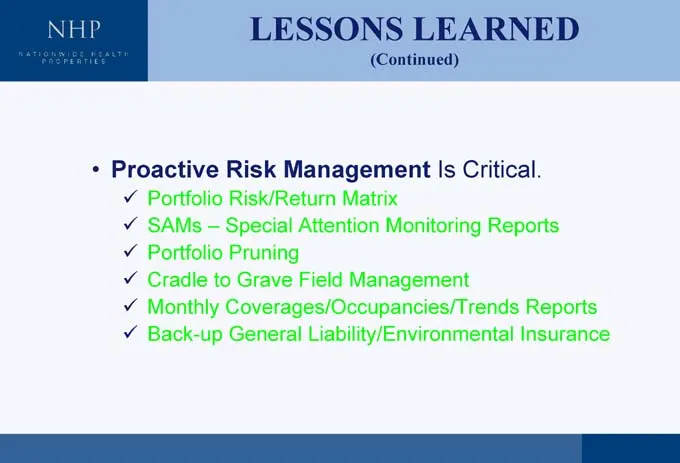
• Reports • Critical. Reports • LEARNED (Continued) Is Monitoring Management Insurance Matrix Liability LESSONS Management Attention Field Risk Risk/Return Special Pruning Grave Coverages/Occupancies/Trends General to Portfolio –SAMs Portfolio Cradle Monthly Back-up • Proactive 9 9 9 9 9 9/Environme
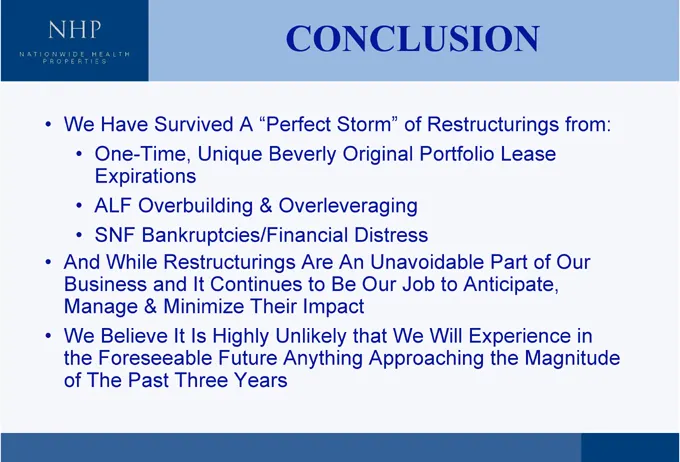
Slide 31: Conclusion
• from: Our in Lease of Magnitude Part Anticipate, Experience the Restructurings Portfolio to Will of Unavoidable Job We Approaching Original Distress Our that Storm” An Be CONCLUSION Beverly Overleveraging Are to Impact Unlikely Anything “Perfect & Their A Unique Continues Highly Future Years It Is
Slide 32: Financial Overview
Financial Overview
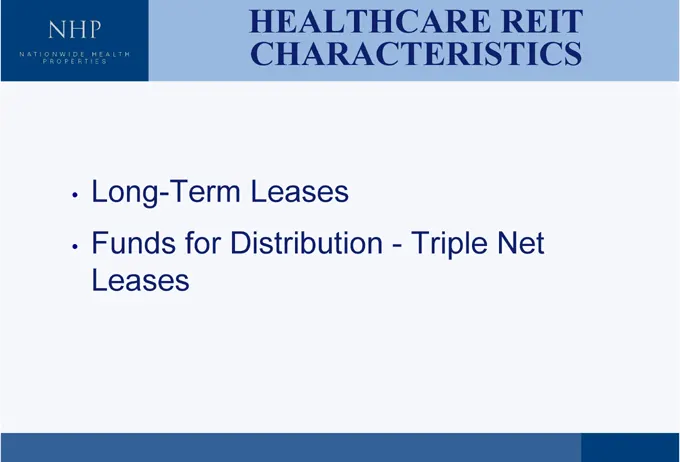
Slide 33: Healthcare REIT Characteristics
• REIT Net • Triple—• HEALTHCARECHARACTERISTICS Leases Distribution • for Long-Term Funds Leases • •
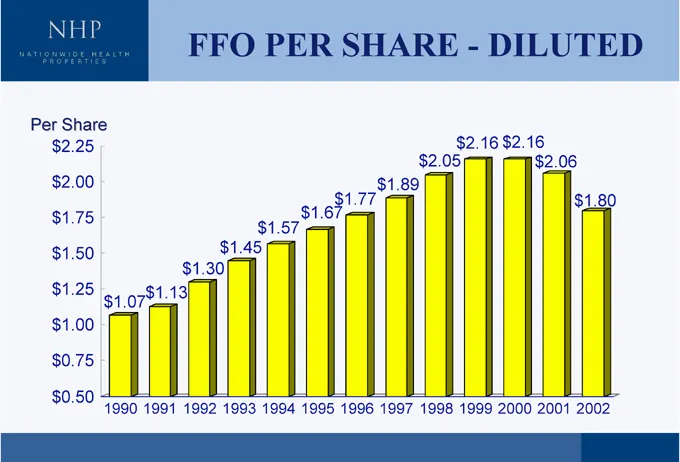
Slide 34: Diluted FFO per Share
$1.80 $2.06 DILUTED $2.16 $2.16 $2.05 $1.89 $1.77 $1.67 $1.57 FFO PER SHARE—$1.45 $1.30 $1.13 1990 1991 1992 1993 1994 1995 1996 1997 1998 1999 2000 2001 2002 $1.07 Per Share $2.25 $2.00 $1.75 $1.50 $1.25 $1.00 $0.75 $0.50
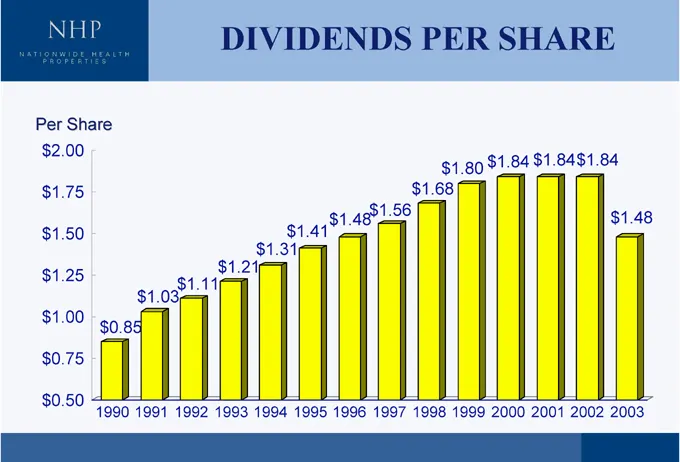
Slide 35: Dividends per Share
$1.48 $1.84$1.84 $1.84 $1.80 $1.68 $1.56 $1.48 $1.41 DIVIDENDS PER SHARE $1.31 $1.21 $1.11 $1.03 $0.85 1990 1991 1992 1993 1994 1995 1996 1997 1998 1999 2000 2001 2002 2003 Per Share $2.00 $1.75 $1.50 $1.25 $1.00 $0.75 $0.50
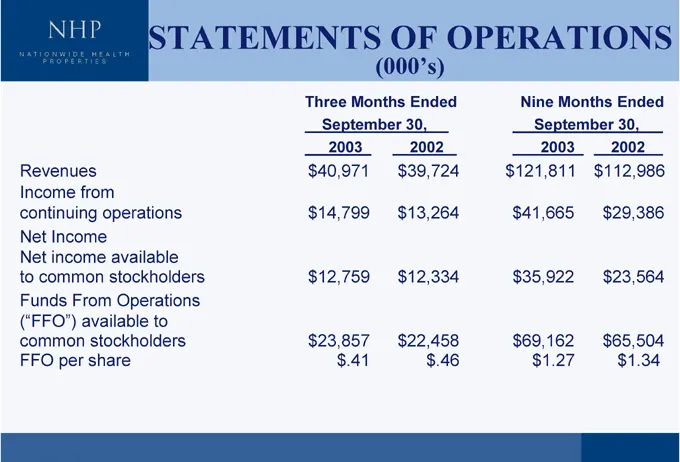
Slide 36: Statements of Operations
2002 $112,986 $29,386 $23,564 $65,504 $1.34 Nine Months Ended September 30, 2003 $121,811 $41,665 $35,922 $69,162 $1.27 (000’s) 2002 $39,724 $13,264 $12,334 $22,458 $.46 STATEMENTS OF OPERATIONS Three Months Ended September 30, 2003 $40,971 $14,799 $12,759 $23,857 $.41 Revenues Income from continuin
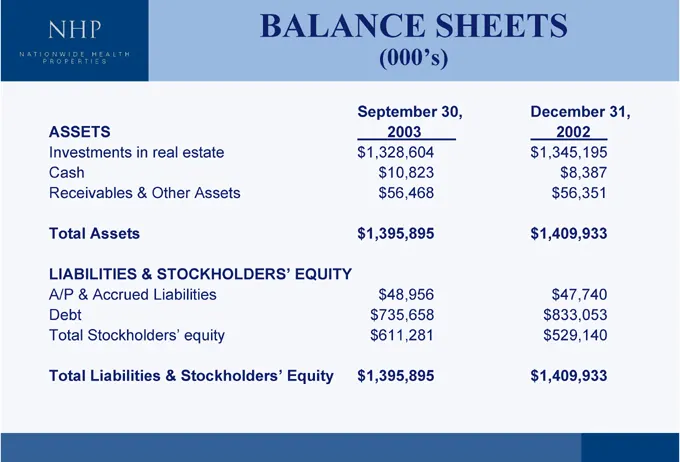
Slide 37: Balance Sheets
December 31, 2002 $1,345,195 $8,387 $56,351 $1,409,933 $47,740 $833,053 $529,140 $1,409,933 BALANCE SHEETS (000’s) September 30, 2003 $1,328,604 $10,823 $56,468 $1,395,895 $48,956 $735,658 $611,281 $1,395,895 ASSETS Investments in real estate Cash Receivables & Other Assets Total Assets LIABILITIES
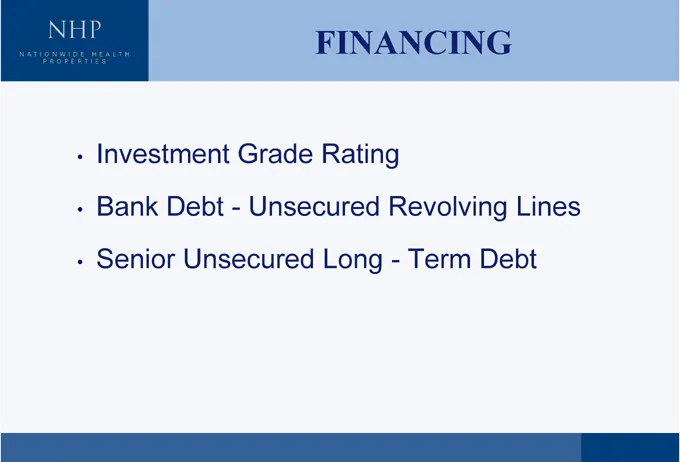
Slide 38: Financing
• Lines Debt Term Revolving -FINANCING Rating Unsecured Long Grade •—Unsecured Debt Investment Bank Senior • •
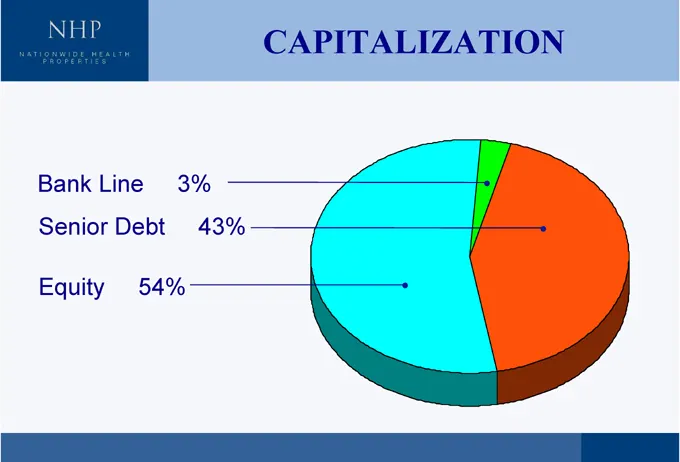
Slide 39: Capitalization
CAPITALIZATION 43% 3% 54% Bank Line Senior Debt Equity
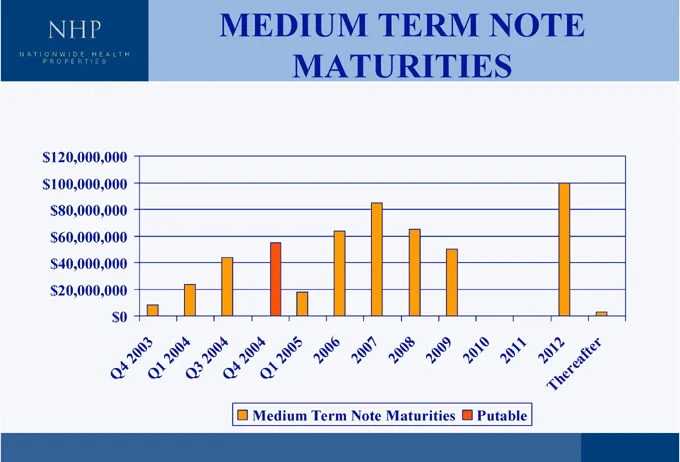
Slide 40: Medium Term Note Maturities
reafter The 2201 1201 Putable 0120 9200 2008 7002 MATURITIES 6200 2005 Q1 Medium Term Note Maturities 0420 MEDIUM TERM NOTE Q4 4020 3 Q 2004 Q1 0320 Q4 $120,000,000 $100,000,000 $80,000,000 $60,000,000 $40,000,000 $20,000,000 $0
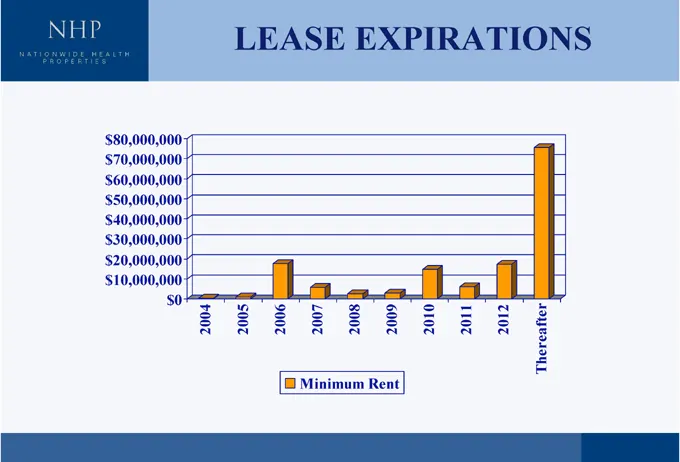
Slide 41: Lease Expirations
Thereafter 2012 2011 2010 2009 2008 2007 Minimum Rent 2006 LEASE EXPIRATIONS 2005 2004 $80,000,000 $70,000,000 $60,000,000 $50,000,000 $40,000,000 $30,000,000 $20,000,000 $10,000,000 $0
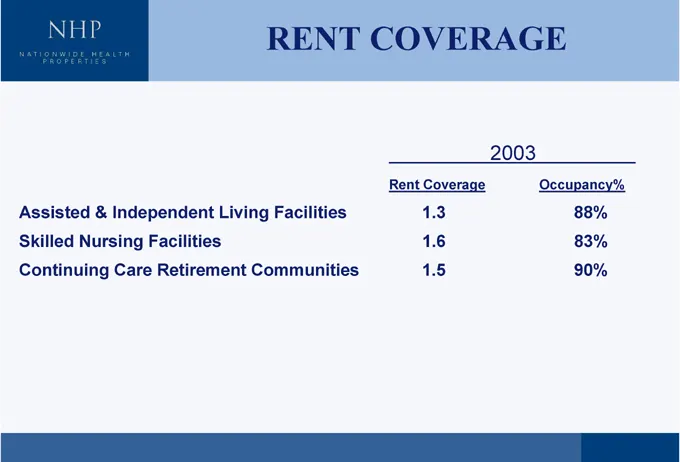
Slide 42: 2003 Rent Coverage
Occupancy% 88% 83% 90% 2003 RENT COVERAGE Rent Coverage 1.3 1.6 1.5 Assisted & Independent Living Facilities Skilled Nursing Facilities Continuing Care Retirement Communities
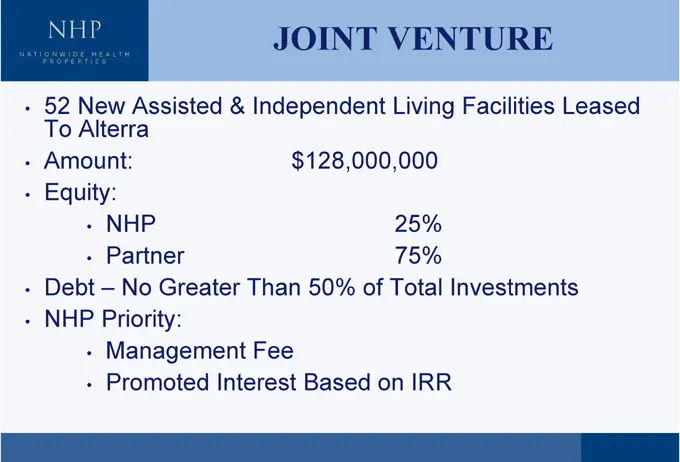
Slide 43: Joint Venture
• Leased • Facilities Investments • VENTURE Living 25% 75% Total IRR on of JOINT $128,000,000 50% Based Independent Than Fee • & Greater Interest Assisted Partner No Promoted NHP – Priority: Management NewAlterra Amount: Equity: • • NHP • • To Debt • • • • •
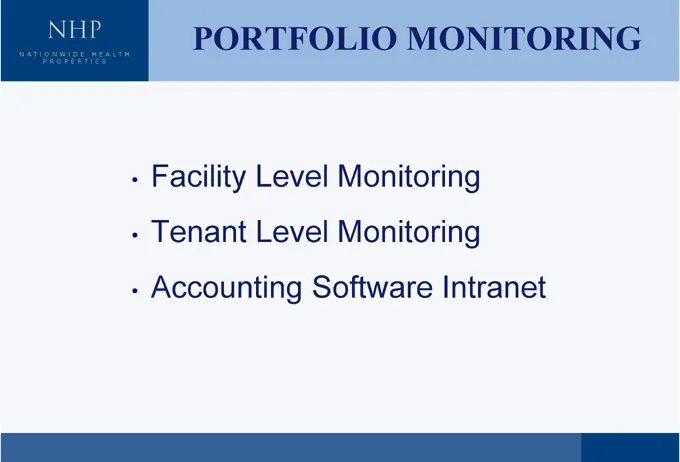
Slide 44: Portfolio Monitoring
• MONITORING Intranet • Monitoring Monitoring Software PORTFOLIO Level Level Accounting Facility Tenant • •
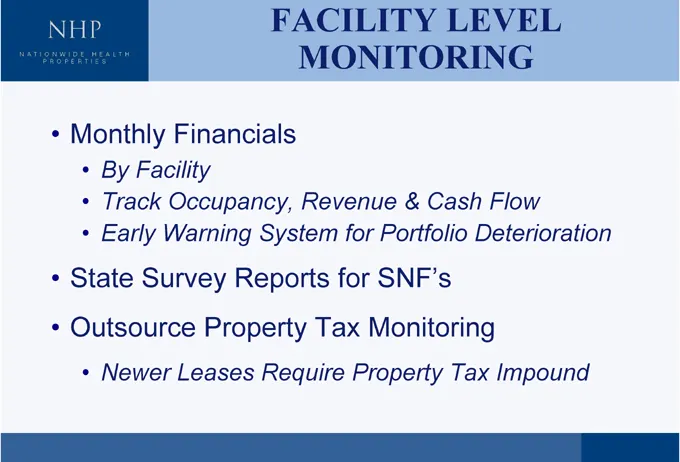
Slide 45: Facility Level Monitoring
• Flow Deterioration Impound LEVEL Cash Tax • Portfolio SNF’s Monitoring Property • FACILITY MONITORING Revenue for for Tax • System Reports Property Require • Financials Occupancy, Warning Survey Leases Facility By Track Early Newer • Monthly • • State Outsource • • • •
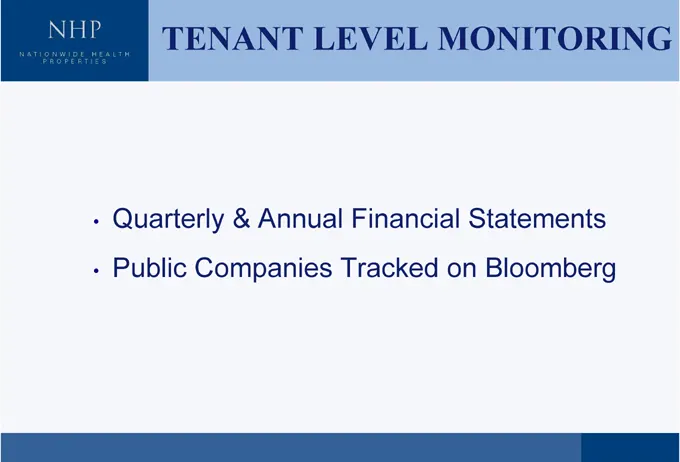
Slide 46: Tenant Level Monitoring
• Statements Bloomberg • MONITORING on • LEVEL Financial Tracked Annual TENANT & Companies Quarterly Public • •
Slide 47: Intranet
• Systems INTRANET Accounting of • NHP Access Part Performance • Access Company Database Details • Based Available Property Tenant/Operator • Web Entire Portfolio Data • • •
Slide 48: Assisted Living and Independent Living Facilities
Assisted Living (AL) and Independent Living (IL) Facilities History
Slide 49: What Is Assisted/Independent Living?
WHAT IS ASSISTED/ INDEPENDENT LIVING? services, personalized assistance and healthcare designed to respond to the individual needs of those who require help with Supportive services are “…a special combination of housing, supportive activities of daily living. available to meet scheduled and unsched
Slide 50: Overview
• types intensities financing model OVERVIEW portfolios different healthcare attached debt and • RTC with differing and IPO • ILF – • – with • & services freestanding • 1980’s model shakeout 1990’s – growth ALF and in experimented small living care • seniors v Assisted Large Memory • dominated Activ
Slide 51: Assisted Living Construction Roll Out
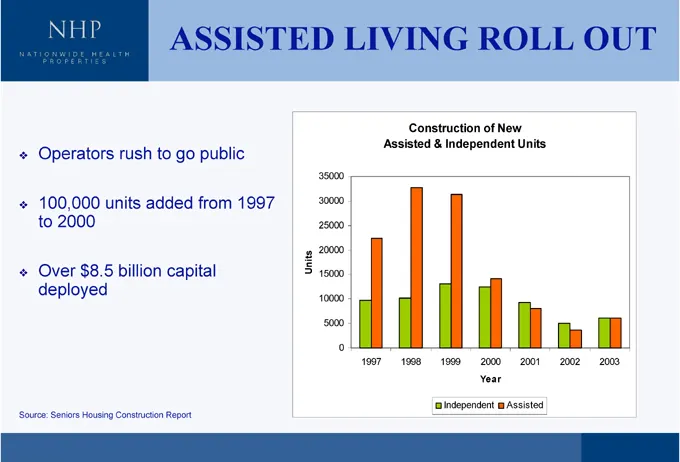
• OUT 2003 2002 • Units 2001 Assisted • New • ROLL of Independent 2000 Year Independent 1999 • Construction & • Assisted 1998 • LIVING 1997 • 35000 30000 25000 20000 15000 10000 5000 0 • Units • 1997 public from • ASSISTED go capital Report to added rush units billion Construction • $8.5 Housing • 1
Slide 52: Result
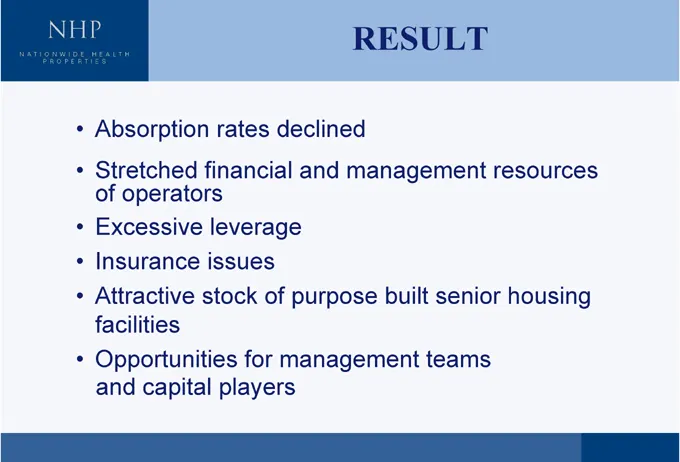
• resources housing senior teams RESULT management built declined and purpose management of rates financial leverage issues for players stock operators capital Absorption Stretchedof Excessive Insurance Attractive facilities Opportunities and • • • • •
Slide 53: Supply Constraints
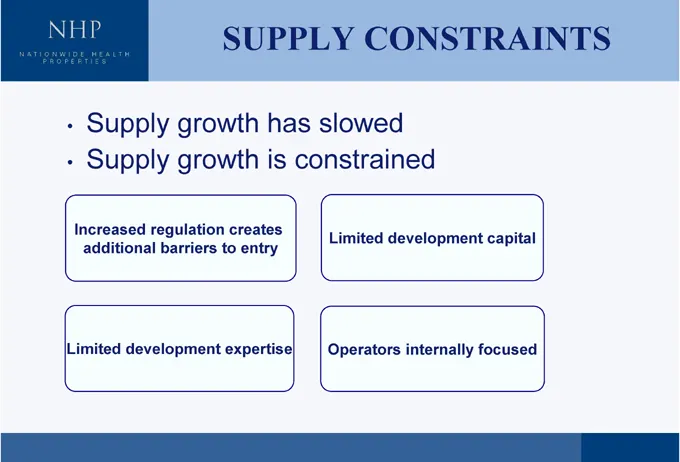
• capital focused CONSTRAINTS development internally • slowed constrained Limited Operators • SUPPLY has is creates entry expertise • growth growth to • regulation barriers development Supply Supply Increased additional • Limited
Slide 54: Supply Dynamics
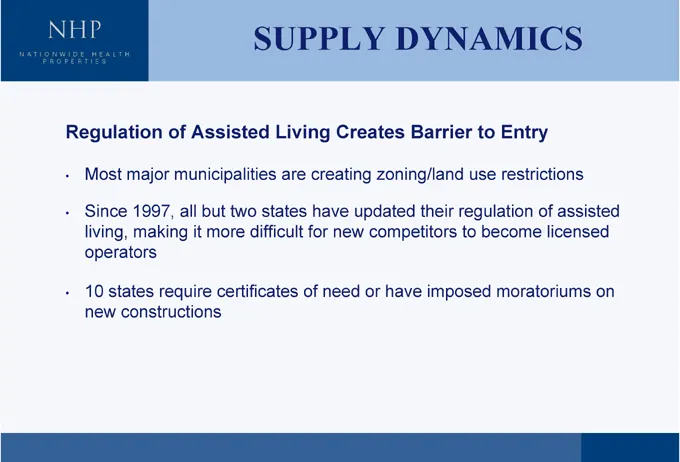
• assisted licensed on Entry restrictions of moratoriums to use become regulation to imposed • DYNAMICS Barrier their • zoning/land competitors have Creates updated or creating have new need for of SUPPLY Living are states difficult two more certificates but • Assisted it • municipalities all of mak
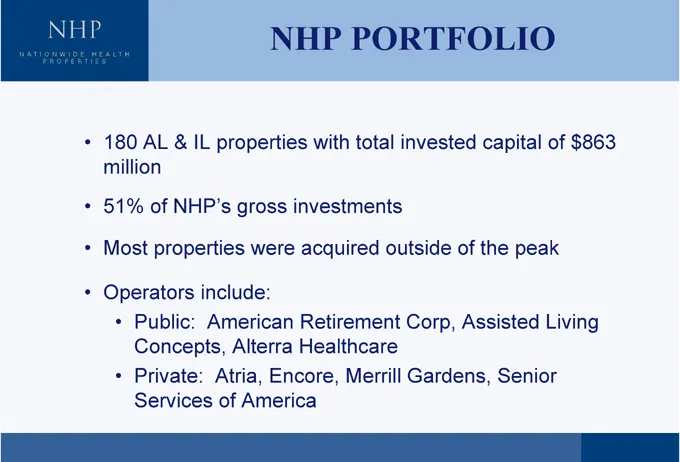
Slide 55: NHP's Portfolio
• $863 of peak Living Senior capital the Assisted of Gardens, invested outside Corp, PORTFOLIO total Merrill NHP with investments acquired Retirement Healthcare Encore, gross were Alterra America properties include: American Atria, of IL • NHP’s properties • AL of Public: Concepts, Private: Services
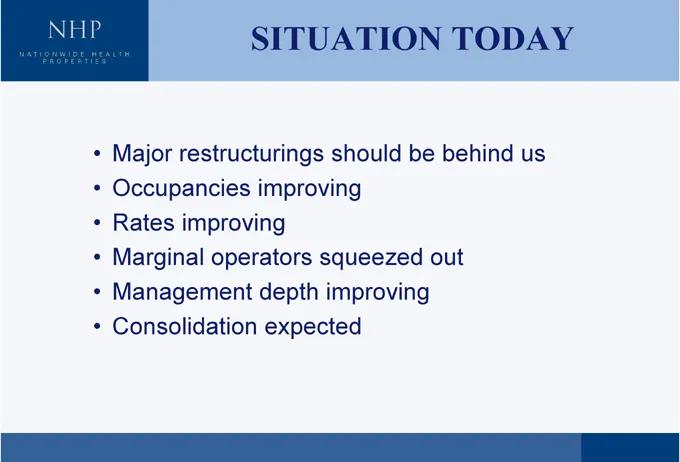
Slide 56: Situation Today
• TODAY us • behind out be should squeezed improving SITUATION improving depth expected restructurings improving operators Major Occupancies Rates Marginal Management Consolidation • • • • •
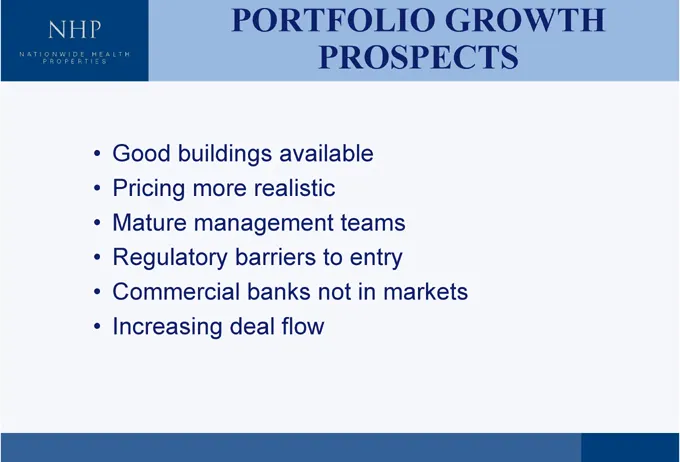
Slide 57: Growth Prospects
• GROWTH • markets teams entry in • PROSPECTS to not • PORTFOLIO available realistic barriers banks flow management deal buildings more Good Pricing Mature Regulatory Commercial Increasing • • • • •
Slide 58: Assisted & Independent Living—Future Opportunities
Assisted & Independent Living—Future Opportunities
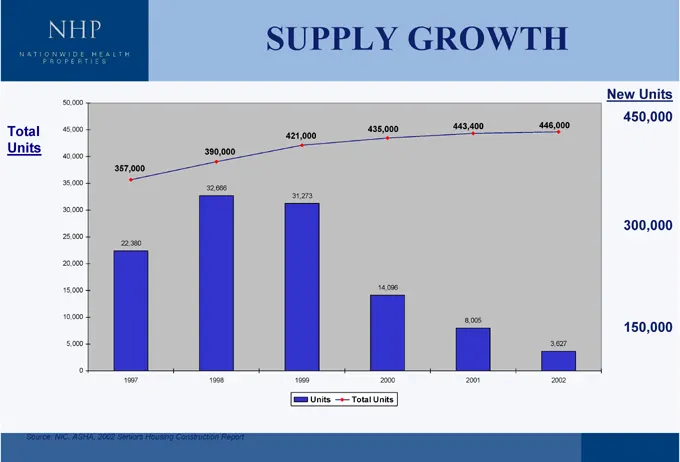
Slide 59: Supply Growth
New Units 450,000 300,000 150,000 446,000 3,627 2002 443,400 8,005 2001 435,000 14,096 2000 Total Units Units SUPPLY GROWTH 421,000 31,273 1999 390,000 32,666 1998 357,000 22,380 1997 50,000 45,000 40,000 35,000 30,000 25,000 20,000 15,000 10,000 5,000 0 Total Units
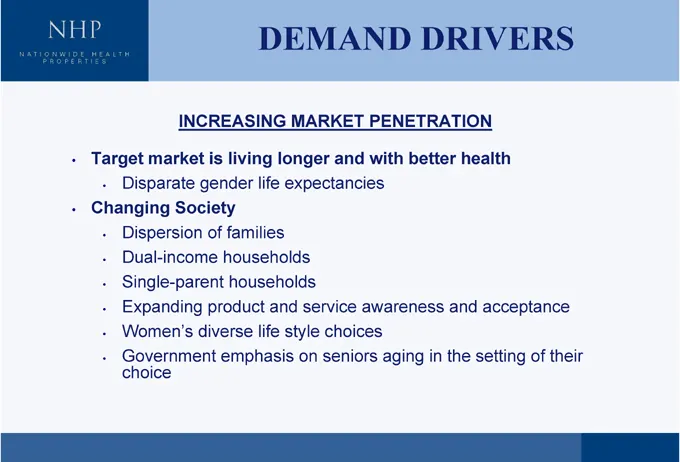
Slide 60: Increasing Market Penetration Drivers
• their acceptance of health setting and the • DRIVERS better in • PENETRATION with awareness aging and service choices seniors MARKET longer expectancies style on and DEMAND living life families households households life emphasis INCREASING is gender Society of product diverse market • Disparate D
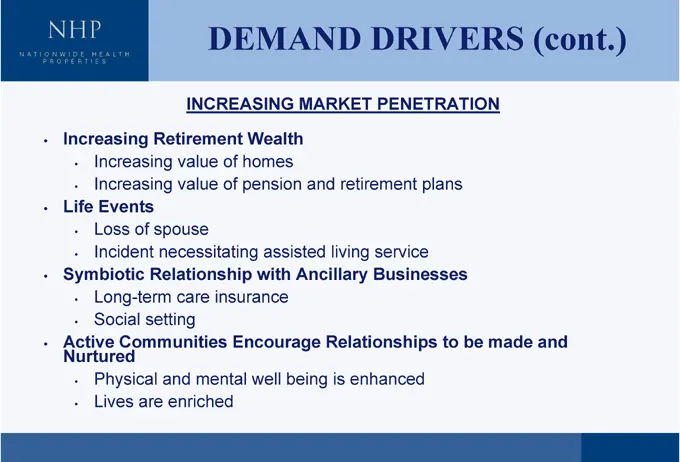
Slide 61: Increasing Market Penetration Drivers (cont.)
• (cont.) and • made be PENETRATION plans to • DRIVERS retirement service Businesses enhanced living Relationships is • MARKET and assisted Ancillary being • Wealth homes pension with Encourage well • DEMAND INCREASING of of insurance mental value value care enriched Retirement spouse necessitating
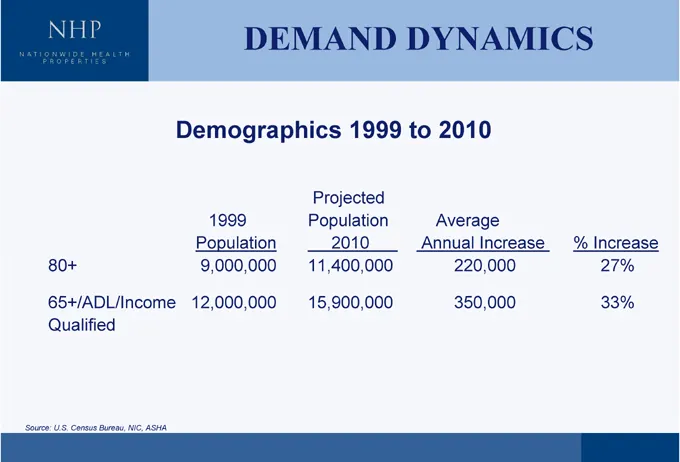
Slide 62: Demand Dynamics
% Increase 27% 33% Average Annual Increase 220,000 350,000 DEMAND DYNAMICS Projected Population 2010 11,400,000 15,900,000 Demographics 1999 to 2010 1999 Population 9,000,000 12,000,000 80+ 65+/ADL/Income Qualified Source: U.S. Census Bureau, NIC, ASHA . .
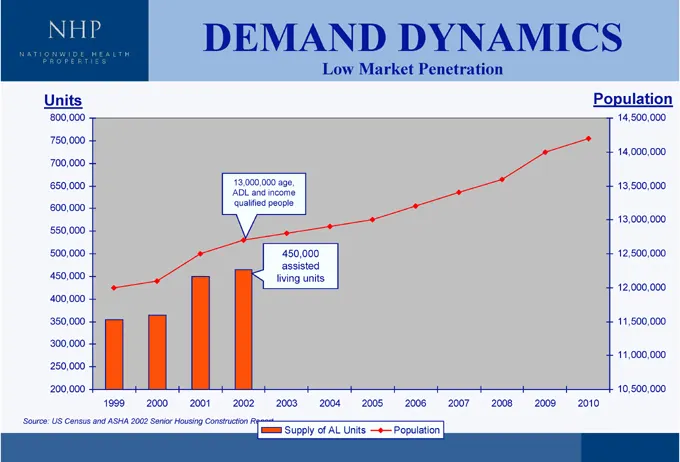
Slide 63: Demand Dynamics: Low Market Penetration
Population 14,500,000 14,000,000 13,500,000 13,000,000 12,500,000 12,000,000 11,500,000 11,000,000 10,500,000 2010 2009 2008 2007 2006 Population Low Market Penetration 2005 2004 Supply of AL Units 450,000 assisted living units 2003 DEMAND DYNAMICS 13,000,000 age, ADL and income qualified people 200
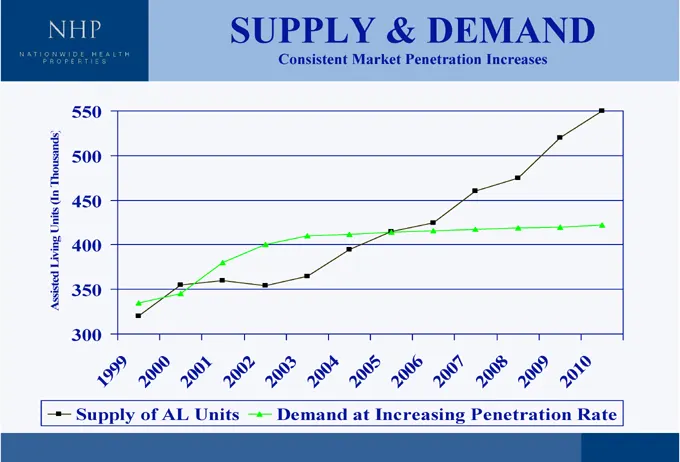
Slide 64: Supply & Demand
2010 2009 2008 2007 2006 2005 Consistent Market Penetration Increases 2004 Demand at Increasing Penetration Rate SUPPLY & DEMAND 2003 2002 2001 2000 9199 Supply of AL Units 550 500 450 400 350 300 Assisted Living Units (In Thousands
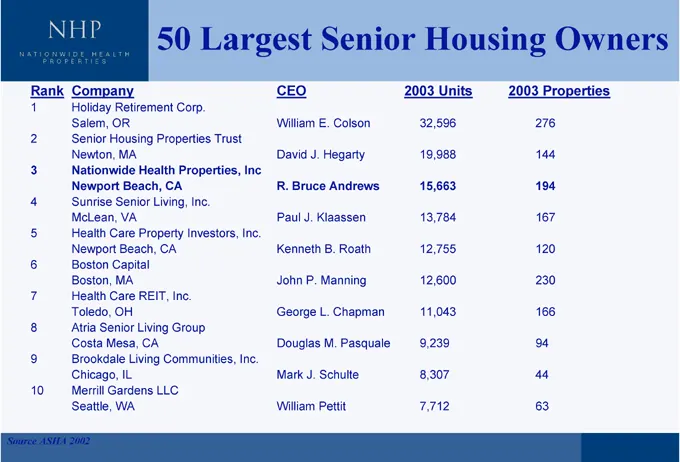
Slide 65: 50 Largest Senior Housing Owners
2003 Properties 276 144 194 167 120 230 166 94 44 63 2003 Units 32,596 19,988 15,663 13,784 12,755 12,600 11,043 9,239 8,307 7,712 50 Largest Senior Housing Owners CEO William E. Colson David J. Hegarty R. Bruce Andrews Paul J. Klaassen Kenneth B. Roath John P. Manning George L. Chapman Douglas M. P
Slide 66: Skilled Nursing Facility (SNF) Market
Skilled Nursing Facility (SNF) Market
Slide 67: History-Evolution
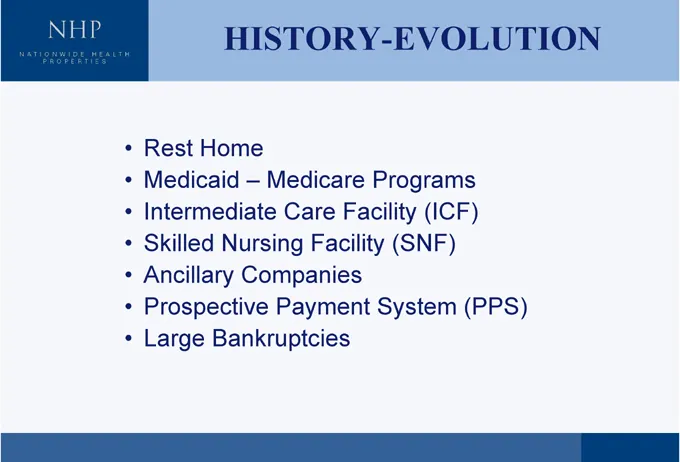
• (PPS) Programs (ICF) (SNF) System Facility Facility Medicare Care Payment HISTORY-EVOLUTION Home – Intermediate Nursing Companies Prospective Bankruptcies Rest Medicaid Skilled Ancillary Large • • • • • •
Slide 68: SNF Portfolio
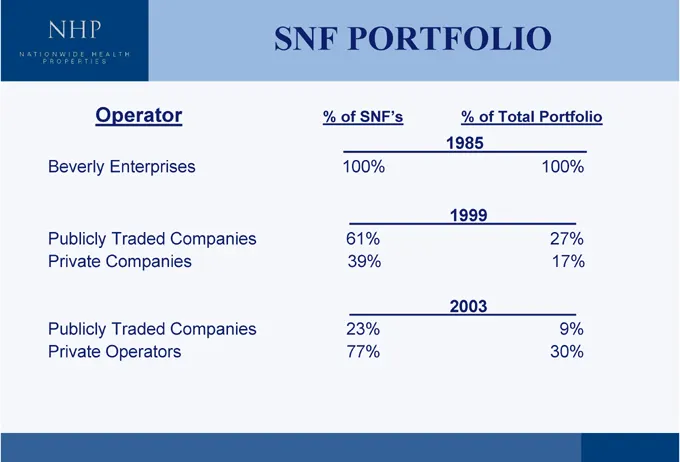
% of Total Portfolio 100% 27% 17% 9% 30% 1985 1999 2003 SNF PORTFOLIO % of SNF’s 100% 61% 39% 23% 77% Operator Beverly Enterprises Publicly Traded Companies Private Companies Publicly Traded Companies Private Operators
Slide 69: 2003 SNF Portfolio Rent Coverage
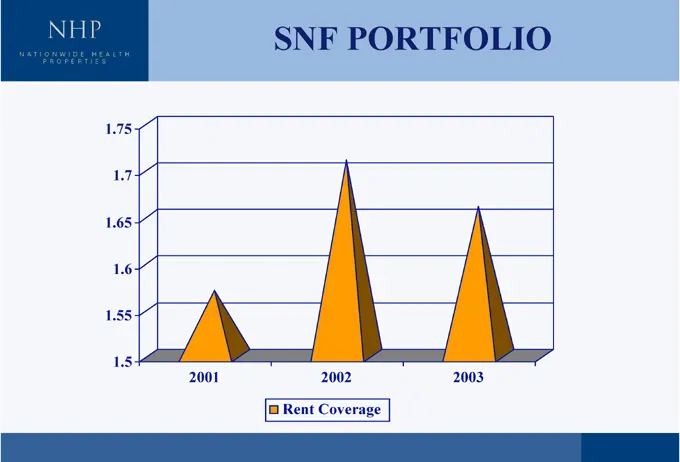
2003 SNF PORTFOLIO 2002 Rent Coverage 2001 1.75 1.7 1.65 1.6 1.55 1.5
Slide 70: Today's Challenges
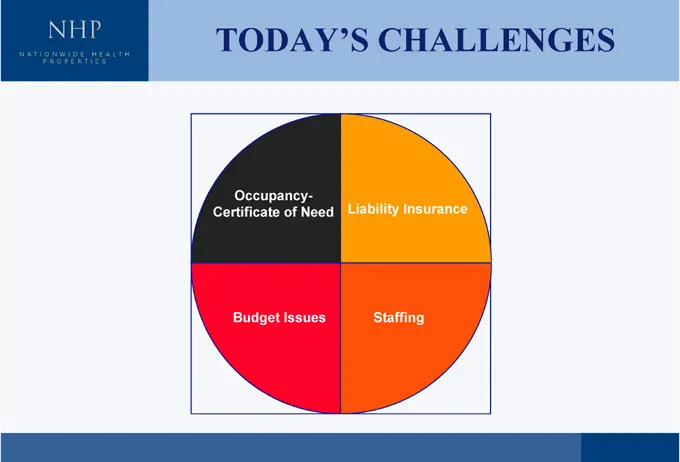
Liability Insurance Staffing TODAY’S CHALLENGES Occupancy- Certificate of Need Budget Issues
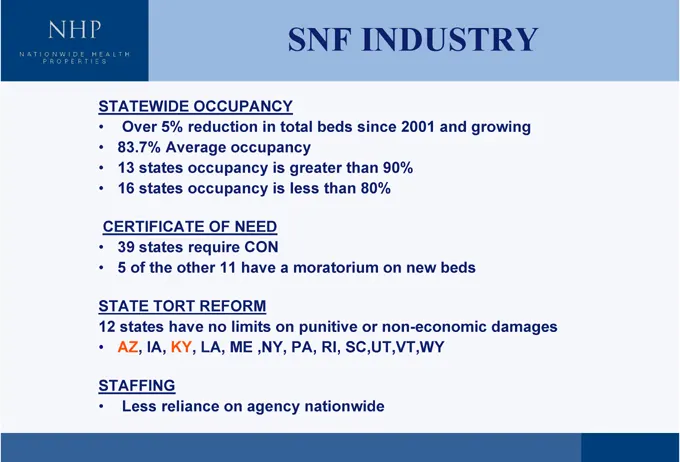
Slide 71: Statewide Occupancy, Tort Reform, Certificate of Need
• growing damages and beds 2001 new 90% on non-economic INDUSTRY since than 80% or SC,UT,VT,WY beds than moratorium punitive RI, nationwide SNF total greater less PA, is is a on in occupancy NEED CON have limits ,NY, agency ME on OF 11 OCCUPANCY reduction occupancy occupancy require REFORM no LA, Av
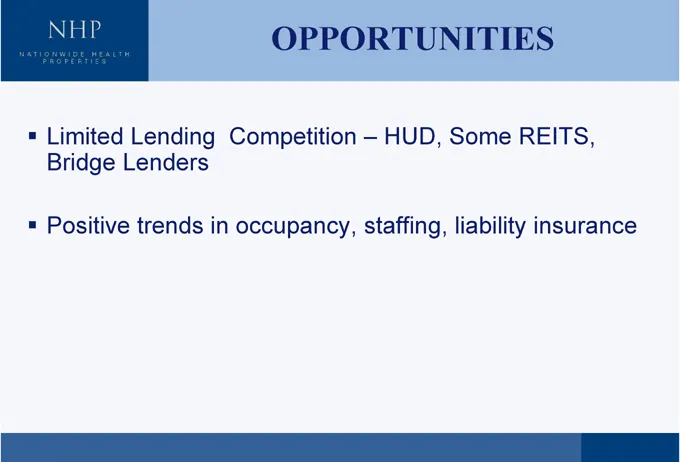
Slide 72: Opportunities
OPPORTUNITIES HUD, Some REITS, Competition –Limited Lending Bridge Lenders Positive trends in occupancy, staffing, liability insurance . .
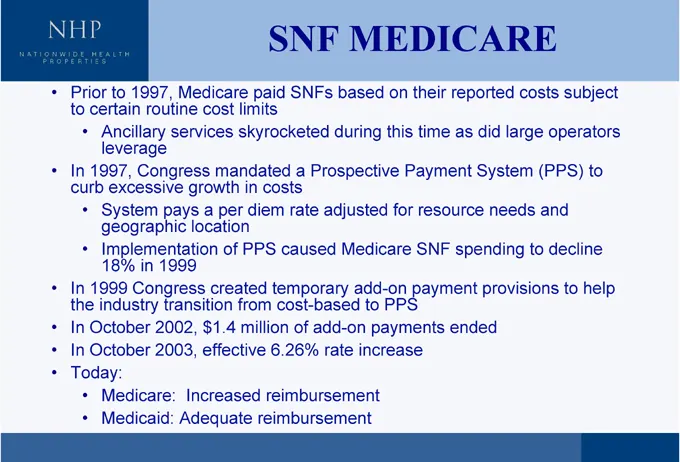
Slide 73: Medicare and Medicaid Payments
• subject to help operators decline to (PPS) and costs large to did System needs spending provisions reported as ended their time Payment resource SNF payment on this for PPS payments MEDICARE based during Medicare add-onto increase Prospective adjusted add-on rate • SNF SNFs acosts rate caused temp

Slide 74: Creative Solutions
Creative Solutions
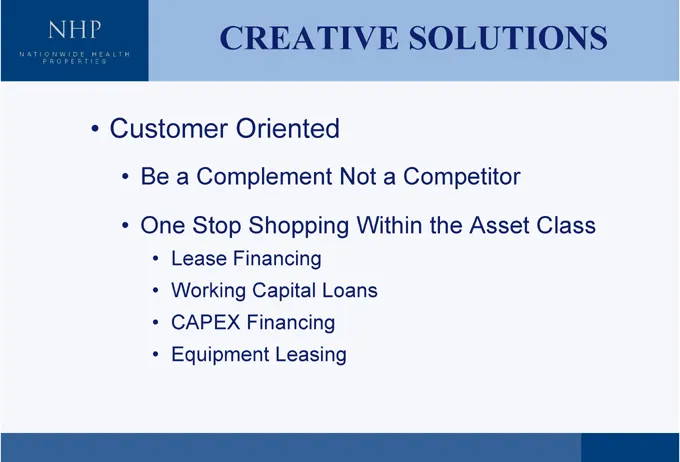
Slide 75: Creative Solutions
• Class Asset SOLUTIONS Competitor the a Within • Not Loans CREATIVE Oriented Complement Shopping Financing Capital Financing Leasing • Stop • a Lease Working CAPEX Equipment • Be One • • • • Customer • • •
Slide 76: Creative Solutions
• SOLUTIONS Operators Officer • Model of Customers Backgrounds Investment Restructuring Team Our Management CREATIVE Driven Like Care Origination Management Think We Long-Term Deal Transaction Asset • Management • Multi-Discipline • • • • Relationship • • •
Slide 77: Creative Solutions (cont.)
• (cont.) Deals • Follow-on • SOLUTIONS / • Leverage Capital Transfers of Additional • REITs Use • CREATIVE Efficiency Assumptions to • Down Mergers Wealth • Tax • • Debt Effective Access • • • •
Slide 78: Creative Solutions
• SOLUTIONS transactions • Execution Matters • CREATIVE What Payment Assurance “Over-Lawyer” on CAPEX/Maintenance Timely Licensure Quality Don’t • Seamless Focus • • • • • •
Slide 79: Harvesting the Opportunities
Harvesting the Opportunities
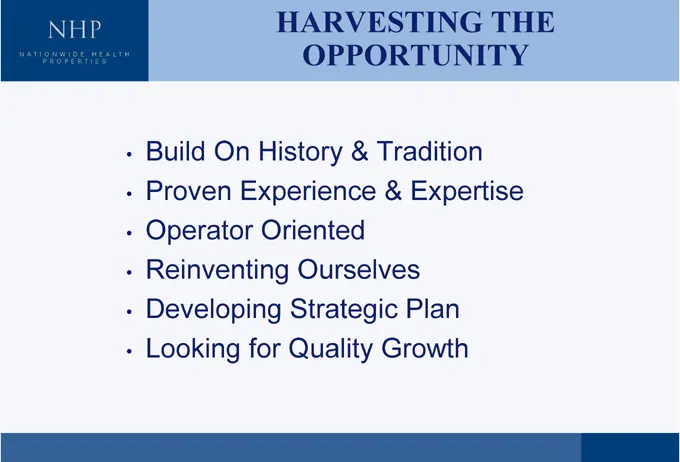
Slide 80: Harvesting the Opportunity
• THE Expertise • Plan Tradition & Growth HARVESTING OPPORTUNITY & Oriented Ourselves Strategic Quality History Experience for On Build Proven Operator Reinventing Developing Looking • • • • •

Slide 81: Question & Answer Session
NHP Question & Answer Session
Source: SEC EDGAR · 8-K filed Dec 1, 2003
More decks from Nationwide Health Properties Inc
 NAREIT: REIT Week 201140 slides · Jun 7, 2011
 Q1 2011 Earnings Presentation54 slides · May 5, 2011
 Q4 2010 Earnings Presentation60 slides · Feb 28, 2011
 Merger or Acquisition (February 2011)16 slides · Feb 28, 2011
 Investor Presentation (December 2008)4 slides · Dec 8, 2008
 Merger or Acquisition (February 2008)44 slides · Feb 25, 2008