Harman International Industries Inc.
Harman International Industries — Q1 FY2005 Earnings Presentation
11 slides from Harman International Industries's earnings presentation, Jan 12, 2005
Slide 1
Slide 2: Financial Results
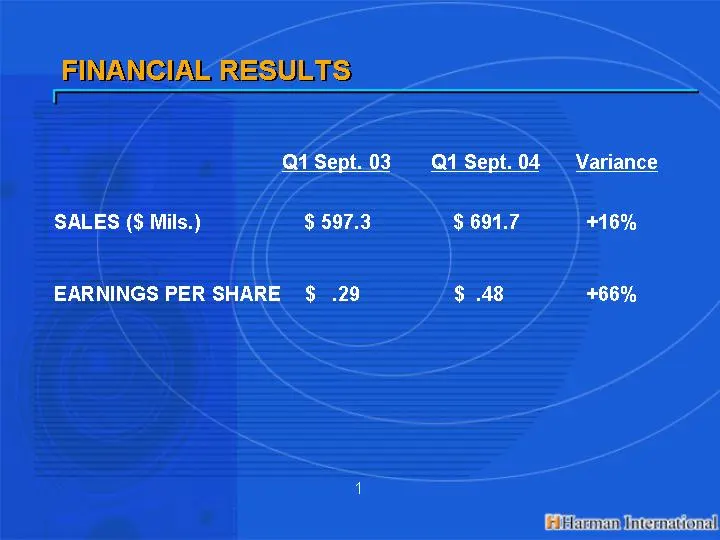
FINANCIAL RESULTS Q1 Sept. 03 Q1 Sept. 04 Variance SALES ($ Mils.) $ 597.3 $ 691.7 +16% EARNINGS PER SHARE $ .29 $ .48 +66% 1
Slide 3: Growth of Earnings Per Share
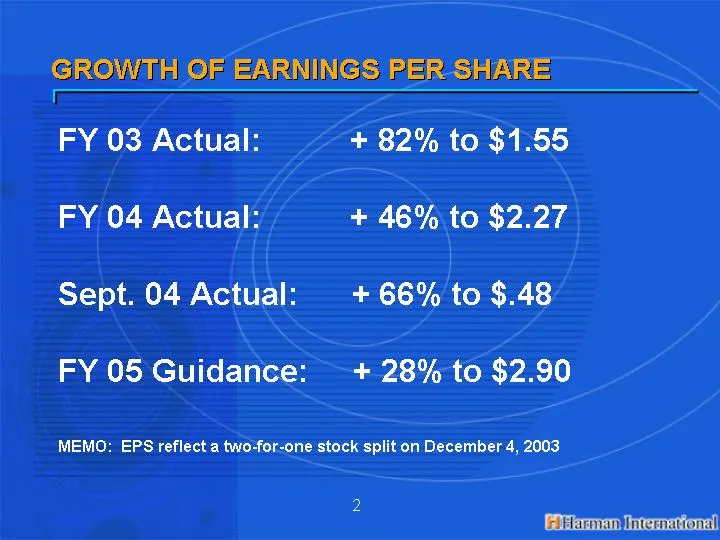
GROWTH OF EARNINGS PER SHARE FY 03 Actual: + 82% to $1.55 FY 04 Actual: + 46% to $2.27 Sept. 04 Actual: + 66% to $.48 FY 05 Guidance: + 28% to $2.90 MEMO: EPS reflect a two-for-one stock split on December 4, 2003 2
Slide 4: Navigation Estimated Market Size (OEM)
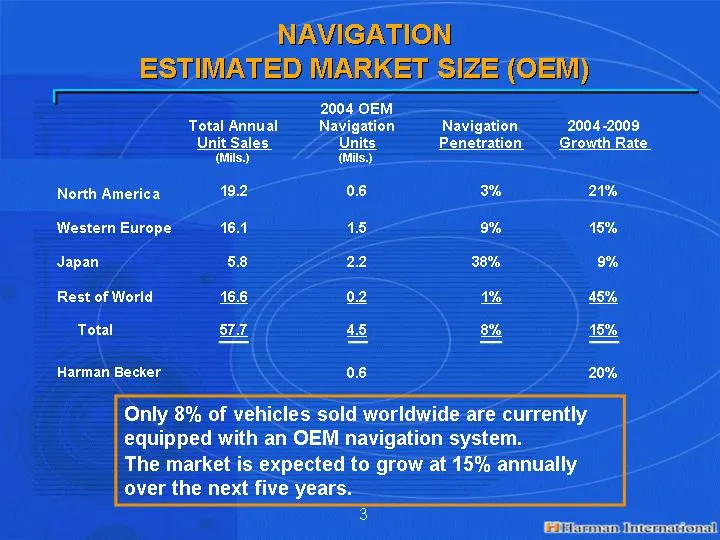
Only 8% of vehicles sold worldwide are currently equipped with an OEM navigation system. The market is expected to grow at 15% annually over the next five years. 3 Total Annual Unit Sales 2004 OEM Navigation Units Navigation Penetration 2004 - - 2009 Growth Rate (Mils.) (Mils.) North America 19.2 0.
Slide 5: OEM Group Infotainment Content
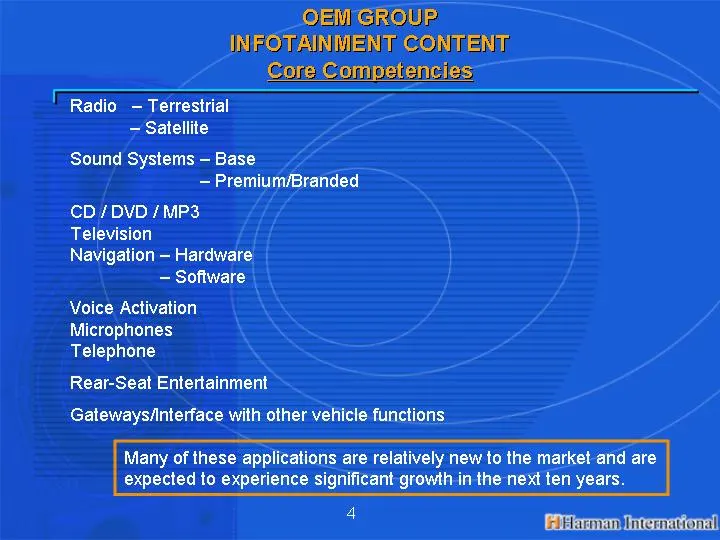
OEM GROUP INFOTAINMENT CONTENT Core Competencies Radio - Terrestrial - Satellite Sound Systems - Base - Premium/Branded CD / DVD / MP3 Television Navigation - Hardware - Software Voice Activation Microphones Telephone Rear-Seat Entertainment Gateways/Interface with other vehicle functions Many of th
Slide 6: Growing Vehicle Content
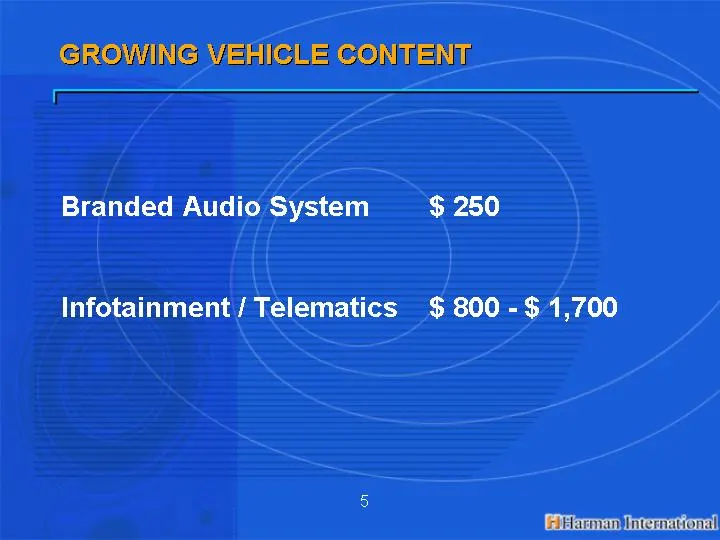
GROWING VEHICLE CONTENT Branded Audio System $ 250 Infotainment / Telematics $ 800 - $ 1,700 5
Slide 7: Growth Drivers for Fiscal 2005
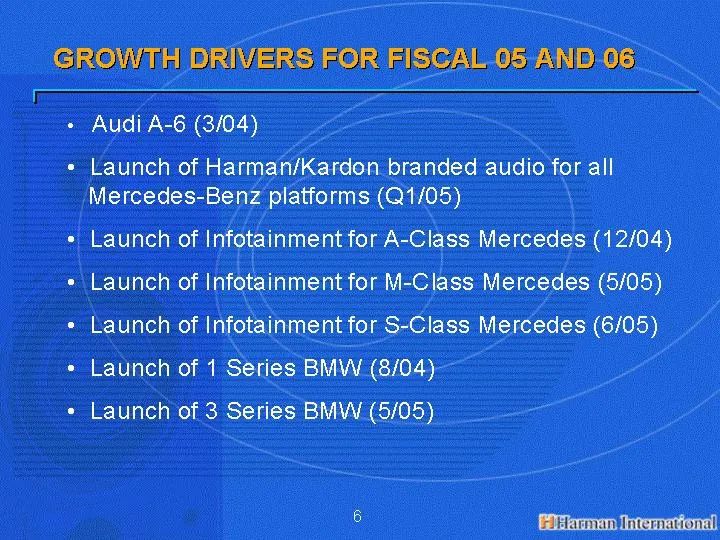
GROWTH DRIVERS FOR FISCAL 05 AND 06 6
Slide 8: Working Capital
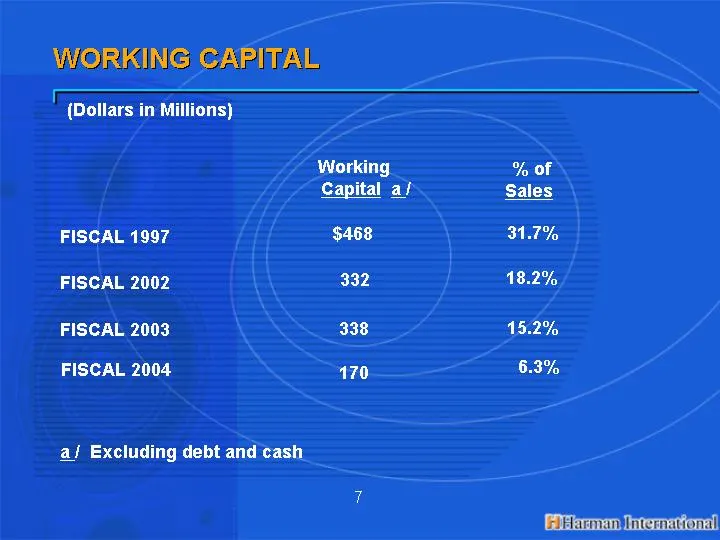
WORKING CAPITAL Working Capital a / % of Sales FISCAL 1997 $468 31.7% FISCAL 2002 332 18.2% 6.3% a / Excluding debt and cash (Dollars in Millions) 7 FISCAL 2003 338 15.2% 170 FISCAL 2004
Slide 9: Global Diversification
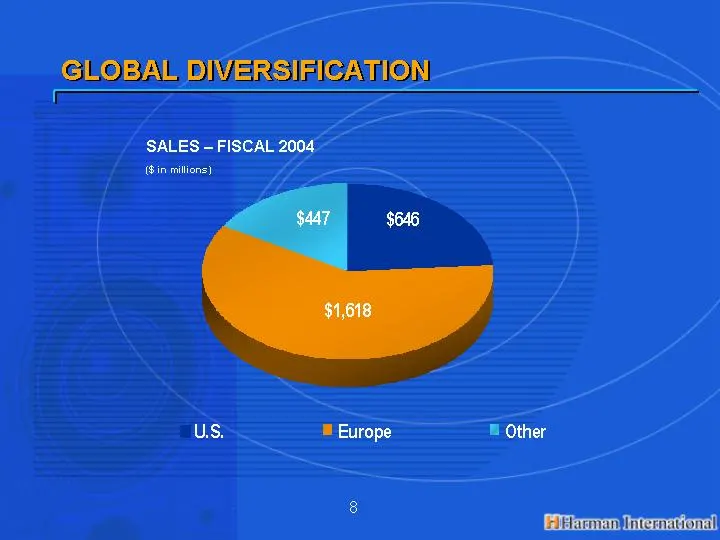
GLOBAL DIVERSIFICATION SALES - FISCAL 2004 ($ in millions) 8 U.S. Europe Other East 646 1618 447
Slide 10: The Fundamentals
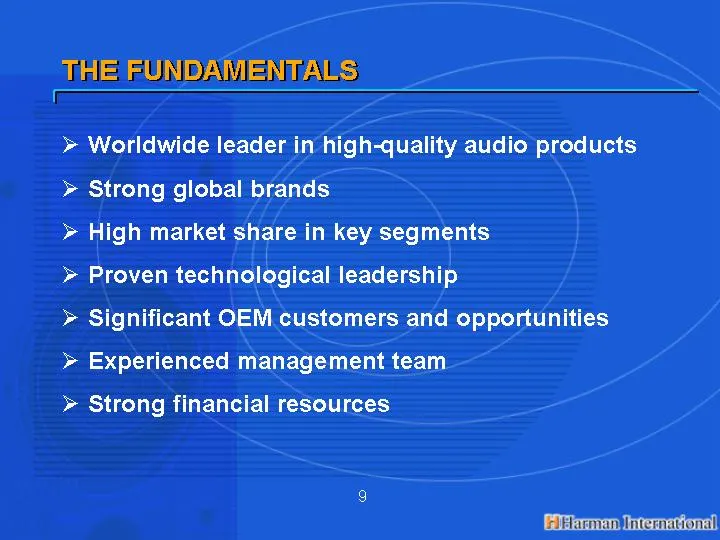
THE FUNDAMENTALS Worldwide leader in high-quality audio products Strong global brands High market share in key segments Proven technological leadership Significant OEM customers and opportunities Experienced management team Strong financial resources 10

Slide 11: Harman International
harmarinternational Lacmantinternationa!
Source: SEC EDGAR · 8-K filed Jan 12, 2005