Vertex Energy — Q1 2021 Earnings Presentation
12 slides from Vertex Energy's earnings presentation, May 13, 2021
Slide 1: First Quarter 2021 Results Conference Call
May 2021 First Quarter 2021 Results Conference Call
Slide 2: Disclaimer
Disclaimer This document may contain forward - looking statements including words such as “may,” “can,” “could,” “should,” “predict,” “aim,” “potential,” “continue,” “opportunity,” “intend,” “goal,” “estimate,” “expect,” “expectations,” “project,” “projections,” “plans,” “anticipates,” “believe,” “t
Slide 3: Business Update
Werrex Business Update
Slide 4: Executive Summary: 1Q21 performance and 2Q21 outlook
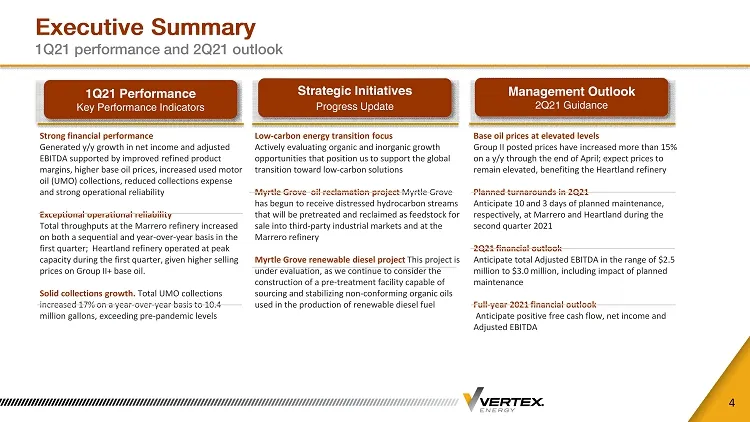
Executive Summary 1Q21 performance and 2Q21 outlook 4 1Q21 Performance Key Performance Indicators Strategic Initiatives Progress Update Management Outlook 2Q21 Guidance Base oil prices at elevated levels Group II posted prices have increased more than 15% on a y/y through the end of April; expect pr
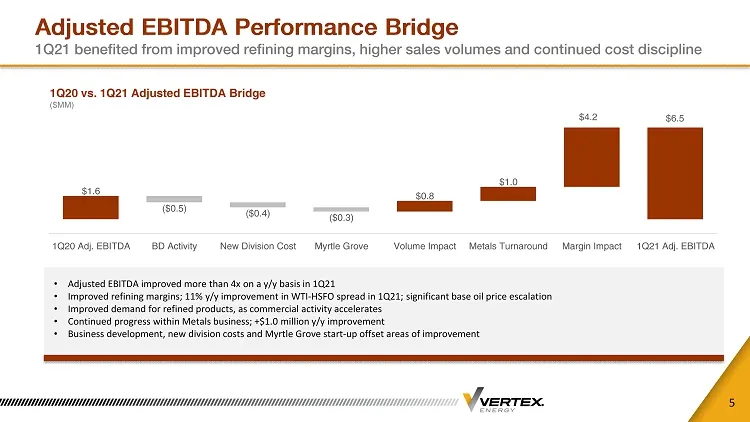
Slide 5: Adjusted EBITDA Performance Bridge
Adjusted EBITDA Performance Bridge 1Q21 benefited from improved refining margins, higher sales volumes and continued cost discipline 5 1Q20 vs. 1Q21 Adjusted EBITDA Bridge ($MM) • Adjusted EBITDA improved more than 4x on a y/y basis in 1Q21 • Improved refining margins; 11% y/y improvement in WTI - H
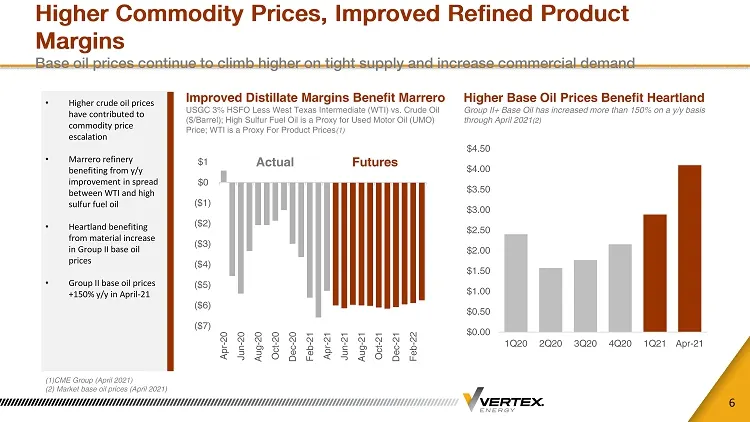
Slide 6: Higher Commodity Prices, Improved Refined Product Margins
Higher Commodity Prices, Improved Refined Product Margins Base oil prices continue to climb higher on tight supply and increase commercial demand 6 Improved Distillate Margins Benefit Marrero USGC 3% HSFO Less West Texas Intermediate (WTI) vs. Crude Oil ($/Barrel); High Sulfur Fuel Oil is a Proxy fo
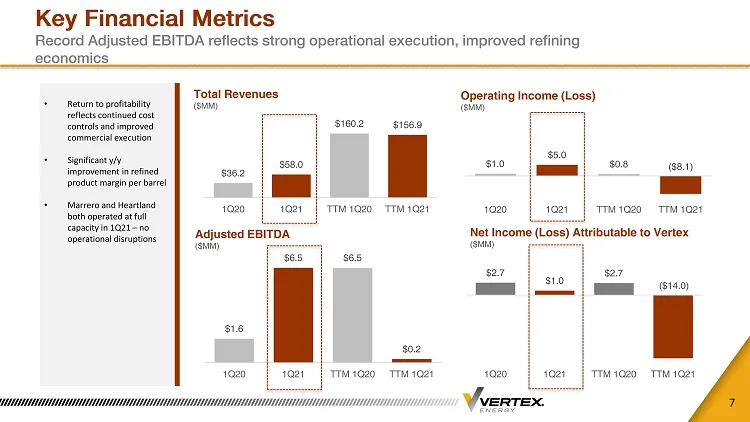
Slide 7: Key Financial Metrics
Key Financial Metrics Record Adjusted EBITDA reflects strong operational execution, improved refining economics 7 Total Revenues ($MM) Adjusted EBITDA ($MM) Operating Income (Loss) ($MM) Net Income (Loss) Attributable to Vertex ($MM) • Return to profitability reflects continued cost controls and imp
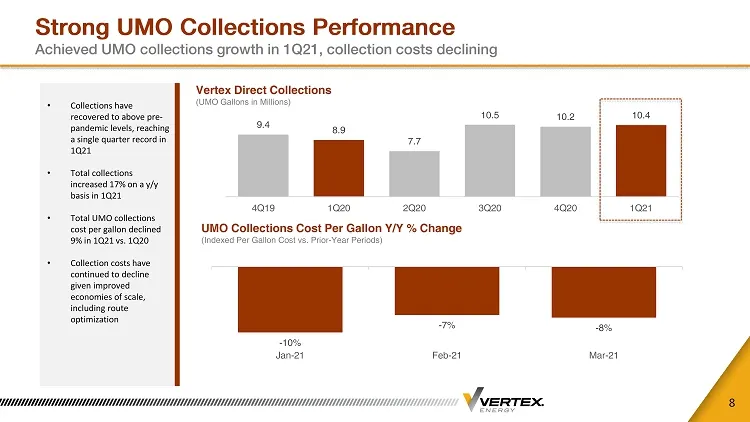
Slide 8: Strong UMO Collections Performance
Strong UMO Collections Performance Achieved UMO collections growth in 1Q21, collection costs declining 8 Vertex Direct Collections (UMO Gallons in Millions) UMO Collections Cost Per Gallon Y/Y % Change (Indexed Per Gallon Cost vs. Prior - Year Periods) • Collections have recovered to above pre - pan
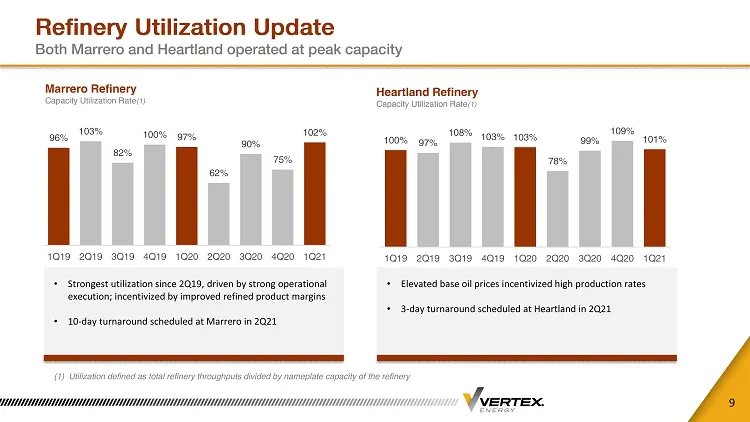
Slide 9: Refinery Utilization Update
Refinery Utilization Update Both Marrero and Heartland operated at peak capacity 9 (1) Utilization defined as total refinery throughputs divided by nameplate capacity of the refinery Marrero Refinery Capacity Utilization Rate (1) Heartland Refinery Capacity Utilization Rate (1) • Strongest utilizati
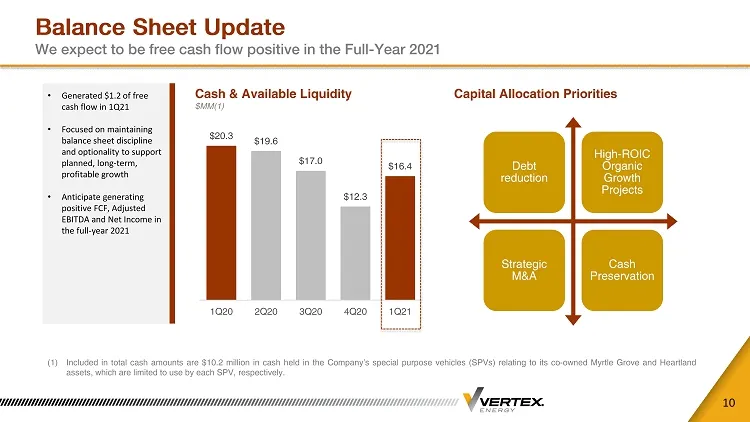
Slide 10: Balance Sheet Update
Balance Sheet Update We expect to be free cash flow positive in the Full - Year 2021 10 (1) Included in total cash amounts are $ 10 . 2 million in cash held in the Company’s special purpose vehicles (SPVs) relating to its co - owned Myrtle Grove and Heartland assets, which are limited to use by each
Slide 11: Appendix
Werrex APPENDIX
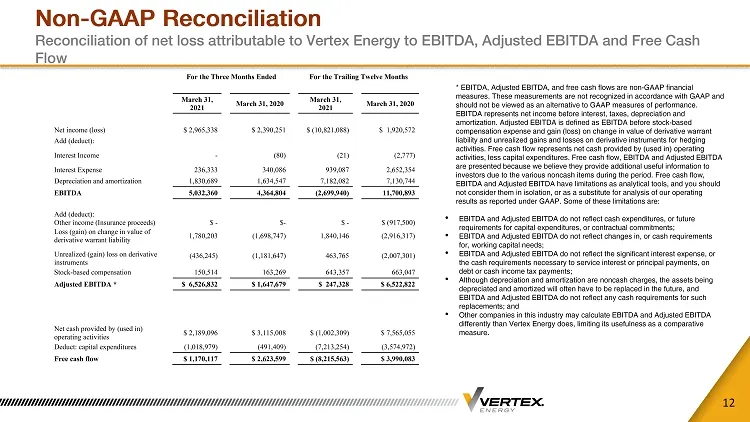
Slide 12: Non-GAAP Reconciliation
Non - GAAP Reconciliation Reconciliation of net loss attributable to Vertex Energy to EBITDA, Adjusted EBITDA and Free Cash Flow 12 * EBITDA, Adjusted EBITDA, and free cash flows are non - GAAP financial measures. These measurements are not recognized in accordance with GAAP and should not be viewed
Source: SEC EDGAR · 8-K filed May 13, 2021
More decks from Vertex Energy Inc
 Q2 2024 Earnings Presentation21 slides · Aug 8, 2024
 Q1 2024 Earnings Presentation20 slides · May 9, 2024
 Q4 2023 Earnings Presentation29 slides · Feb 28, 2024
 Q3 2023 Earnings Presentation27 slides · Nov 7, 2023
 Q2 2023 Earnings Presentation26 slides · Aug 9, 2023
 Q1 2023 Earnings Presentation26 slides · May 9, 2023