National Financial Partners Corp
National Financial Partners — UBS Asset Gathering Conference 2005
23 slides from National Financial Partners's conference presentation, Mar 31, 2005
Slide 1: National Financial Partners Corp. UBS Asset Gathering Conference
National UBS MarchAsset 31,Financial 2005 Gathering Partners Conference Corp.
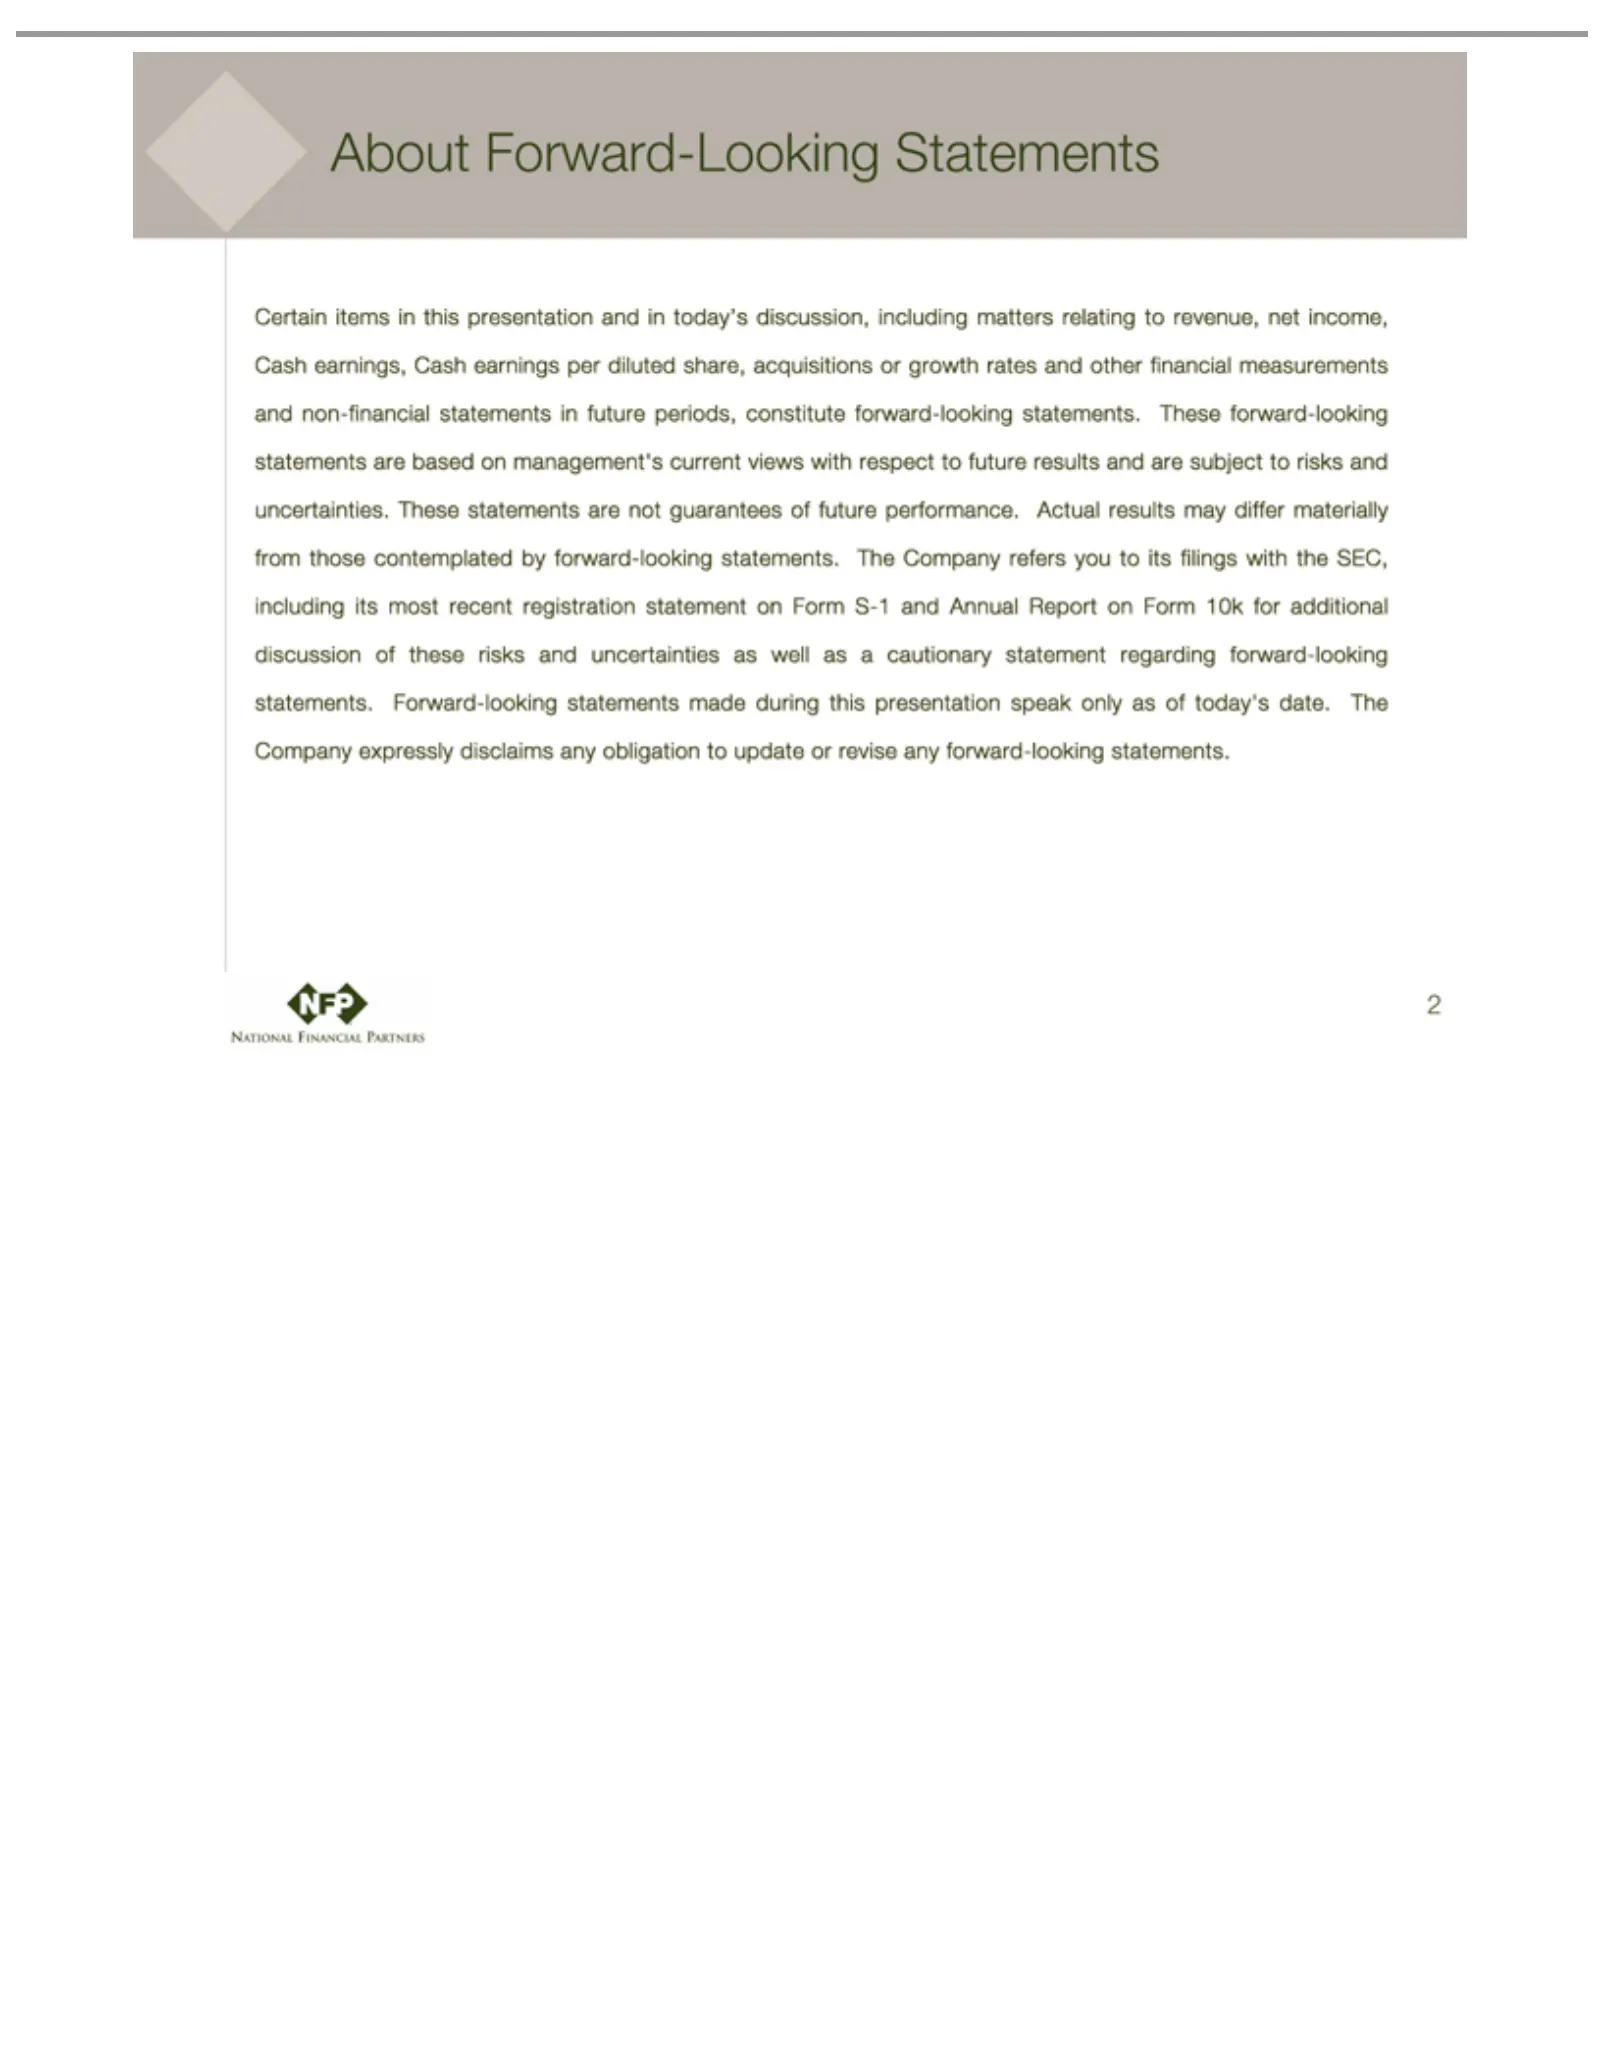
Slide 2: About Forward-Looking Statements
About Certain financial to statements. and expressly 2 future uncertainties Forward-Looking items results measurements disclaims The in Company and this as any well are presentation subject and obligation as Statements refers anon-financial cautionary toyou and risks to to update inand its today’s s
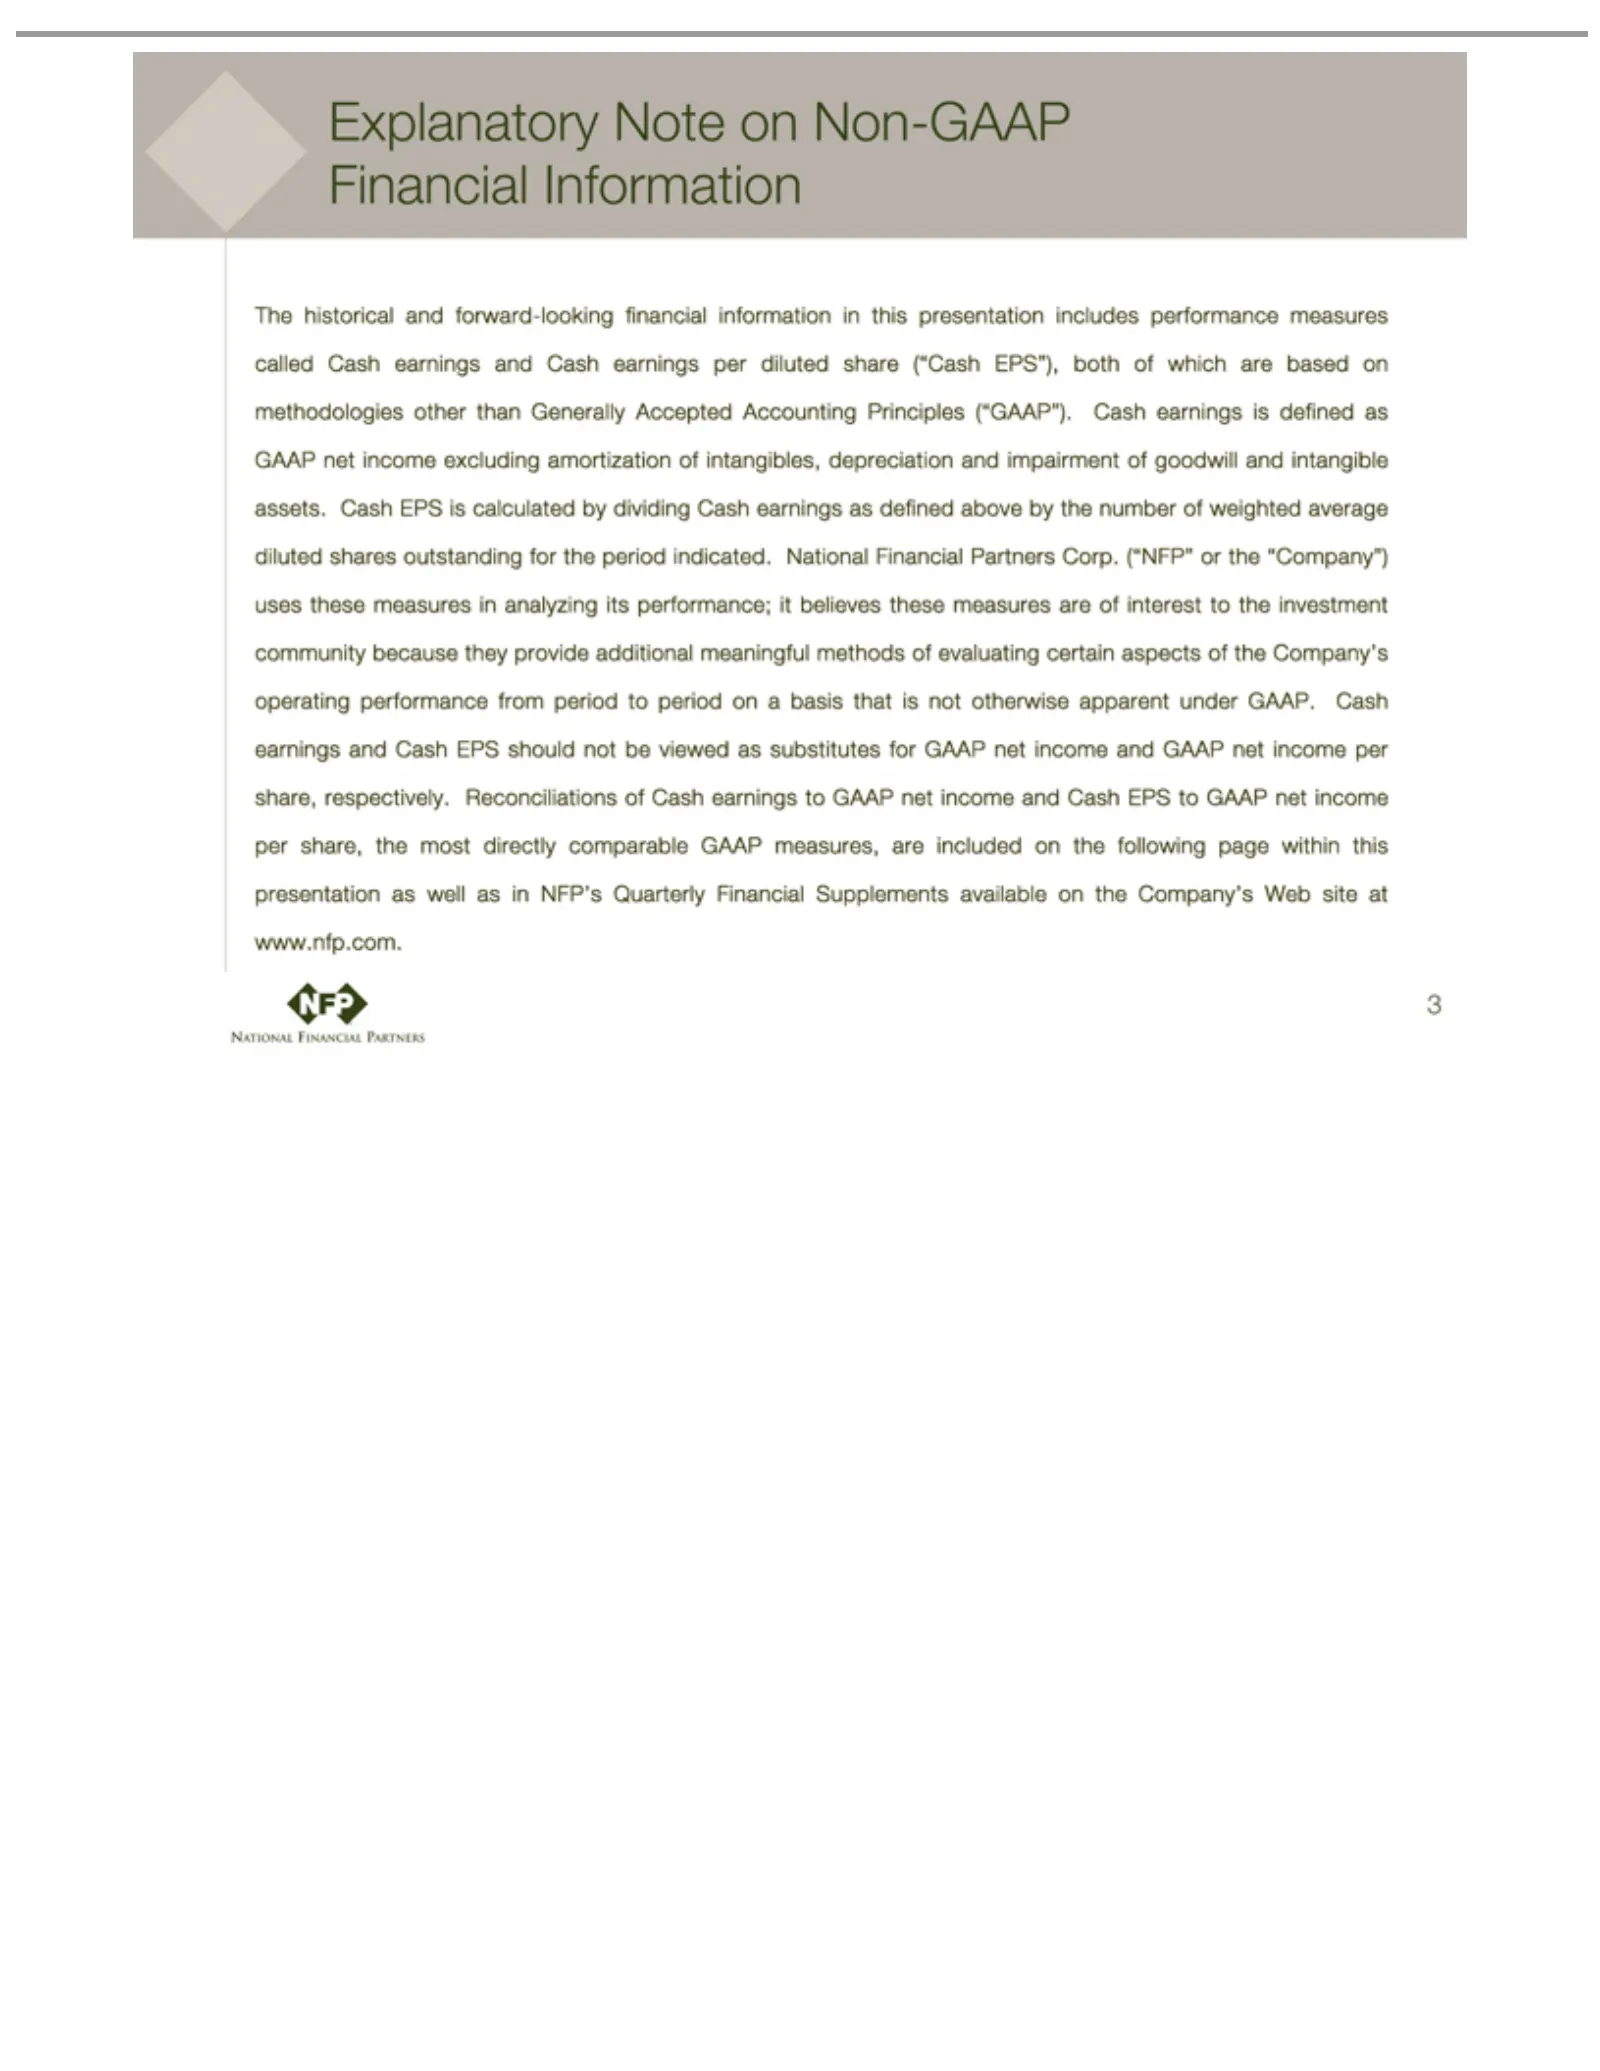
Slide 3: Explanatory Note on Non-GAAP Financial Information
Explanatory The based impairment indicated. because GAAP. and Supplements 3 Cash historical onCash they methodologies EPS National of Note earnings provide available and to goodwill GAAP on forward-looking Financial Non-GAAP additional and on and net other the Cash income intangible Partners Company
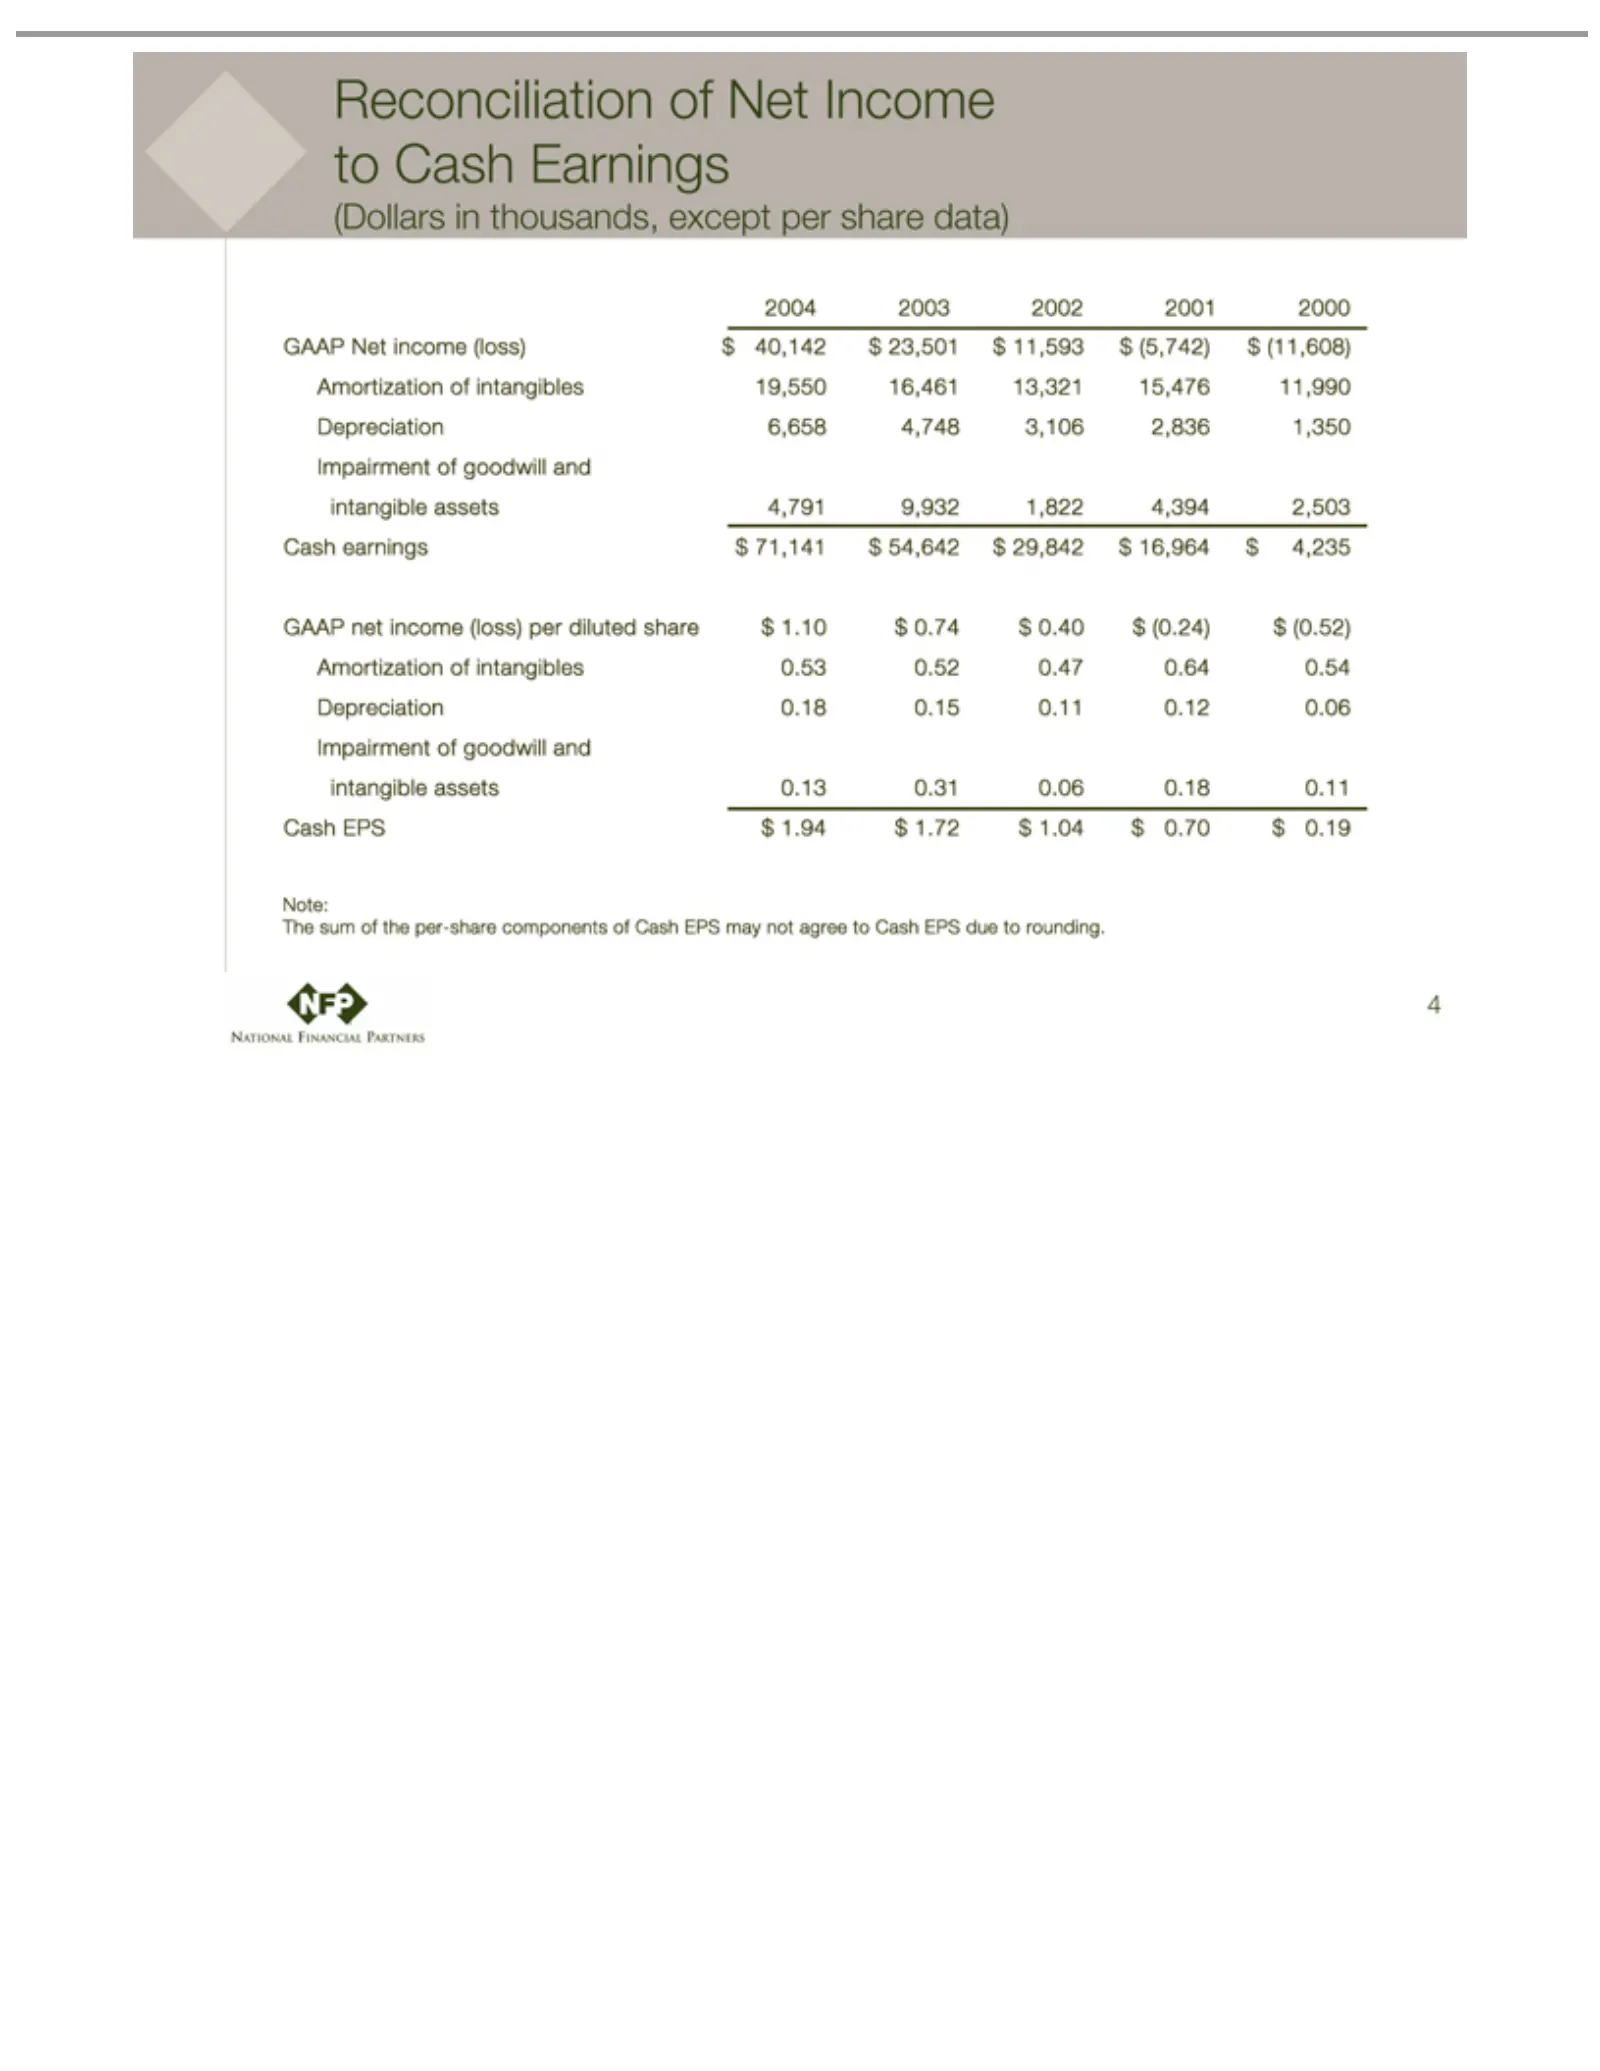
Slide 4: Reconciliation of GAAP Net Income to Cash Earnings
Reconciliation (Dollars 2004 GAAP Amortization Depreciation Impairment Cash The Note: 4 sum 2003 earnings EPS Net net in of$income 2002 thousands, income the of 1.94 6,658 0.18 of $71,141 goodwill of per-share intangibles 2001 $Net 0.15 (loss) 1.72 (loss) 4,748 Income 2000 except $54,642 0.11 $and p
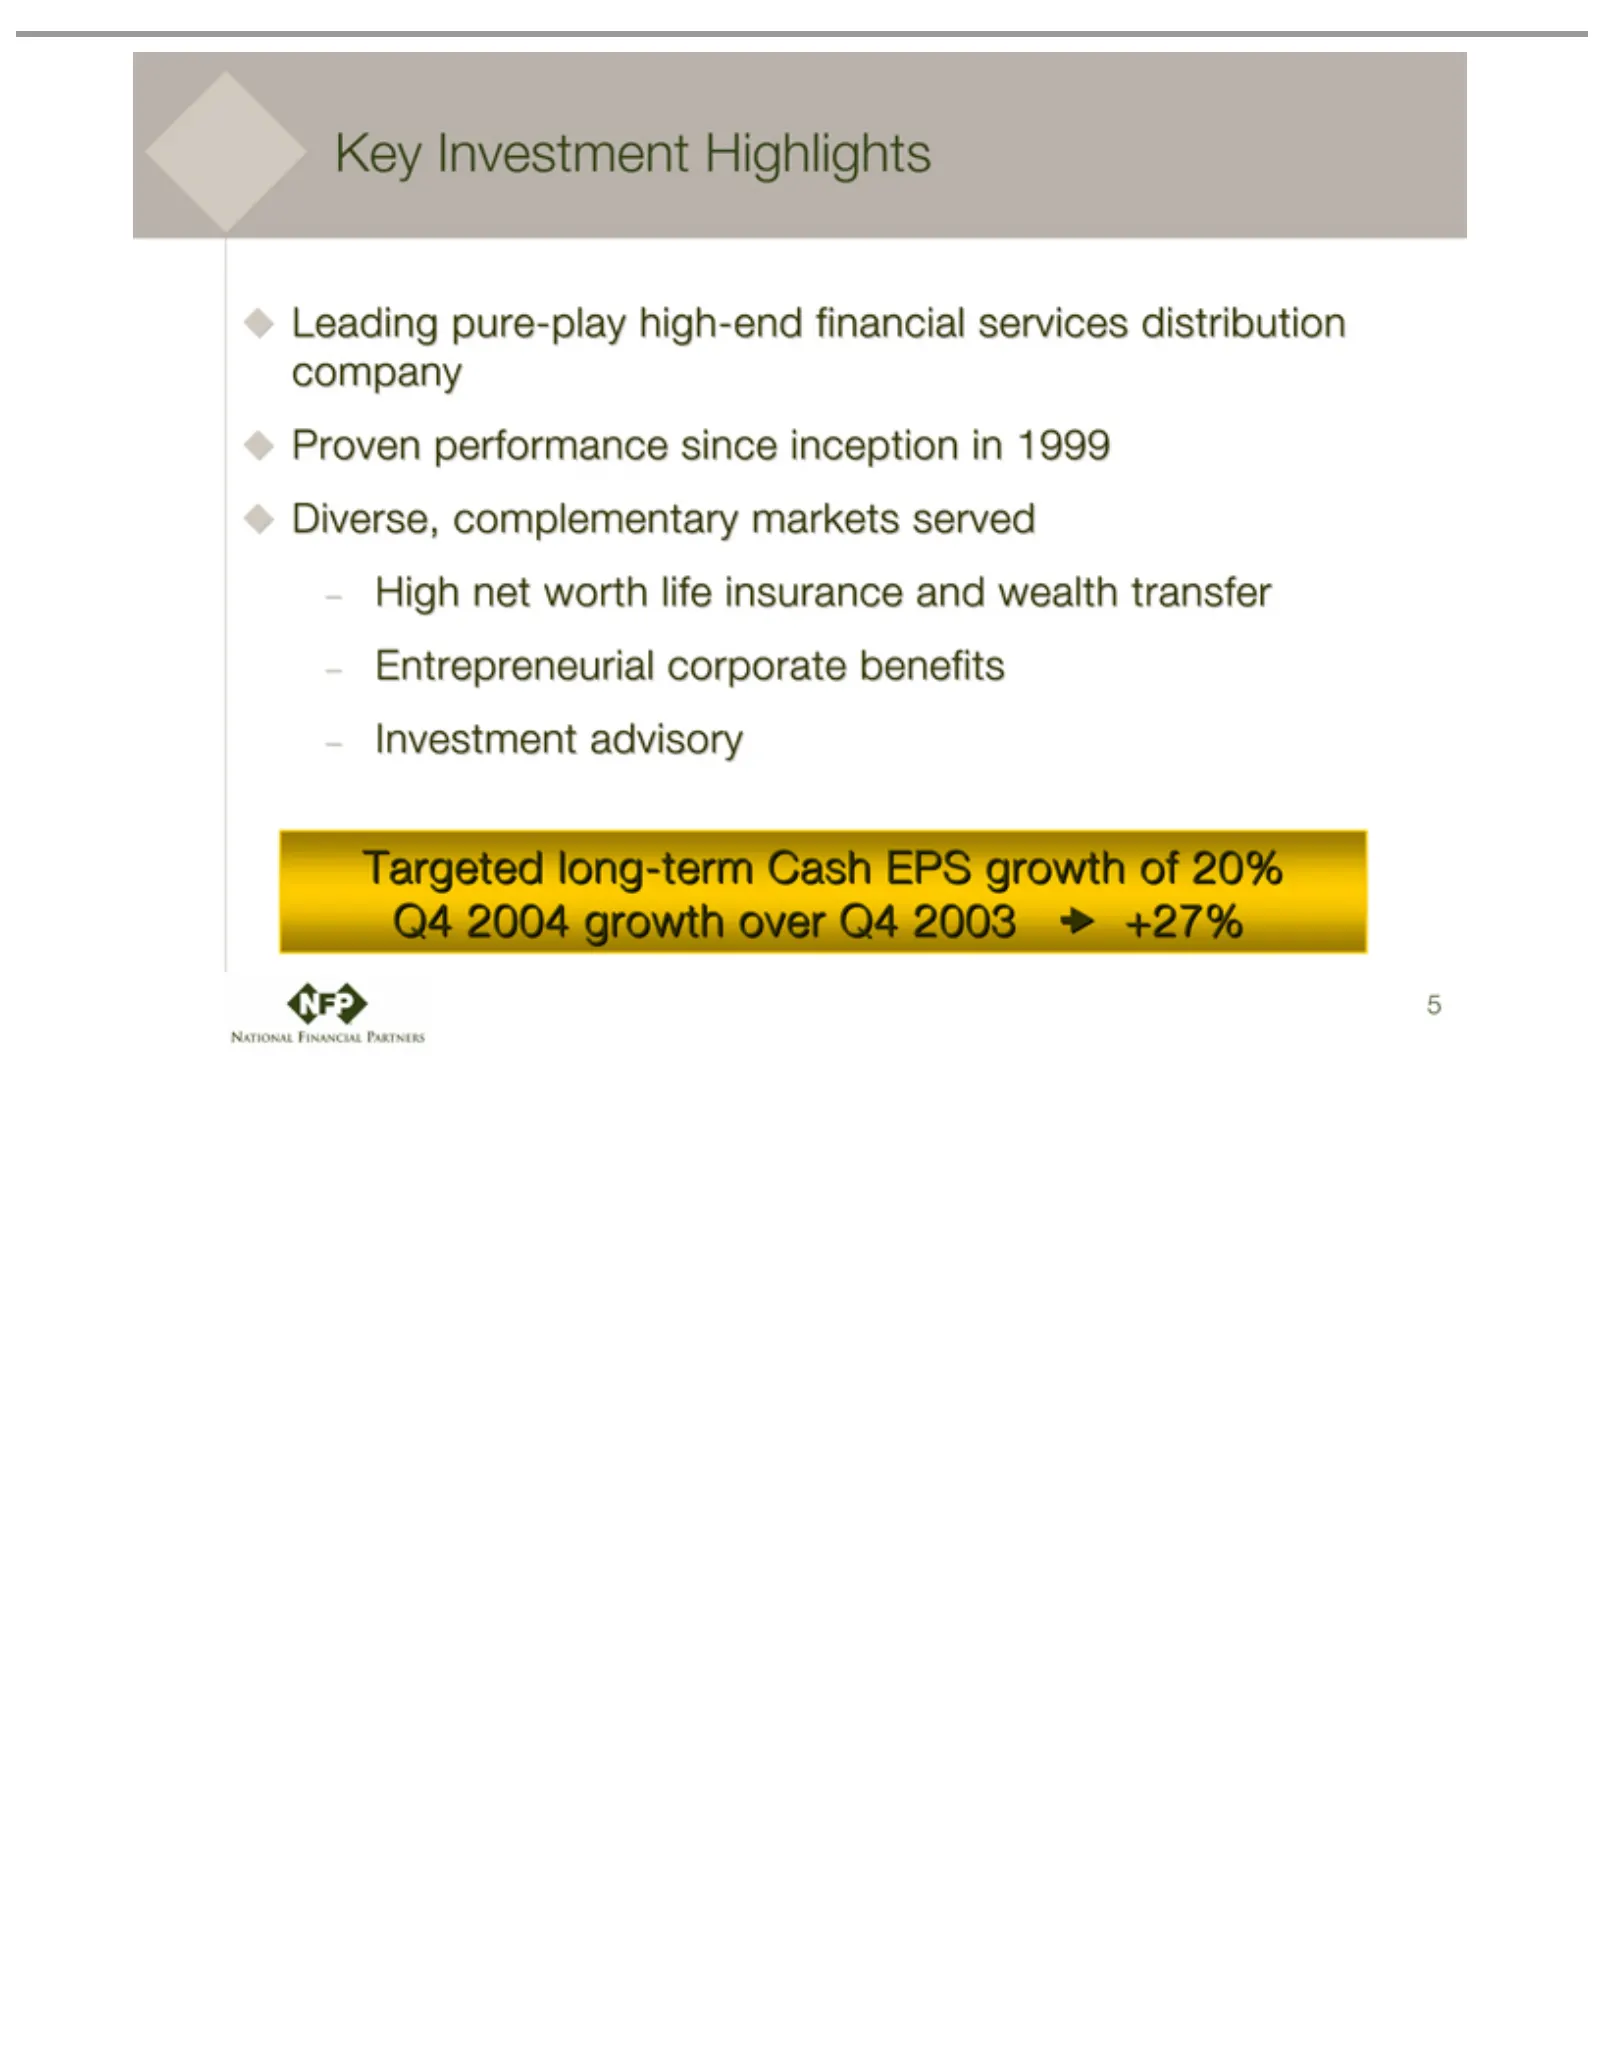
Slide 5: Key Investment Highlights
Key Investment Leading Proven Diverse, High Targeted 5 netperformance pure-play complementary long-term worth life Highlights high-end insurance Cash sincemarkets EPS inception financial and growth served wealth inservices of1999 20% transfer Q4 distribution 2004 Entrepreneurial growth company overc
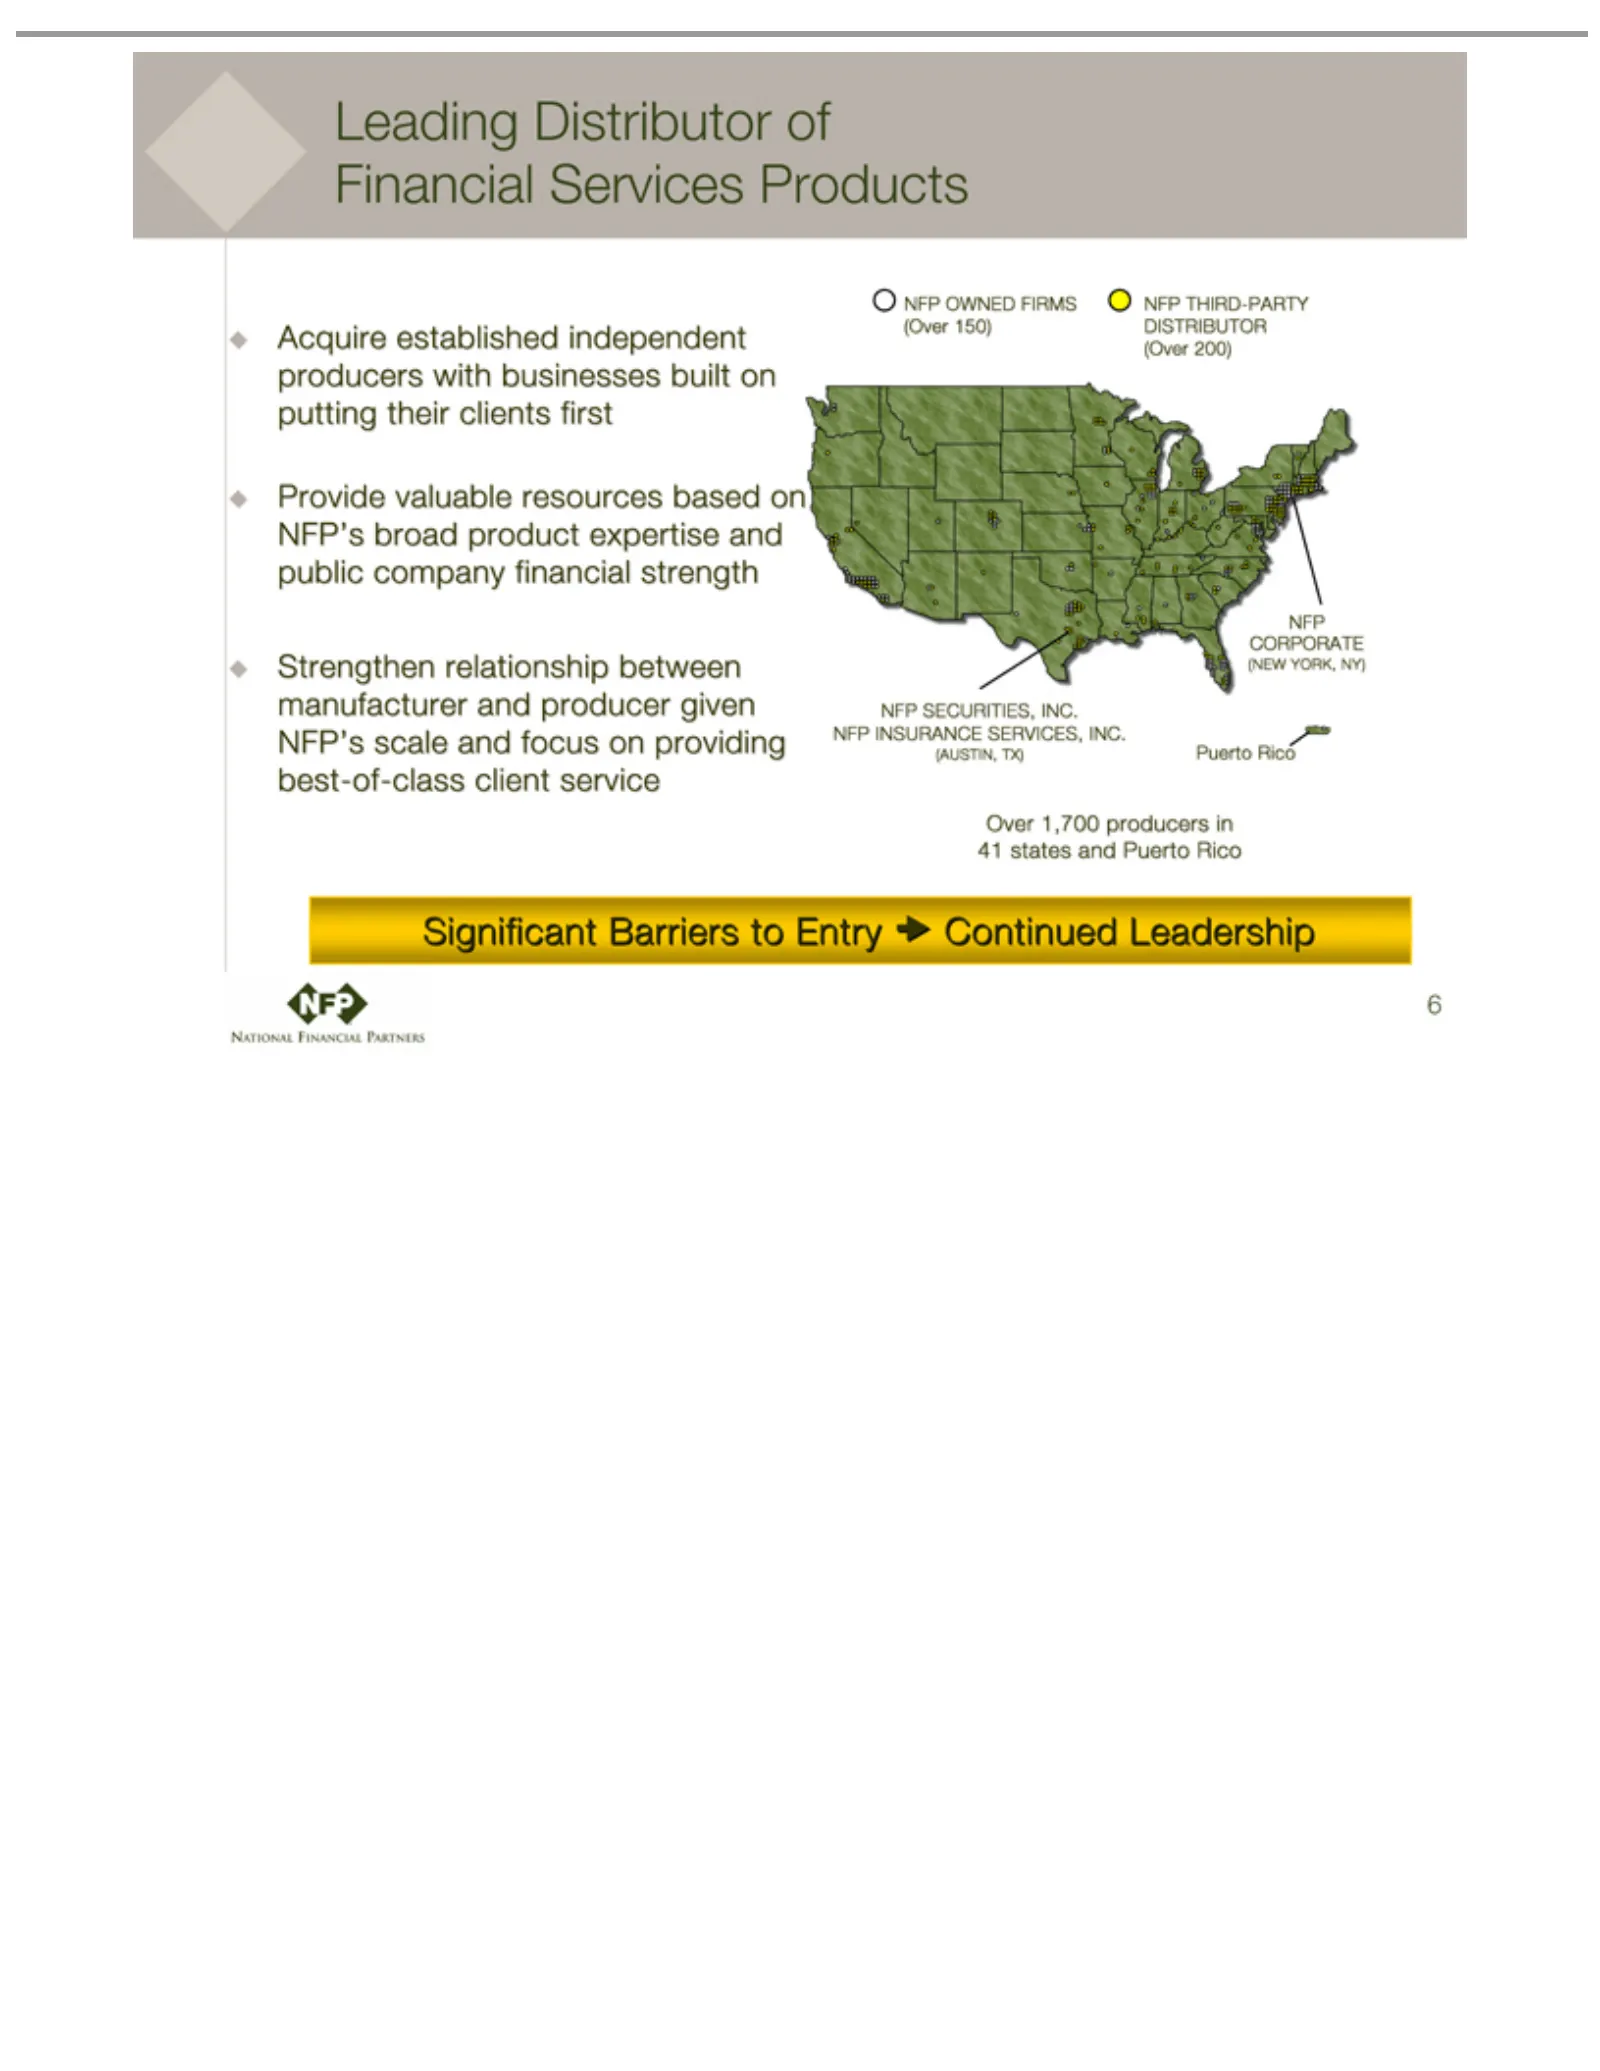
Slide 6: Leading Third-Party Distributor of Financial Services Products
Leading Acquire Provide Strengthen (AUSTIN, Over Puerto NFP (NEW Significant Continued 6 THIRD-PARTY OWNED SECURITIES, CORPORATE 1,700 YORK, Rico valuable established Distributor Leadership TX) relationship Barriers producers FIRMS NY)resources to independent of INC. DISTRIBUTOR in Entry Financial (
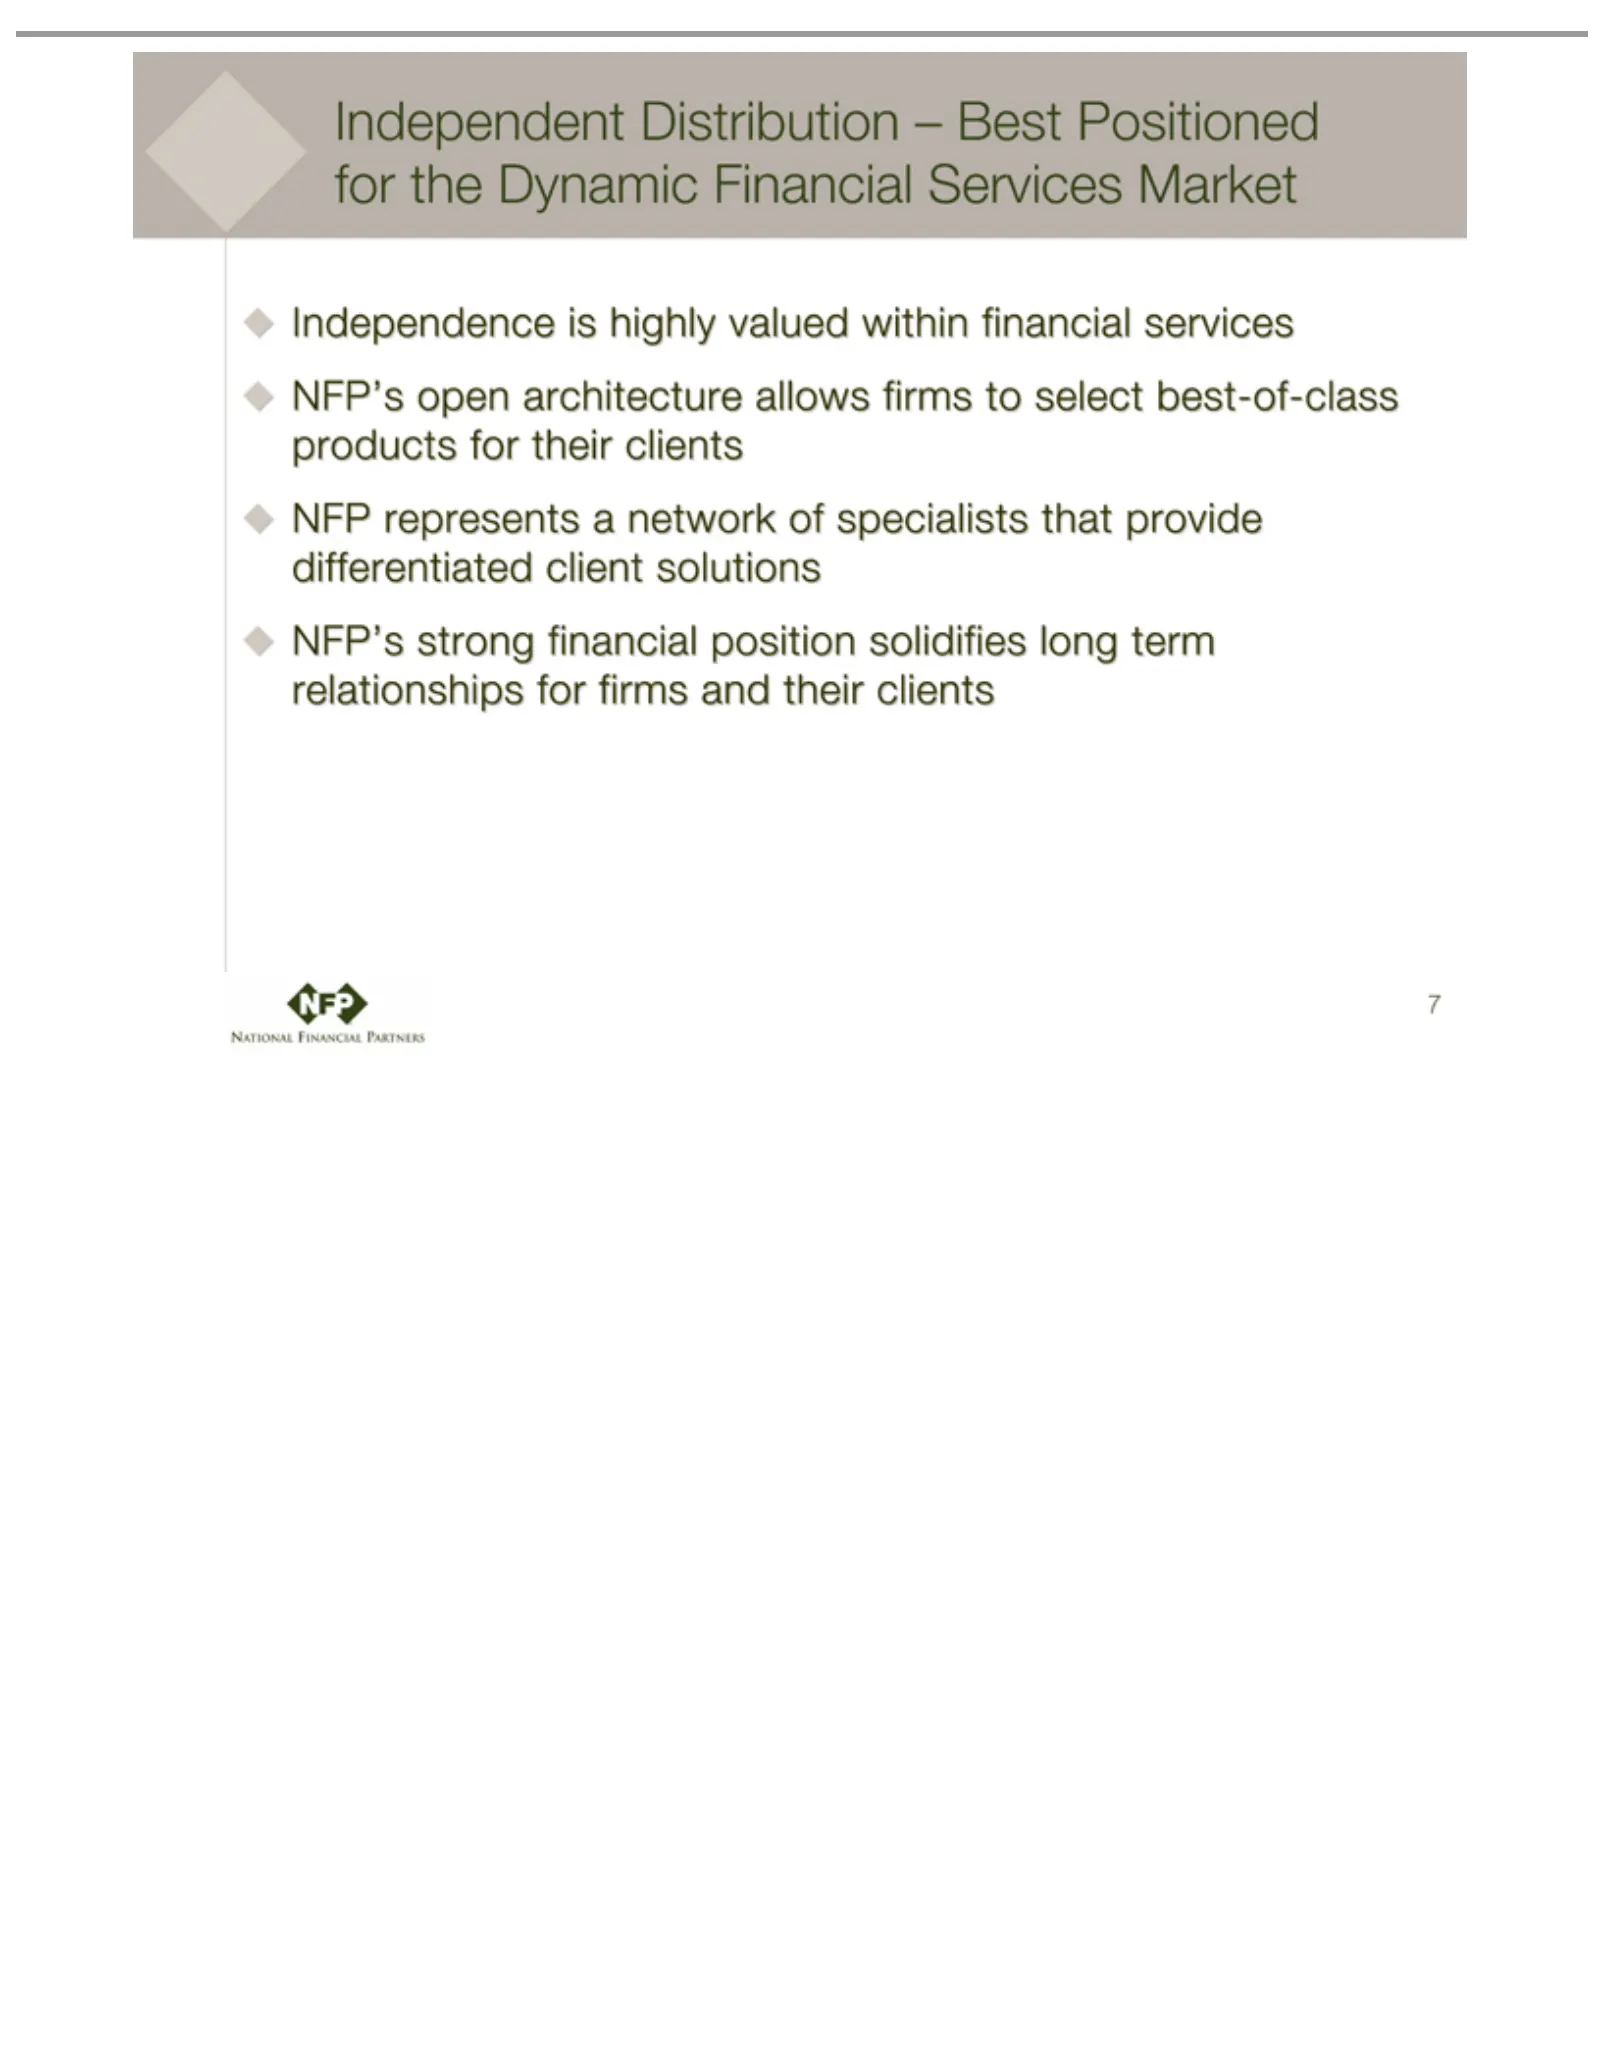
Slide 7: Independent Distribution Network
Independent Independence NFP NFP’s 7 represents open architecture strongDistribution financial isahighly network position valued allows –ofBest specialists within solidifies firms Positioned to financial that select long for provide term best-of-class the services Dynamic relationships differentiate
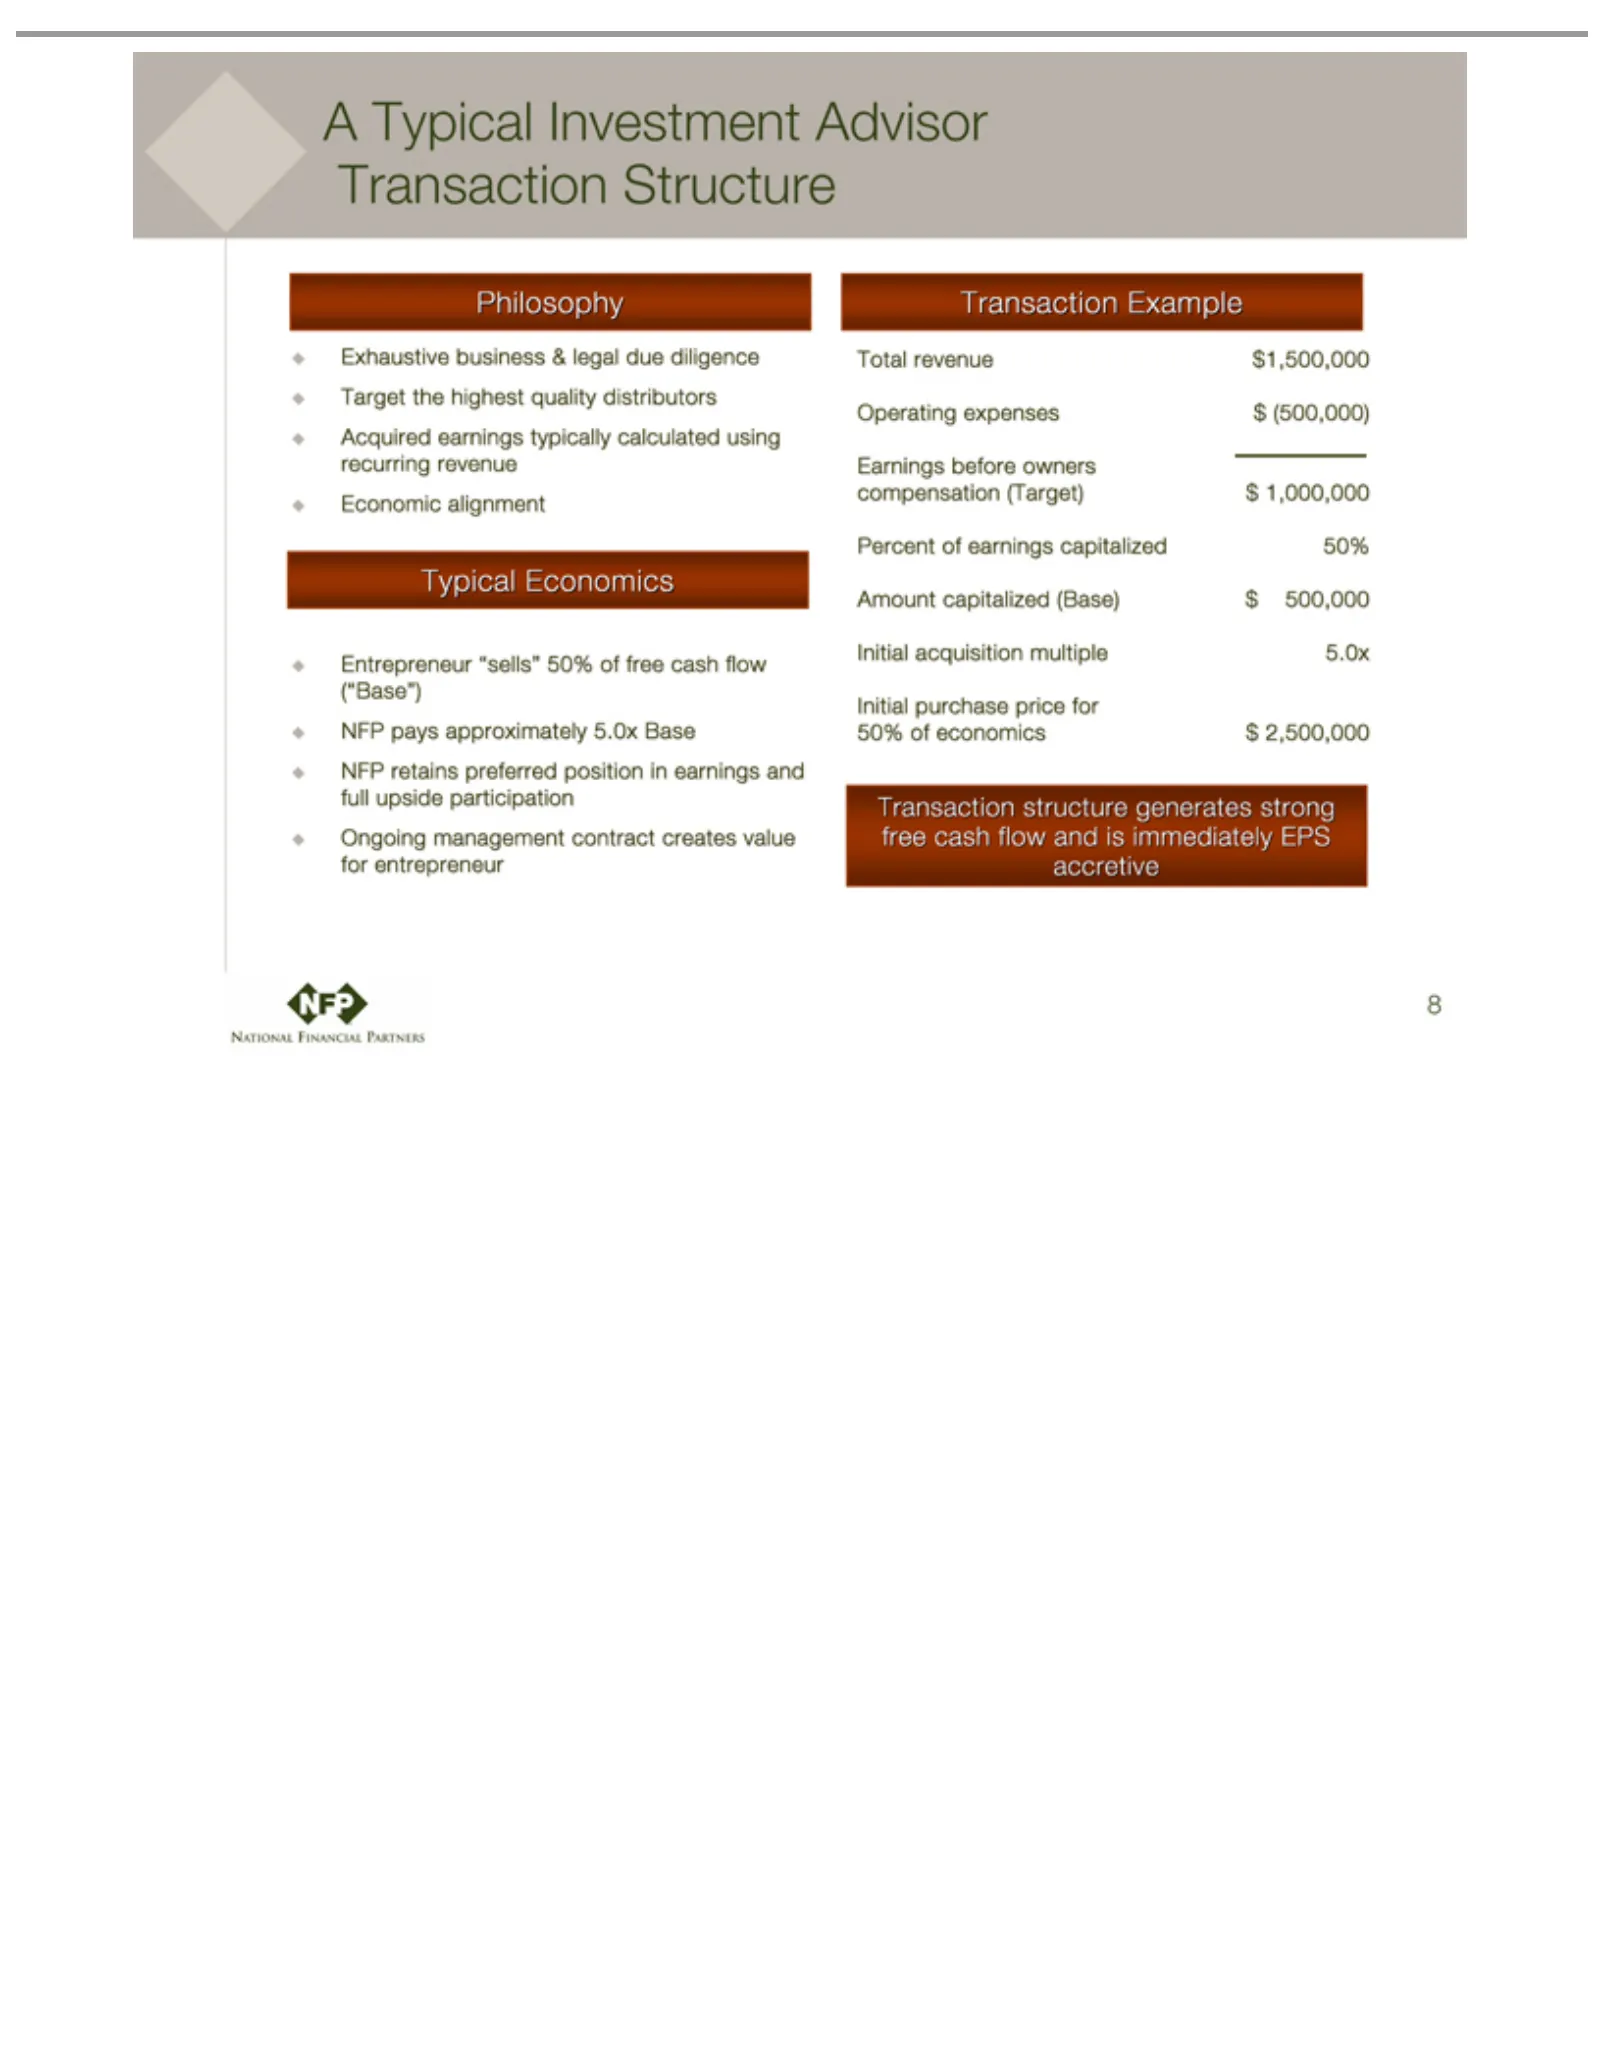
Slide 8: A Typical Acquisition: Transaction Economics
A Typical Exhaustive Philosophy Target Acquired Economic Typical Entrepreneur NFP Ongoing Total Operating Earnings compensation Percent Amount Initial 50% Transaction 8 pays retains of revenue acquisition purchase the economics Economics of capitalized management before earnings approximately Invest
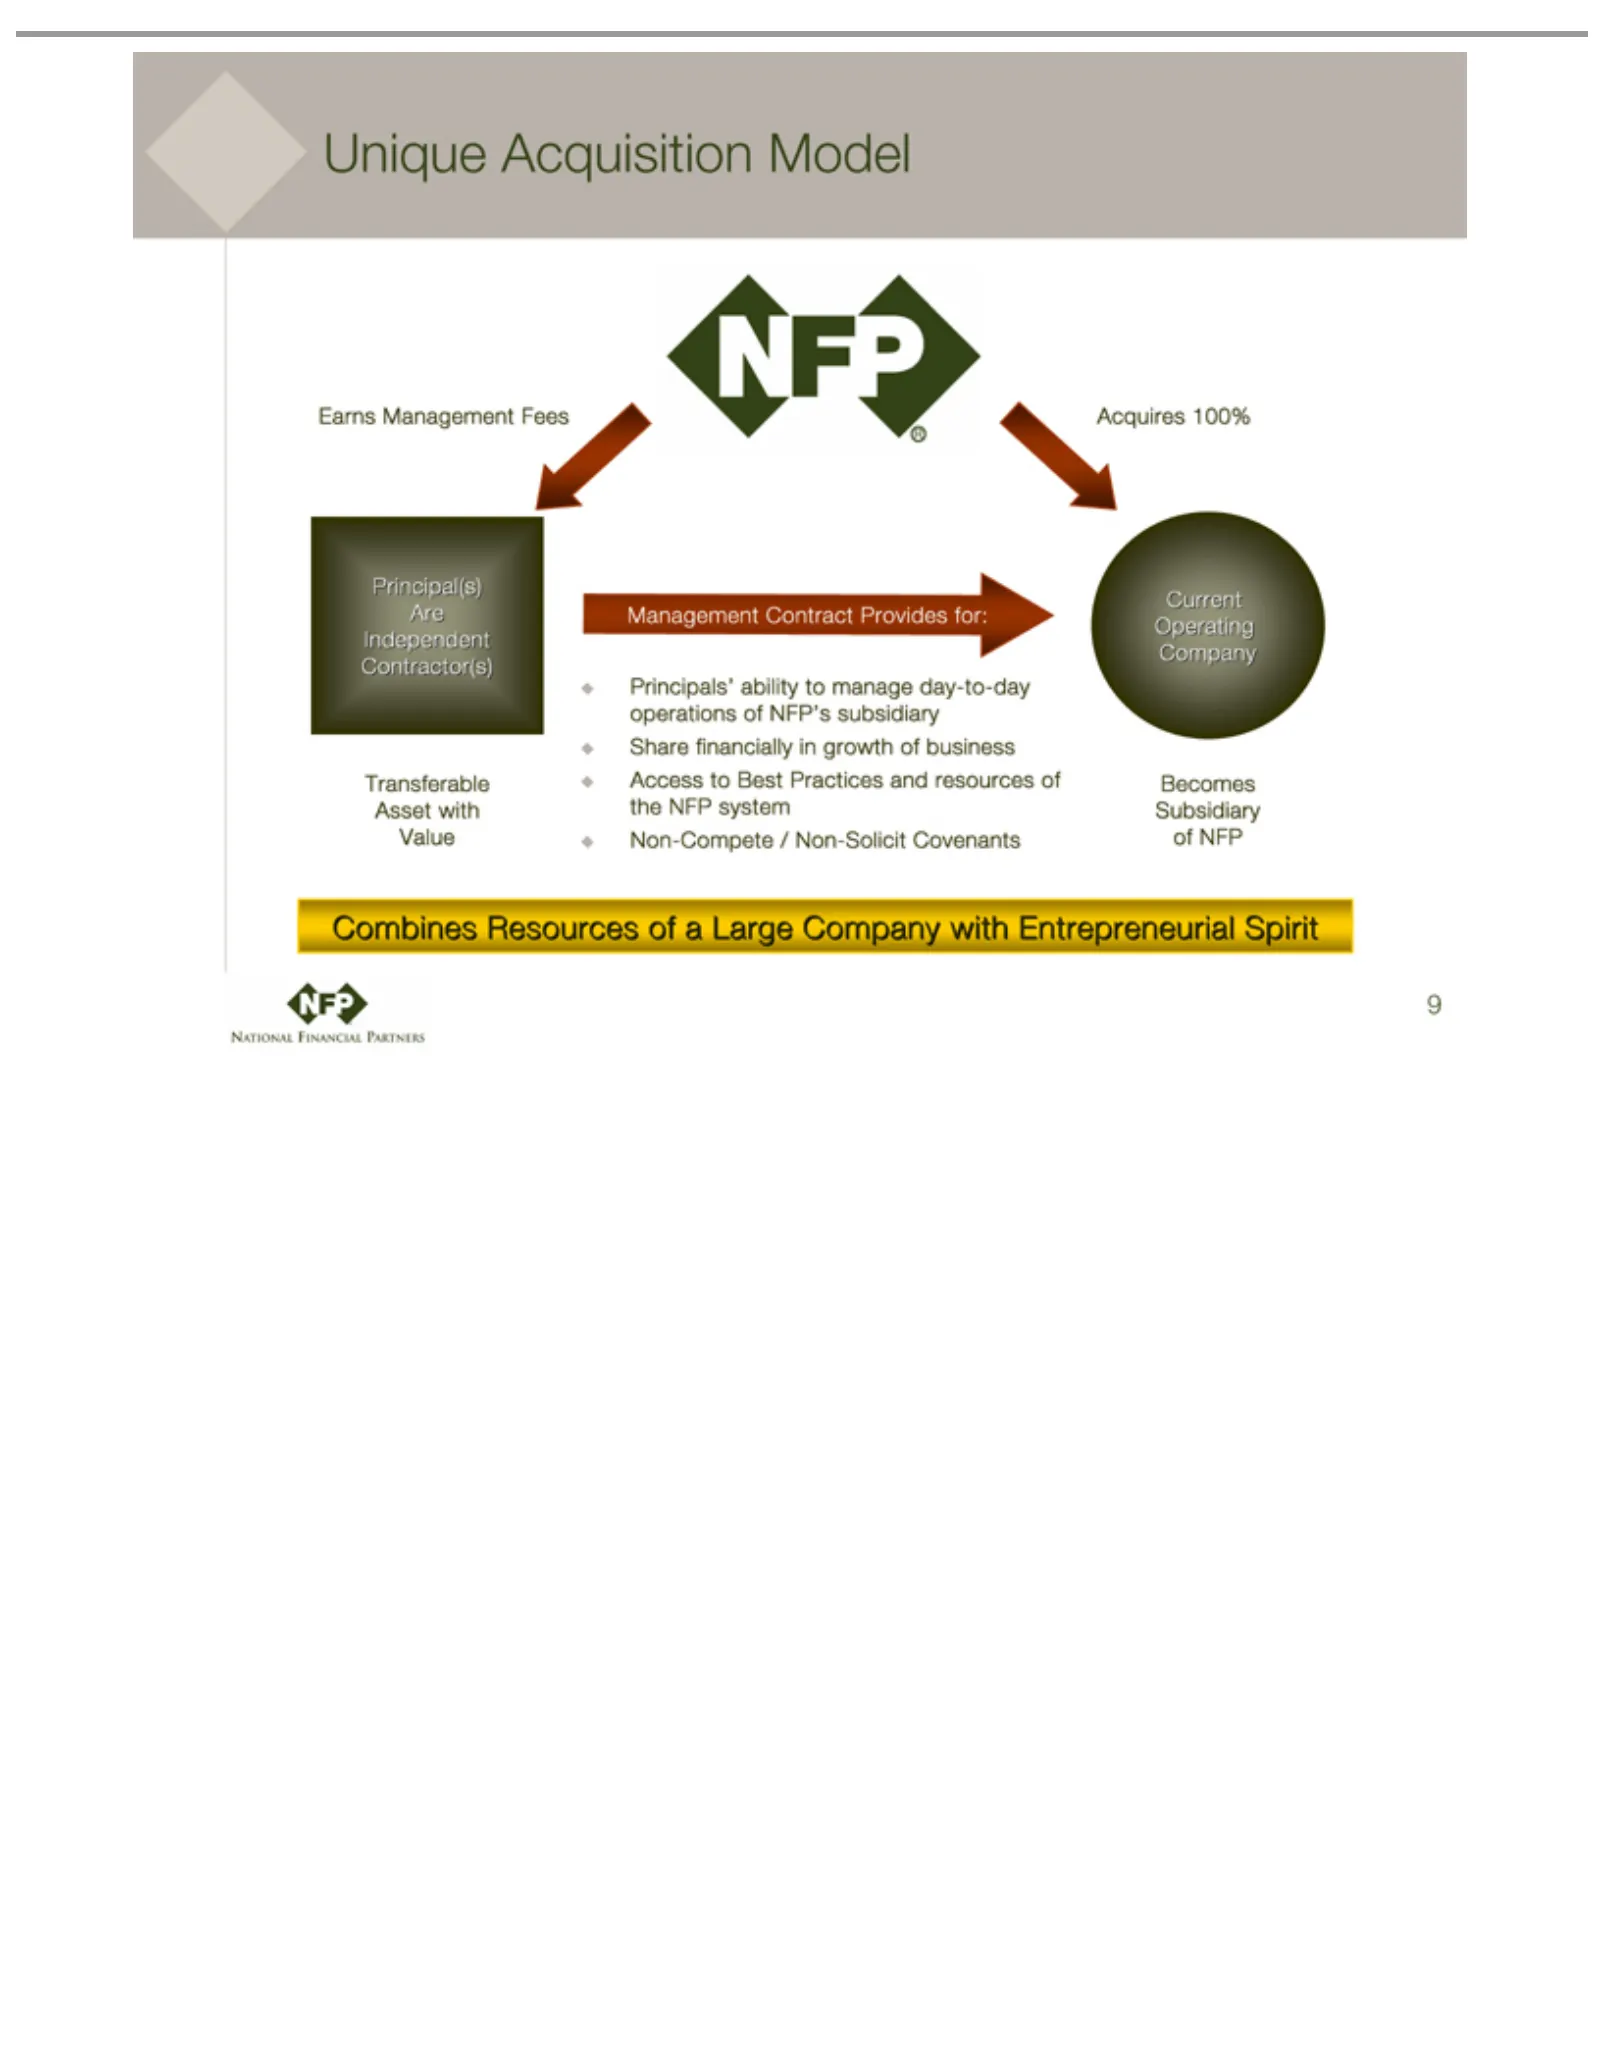
Slide 9: Unique Management Model
UniqueManagement Earns Principal(s) Transferable Management Current Acquires Principals’ Becomes Covenants Combines 9 Acquisition Operating 100% Subsidiary Resources ability Are Asset Contract Independent to Company with Fees Model manage of ofProvides NFP Value a Large day-to-day Contractor(s) for:
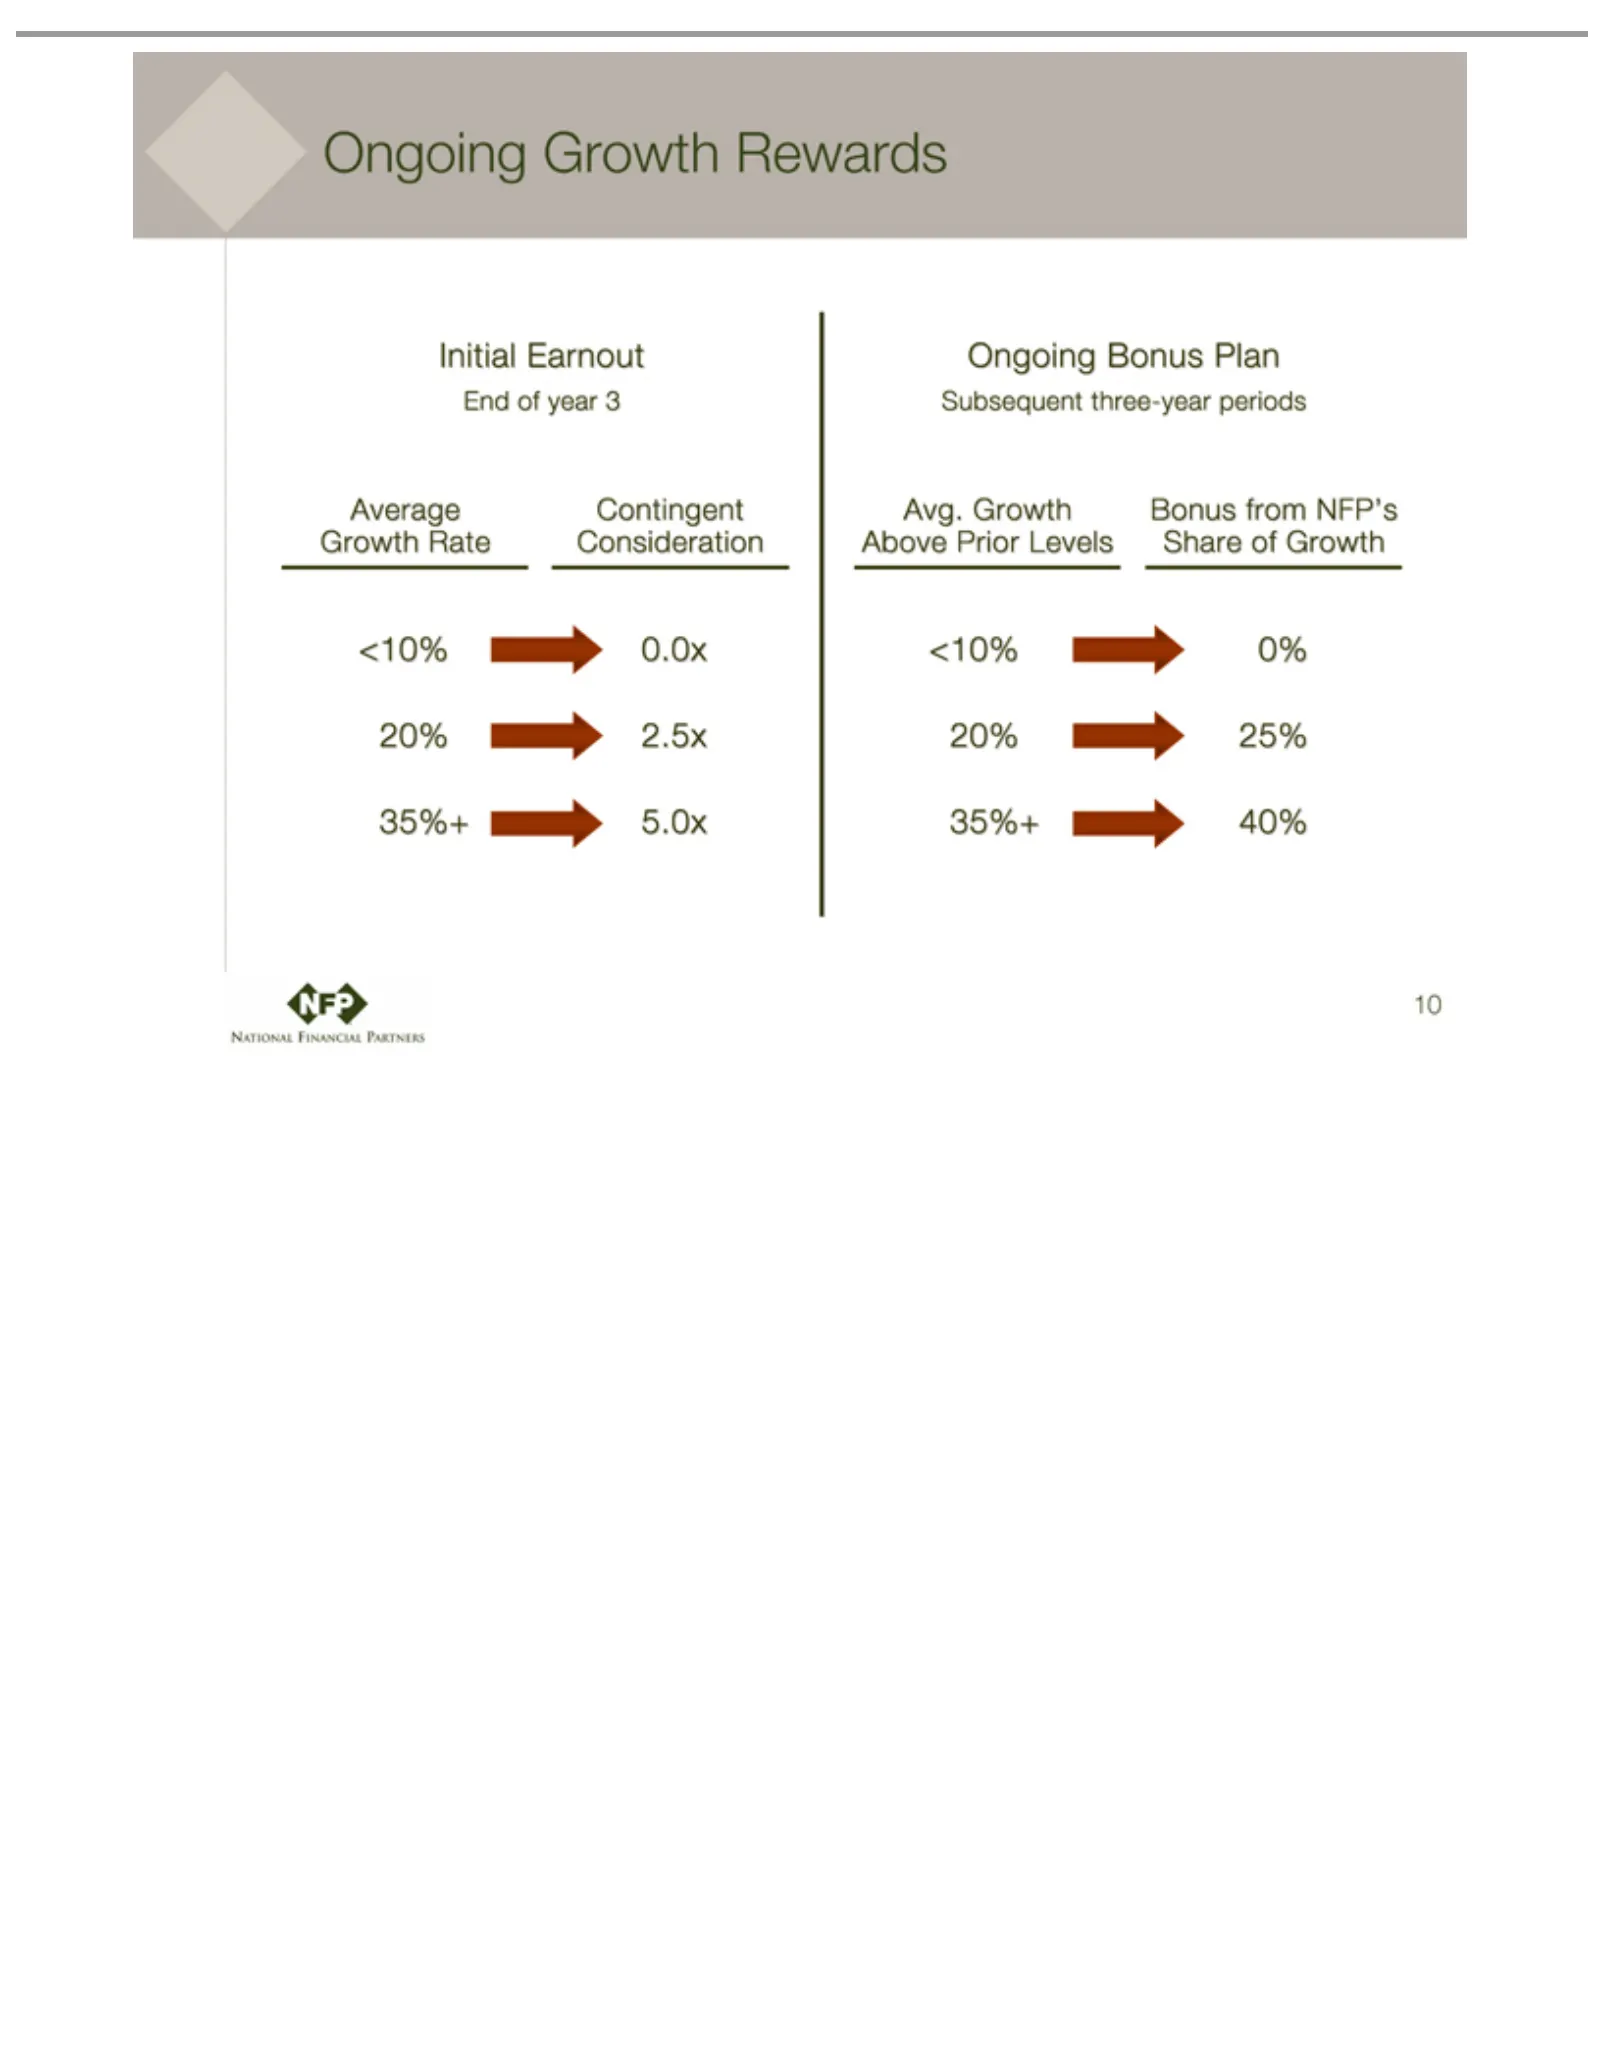
Slide 10: Earnout and Growth Rewards Structure
Initial End Average Contingent 0.0x Ongoing Subsequent Avg. <10% Bonus 0% 10 25% of 2.5x Growth Earnout 20% from year Growth 40% Growth Bonus 5.0x Consideration 35%+ three-year 3NFP’s Above Plan Rate Rewards Share Prior periods of Levels Growth
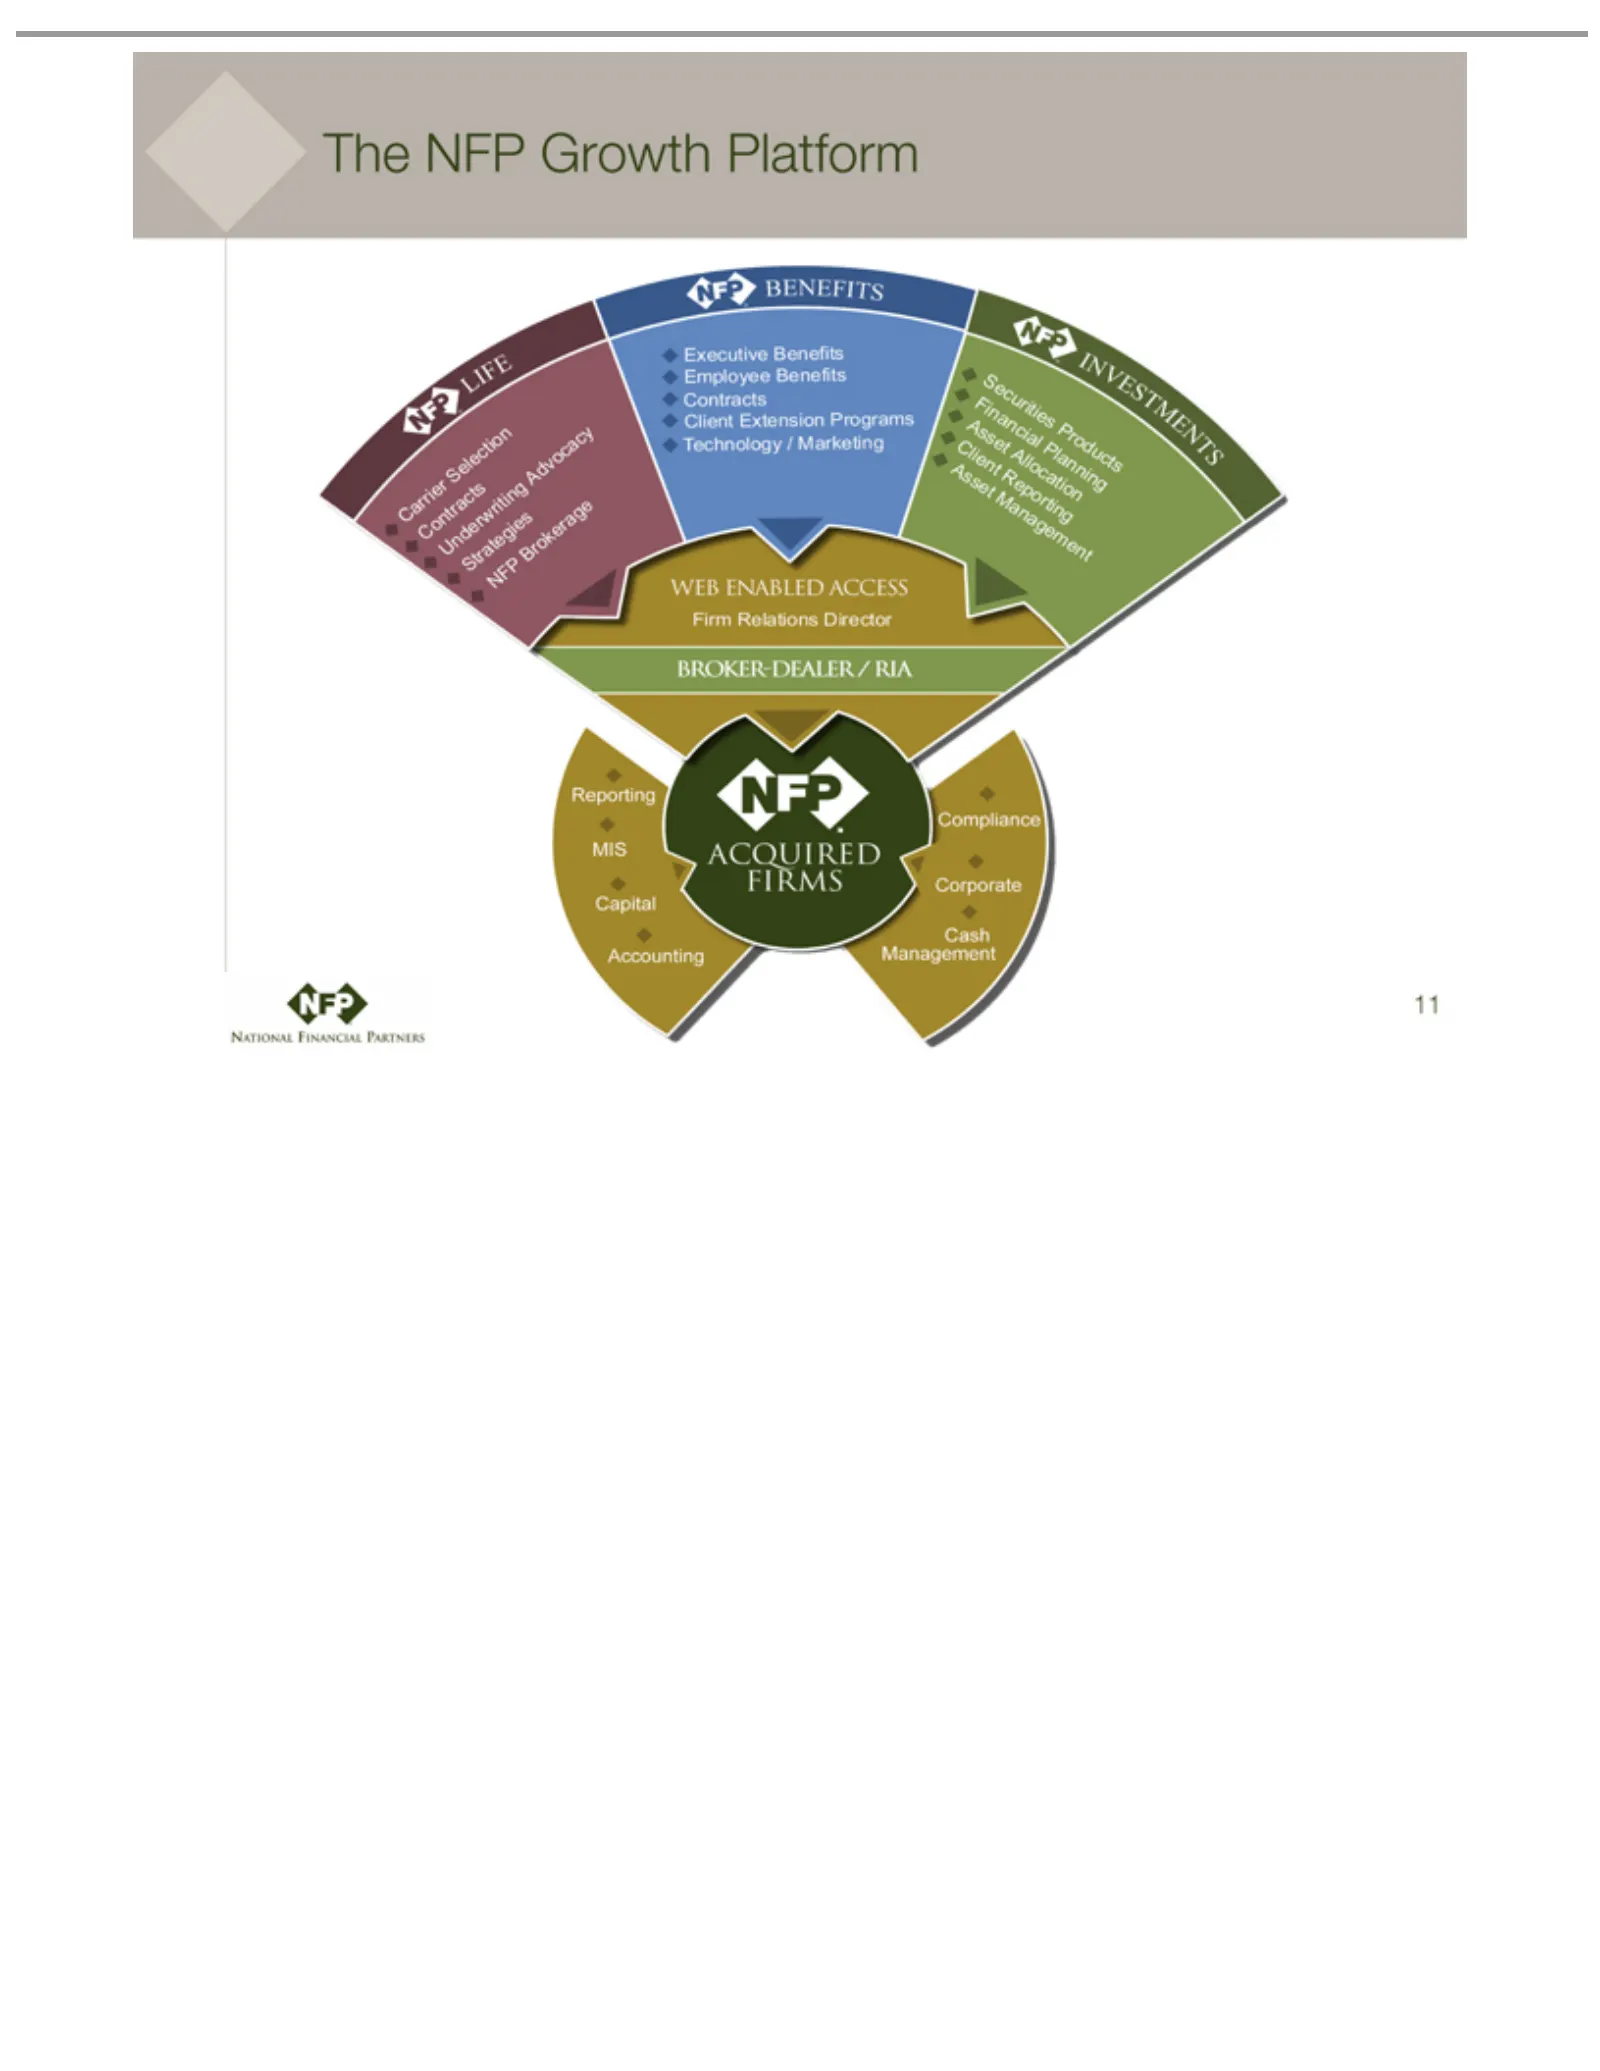
Slide 11: The NFP Platform and Resources
The NFP Carrier LIFE Underwriting NFP Strategies Executive BENEFITS Employee Client Contracts Technology Securities INVESTMENTS Financial Asset WEB Firm ACQUIRED Accounting Capital MIS Reporting BROKER-DEALER/RIA Cash Corporate Compliance 11 Brokerage Relations Management Allocation ENABLED Manageme
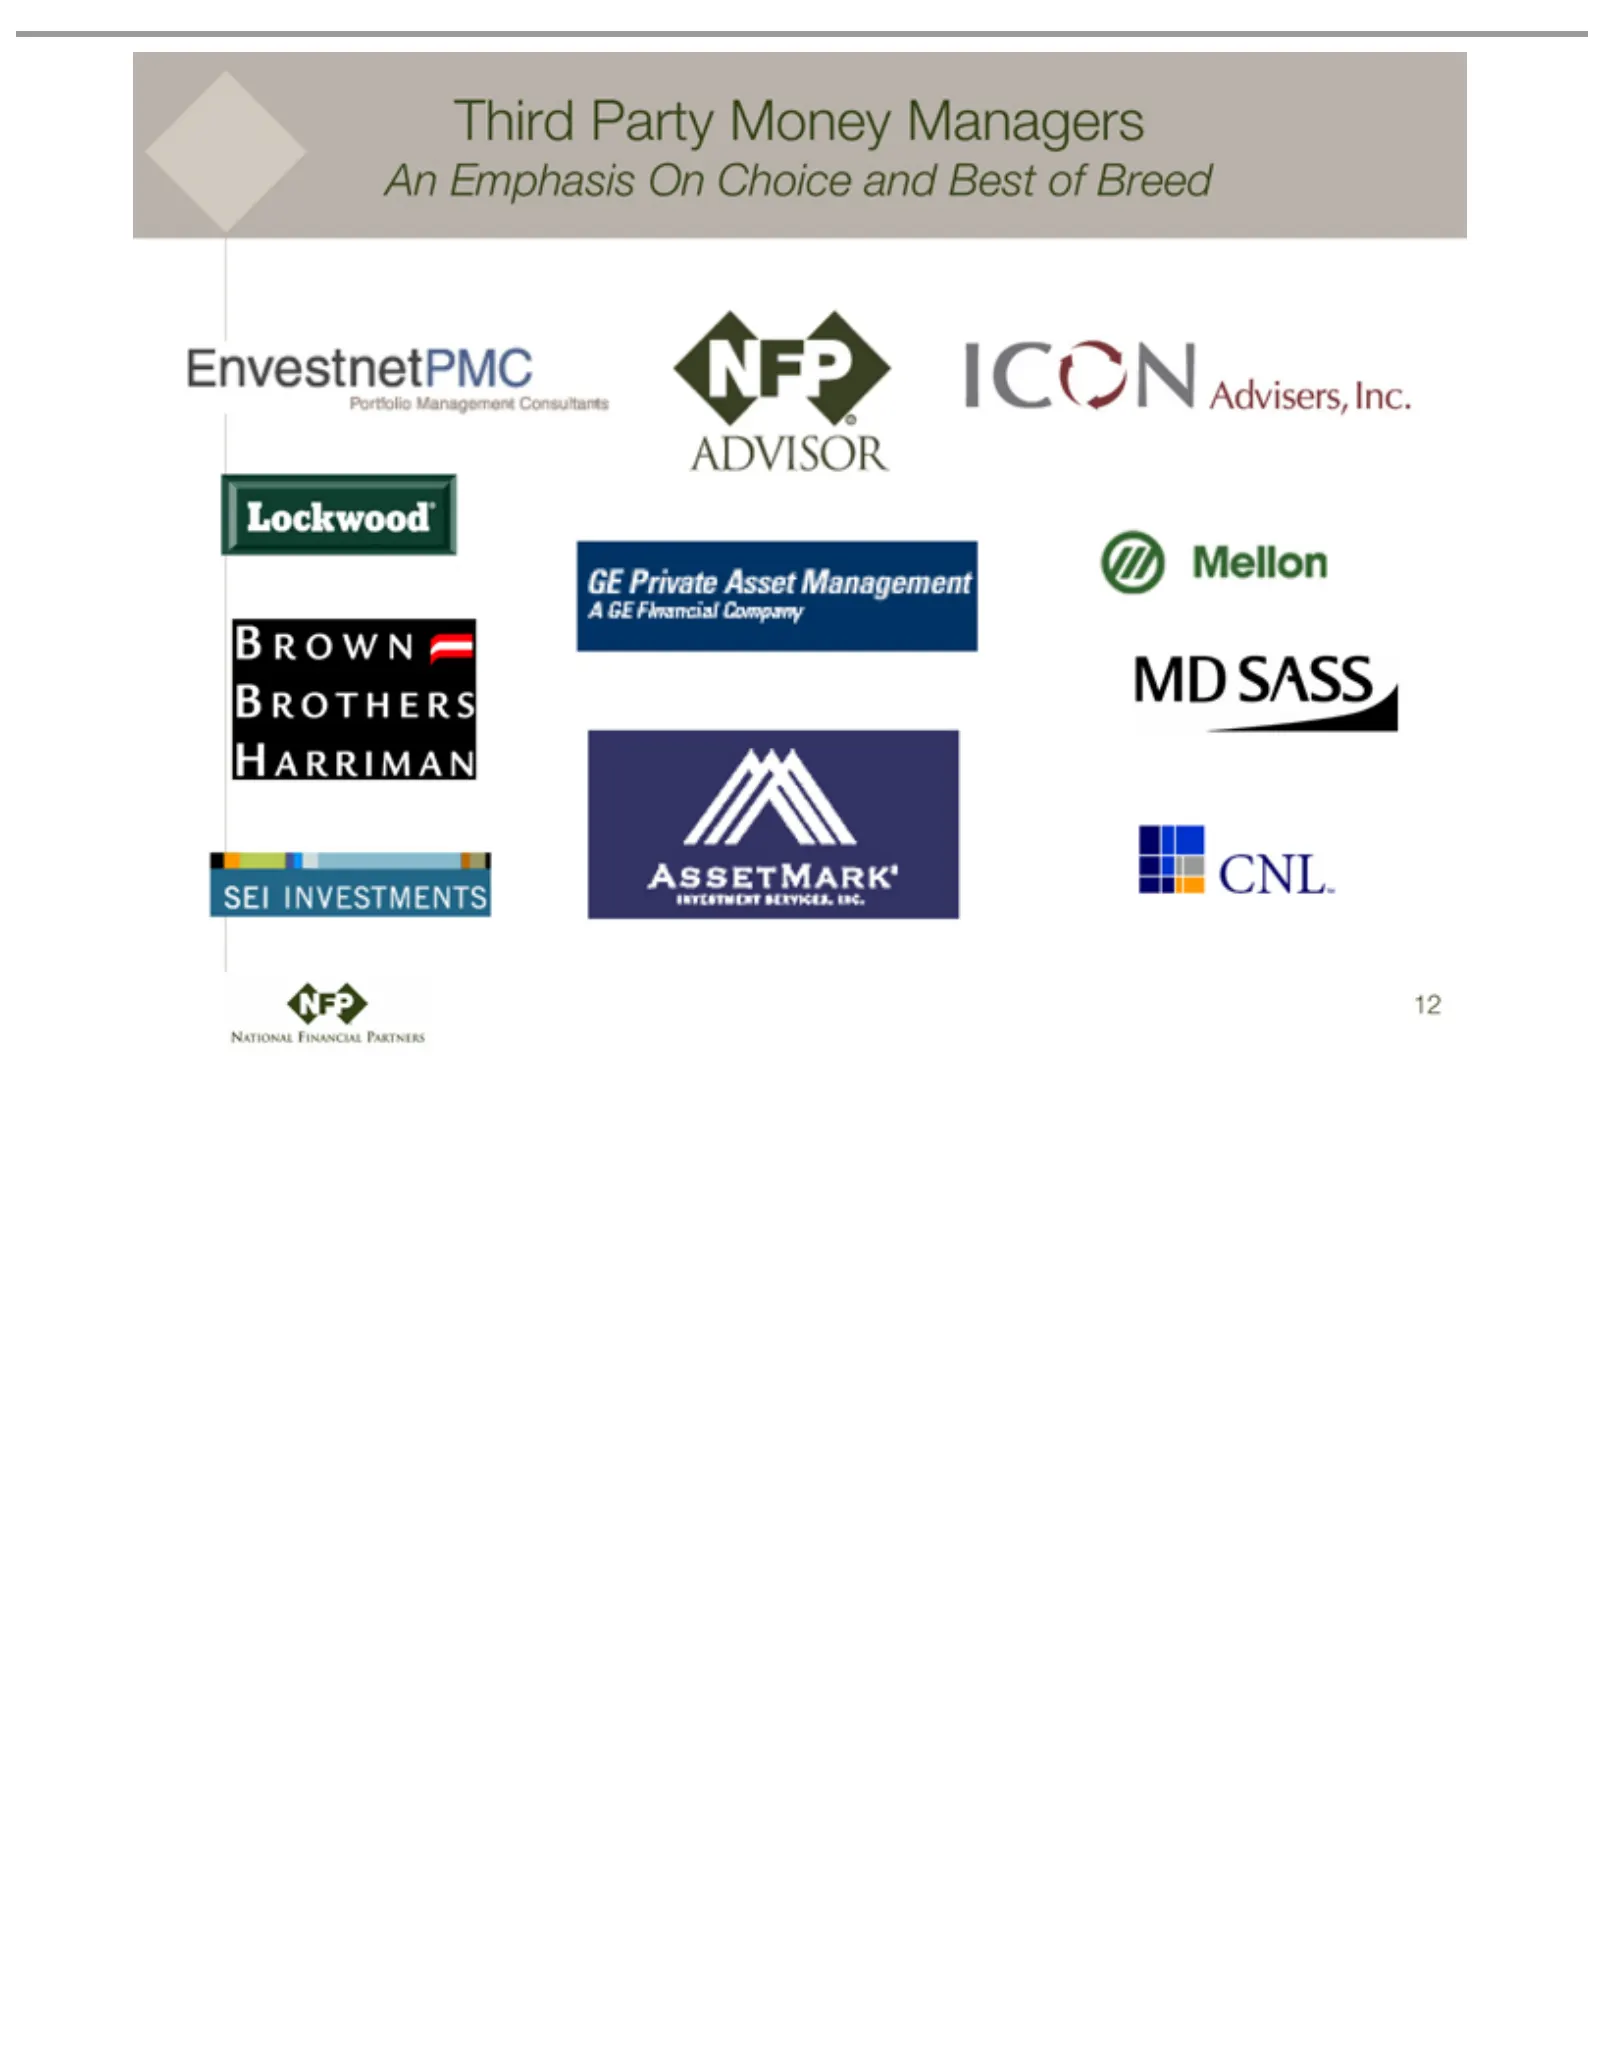
Slide 12: An Emphasis on Choice and Best of Breed Money Managers
Third An 12 Emphasis Party Money On Choice Managers and Best of Breed
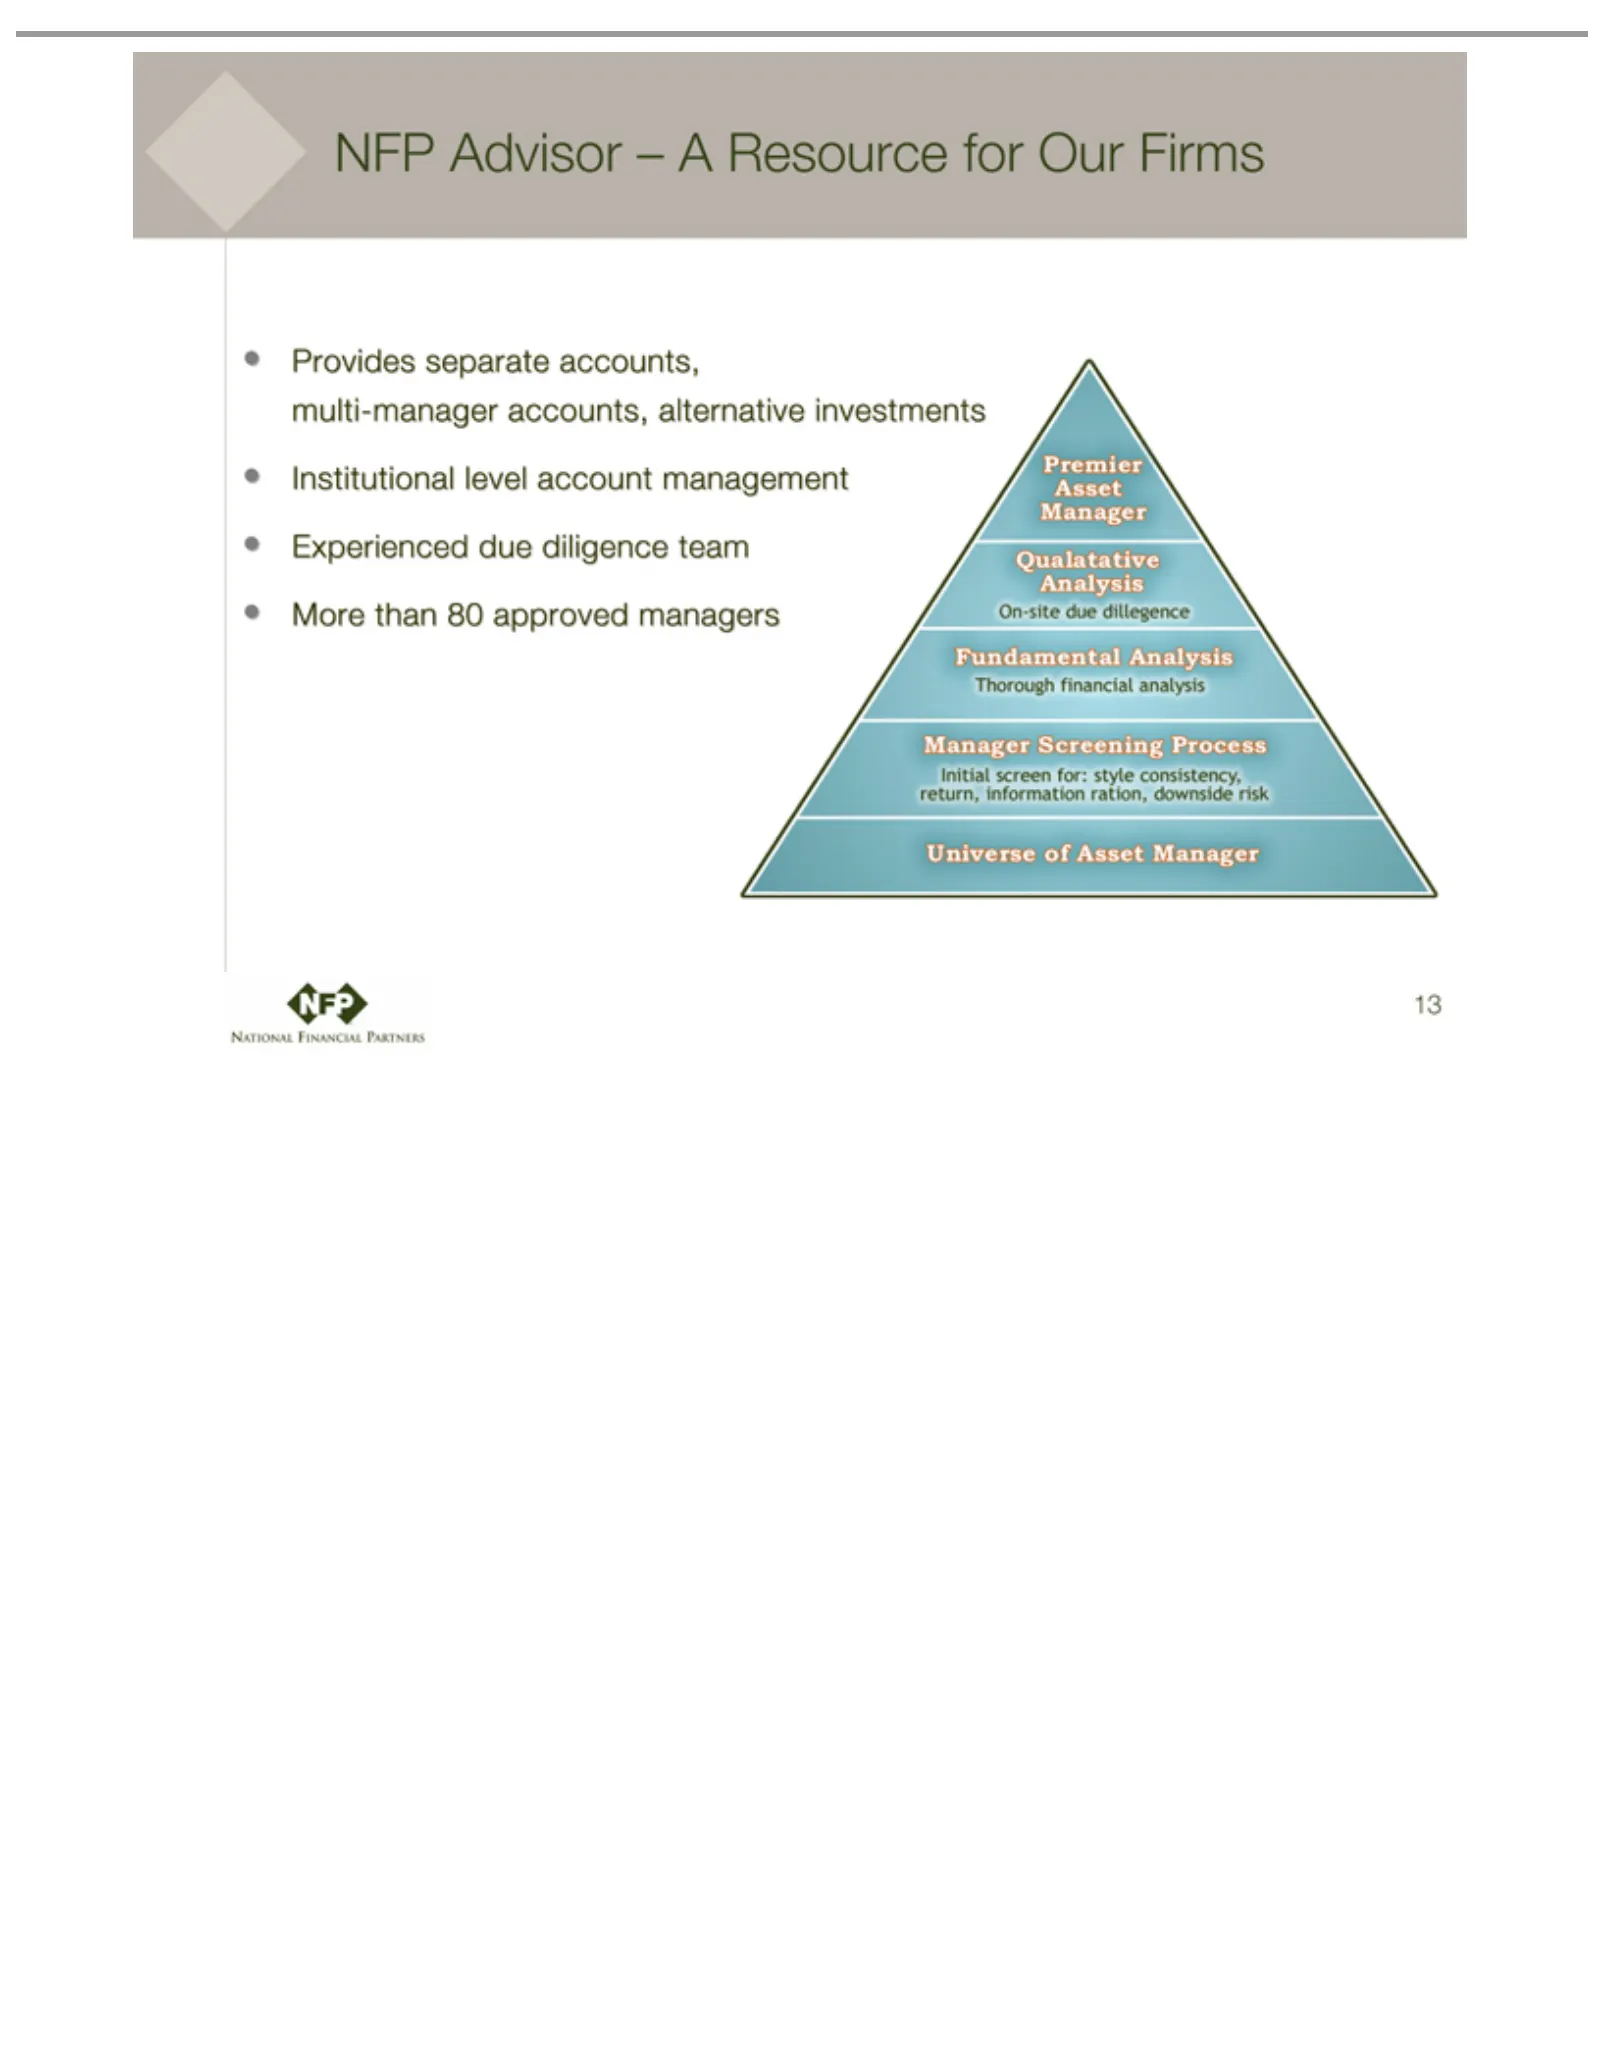
Slide 13: NFP Advisor Resources Manager Due Diligence
NFP Advisor Provides Institutional Premier Qualatative On-site Fundamental Through Manager Initial return, Universe 13 screen information due Asset financial separate Screening of Analysis Asset dillegence level Analysis for: –Manager A Resource style accounts, account Manager analysis ration, Proce
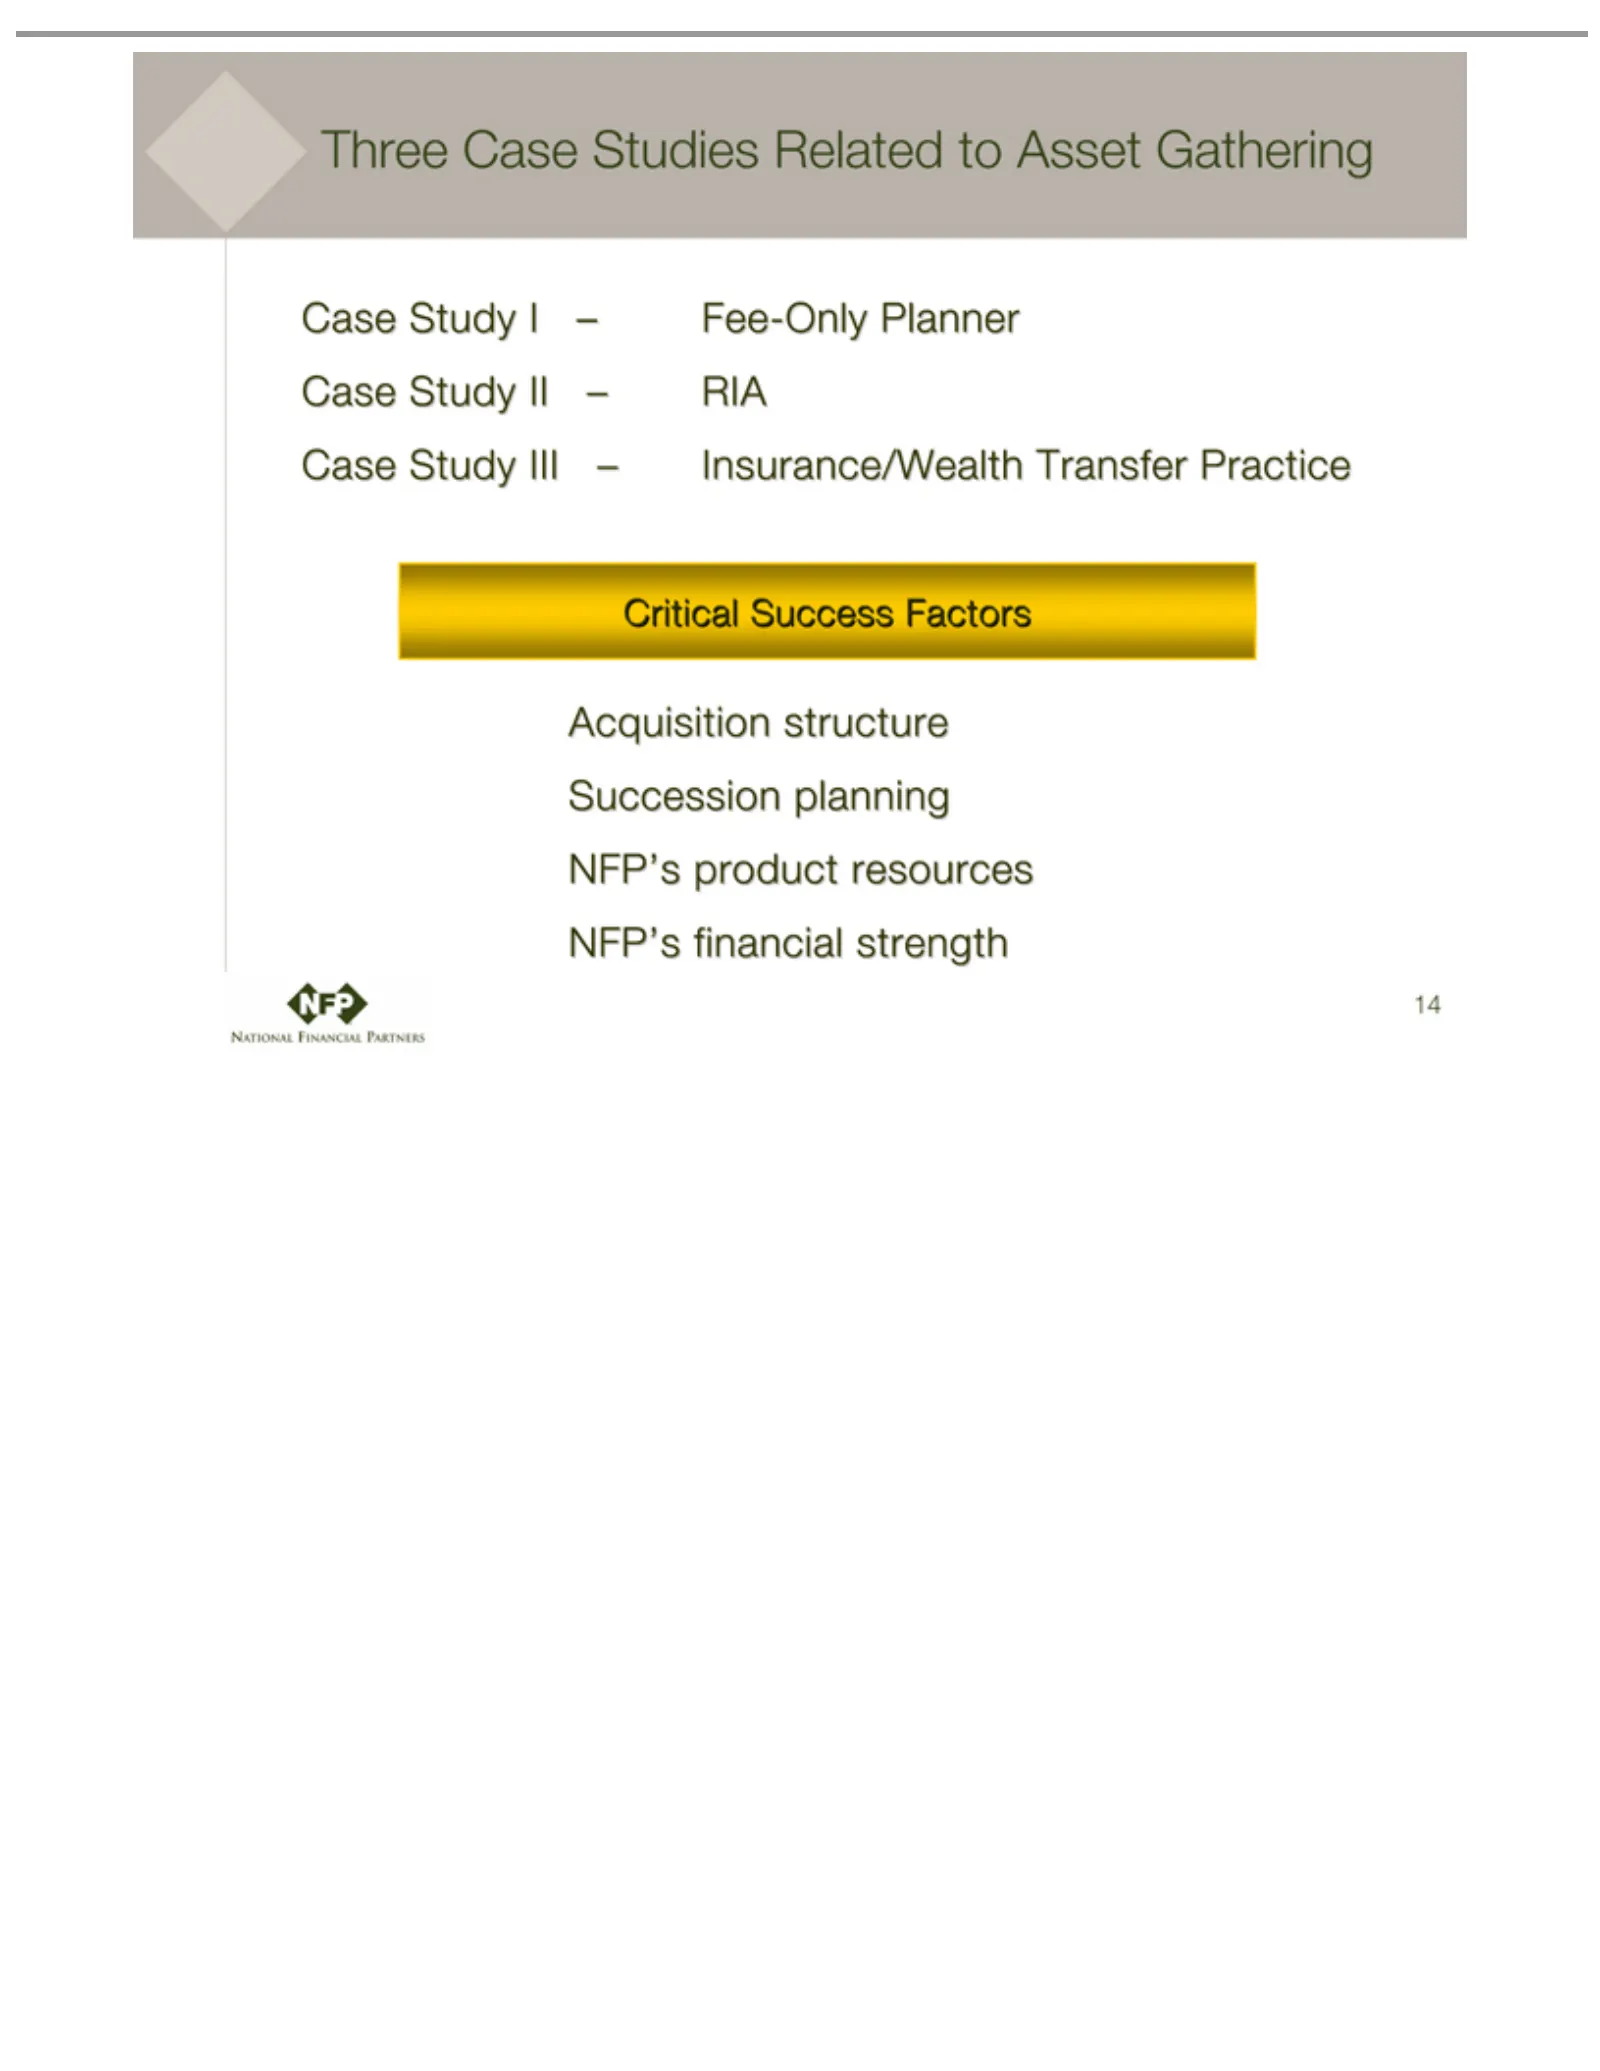
Slide 14: Three Case Studies
ThreeStudy Case Fee-Only Insurance/Wealth RIA Critical Acquisition 14 Case Success Planner Studies Istructure CaseFactors Transfer Study Related Succession IIPractice Case to Asset Study planning Gathering III NFP’s product resources NFP’s financial strength
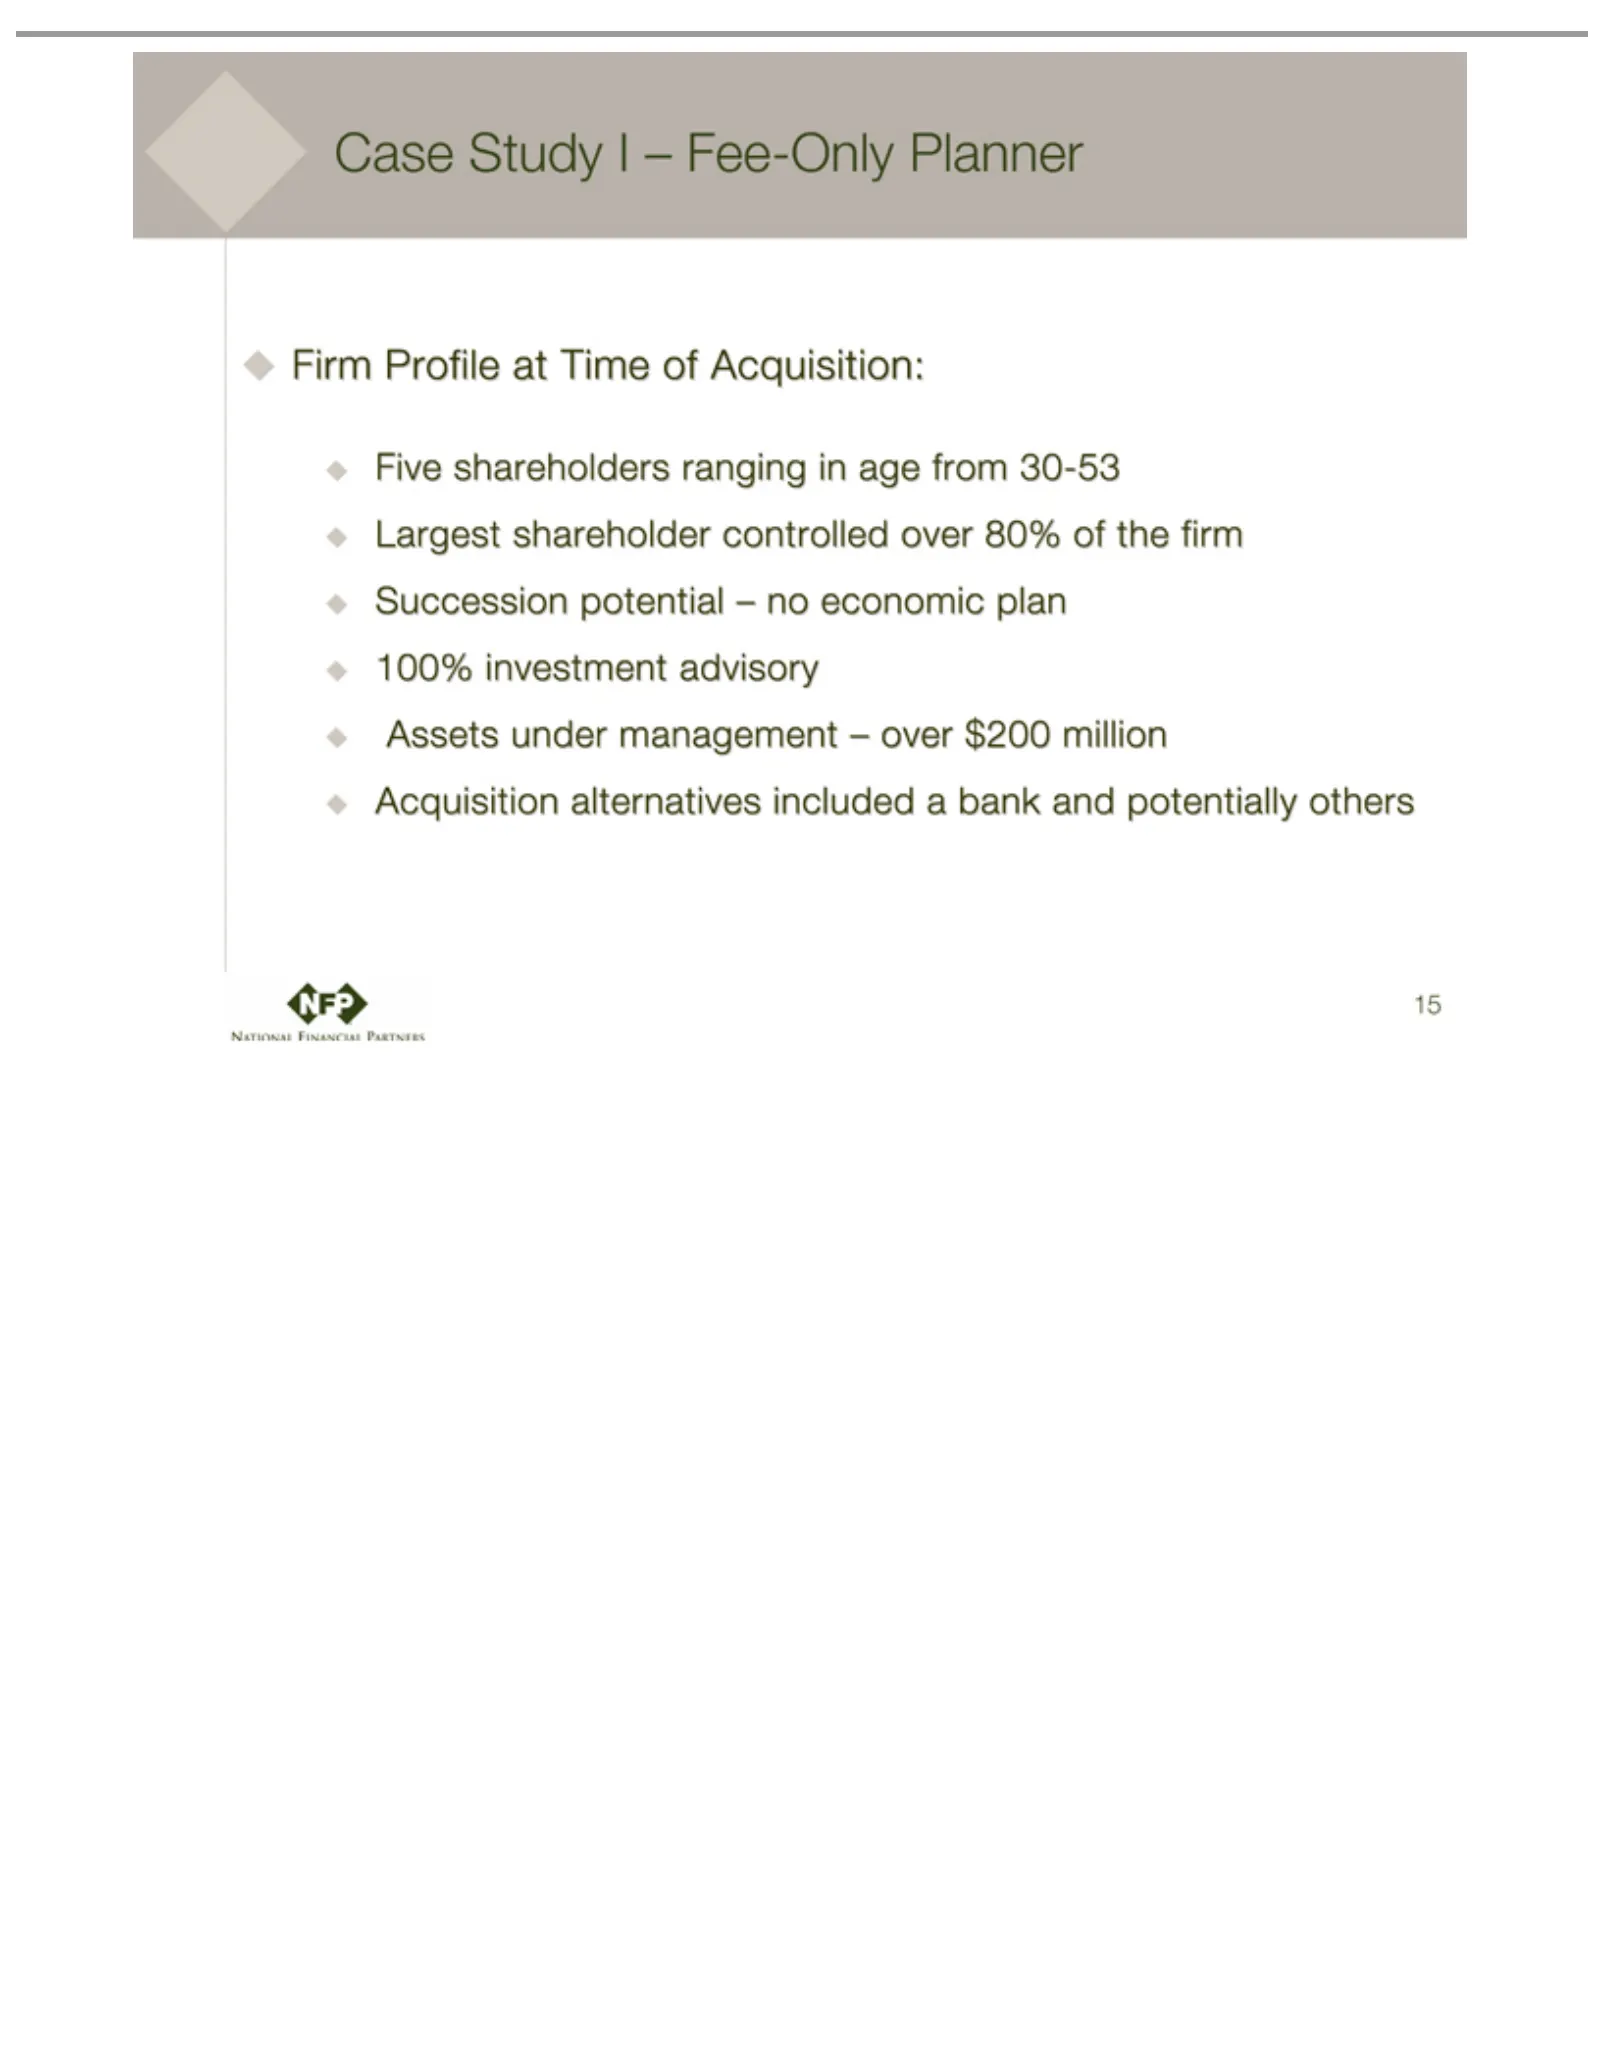
Slide 15: Case Study I: Fee-Only Planner
Case shareholders Firm Five $200 Acquisition 15 Study Profile millionIalternatives at – Fee-Only Time ranging of Acquisition: included Planner in age from a bank 30-53 and potentially Largest shareholder others controlled over 80% of the firm Succession potential – no economic plan 100% investment a
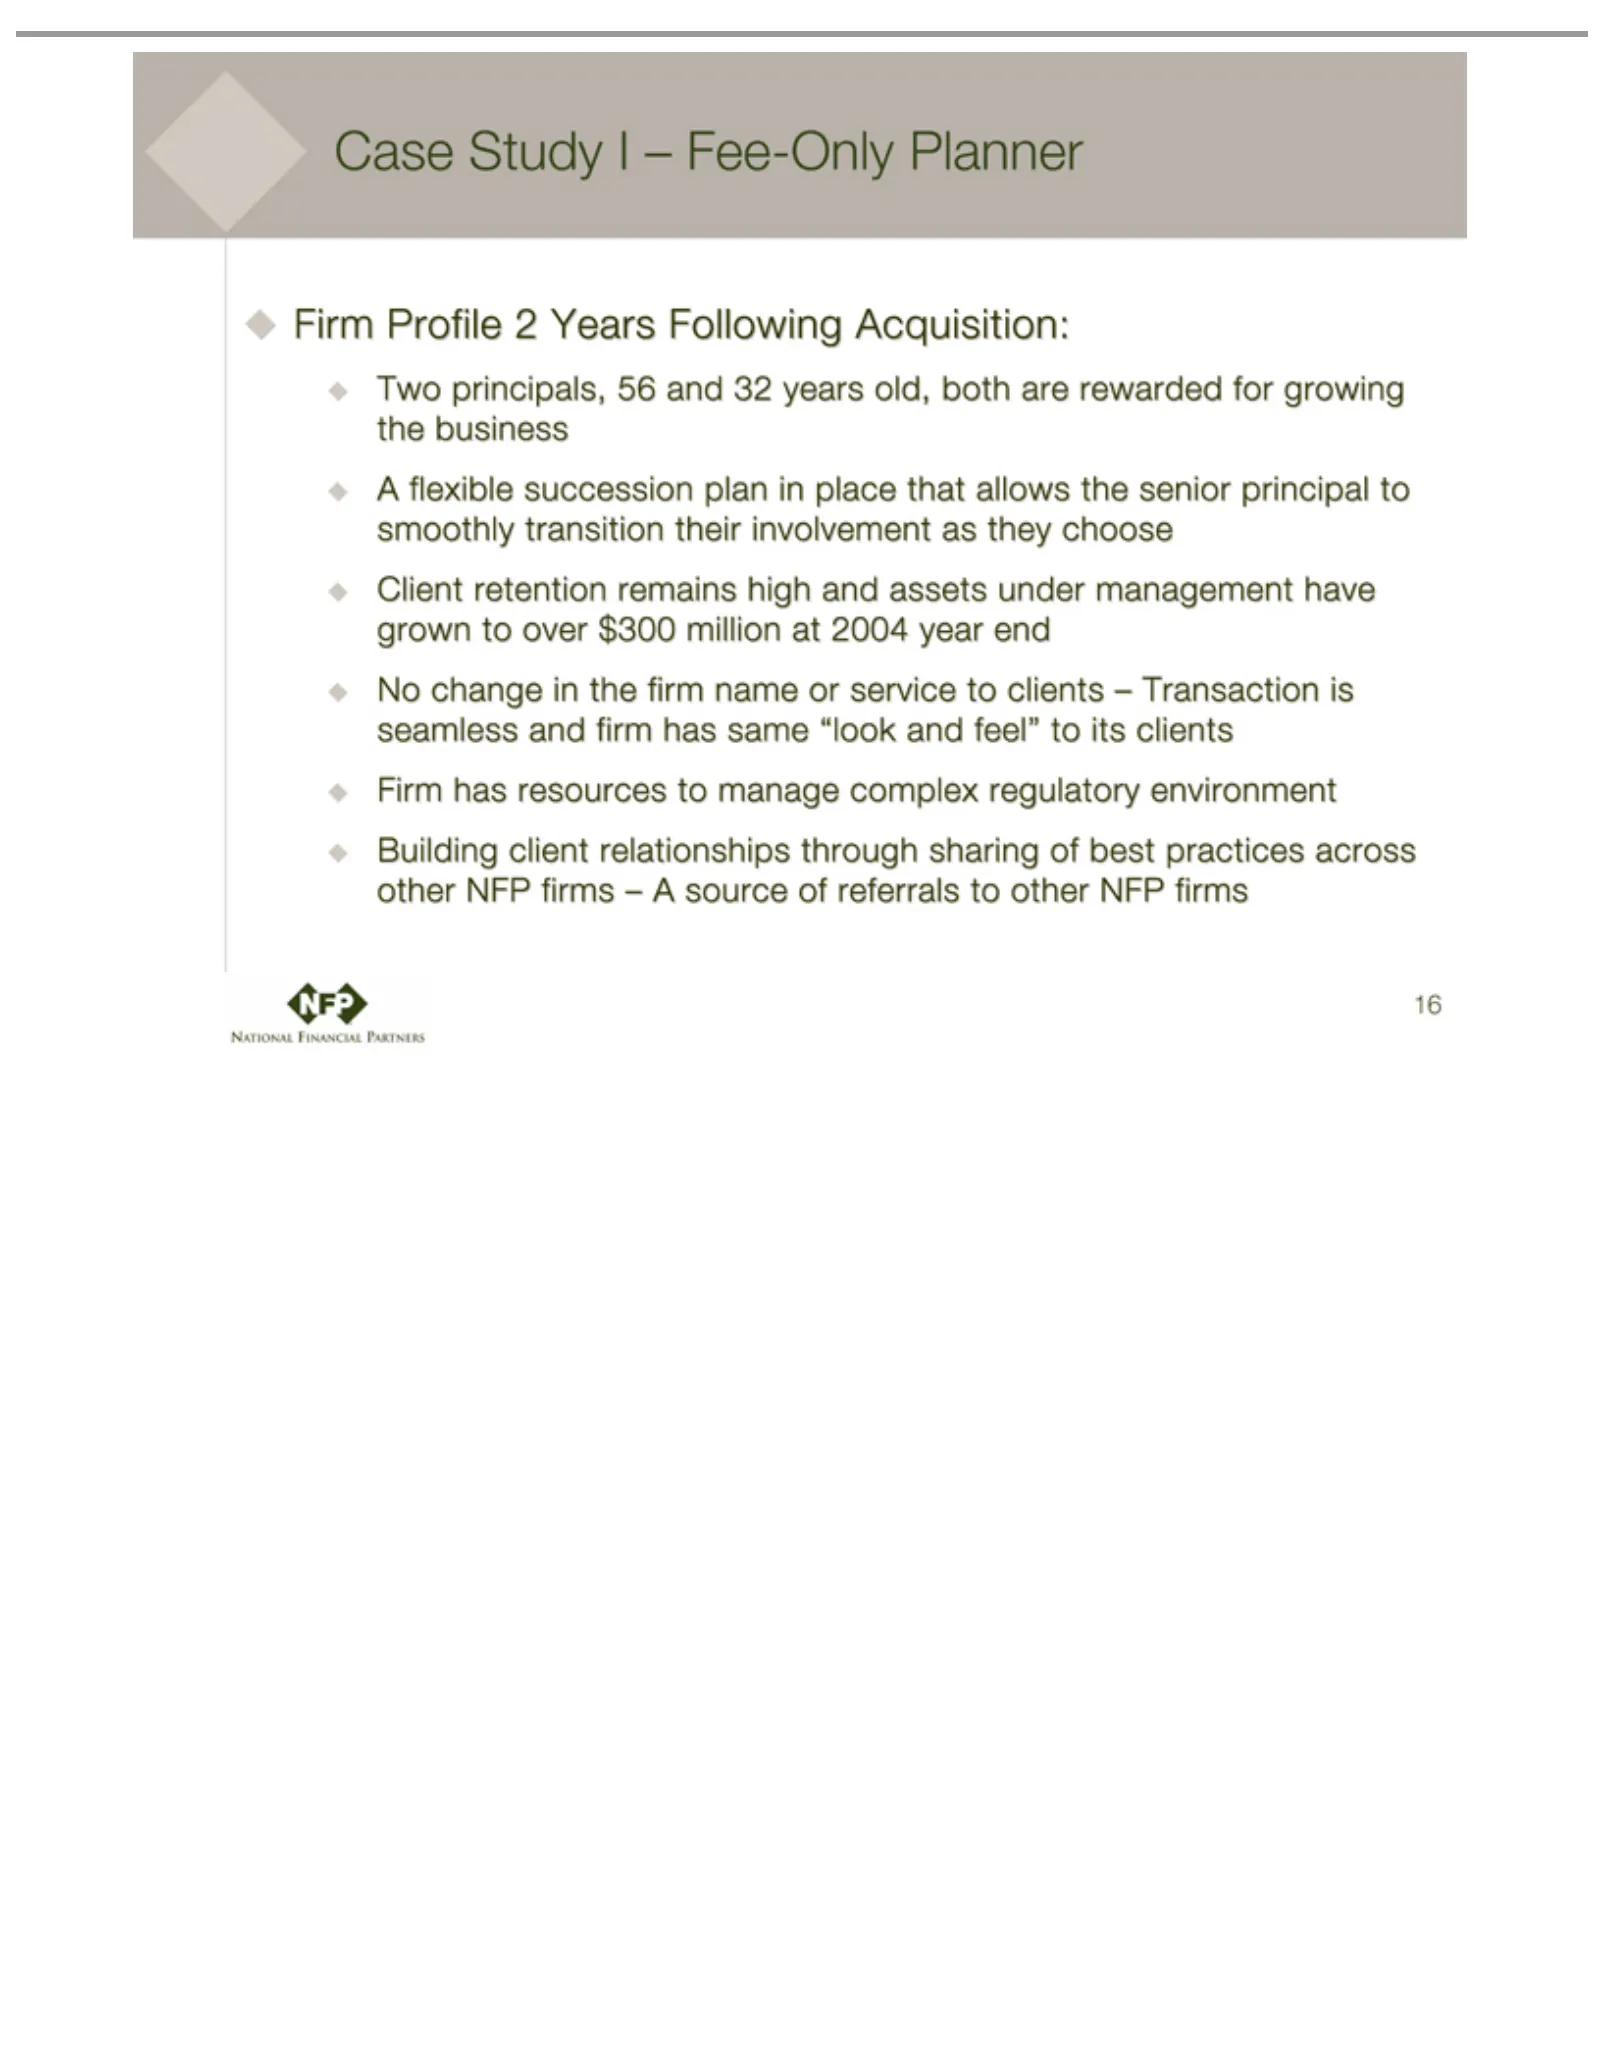
Slide 16: Case Study I: Results Following Acquisition
Case Two A Client No Firm Building 16flexible change principals, Study Profile has retention client resources succession in I 2–the Years Fee-Only relationships 56 remains firm and toFollowing plan manage name 32high Planner years inor through place and complex service Acquisition: old, assets that
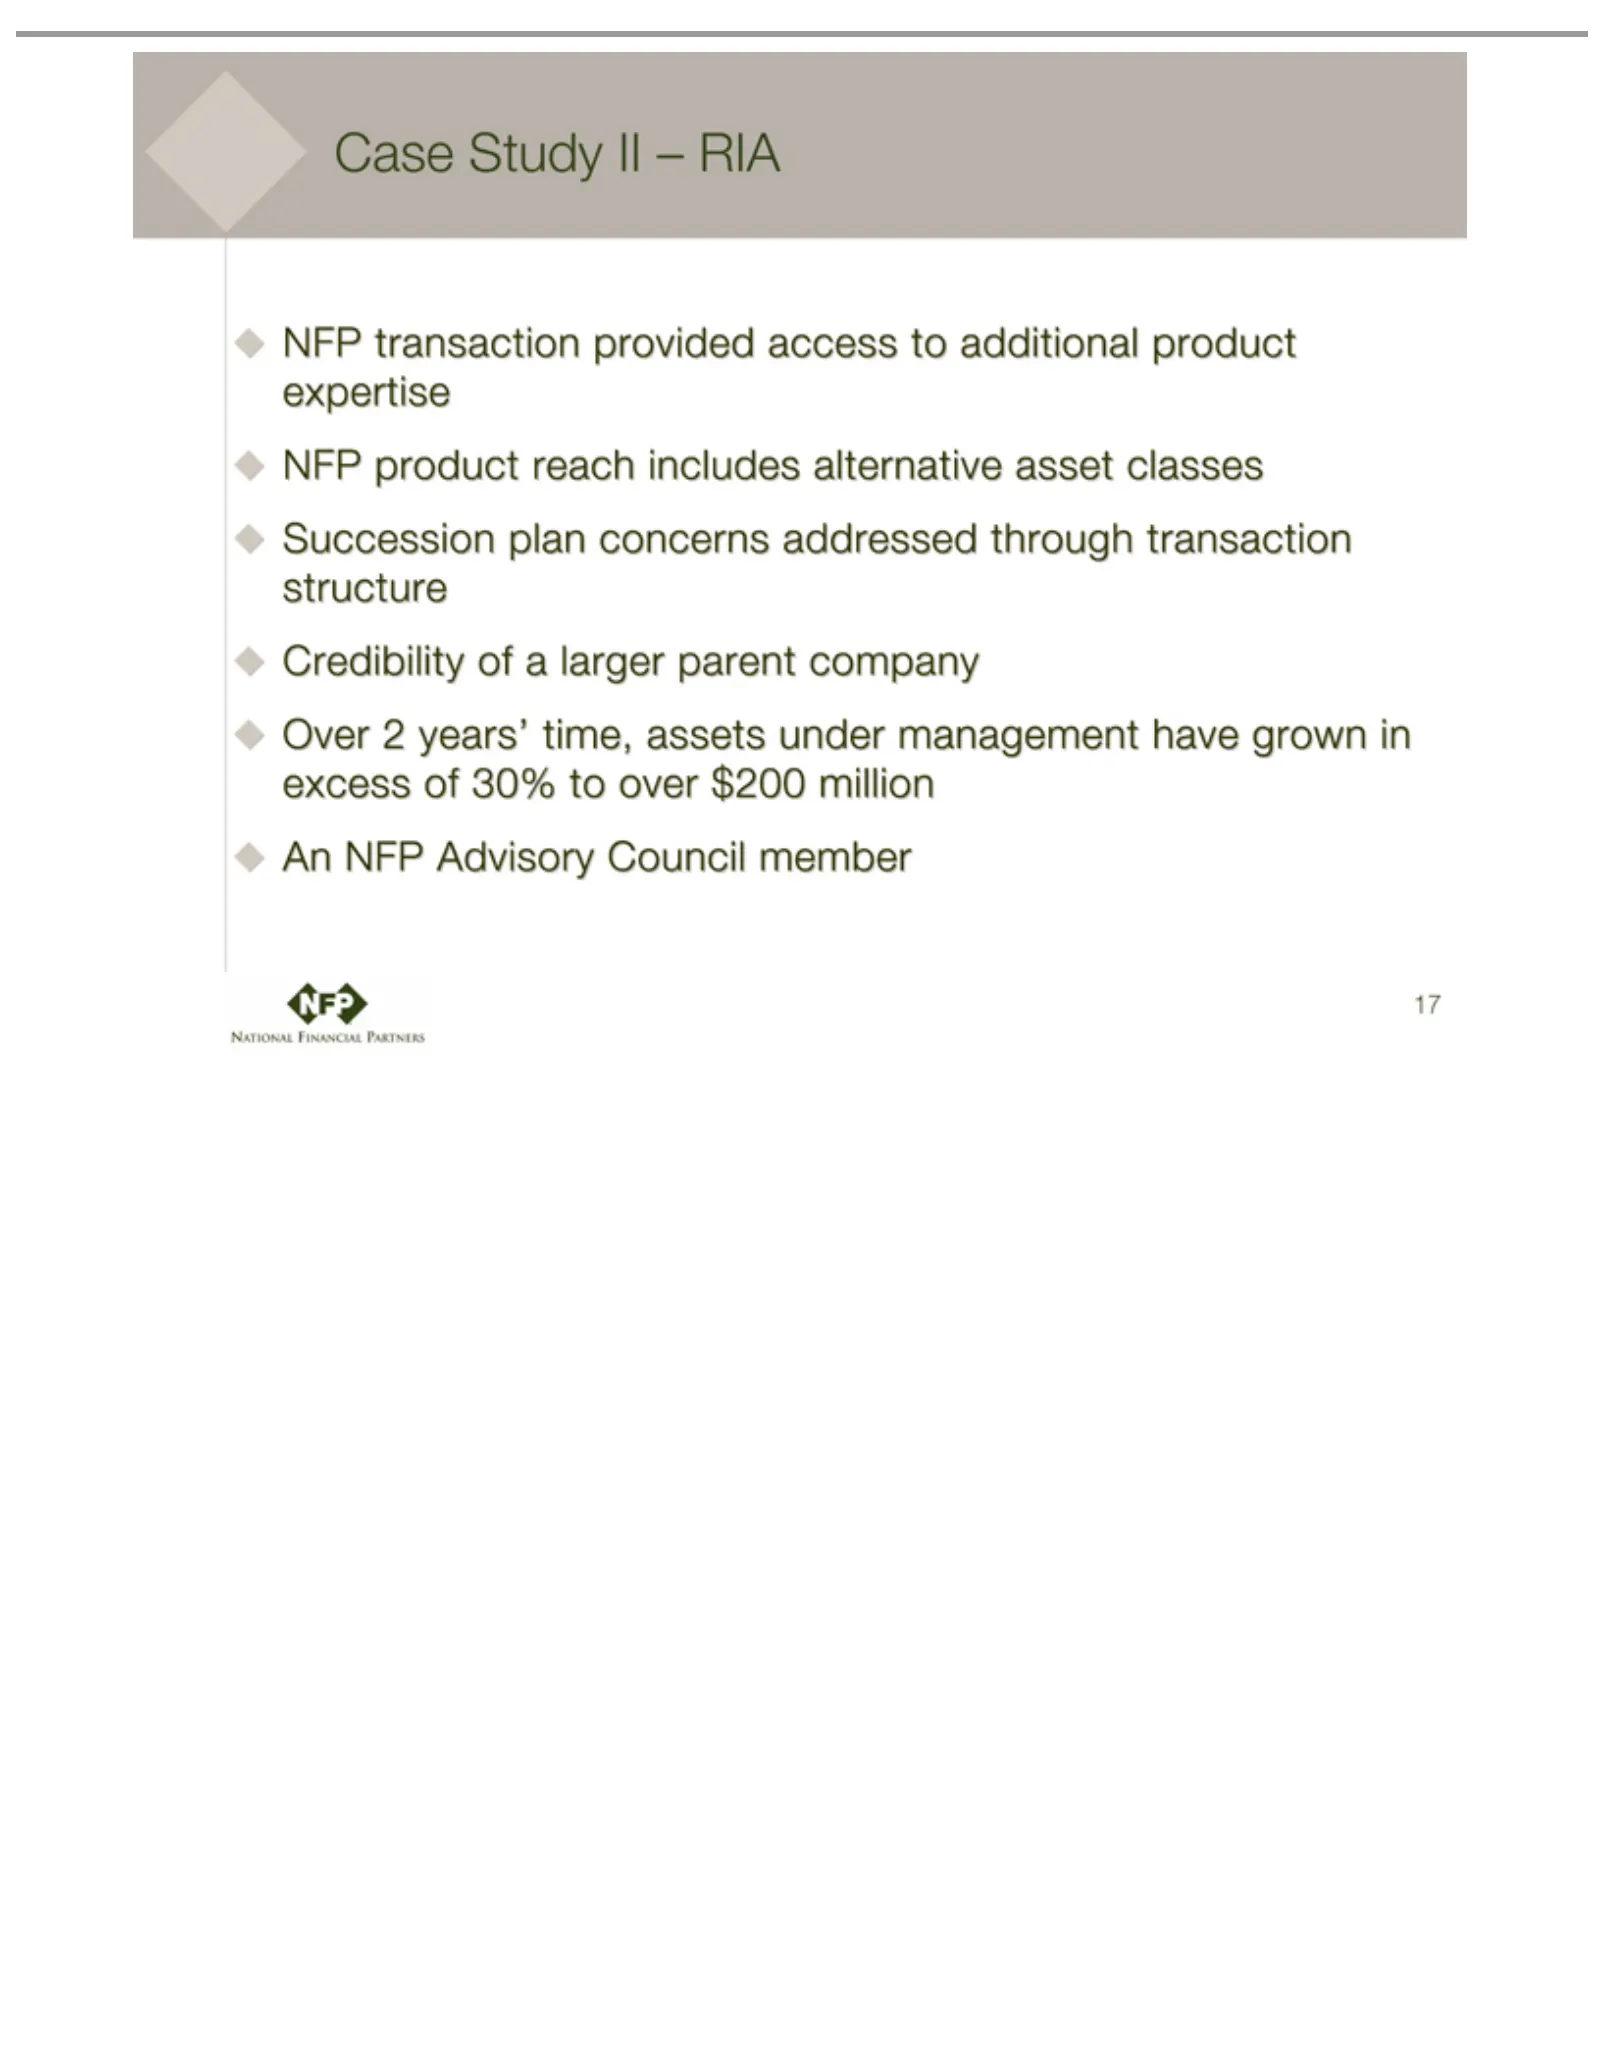
Slide 17: Case Study II: RIA
CaseNFP NFP Succession Credibility Over An 17 transaction product Study 2 years’ Advisory of plan IIreach time, a– larger RIA concerns provided Council includes assets parent addressed under access member alternative company management to additional through asset classes transaction have product gro
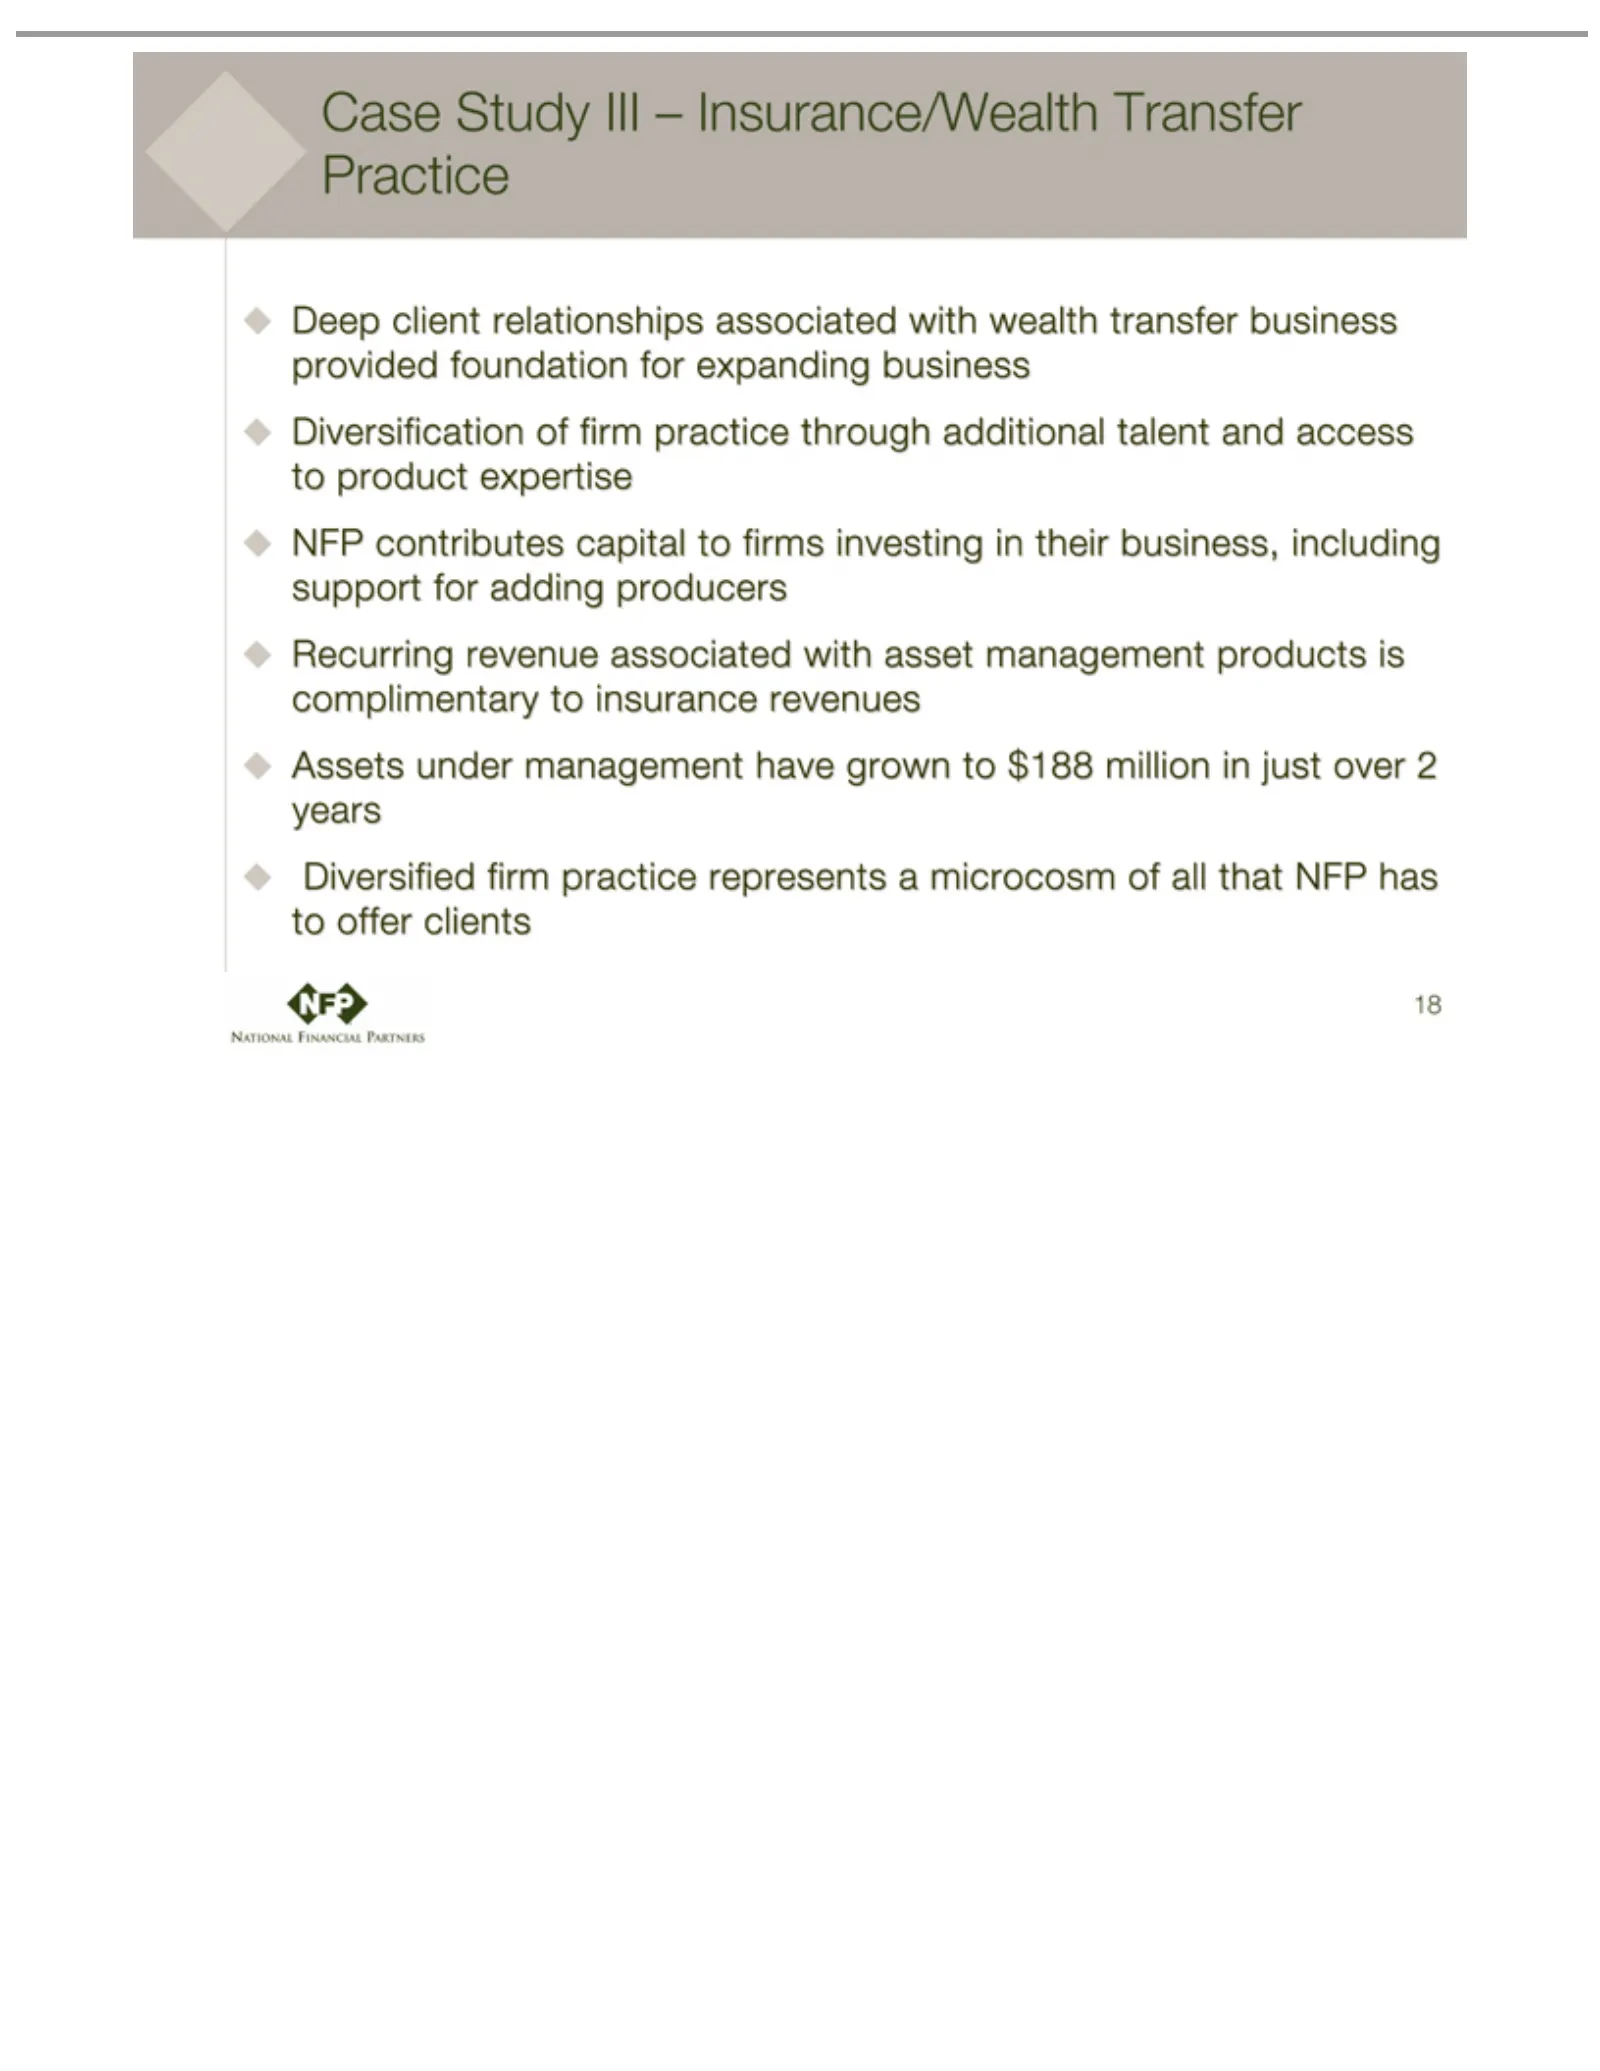
Slide 18: Case Study III: Insurance/Wealth Transfer Practice
Case contributes Deep Diversification NFP Recurring Assets Diversified 18 Study client under revenue firm III relationships management –ofpractice capital Insurance/Wealth firm associated practice torepresents associated firms have with through grown investing Transfer asset awith microcosm toadditi
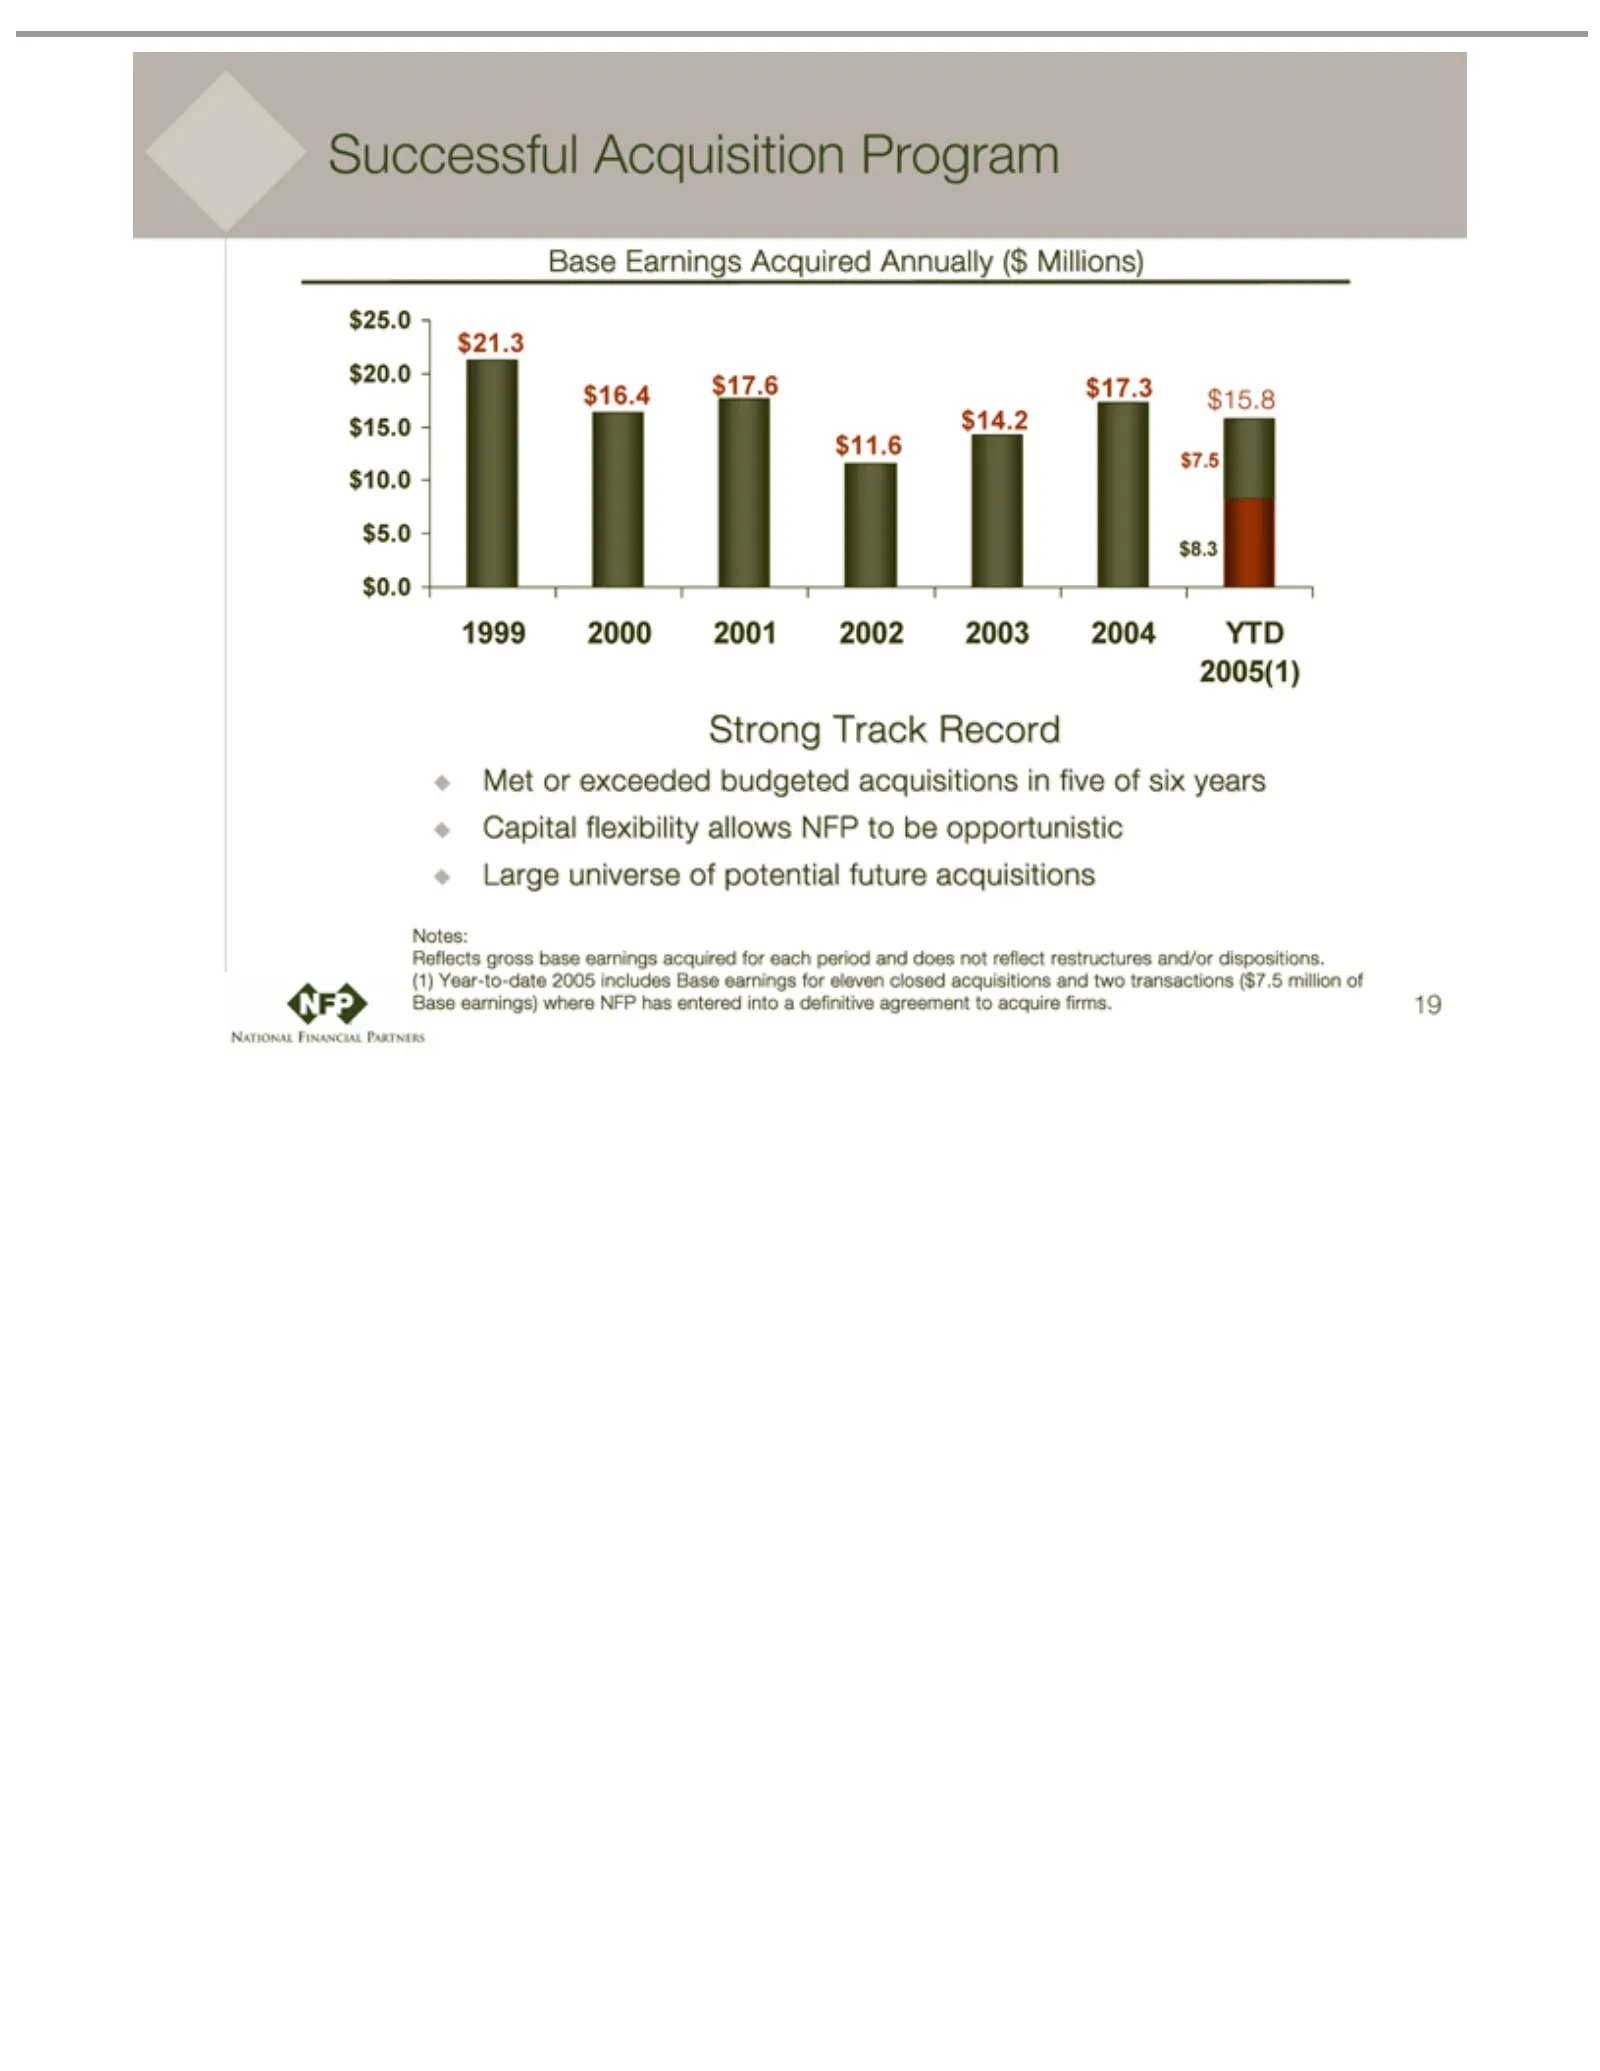
Slide 19: Successful Track Record of Acquisitions
Successful Base 1999 2005(1) Strong $8.3 $7.5 Met Reflects Notes: transactions 19 orEarnings 2000 Track exceeded $21.3 gross Acquisition 2001 ($7.5 Record base $16.4 Acquired 2002 budgeted million earnings $17.6 2003 Program Annually of acquisitions $17.3 2004 acquired Base$15.8 YTD earnings) ($ Mil
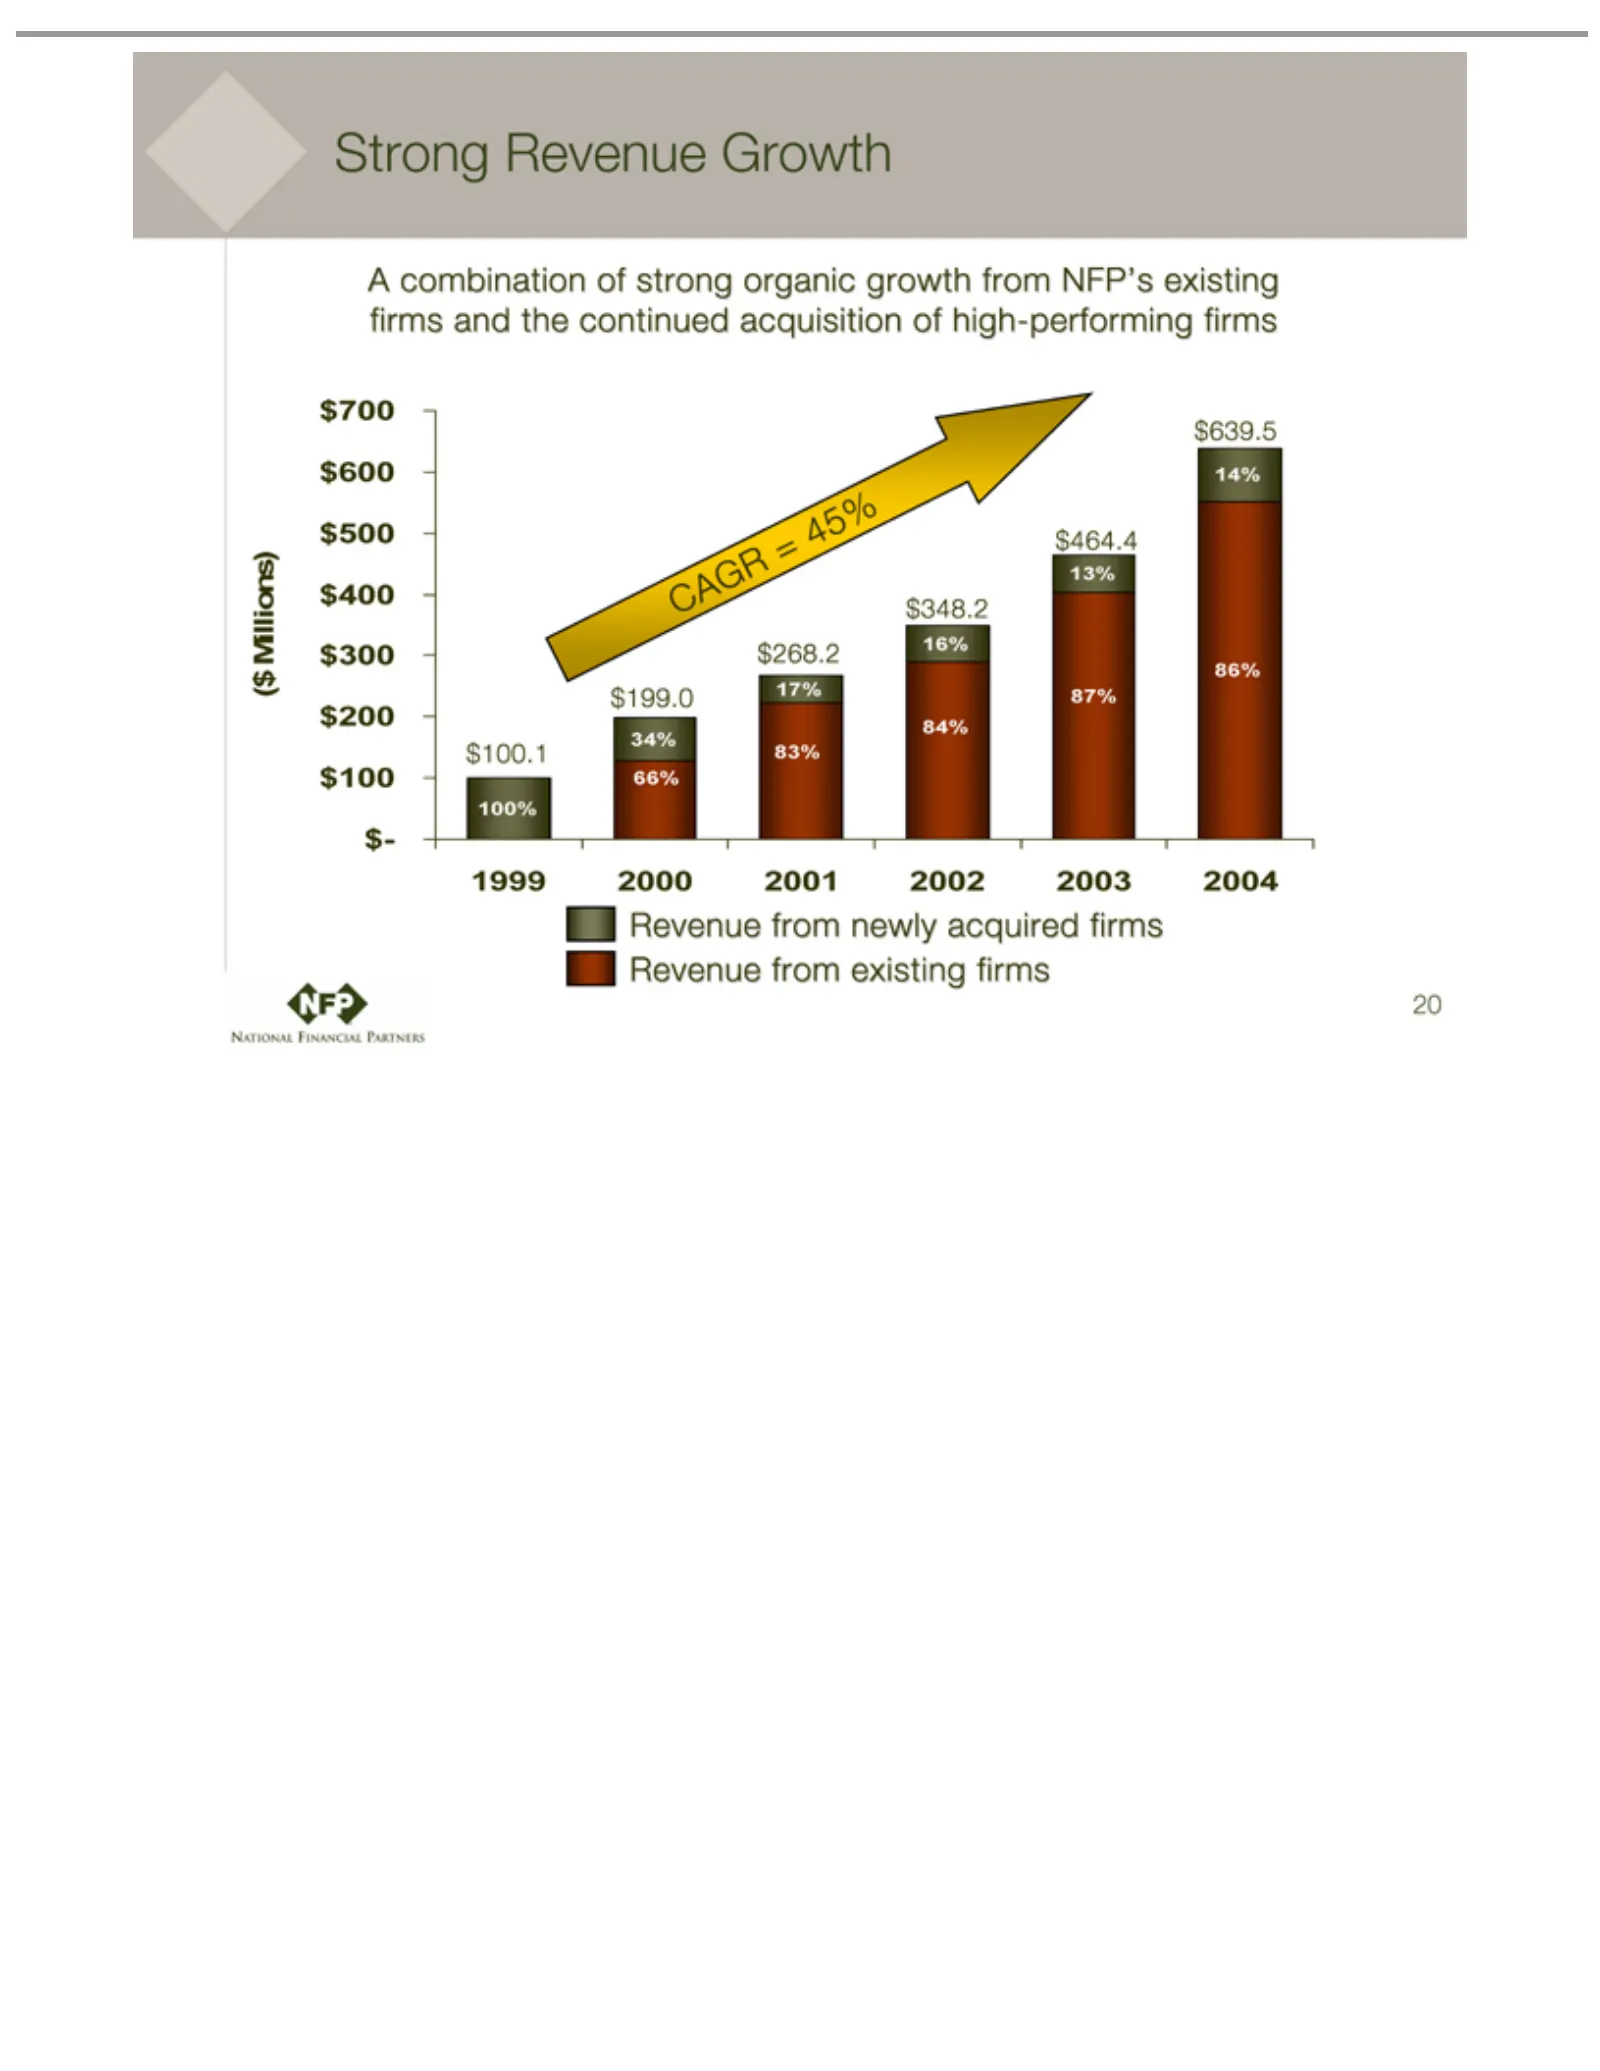
Slide 20: Strong Revenue Growth
Strong A ($ 1999 100% 66% 34% 83% 17% 84% 87% 13% CAGR 86% 14% Revenue 20 combination Millions) $268.2 $348.2 $464.4 $639.5 2000 $199.0 Revenue = from 452001 $700 16% %newly ofGrowth 2002 strong $600acquired 2003 $500 organic 2004 $400 firms growth $100.1 $300 Revenue $200 from from NFP’s $100 exist
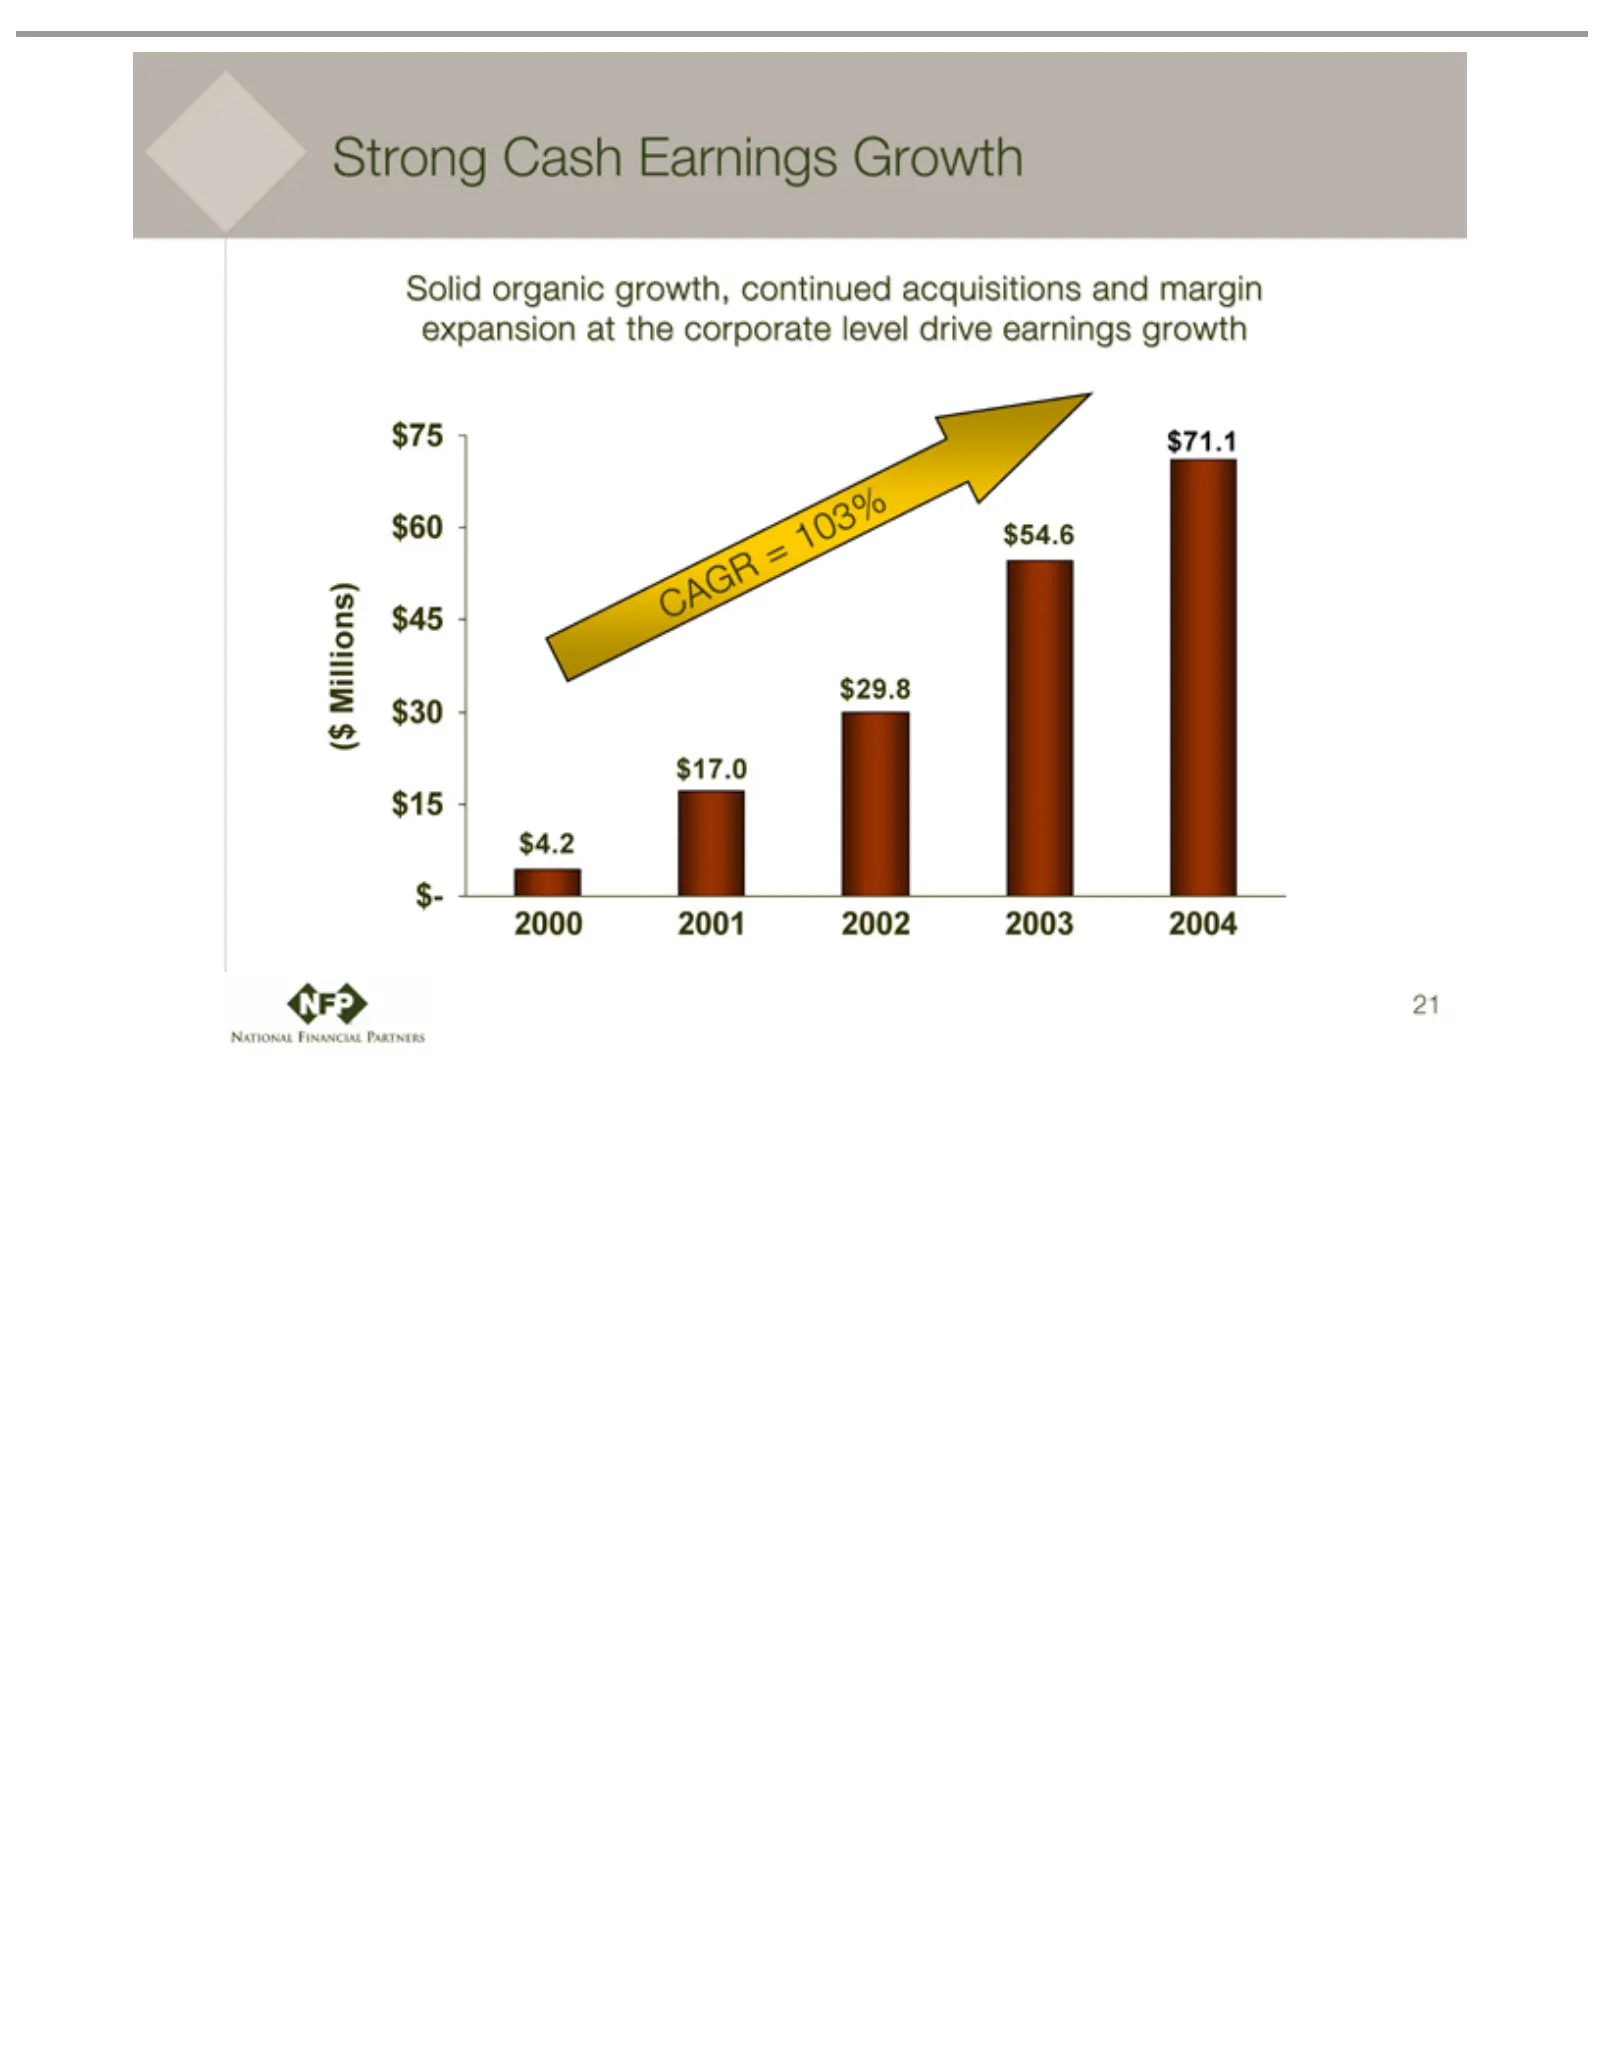
Slide 21: Strong Cash Earnings Growth
Strong Solid ($ CAGR $4.2 2000 21 Millions) $17.0 2001 organic Cash = 103% $29.8 2002 $75 Earnings growth, 2003 $60 $54.6 $45 continued Growth 2004 $71.1 $30 $15acquisitions $- and margin expansion at the corporate level drive earnings growth
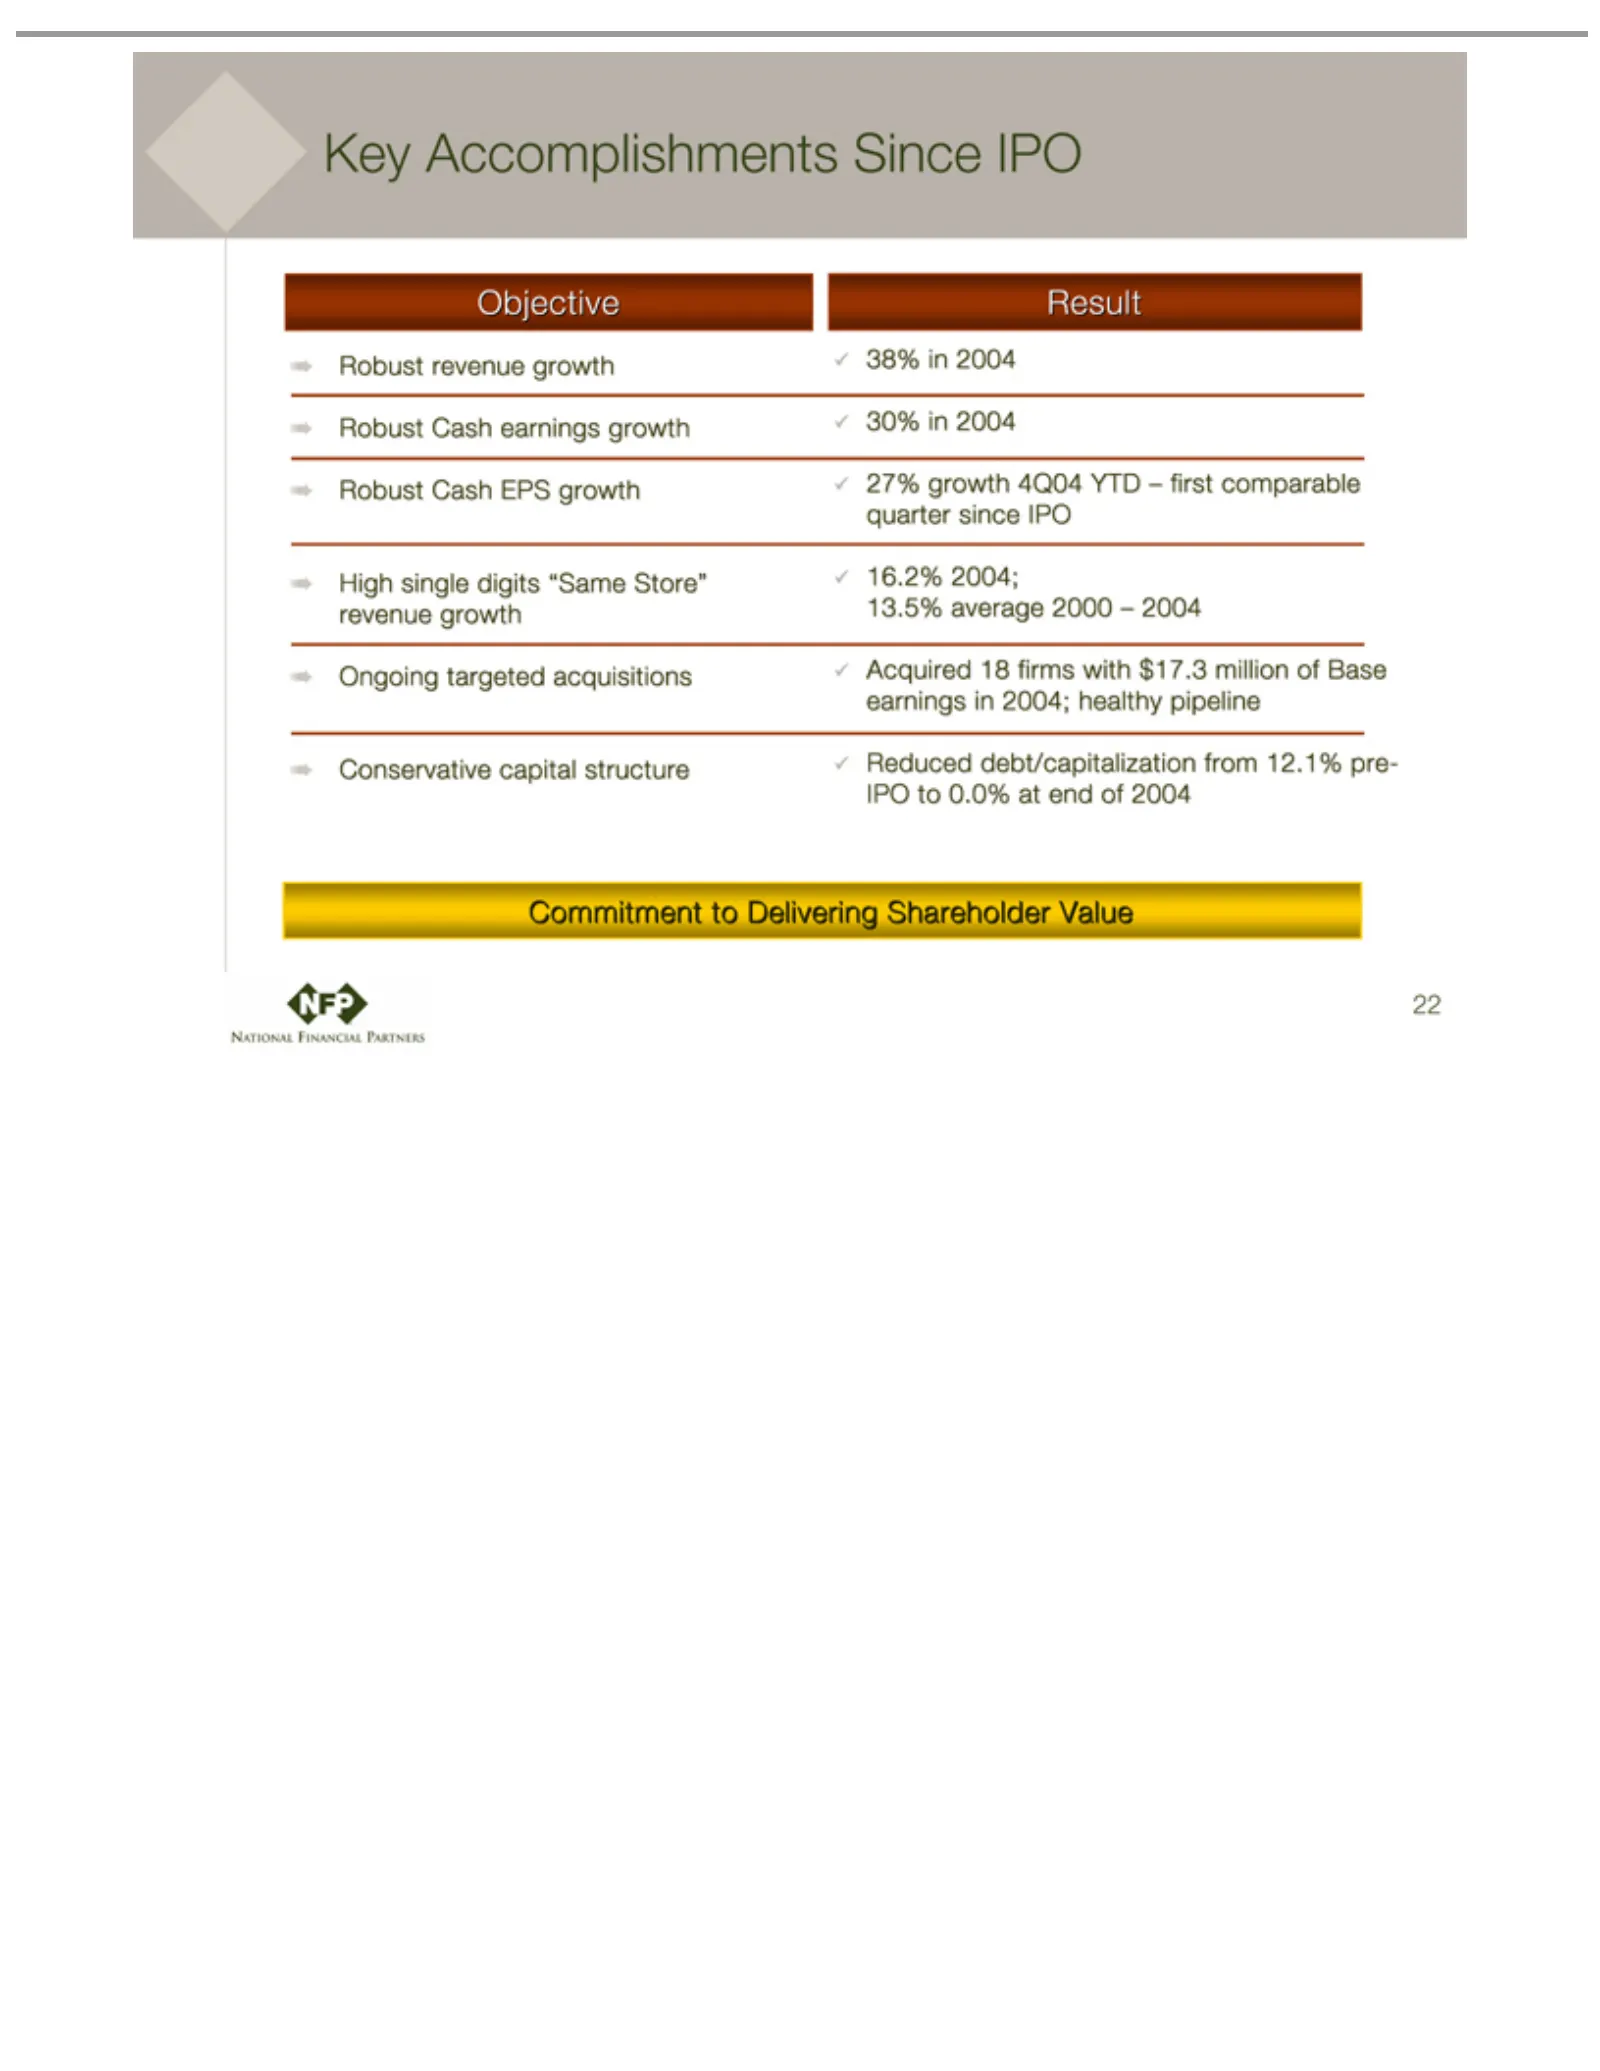
Slide 22: Key Accomplishments
Key Accomplishments Robust Objective High Ongoing Conservative 38% 30% 27% 16.2% 13.5% Acquired Reduced Commitment Result 22 in growth single 2004; average revenue 2004 debt/capitalization targeted 18digits 4Q04 firms capital to2000 growth Delivering acquisitions “Same with YTD –structure 2004 Since

Slide 23: Corporate Headquarters
Corporate Headquarters National Financial Partners 787 7th Avenue, 11th Floor New York, NY 10036 phone 212.301.4000 www.nfp.com
Source: SEC EDGAR · 8-K filed Mar 31, 2005
More decks from National Financial Partners Corp
 Q4 2012 Earnings Presentation19 slides · Feb 15, 2013
 Q3 2012 Earnings Presentation18 slides · Oct 31, 2012
 Q2 2012 Earnings Presentation19 slides · Jul 31, 2012
 Q1 2012 Earnings Presentation19 slides · Apr 27, 2012
 Q4 2011 Earnings Presentation18 slides · Feb 8, 2012
 Q3 2011 Earnings Presentation19 slides · Oct 28, 2011