BNC Bancorp — KBW Community Bank Investor Conference 2012
28 slides from BNC Bancorp's conference presentation, Aug 1, 2012
Slide 1: KBW Community Bank Investor Conference Second Quarter 2012
KBW COMMUNITY BANK INVESTOR CONFERENCE SECOND QUARTER 2012
Slide 2: Forward-looking statements
This presentation contains forward - looking statements relating to the financial condition, results of operations and business of BNC Bancorp and its subsidiary Bank of North Carolina . These forward - looking statements involve risks and uncertainties and are based on the beliefs and assumptions o
Slide 3: Investment highlights
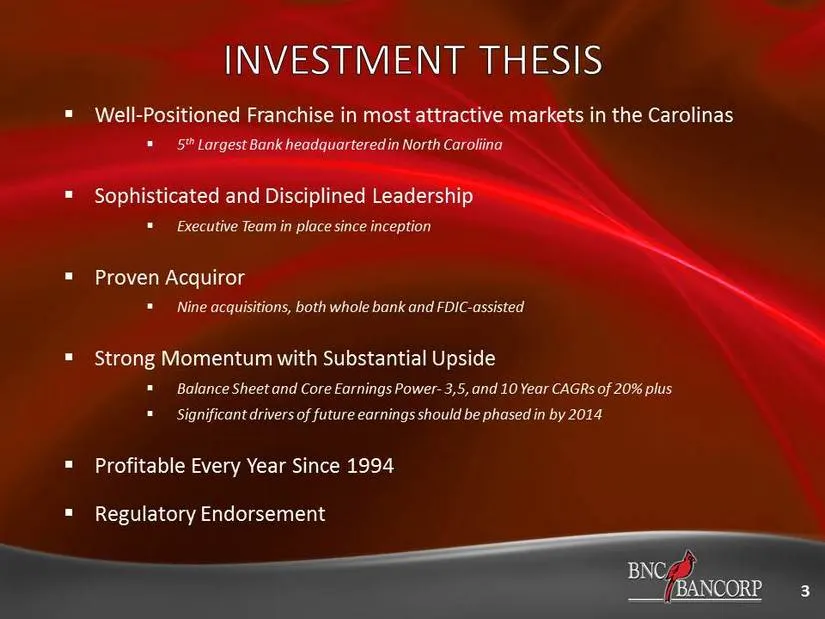
▪ Well - Positioned Franchise in most attractive markets in the Carolinas ▪ 5 th Largest Bank headquartered in North Caroliina ▪ Sophisticated and Disciplined Leadership ▪ Executive Team in place since inception ▪ Proven Acquiror ▪ Nine acquisitions, both whole bank and FDIC - assisted ▪ Strong Mome
Slide 4: Carolinas county footprint
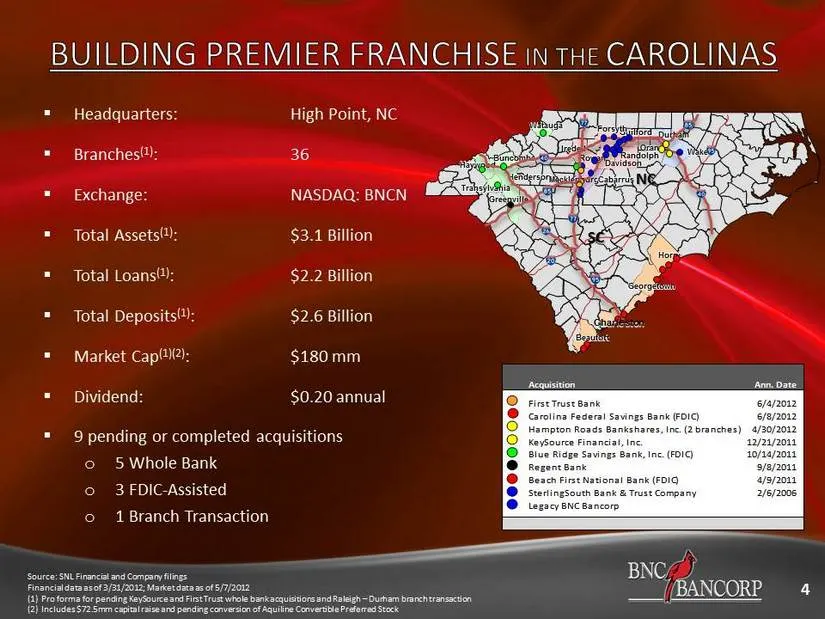
4 Greenville Greenville Greenville Greenville Greenville Greenville Greenville Greenville Greenville Haywood Haywood Haywood Haywood Haywood Haywood Haywood Haywood Haywood Buncombe Buncombe Buncombe Buncombe Buncombe Buncombe Buncombe Buncombe Buncombe Transylvania Transylvania Transylvania Transyl
Slide 5: Acquisition summary
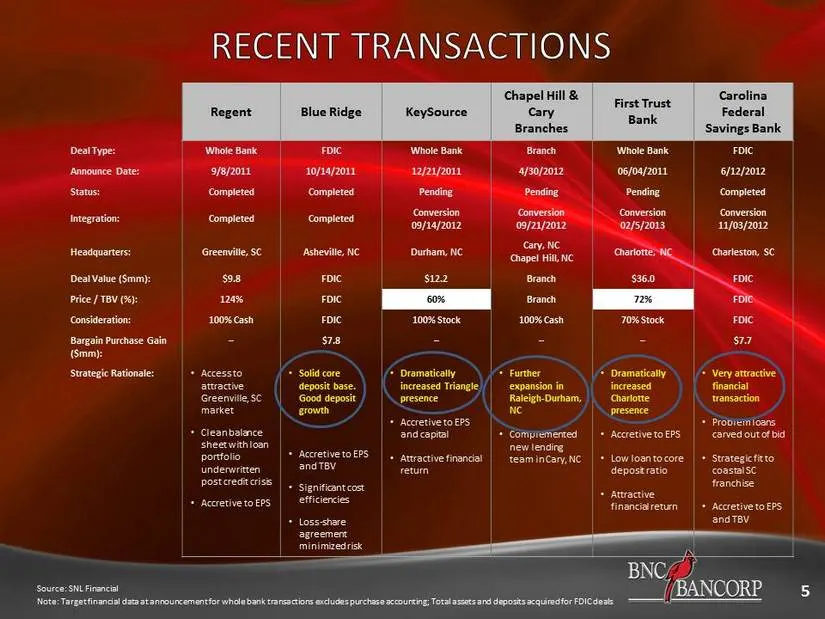
5 Regent Blue Ridge KeySource Chapel Hill & Cary Branches First Trust Bank Carolina Federal Savings Bank Deal Type: Whole Bank FDIC Whole Bank Branch Whole Bank FDIC Announce Date: 9/8/2011 10/14/2011 12/21/2011 4/30/2012 06/04/2011 6/12/2012 Status: Completed Completed Pending Pending Pending Compl
Slide 6: Pro forma franchise map
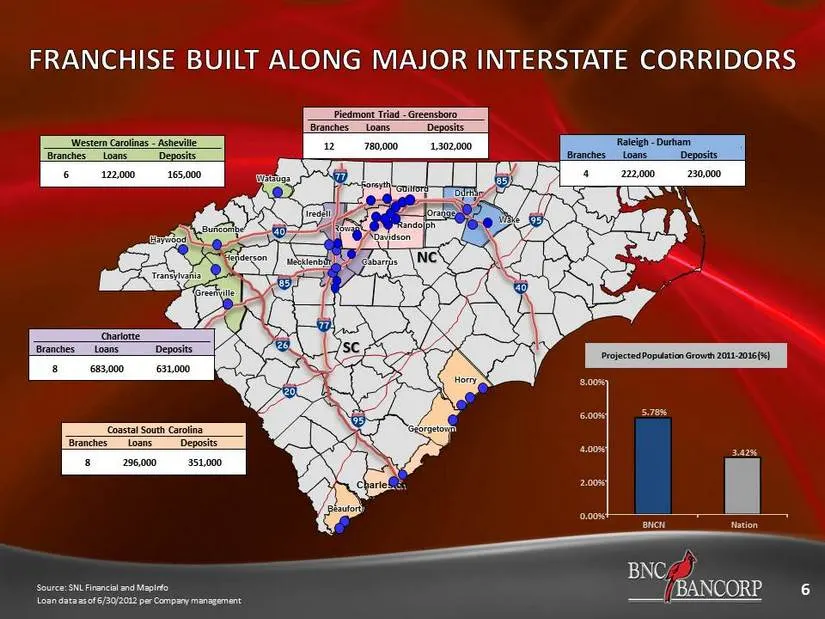
Greenville Greenville Greenville Greenville Greenville Greenville Greenville Greenville Greenville Haywood Haywood Haywood Haywood Haywood Haywood Haywood Haywood Haywood Buncombe Buncombe Buncombe Buncombe Buncombe Buncombe Buncombe Buncombe Buncombe Transylvania Transylvania Transylvania Transylva
Slide 7: Regions complement and create a balanced franchise
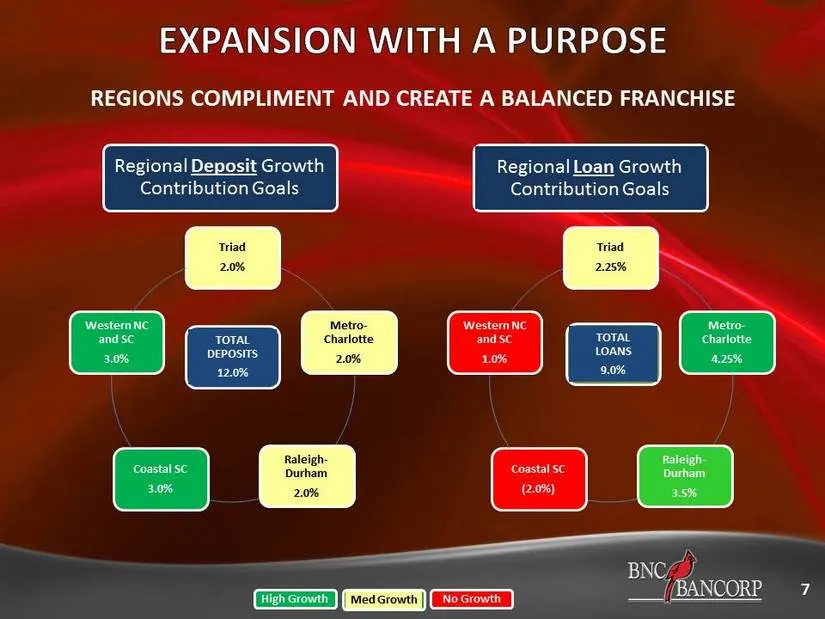
7 Triad 2.0% Metro - Charlotte 2.0% Raleigh - Durham 2.0% Coastal SC 3.0% Western NC and SC 3.0% Triad 2.25% Metro - Charlotte 4.25% Raleigh - Durham 3.5% Coastal SC (2.0%) Western NC and SC 1.0% TOTAL DEPOSITS 12.0% TOTAL LOANS 9.0% Regional Deposit Growth Contribution Goals Regional Loan Growth Co
Slide 8: Deposit market share in counties of operation
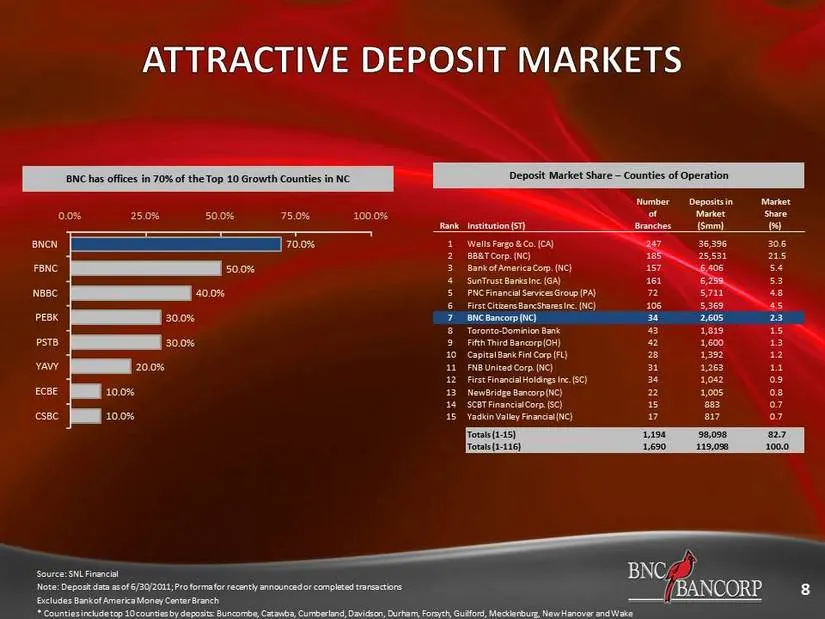
8 Source: SNL Financial Note: Deposit data as of 6/30/2011; Pro forma for recently announced or completed transactions Excludes Bank of America Money Center Branch * Counties include top 10 counties by deposits: Buncombe, Catawba, Cumberland, Davidson, Durham, Forsyth, Guilford, Mecklenbu rg, New Ha
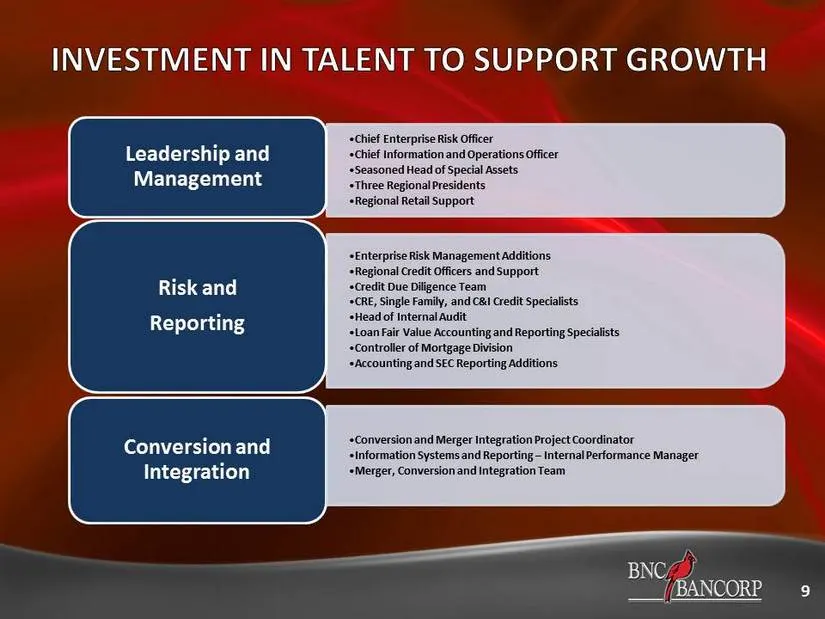
Slide 9: Management and infrastructure additions
9 • Chief Enterprise Risk Officer • Chief Information and Operations Officer • Seasoned Head of Special Assets • Three Regional Presidents • Regional Retail Support Conversion and Integration • Enterprise Risk Management Additions • Regional Credit Officers and Support • Credit Due Diligence Team •
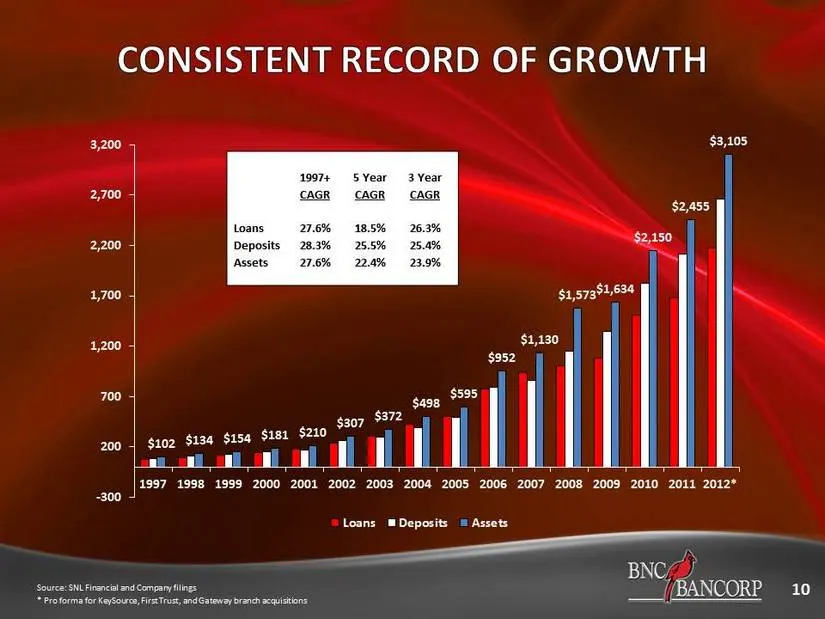
Slide 10: Loans, deposits and assets growth
10 $102 $134 $154 $181 $210 $307 $372 $498 $595 $952 $1,130 $1,573 $1,634 $2,150 $2,455 $3,105 -300 200 700 1,200 1,700 2,200 2,700 3,200 1997 1998 1999 2000 2001 2002 2003 2004 2005 2006 2007 2008 2009 2010 2011 2012* Loans Deposits Assets Source: SNL Financial and Company filings * Pro forma for K
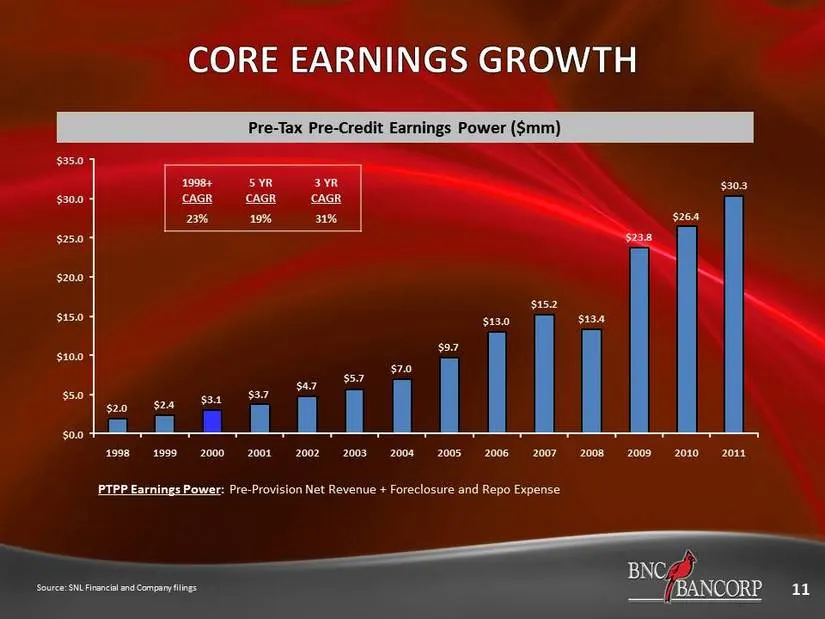
Slide 11: Pre-tax pre-credit earnings power
PTPP Earnings Power : Pre - Provision Net Revenue + Foreclosure and Repo Expense 1998+ 5 YR 3 YR CAGR CAGR CAGR 23% 19% 31% 11 Pre - Tax Pre - Credit Earnings Power ($mm) Source: SNL Financial and Company filings $2.0 $2.4 $3.1 $3.7 $4.7 $5.7 $7.0 $9.7 $13.0 $15.2 $13.4 $23.8 $26.4 $30.3 $0.0 $5.0 $
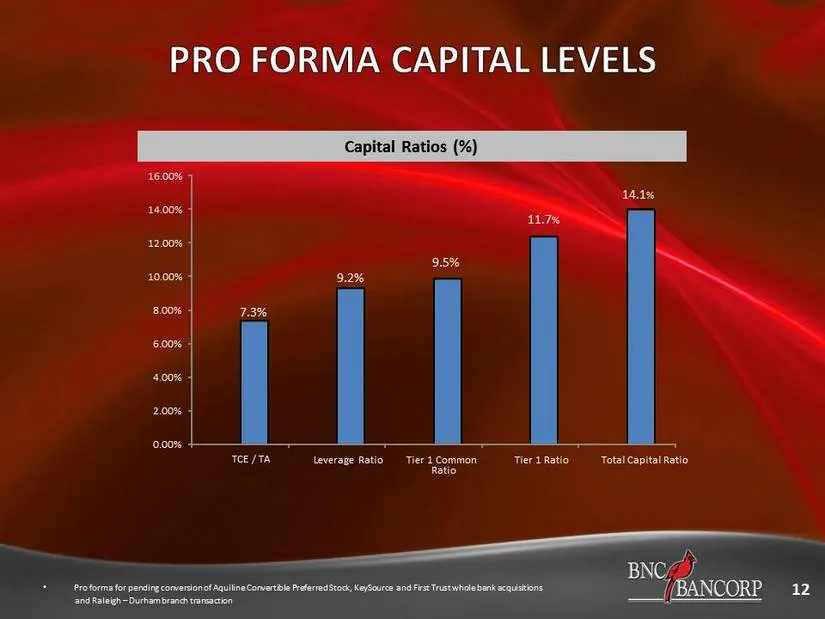
Slide 12: Capital ratios
12 Capital Ratios (%) • Pro forma for pending conversion of Aquiline Convertible Preferred Stock, KeySource and First Trust whole bank acquisitions and Raleigh – Durham branch transaction 7.3 % 9 .2% 9.5% 11.7 % 14.1 % 0.00% 2.00% 4.00% 6.00% 8.00% 10.00% 12.00% 14.00% 16.00% TCE / TA Leverage Ratio
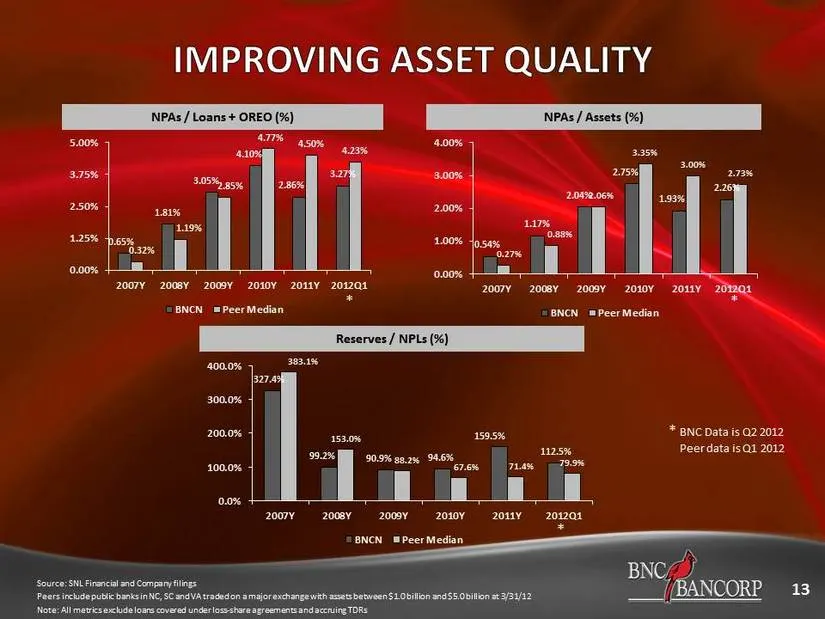
Slide 13: Asset quality versus peers
0.65% 1.81% 3.05% 4.10% 2.86% 3.27% 0.32% 1.19% 2.85% 4.77% 4.50% 4.23% 0.00% 1.25% 2.50% 3.75% 5.00% 2007Y 2008Y 2009Y 2010Y 2011Y 2012Q1 BNCN Peer Median 327.4% 99.2% 90.9% 94.6% 159.5% 112.5% 383.1% 153.0% 88.2% 67.6% 71.4% 79.9% 0.0% 100.0% 200.0% 300.0% 400.0% 2007Y 2008Y 2009Y 2010Y 2011Y 2012
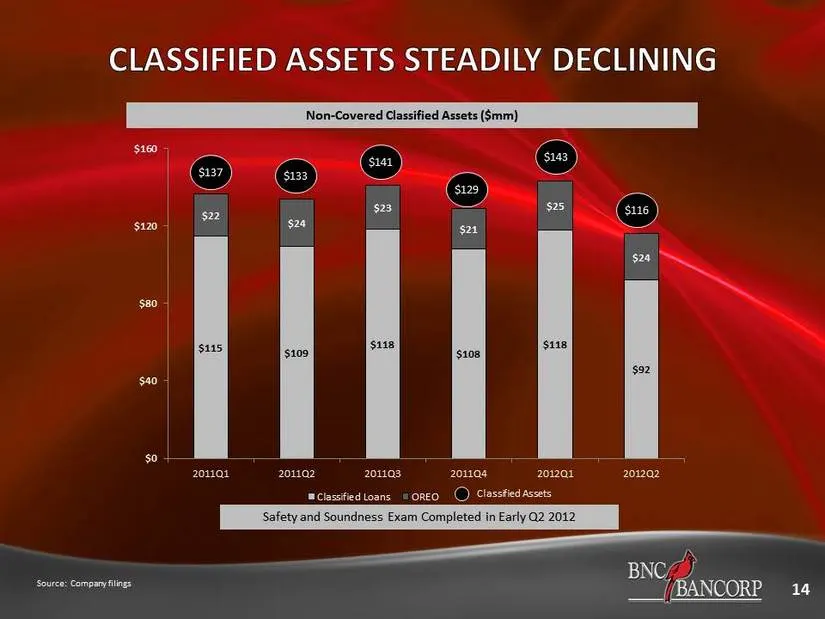
Slide 14: Non-covered classified assets
$115 $109 $118 $108 $118 $92 $22 $24 $23 $21 $25 $24 $0 $40 $80 $120 $160 2011Q1 2011Q2 2011Q3 2011Q4 2012Q1 2012Q2 Classified Loans OREO 14 Source: Company filings Non - Covered Classified Assets ($mm) Classified Assets $143 $129 $141 $137 $116 $133 Safety and Soundness Exam Completed in Early Q2 2
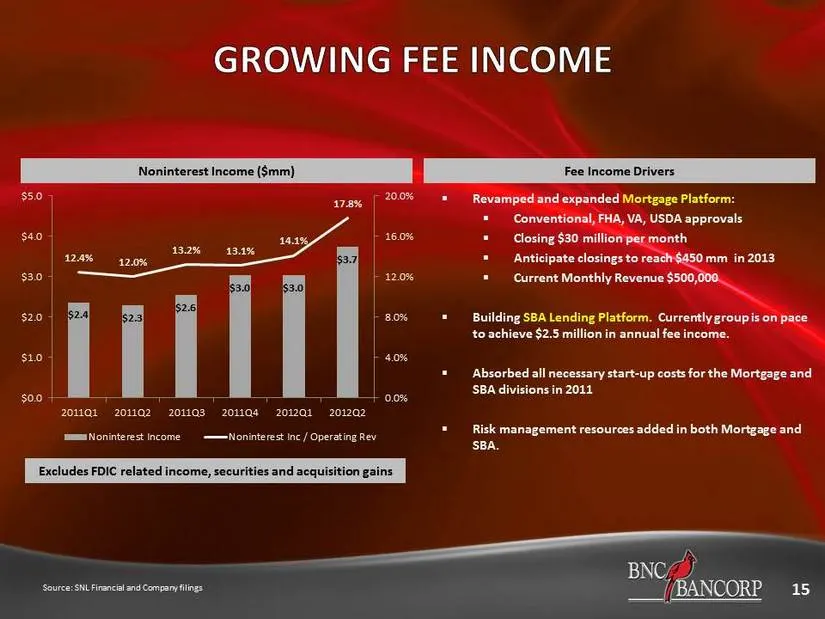
Slide 15: Noninterest income and fee income drivers
15 Source: SNL Financial and Company filings Noninterest Income ($mm) ▪ Revamped and expanded Mortgage Platform : ▪ Conventional, FHA, VA, USDA approvals ▪ Closing $30 million per month ▪ Anticipate closings to reach $450 mm in 2013 ▪ Current Monthly Revenue $500,000 ▪ Building SBA Lending Platform

Slide 16: Appendix — Financial
APPENDIX — FINANCIAL oe
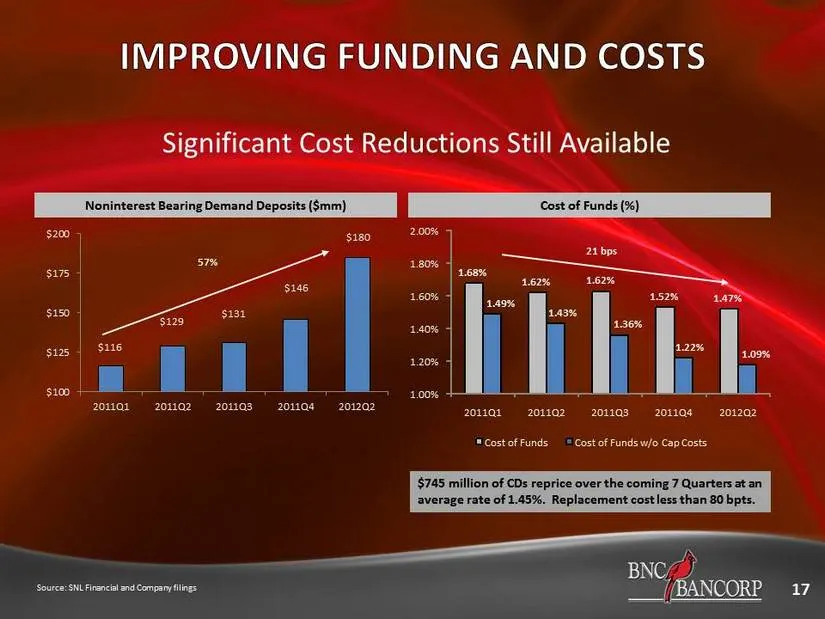
Slide 17: Cost of funds and noninterest bearing deposits
17 Cost of Funds (%) Noninterest Bearing Demand Deposits ($mm) $116 $129 $131 $146 $ 180 $100 $125 $150 $175 $200 2011Q1 2011Q2 2011Q3 2011Q4 2012Q2 57% 21 bps Source: SNL Financial and Company filings 1.68% 1.62% 1.62% 1.52% 1.47% 1.49% 1.43% 1.36% 1.22% 1.09% 1.00% 1.20% 1.40% 1.60% 1.80% 2.00% 20
Slide 18: Key future earnings drivers
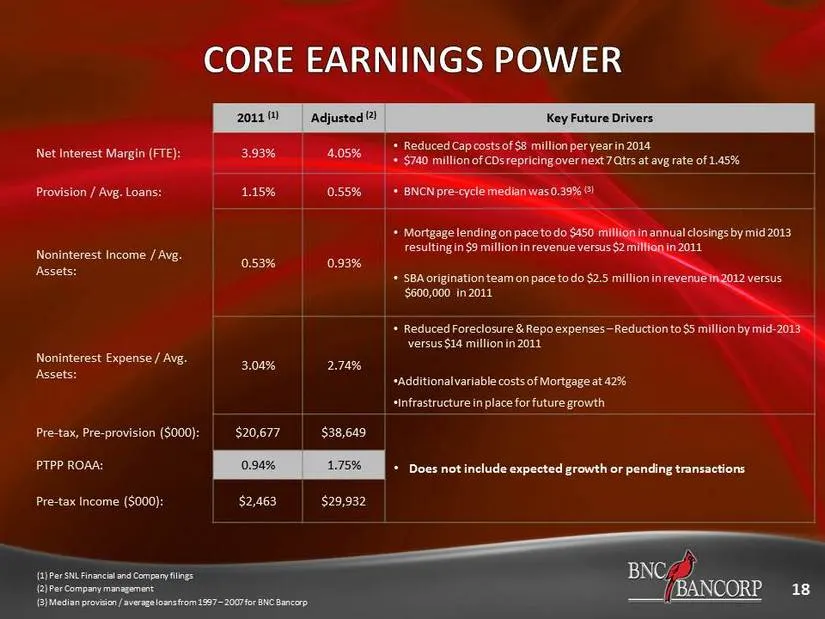
18 2011 (1) Adjusted (2) Key Future Drivers Net Interest Margin (FTE): 3.93% 4.05% • Reduced Cap costs of $8 million per year in 2014 • $740 million of CDs repricing over next 7 Qtrs at avg rate of 1.45% Provision / Avg. Loans: 1.15% 0.55% • BNCN pre - cycle median was 0.39% (3) Non interest Income
Slide 19: Loan portfolio composition
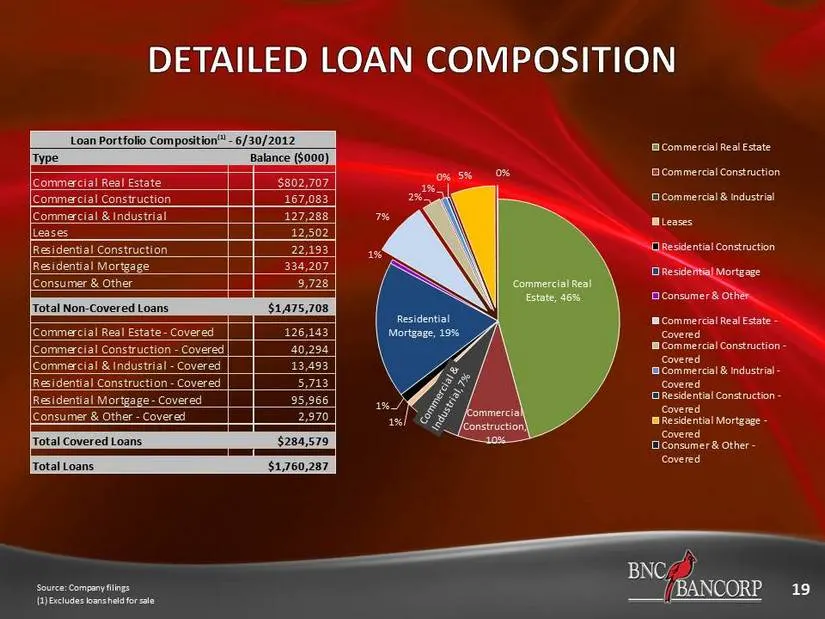
19 Source: Company filings (1) Ex cludes loans held for sale Commercial Real Estate, 46% Commercial Construction, 10% 1% 1% Residential Mortgage, 19% 1% 7% 2% 1% 0% 5% 0% Commercial Real Estate Commercial Construction Commercial & Industrial Leases Residential Construction Residential Mortgage Consu
Slide 20: Non-owner occupied CRE portfolio
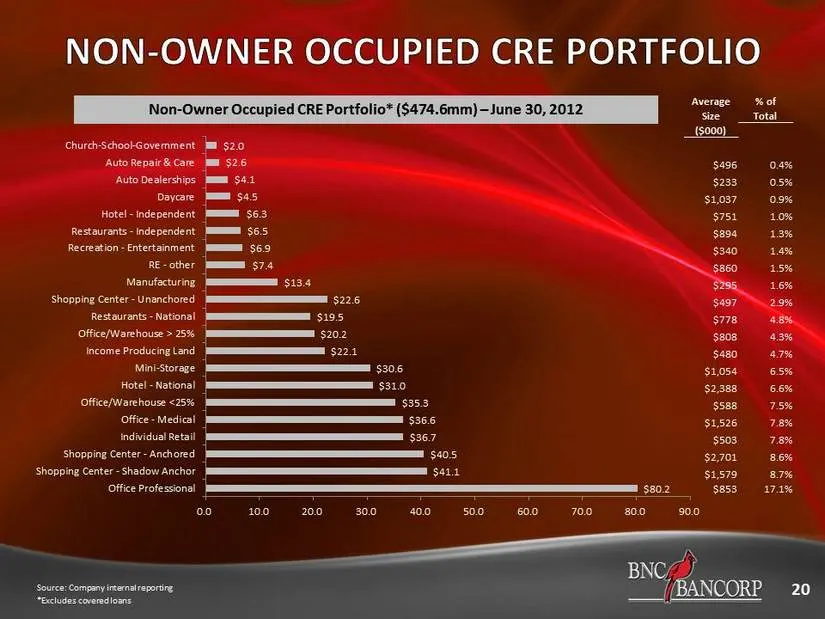
20 Source: Company internal reporting *Excludes covered loans Non - Owner Occupied CRE Portfolio* ($474.6mm) – June 30, 2012 $80.2 $41.1 $40.5 $36.7 $36.6 $35.3 $31.0 $30.6 $22.1 $20.2 $19.5 $22.6 $13.4 $7.4 $6.9 $6.5 $6.3 $4.5 $4.1 $2.6 $2.0 0.0 10.0 20.0 30.0 40.0 50.0 60.0 70.0 80.0 90.0 Office P
Slide 21: Construction and development and NPAs
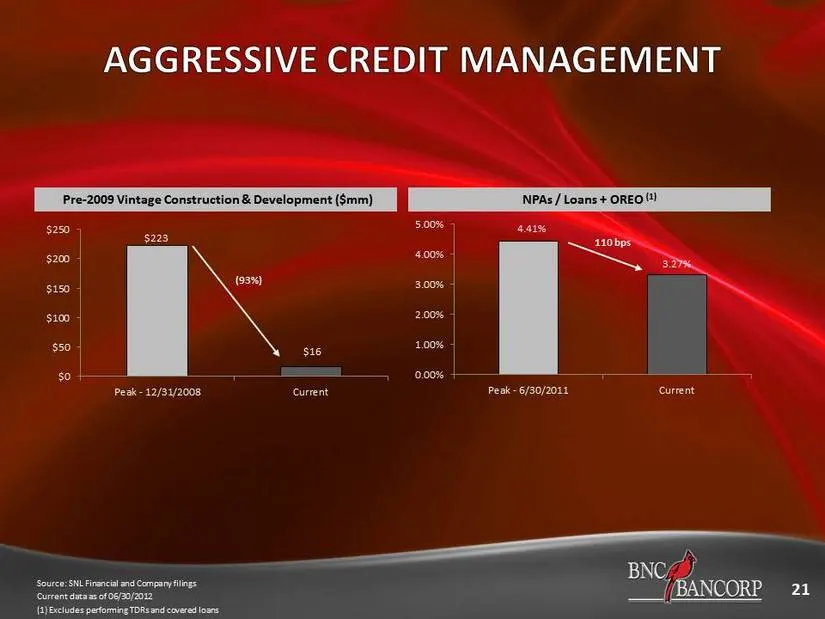
21 $223 $16 $0 $50 $100 $150 $200 $250 Peak - 12/31/2008 Current 4.41% 3.27% 0.00% 1.00% 2.00% 3.00% 4.00% 5.00% Peak - 6/30/2011 Current NPAs / Loans + OREO (1) Pre - 2009 Vintage Construction & Development ($mm) (93%) 110 bps Source: SNL Financial and Company filings Current data as of 06/30/ 2012
Slide 22: North Carolina employment gains
22 Employment gains are now broad - based, with jobs added to every major industry over the past year. The increased pace of hiring in North Carolina will support further income gains in the state over the course of the current year. Some of the recent manufacturing sector expansions around the stat
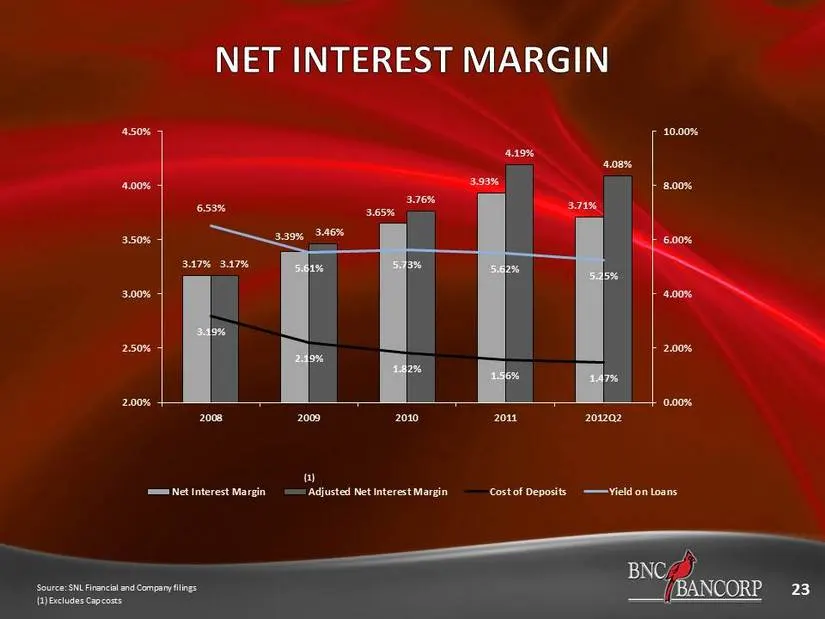
Slide 23: Net interest margin, cost of deposits and loan yield
3.17% 3.39% 3.65% 3.93% 3.71% 3.17% 3.46% 3.76% 4.19% 4.08% 3.19% 2.19% 1.82% 1.56% 1.47% 6.53% 5.61% 5.73% 5.62% 5.25% 0.00% 2.00% 4.00% 6.00% 8.00% 10.00% 2.00% 2.50% 3.00% 3.50% 4.00% 4.50% 2008 2009 2010 2011 2012Q2 Net Interest Margin Adjusted Net Interest Margin Cost of Deposits Yield on Loans
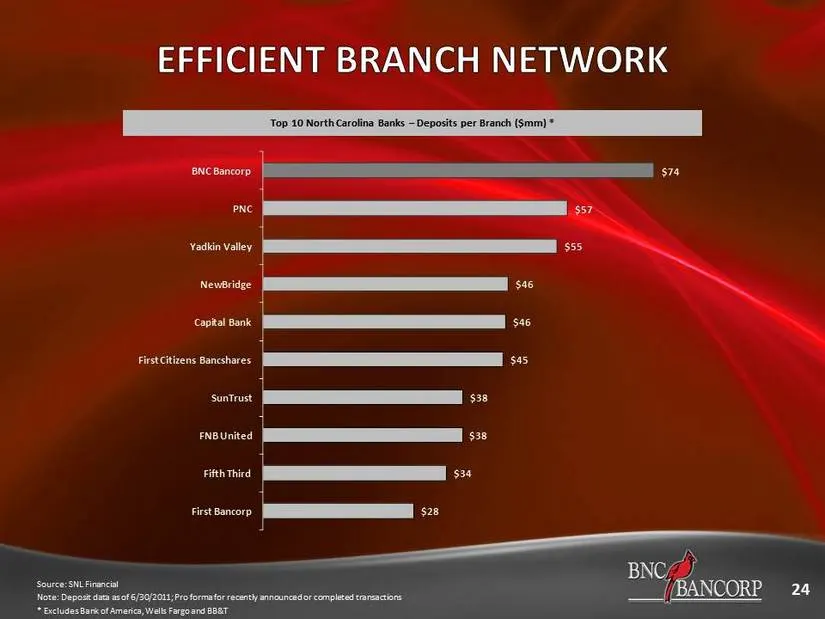
Slide 24: Top 10 North Carolina banks deposits per branch
24 Source: SNL Financial Note: Deposit data as of 6/30/2011; Pro forma for recently announced or completed transactions * Excludes Bank of America, Wells Fargo and BB&T $28 $34 $38 $38 $45 $46 $46 $55 $57 $74 First Bancorp Fifth Third FNB United SunTrust First Citizens Bancshares Capital Bank NewBri
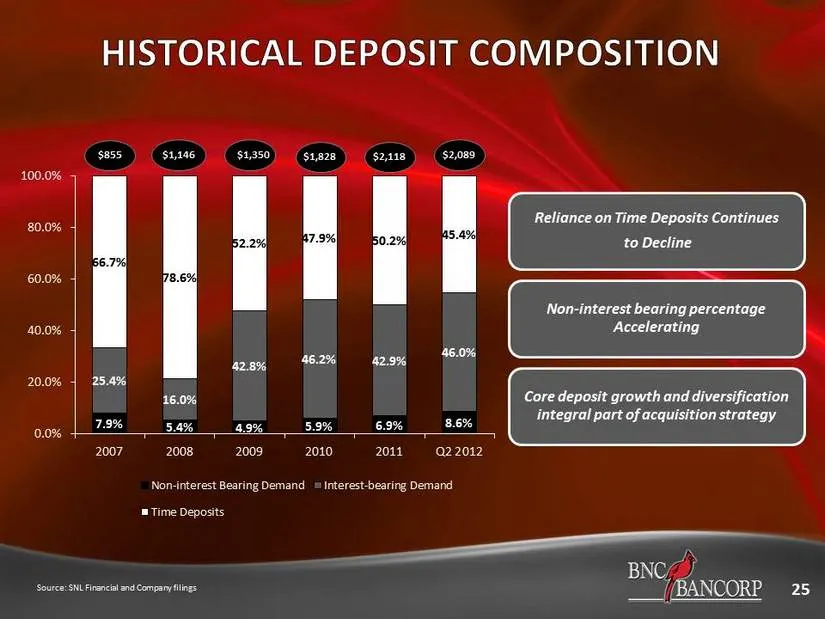
Slide 25: Deposit mix and core deposit growth
25 $1,146 $855 Source: SNL Financial and Company filings $2,089 $1,350 $1,828 $2,118 Reliance on Time Deposits Continues to Decline Non - interest bearing percentage Accelerating Core deposit growth and diversification integral part of acquisition strategy 7.9% 5.4% 4.9% 5.9% 6.9% 8.6% 25.4% 16.0% 4
Slide 26: Securities portfolio
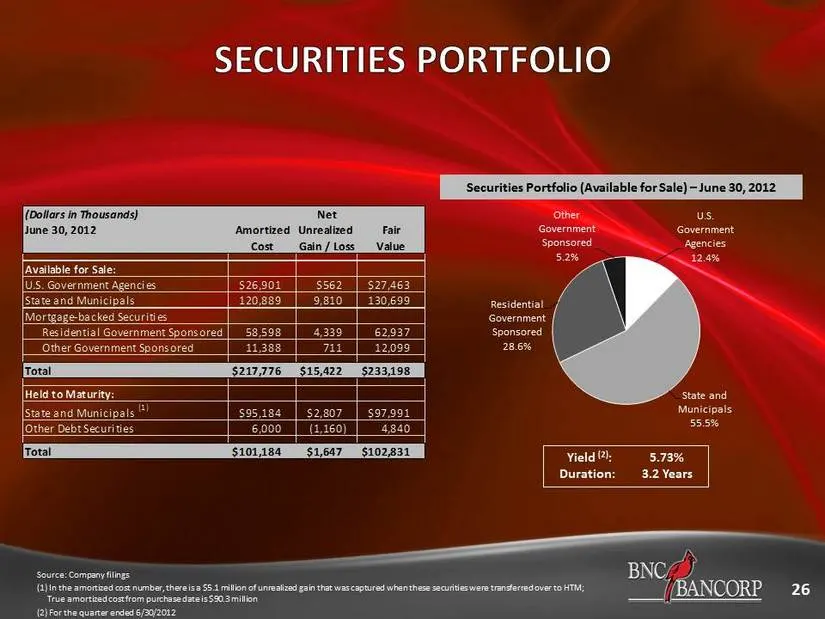
26 Source: Company filings (1) In the amortized cost number, there is a $5.1 million of unrealized gain that was captured when these securities were tra nsf erred over to HTM; True amortized cost from purchase date is $90.3 million (2) For the quarter ended 6/30/ 2012 Securities Portfolio (Available
Slide 27: Leverage trade strategy
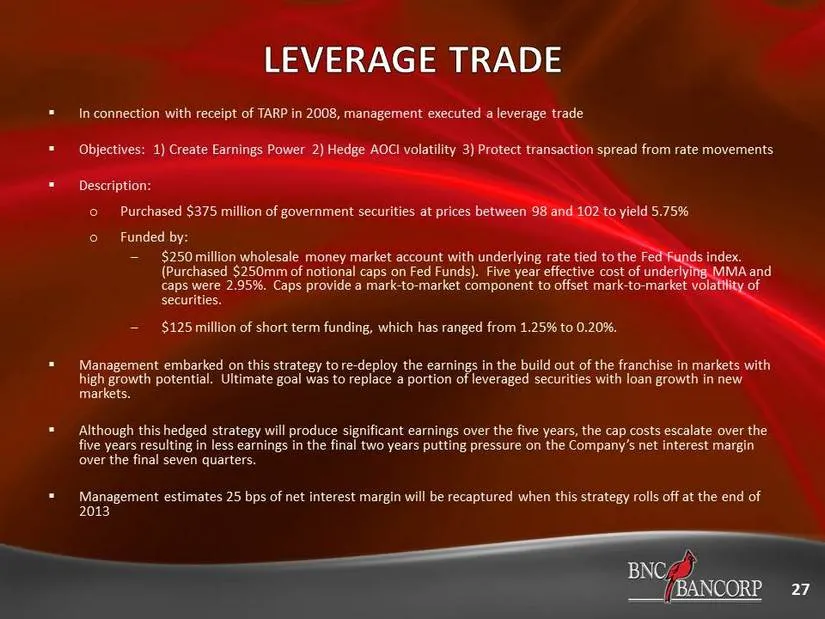
27 ▪ In connection with receipt of TARP in 2008, management executed a leverage trade ▪ Objectives: 1) Create Earnings Power 2) Hedge AOCI volatility 3) Protect transaction spread from rate movements ▪ Description: o Purchased $375 million of government securities at prices between 98 and 102 to yie

Slide 28
Source: SEC EDGAR · 8-K filed Aug 1, 2012
More decks from BNC Bancorp
 Merger or Acquisition (January 2017)37 slides · Jan 23, 2017
 Stephens Inc. Carolinas Roadshow - Charlotte November 201637 slides · Nov 8, 2016
 IPO Roadshow (July 2016)28 slides · Jul 20, 2016
 2016 Gulf South Bank Conference37 slides · May 2, 2016
 Merger or Acquisition (November 2015)32 slides · Nov 16, 2015
 Merger or Acquisition (August 2015)24 slides · Aug 14, 2015