American National Bankshares Inc
American National Bankshares — Investor Presentation (August 2012)
38 slides from American National Bankshares's investor presentation, Aug 1, 2012

Slide 1: American National Bankshares Inc. - Exceeding Your Expectations
————— oe a AMERICAN NATION, BANKSHARES INC. Exceeding Your Expectations Since 1909
Slide 2: Forward-Looking Statements
Forward-Looking Statements — == Certain statements in this presentation may constitute “forward-looking statem within the meaning of the Private Securities Litigation Reform Act of 1995. Fc looking statements are statements that include projections, predictions, expect beliefs about future events or
Slide 3: Forward-Looking Statements (continued)
made herein are qualified by these cautionary statements. American National : undertake to update forward-looking statements to reflect circumstances or eve occur after the date the forward-looking statements are made. —_
Slide 4: Defining Strengths
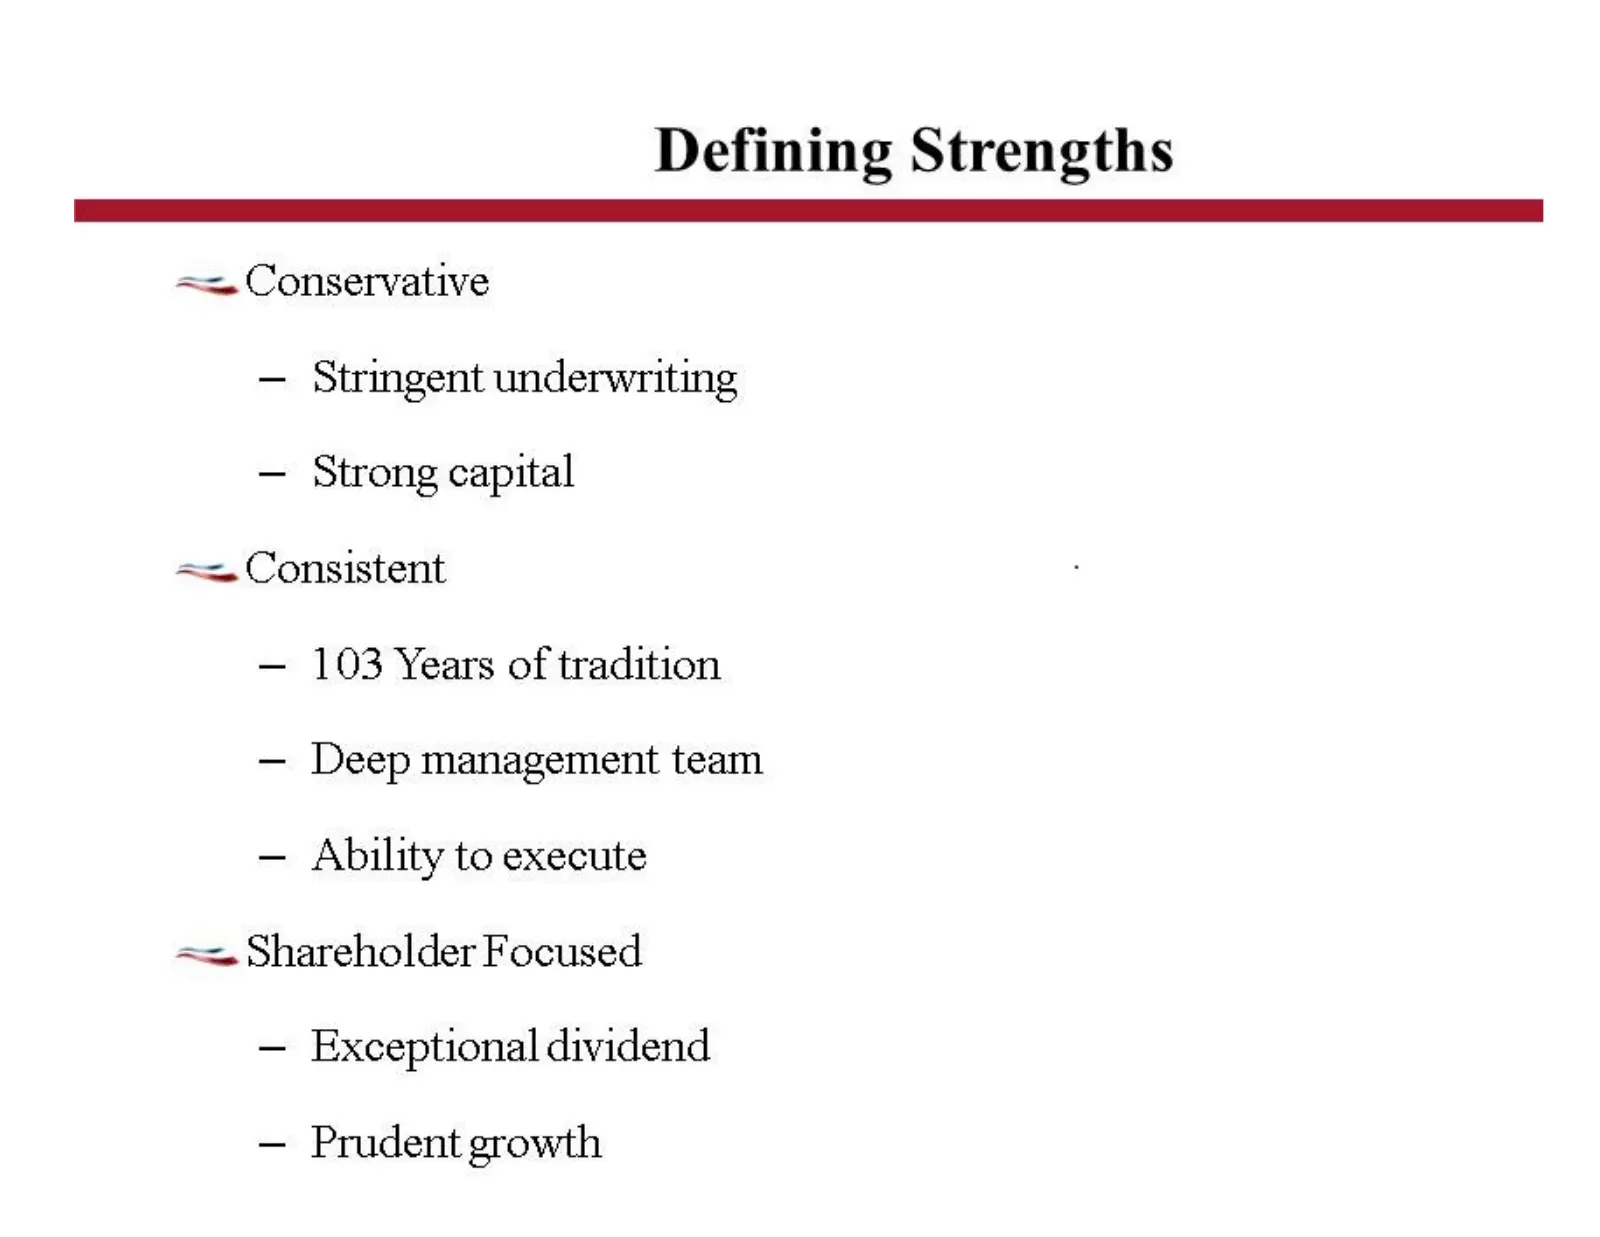
Defining Strengths == Conservative — Stringent underwriting — Strong capital == Consistent — 103 Years of tradition — Deep management team — Ability to execute == Shareholder Focused — Exceptional dividend — Prudent growth
Slide 5: Seasoned Management
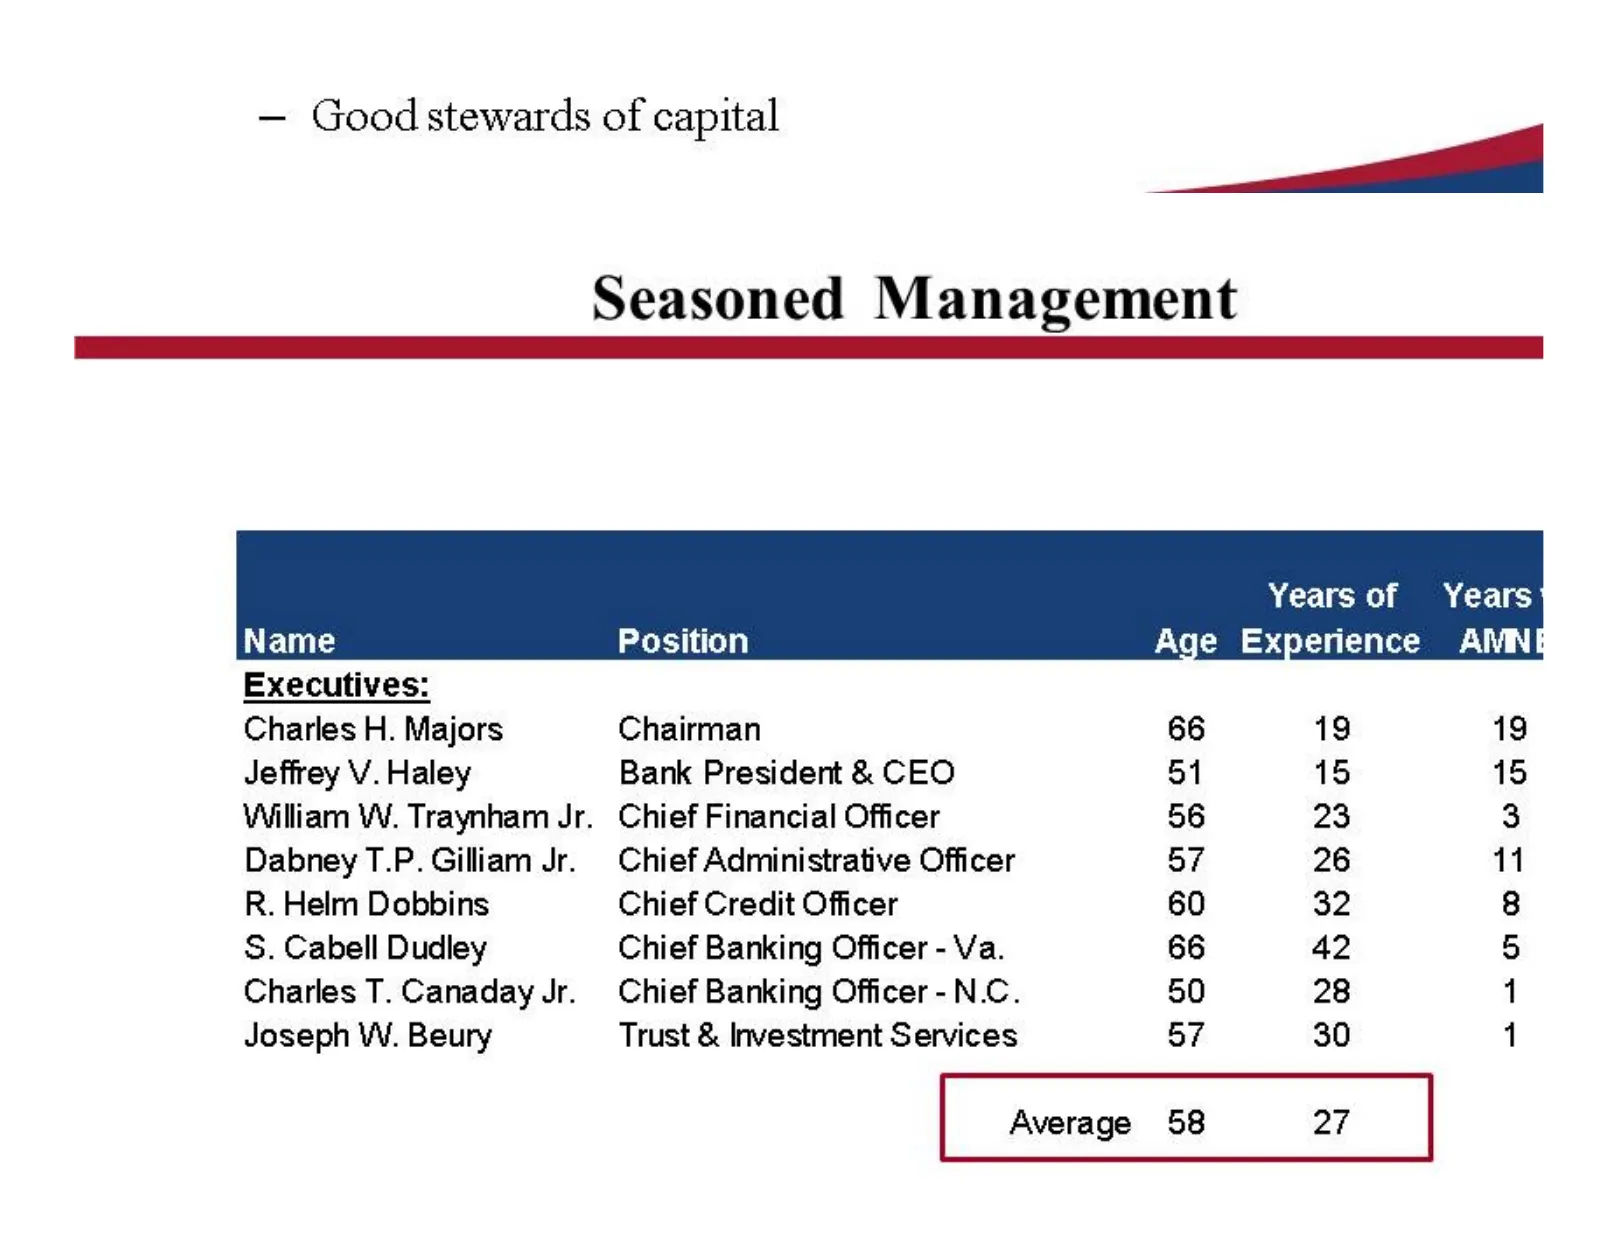
— Good stewards of capital Seasoned Management SESS Years of Years Position Age Experience AIMNE& Executives: Charles H. Majors Chairman 66 19 19 Jeffrey V. Haley Bank President & CEO 51 15 15 William W. Traynham Jr. Chief Financial Officer 56 23 3 Dabney T.P. Gilliam Jr. Chief Administrative Office
Slide 6: Executive Summary
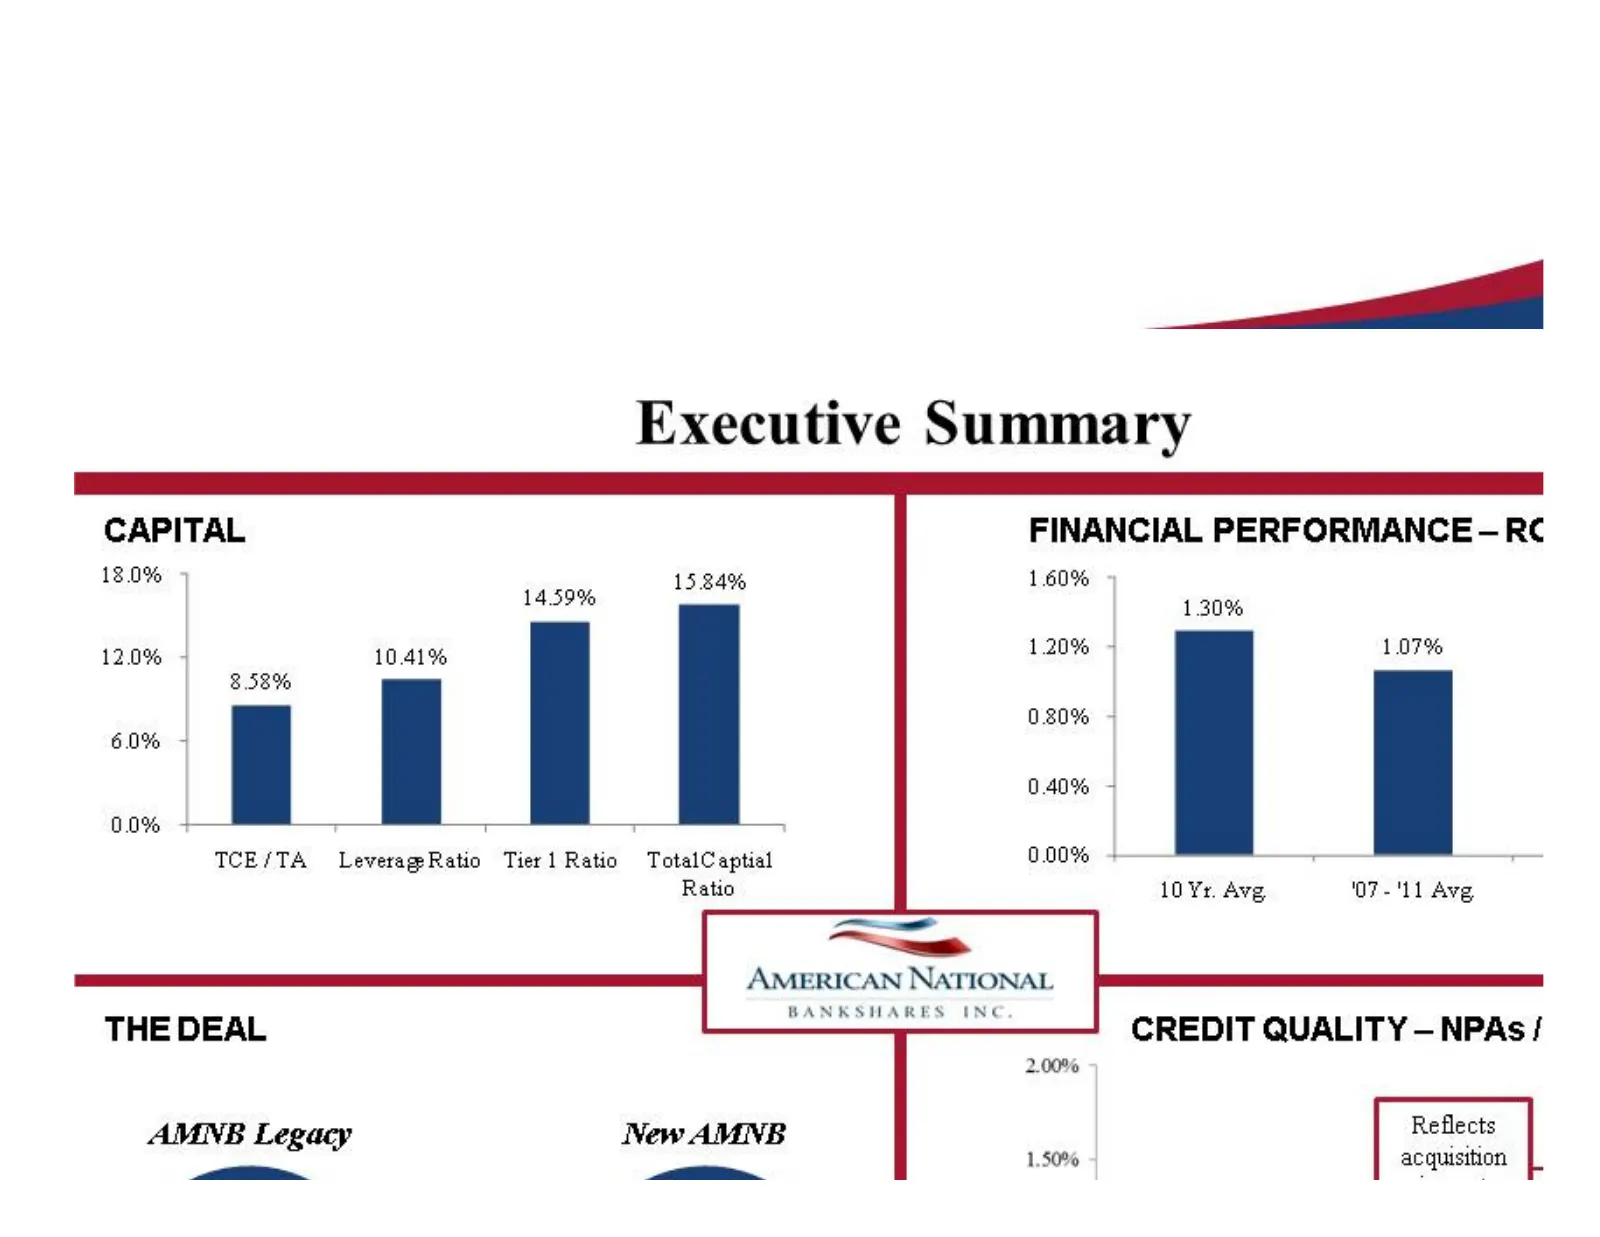
—_ Executive Summary CAPITAL FINANCIAL PERFORMANCE —- RC 18.0% 15.24% 1.60% 1459% 130% 120% + 10.41% 20084 10796 858% 080% - 60% ~ 040% - 0.0% : - TCE/TA LeverageRatio Tier1 Ratio TotalCaptial 0.00% + T Ratio 10 Yr. Avg ‘07 -'11 Avg. ee > AMERICAN NAV1O§NAL BANKSHARES INC THE DEAL CREDIT QUALITY — N
Slide 7: Deposits and NPAs
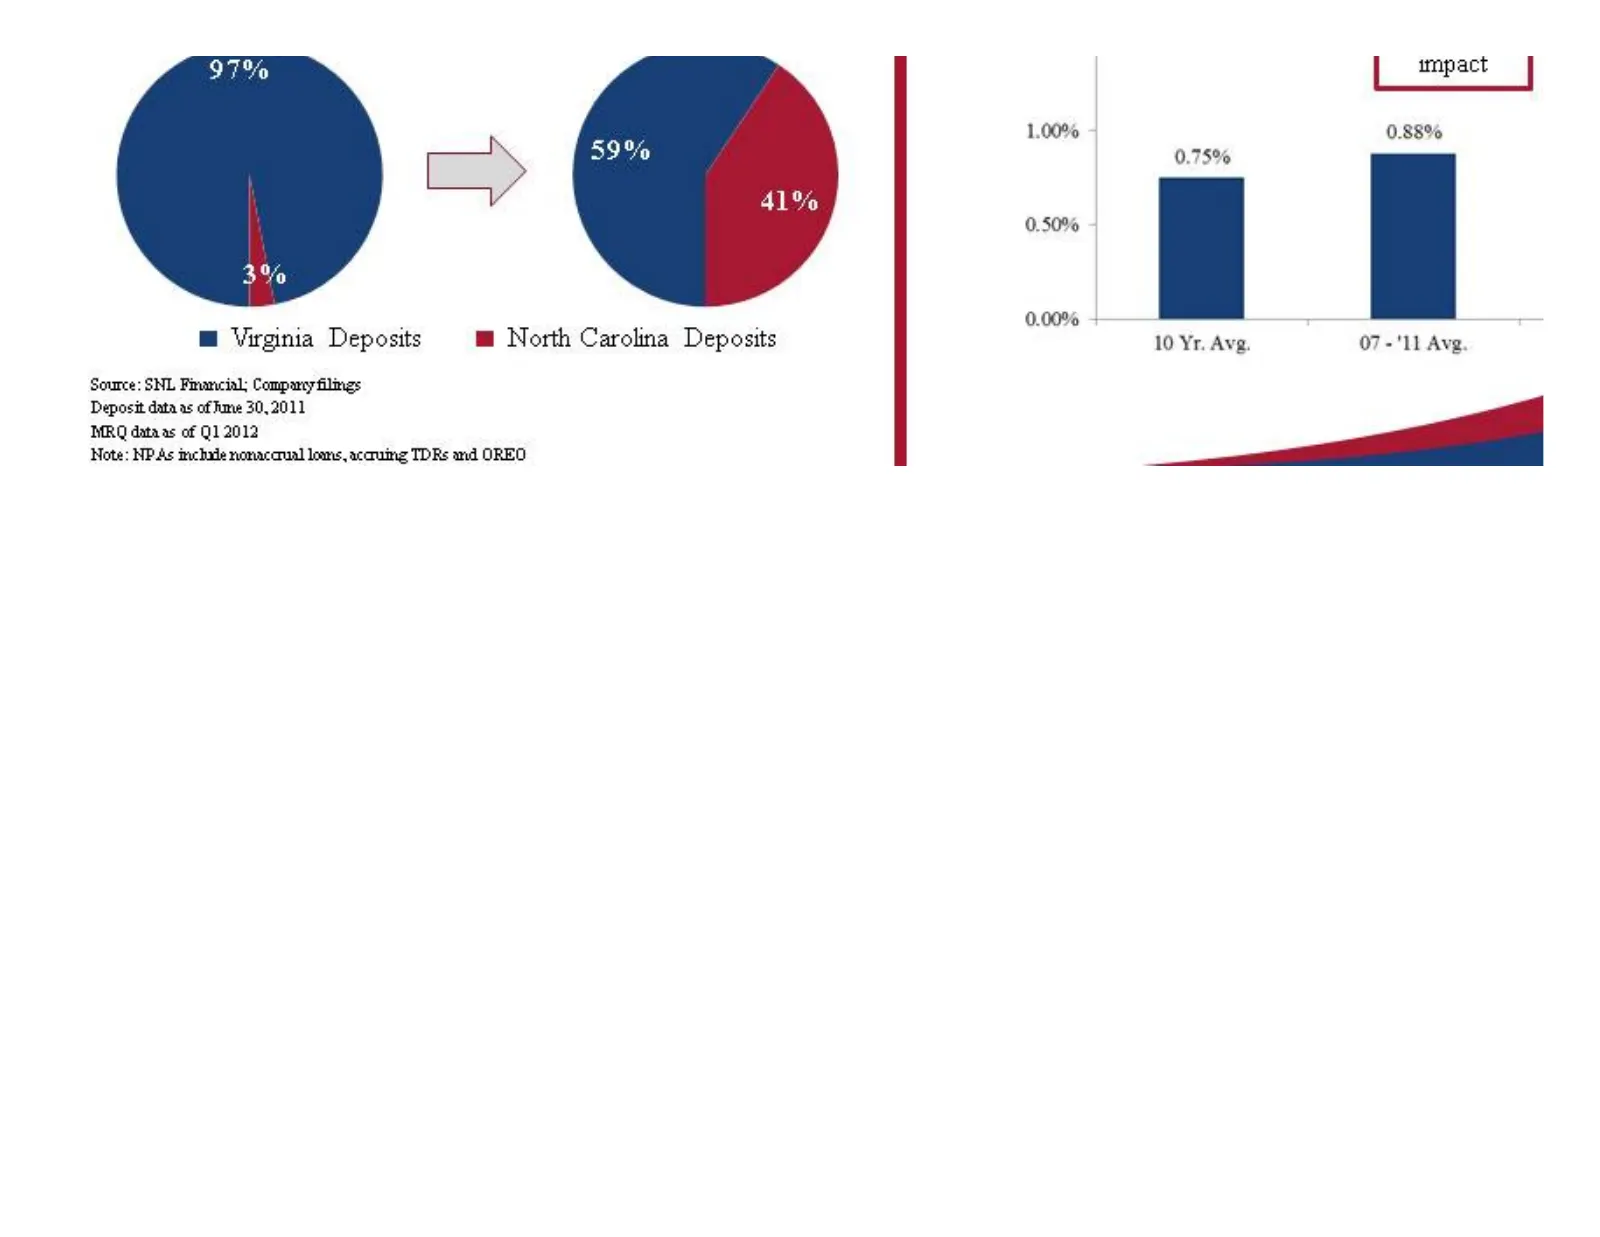
@ Virginia Deposits @ North Carolina Deposits Source: SNL Frrancial; Company filmgs Deposit data as of km 30,2011 MRQ datas of Q12012 Note: NPAs mchade nomaccrual lems, accrumg TDRs md OREO | impact | 1.00% 0.88% 0.75% _ i 0.00% + 10 Yr. Avg. 07 -'11 Avg. —_ |
Slide 8: Capital Levels
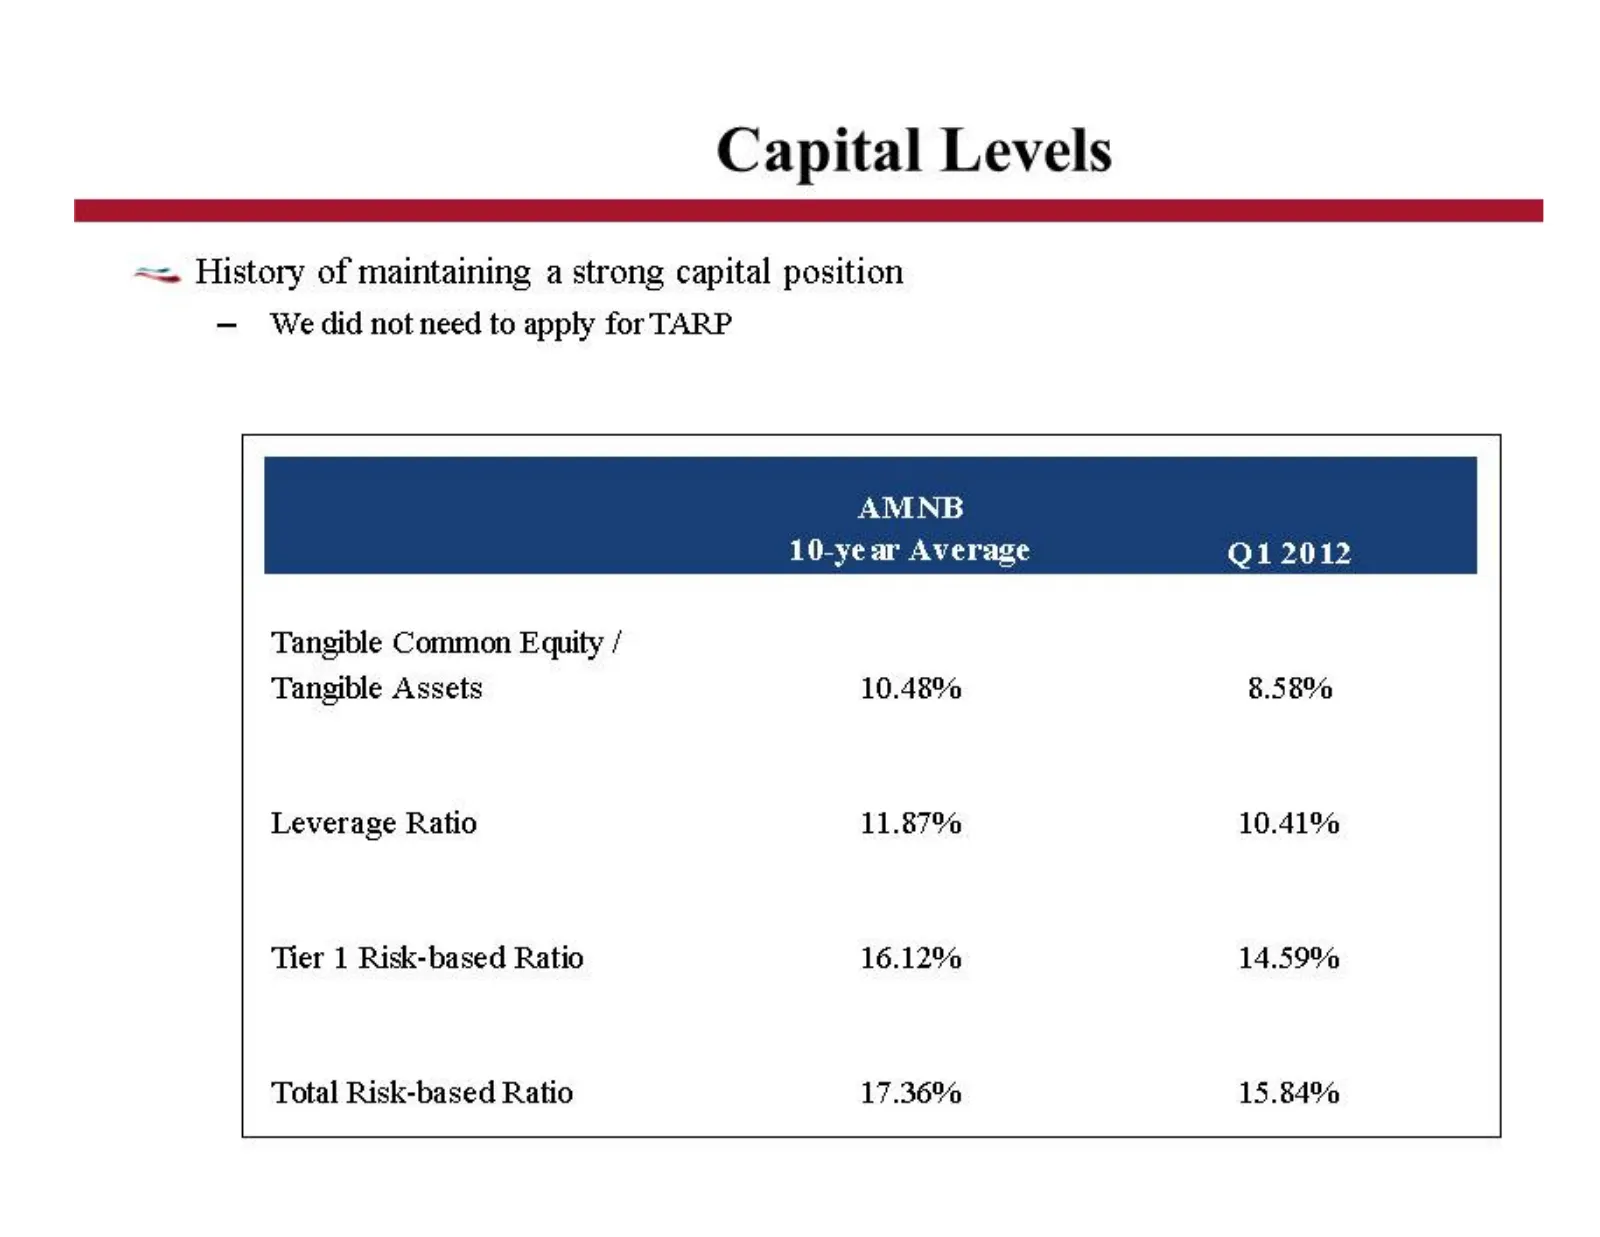
Capital Levels == History of maintaining a strong capital position — Wedid not need to apply for TARP AMNB 10-year Average Q1 2012 Tangible Common Equity / Tangible Assets 10.48% 8.58% Leverage Ratio 11.87% 10.41% Tier 1 Risk-based Ratio 16.12% 14.59% Total Risk-based Ratio 17.36% 15.84%
Slide 9: Dividends
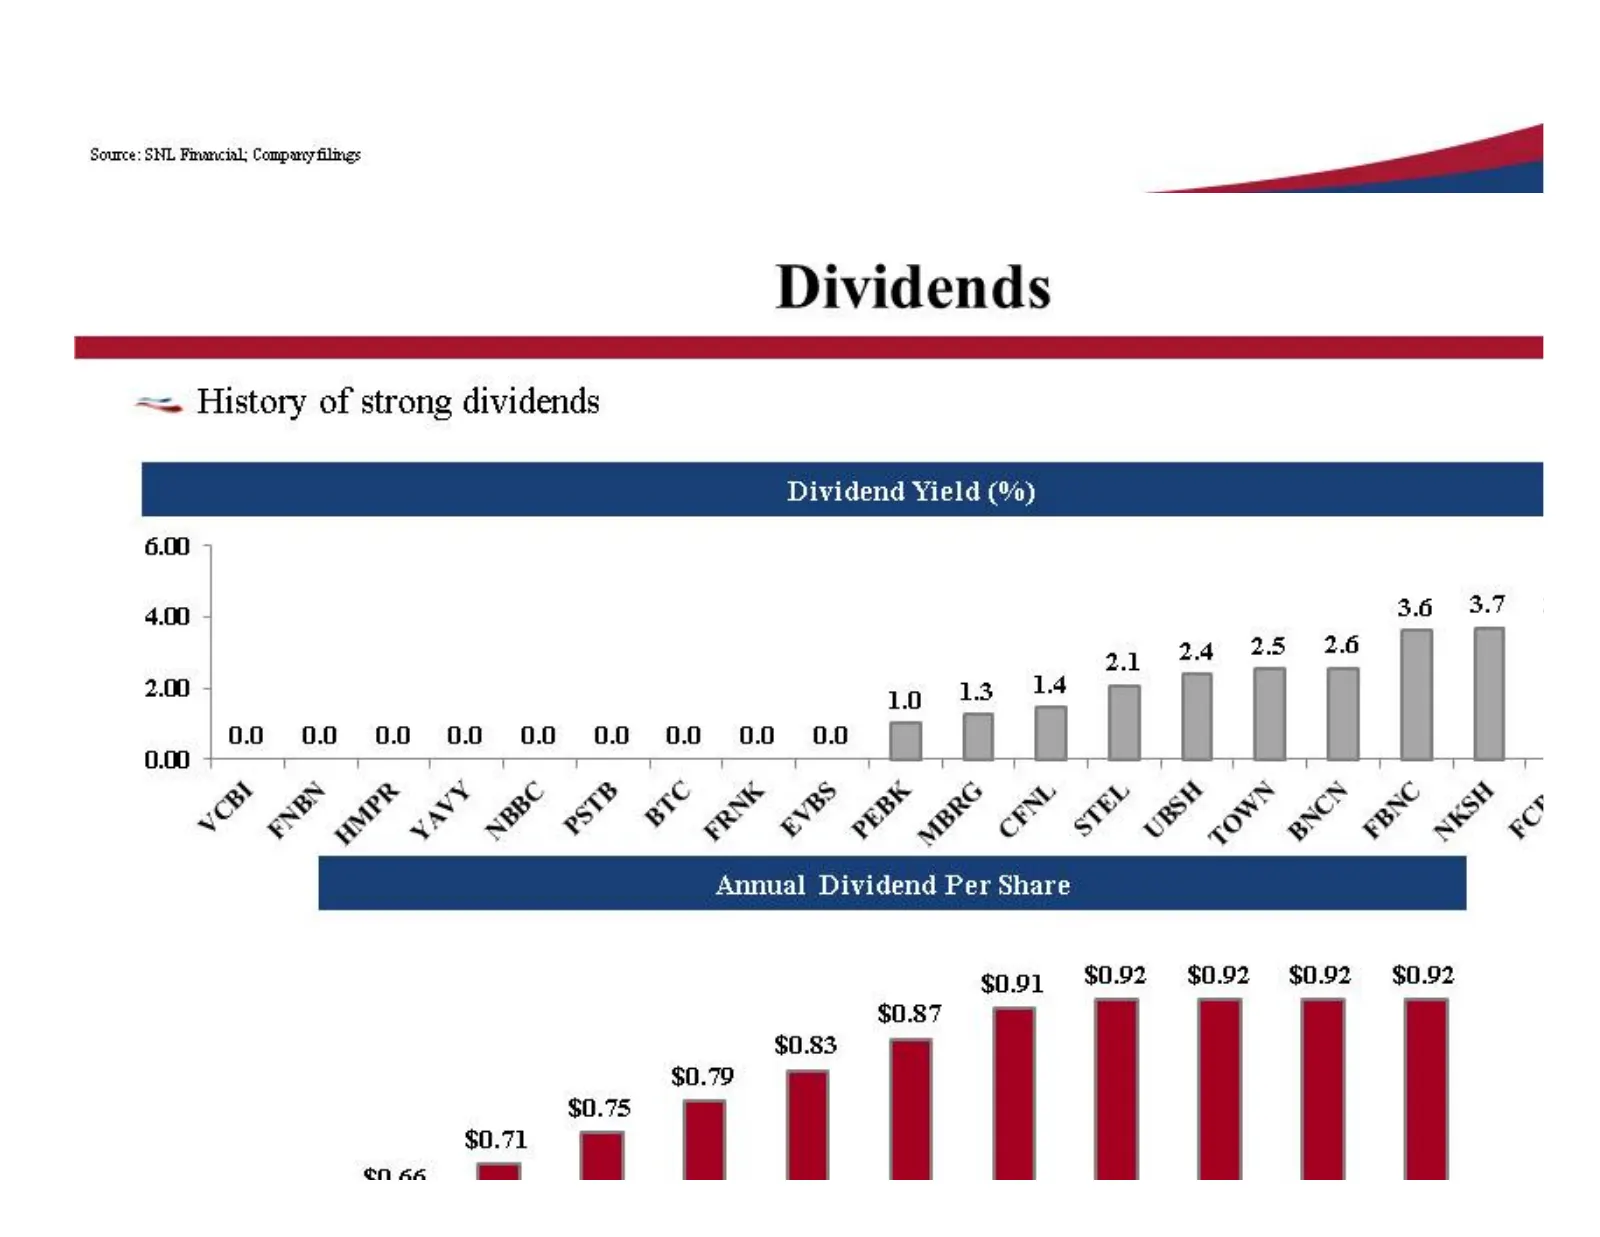
Source: SNL Frrancial; Company filmgs Dividends EEE == History of strong dividends Dividend Yield (%) | oxy 00 00 O00 O00 O08 OO OO OO im | 8 Annual Dividend Per Share $0.91 $092 $0.92 $0.92 $0.92 $0.87 $0.83 I 79 a yin) $0.71 en 6A a
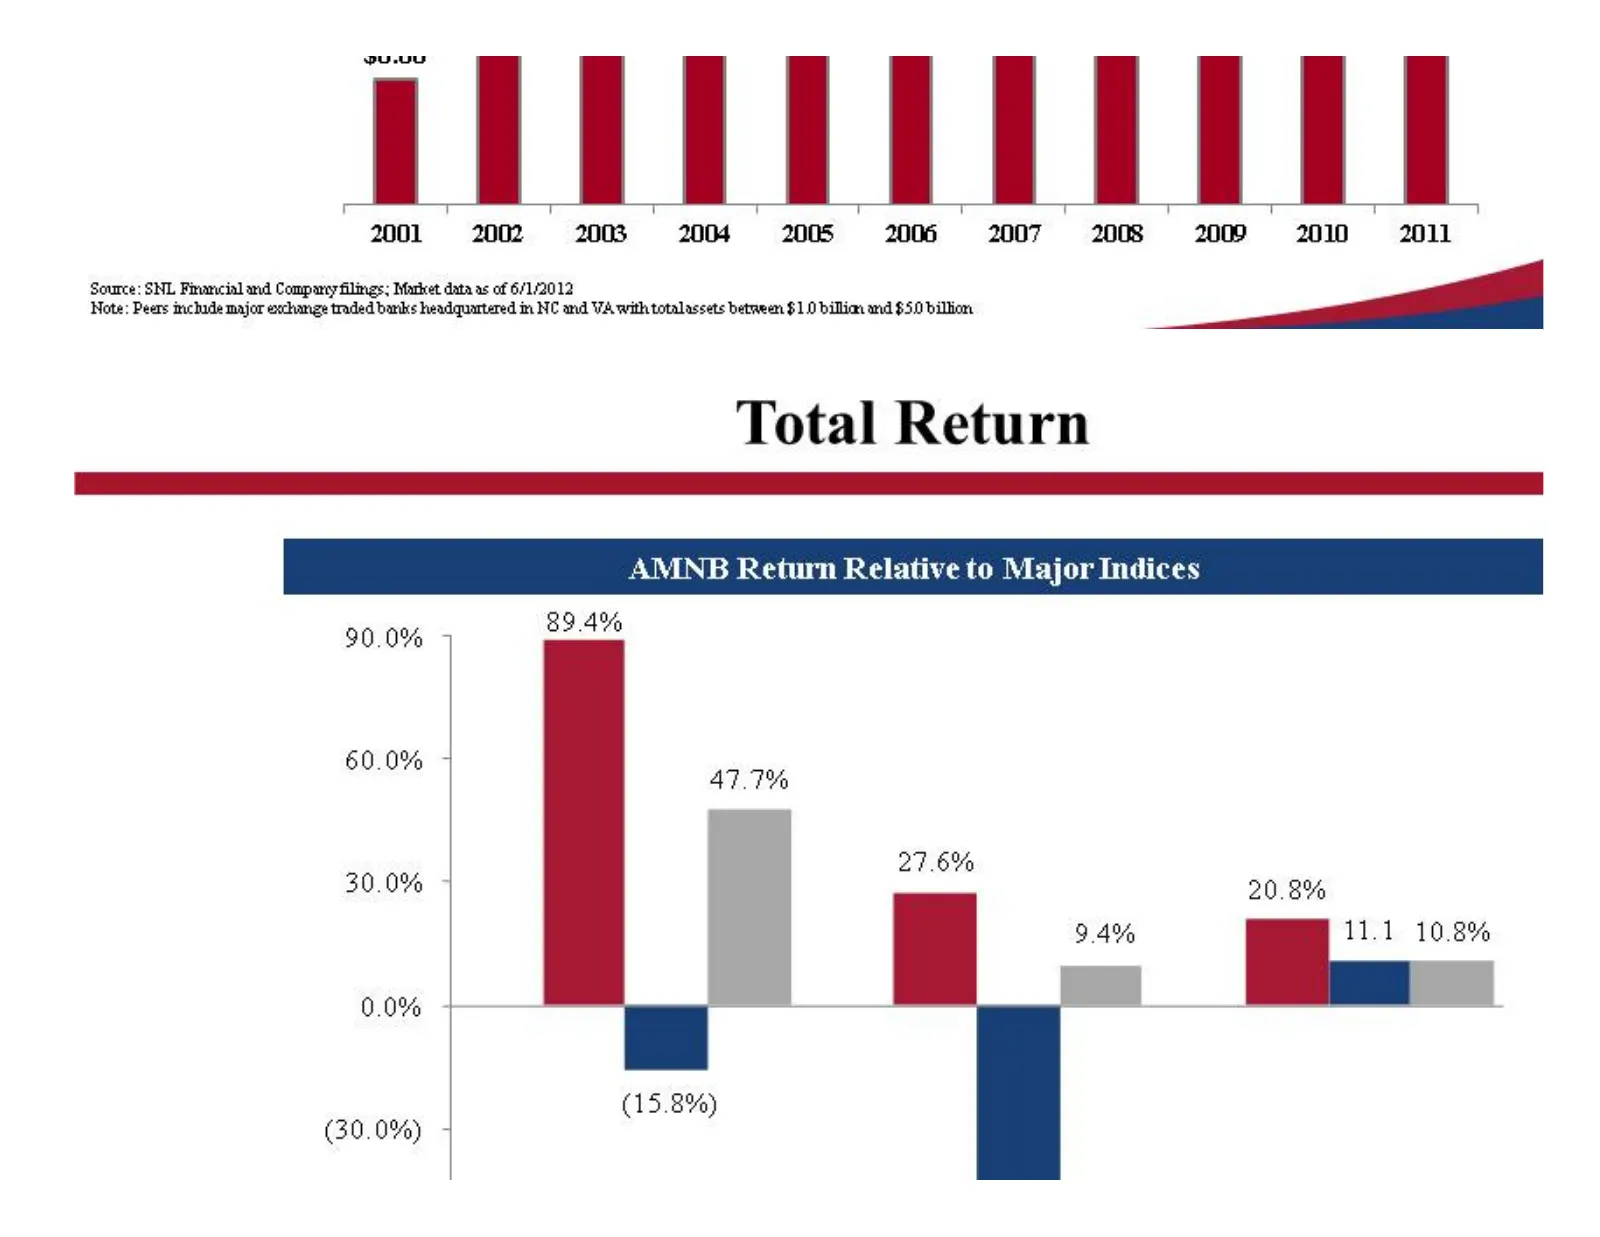
Slide 10: Total Return
| | | | | tl | l | | q 7 | T T 7 T T 7 7 T T 2001 20022 2008 2006 2006 2006 «62007 #82008 200 2010 2011 Source: SNL Fiamcial amd Company filmgs; Market data as of 6/1/2012 Note: Peers chade major exchange traded bariks headquartered in NC and VA with totalassets between $10 billion and $50 billion T
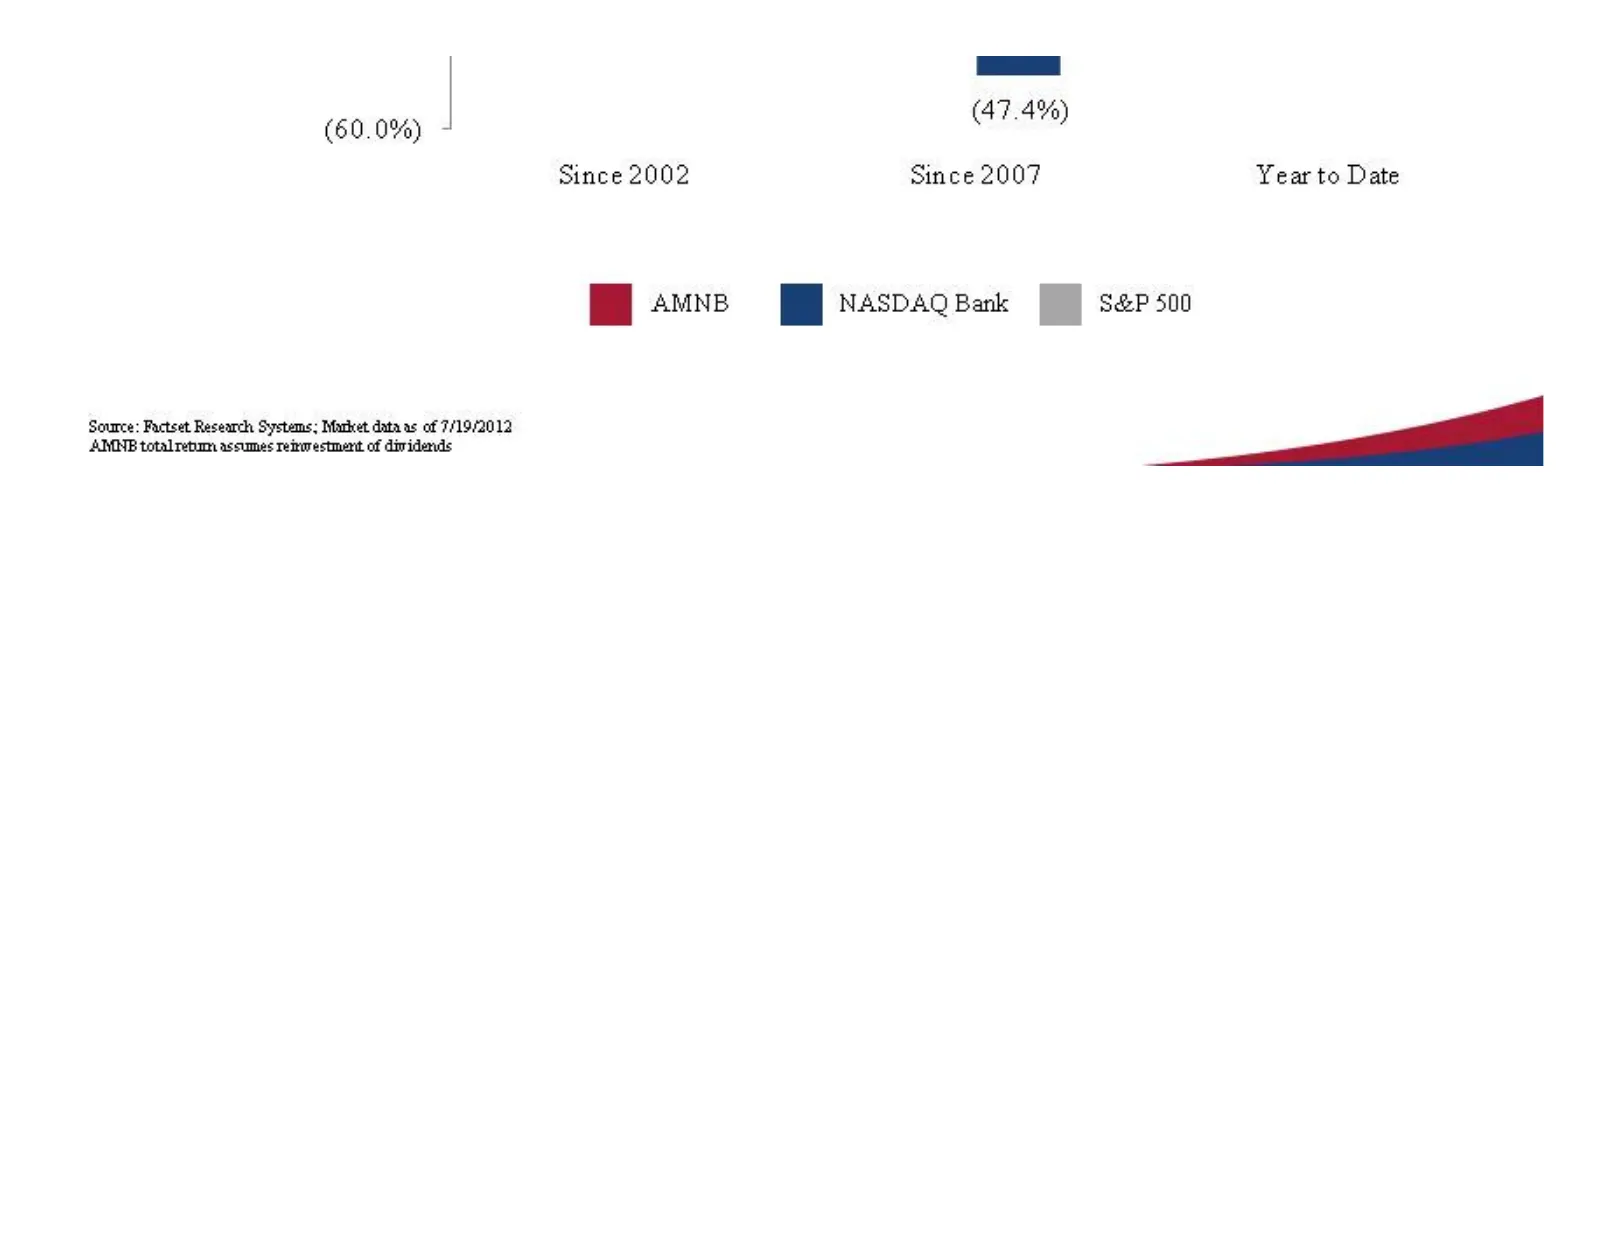
Slide 11: AMNB Return Relative to Major Indices
(60.0%) | (47.4%) Since 2002 Since 2007 Year to Date im AMNB ‘id NASDAQ Bank [J sep soo Source: Factset Research Systems; Market data as of 7/19/2012 AMNB total rebum assumes reitorestment of dividends
Slide 12: Financial Performance
Financial Performance
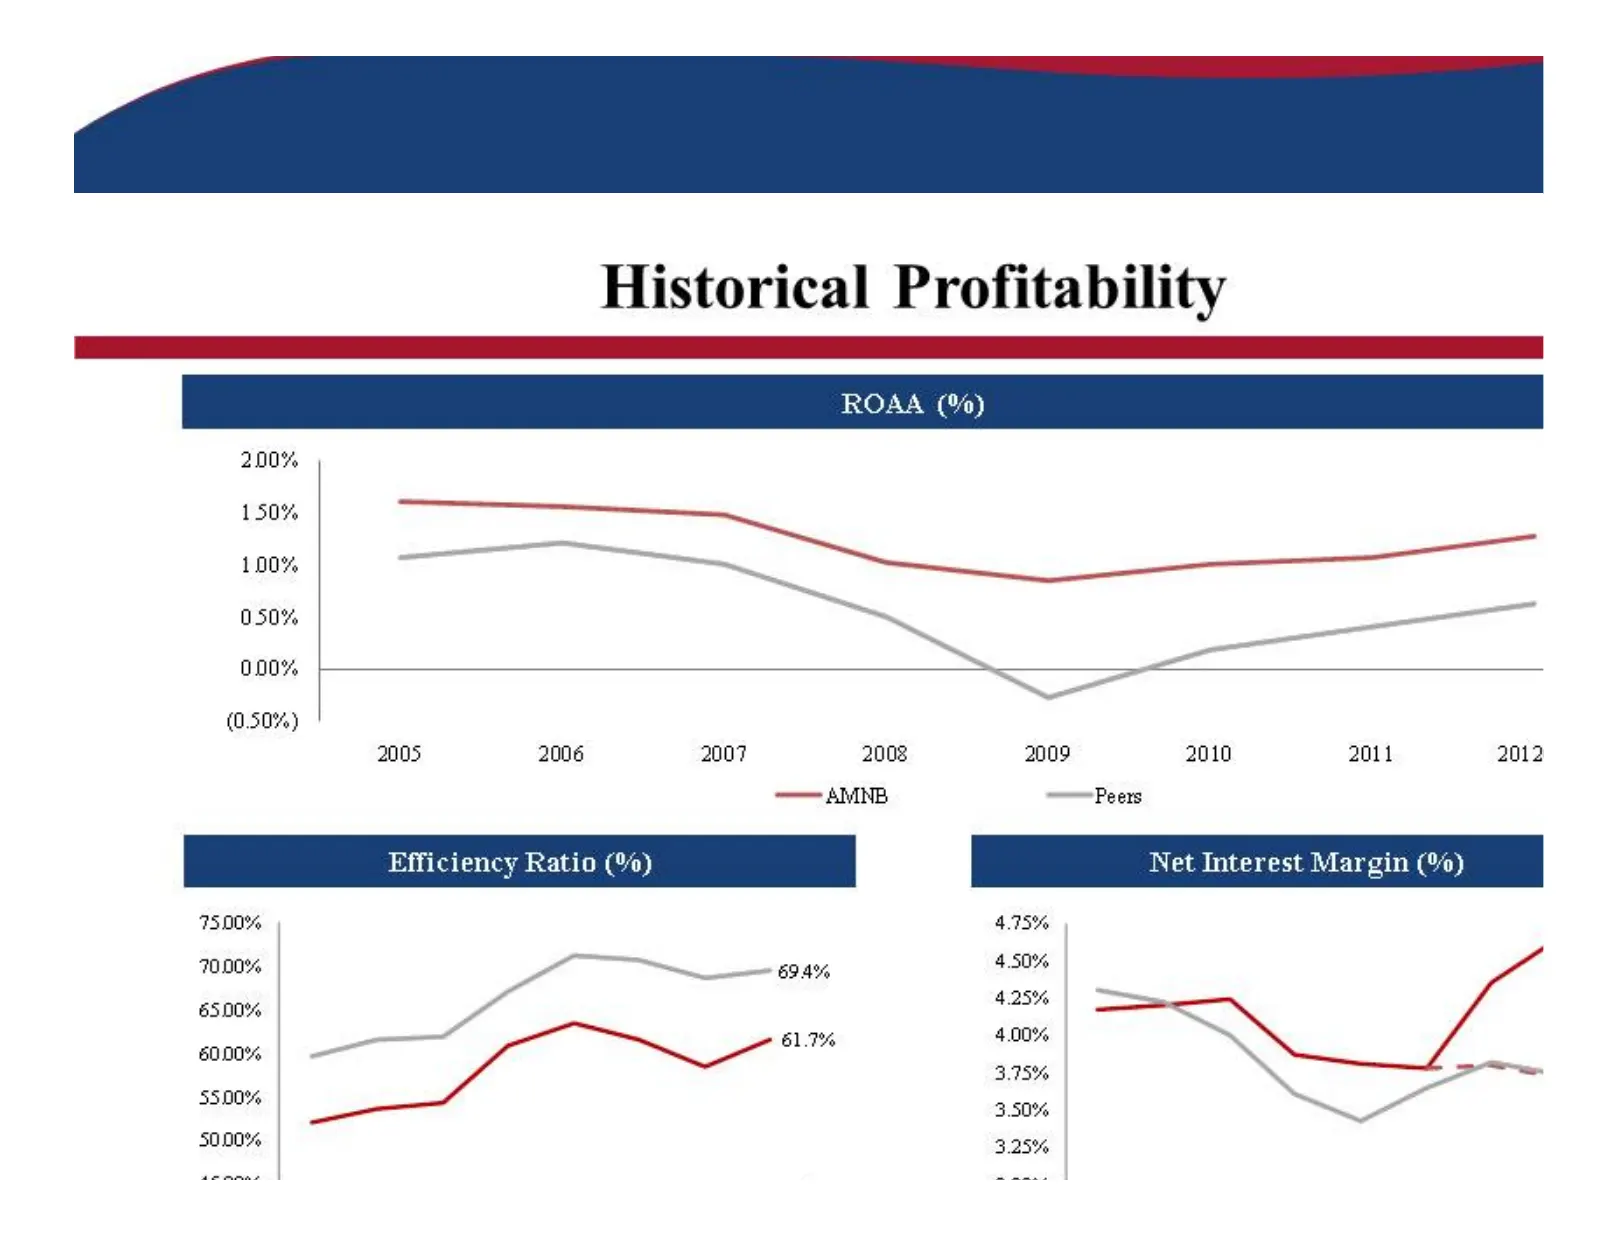
Slide 13: Historical Profitability
Historical Profitability 200% ats — 100% 050% 000% (0.50%) 2005 2006 2007 2008 2009 2010 2011 2012 woo Peers Net Interest Margin (%) 75.00% 4.75% 700% 694% 4.50% axes 4.25% 4.00% 0.00% 61.7% 6 3.75% 5500% 3.50% so.00% 325%
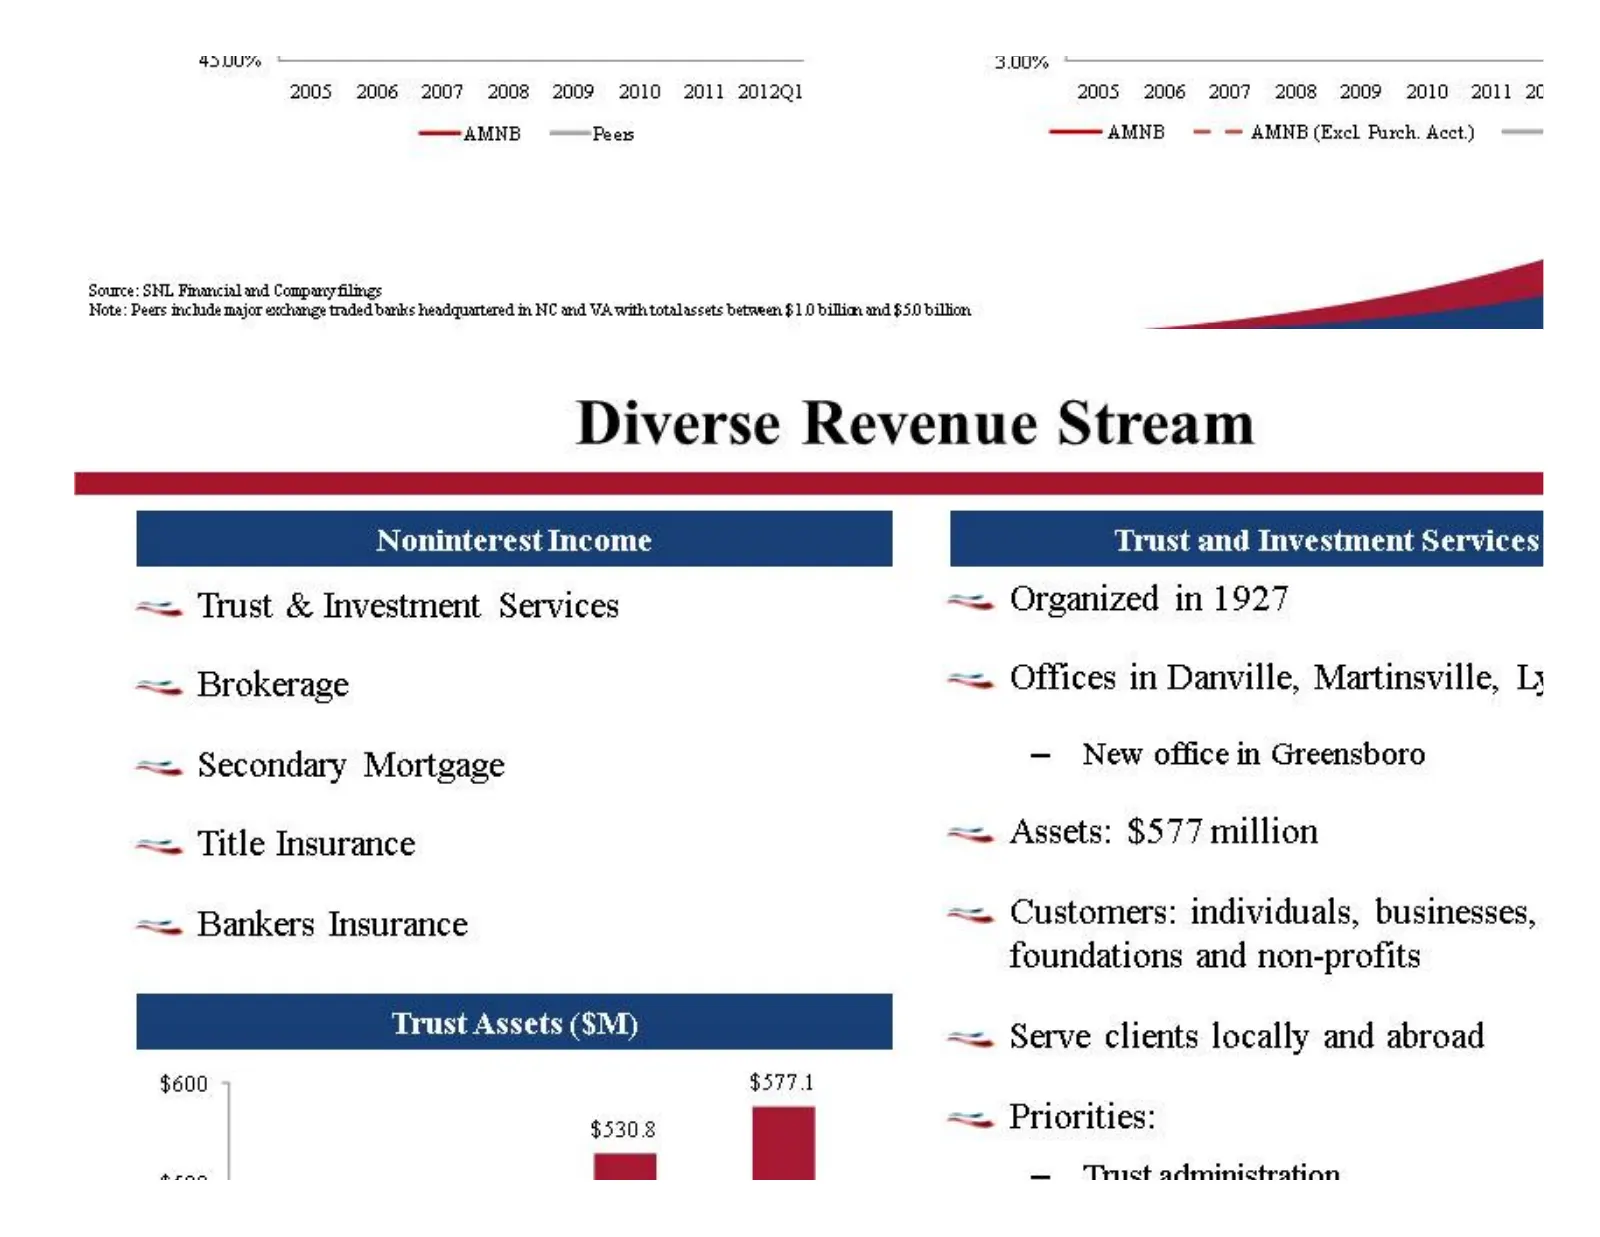
Slide 14: Diverse Revenue Stream
4 UY 3.00% 2005 2006 2007 2008 2009 2010 2011 2012Q1 2005 2006 2007 2008 2009 2010 2011 2C ——AMNB --~~Fees ——AMNB = — AMNB (Excl Purch. Acct) == Source: SNL Frrancial nd Company filmgs ‘Note: Peers muchade major exchange traded barks headquartered m NC and VA with totalassets between $10 billions am
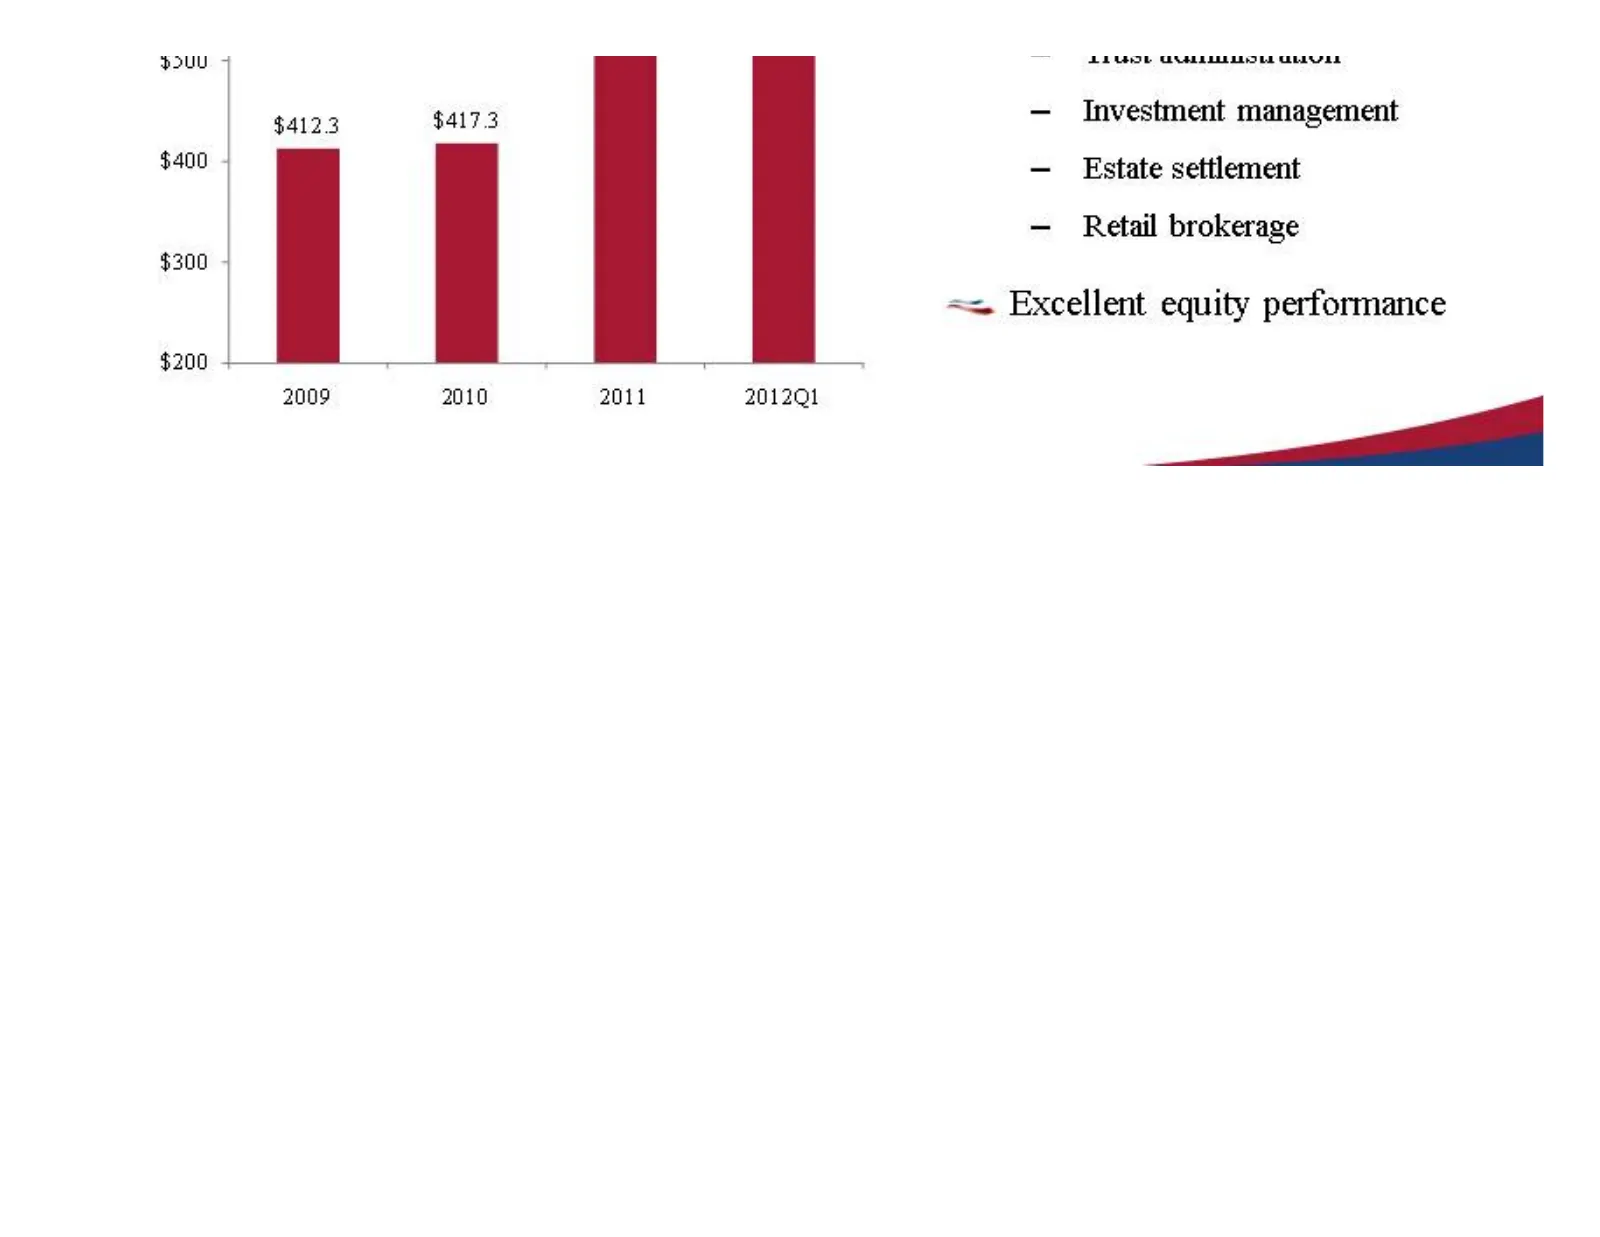
Slide 15: Trust and Investment Services
pouU 4 $400 $300 - $200 $4123 $4173 2009 2010 2011 2012Q1 akon UL Ua — Investment management — Estate settlement — Retail brokerage == Excellent equity performance —
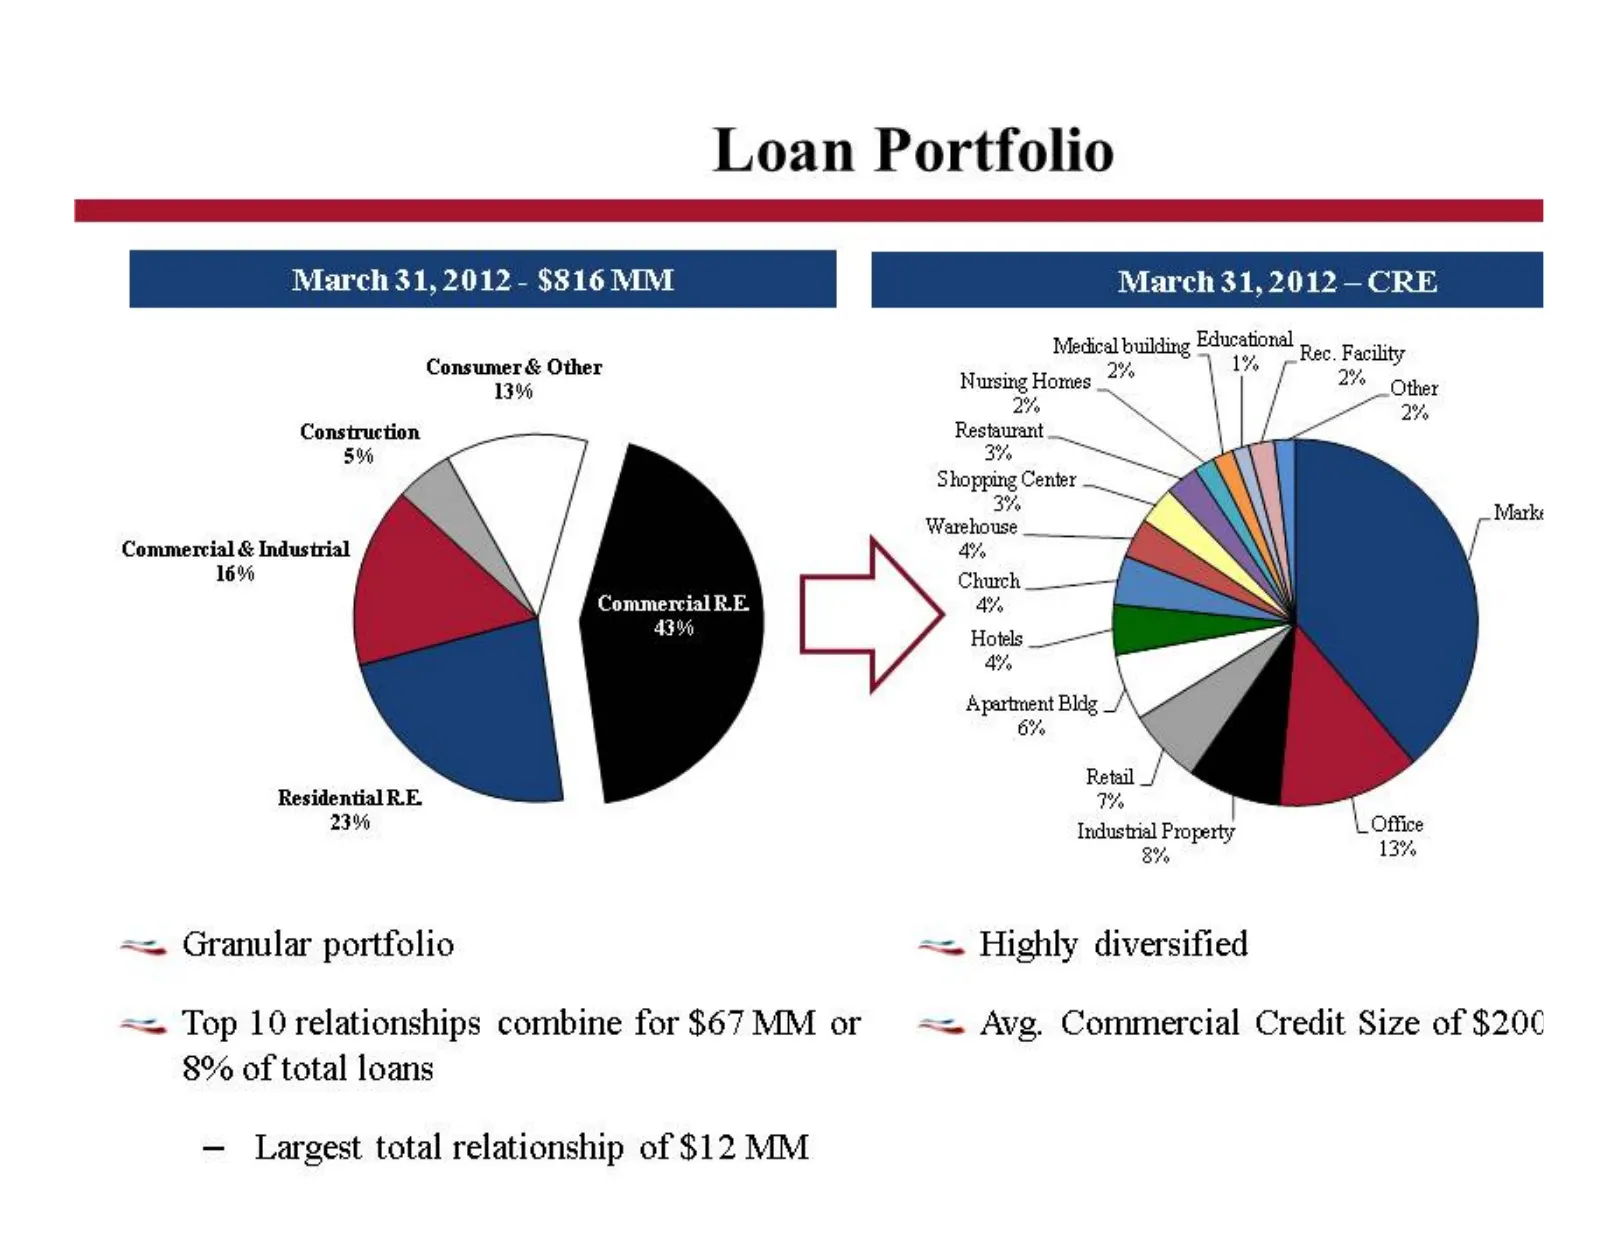
Slide 16: Loan Portfolio
Loan Portfolio March 31, 2012 - $816 MM March 31, 2012 -—-CRE Consumer & Other 13% Restaurant 3% Shopping Center 3% Construction 5% Commercial & Indusirial 16% Residential RE 23% 5 Tne) Property 13%, == Granular portfolio == Highly diversified == Top 10 relationships combine for $67 MM or == Avg. Co
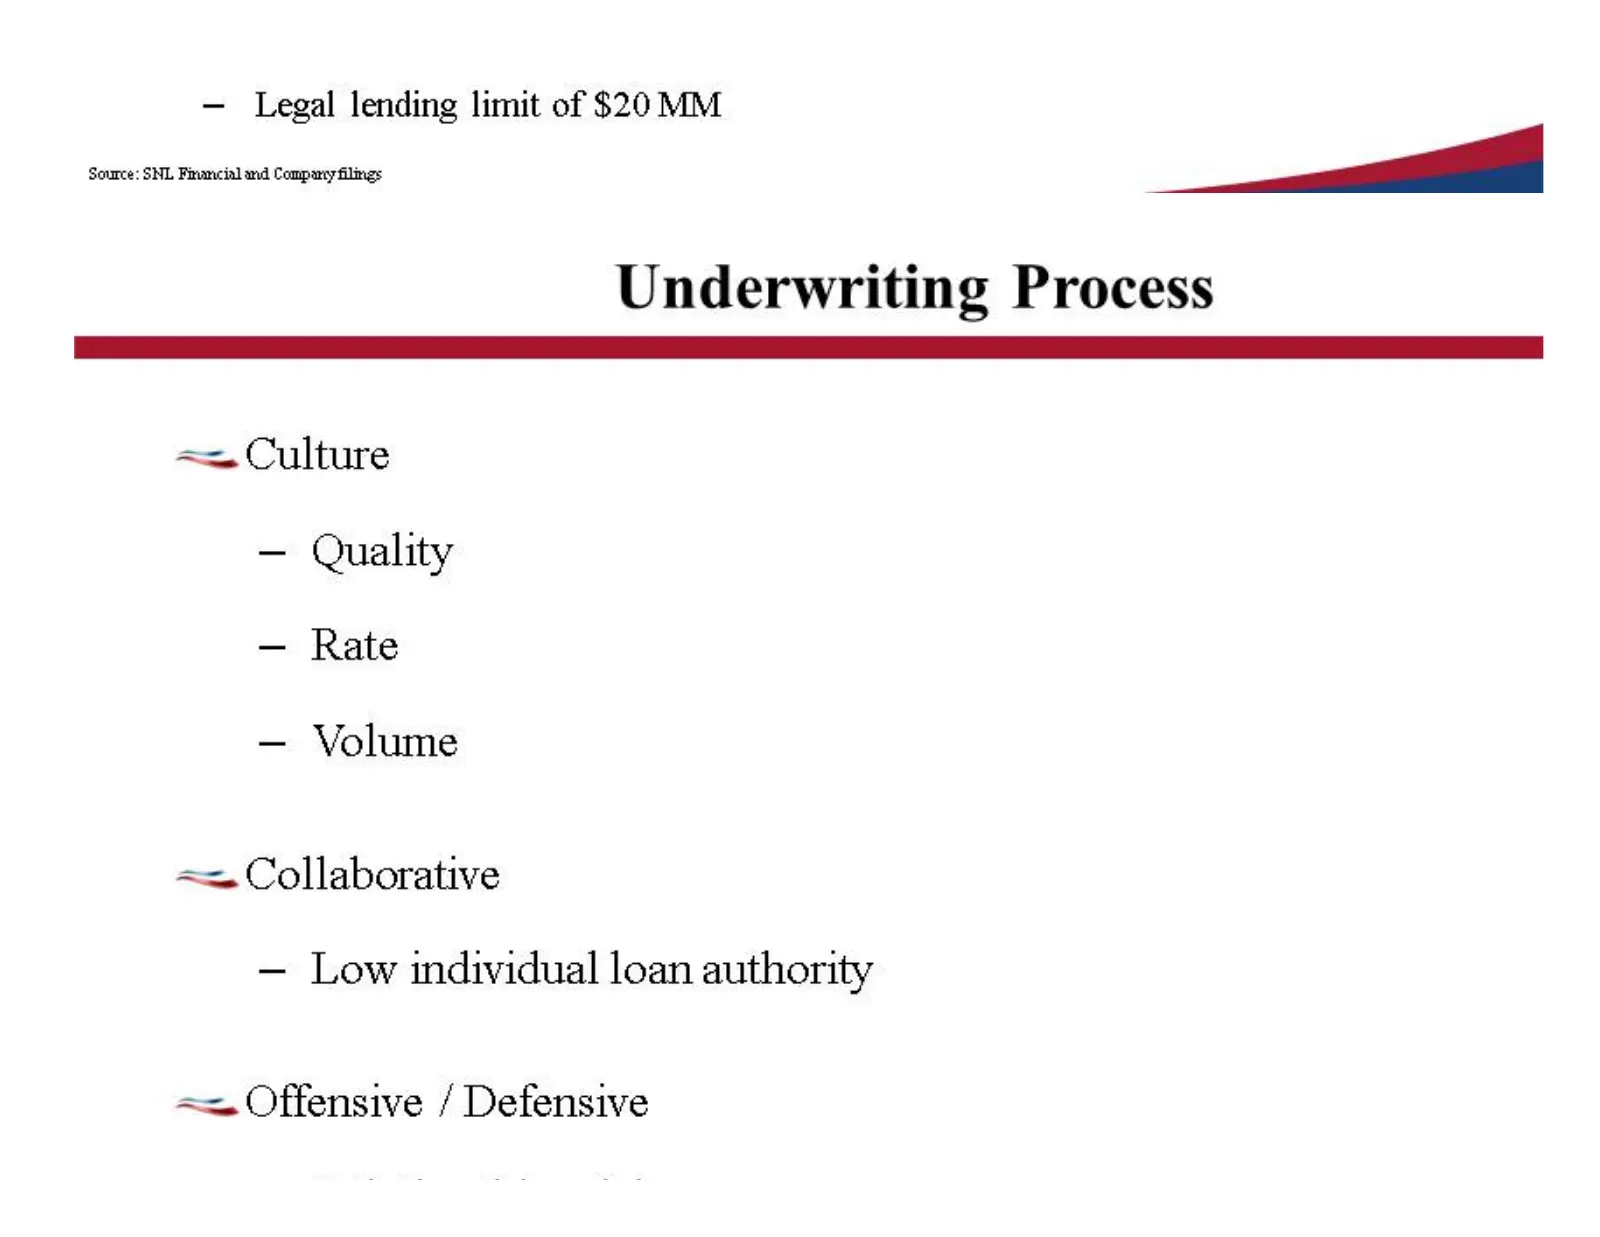
Slide 17: Underwriting Process
— Legal lending limit of $20 MM a —_— | Underwriting Process eee EEE == Culture — Quality — Rate — Volume == Collaborative — Low individual loan authority == Offensive / Defensive
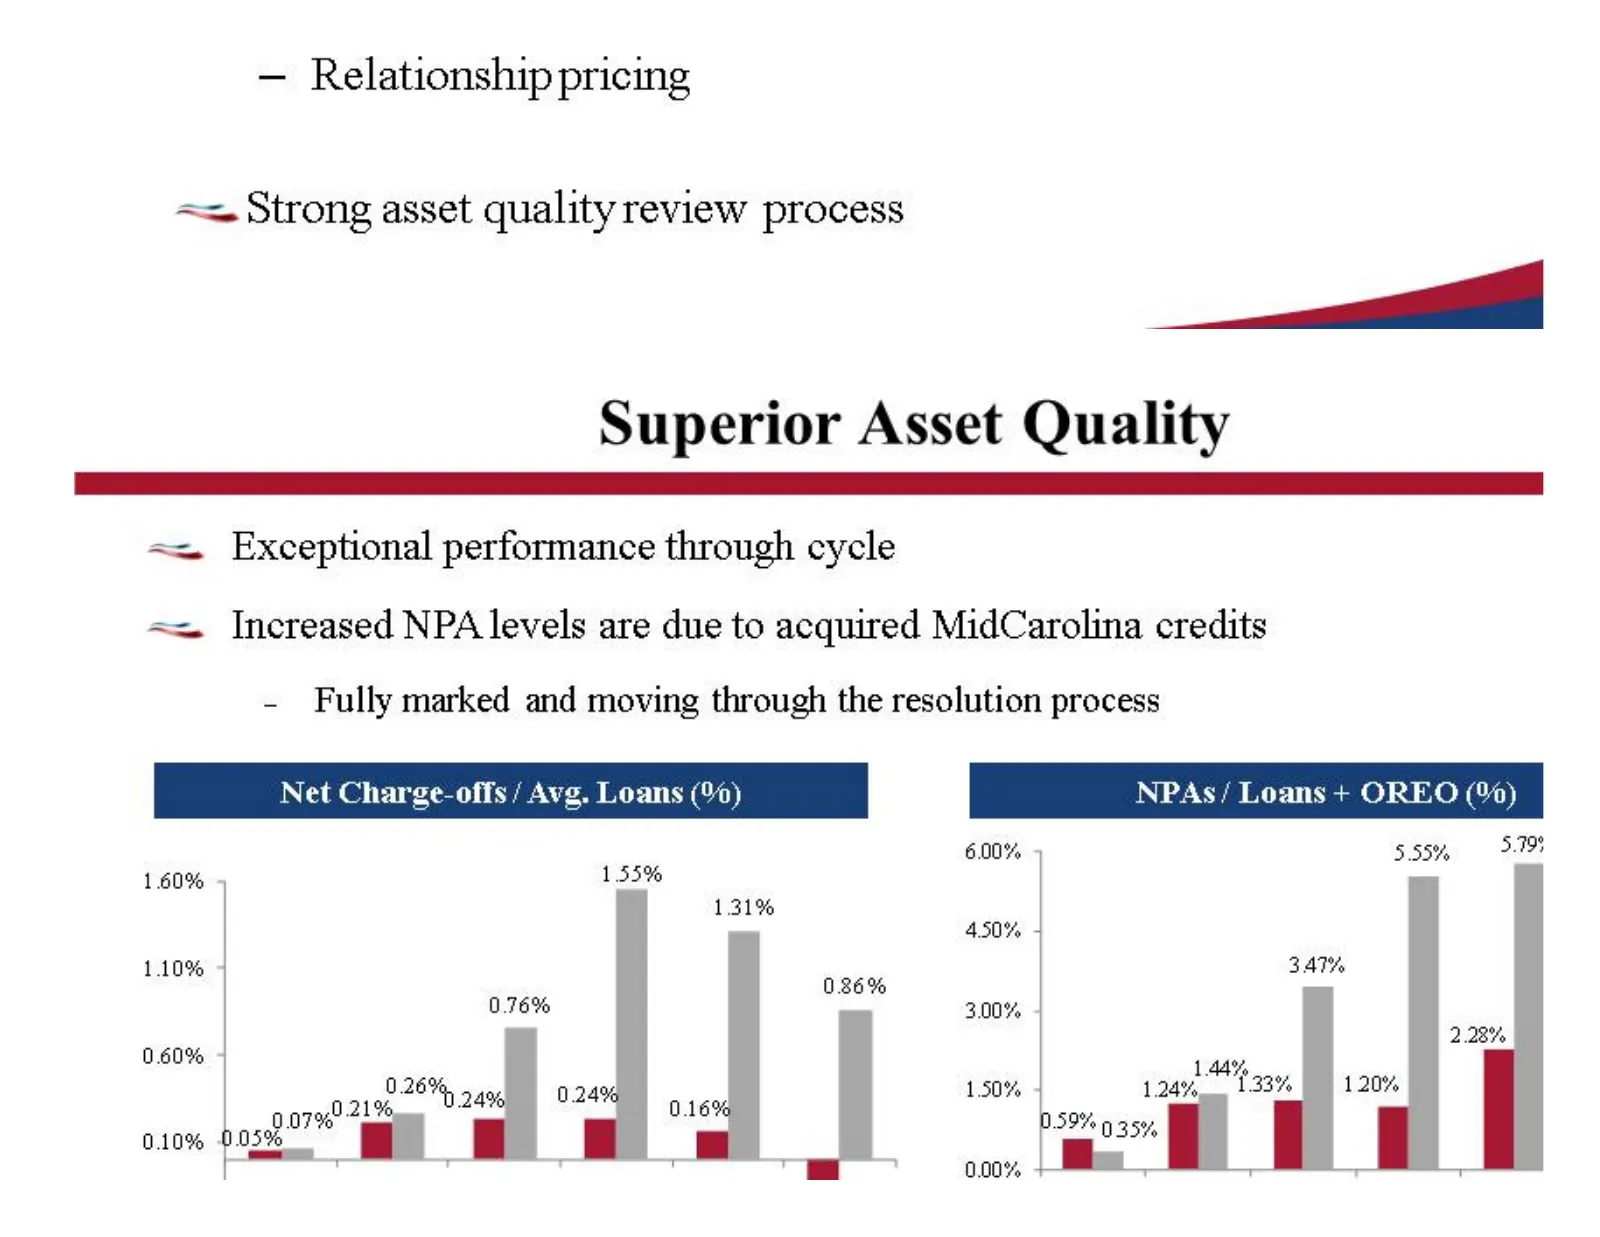
Slide 18: Superior Asset Quality
— Relationship pricing == Strong asset quality review process —_ Superior Asset Quality == Exceptional performance through cycle == Increased NPA levels are due to acquired MidCarolina credits - Fully marked and moving through the resolution process NPAs/ Loans + OREO (9%) Net Charge-offs / Avg. Loa
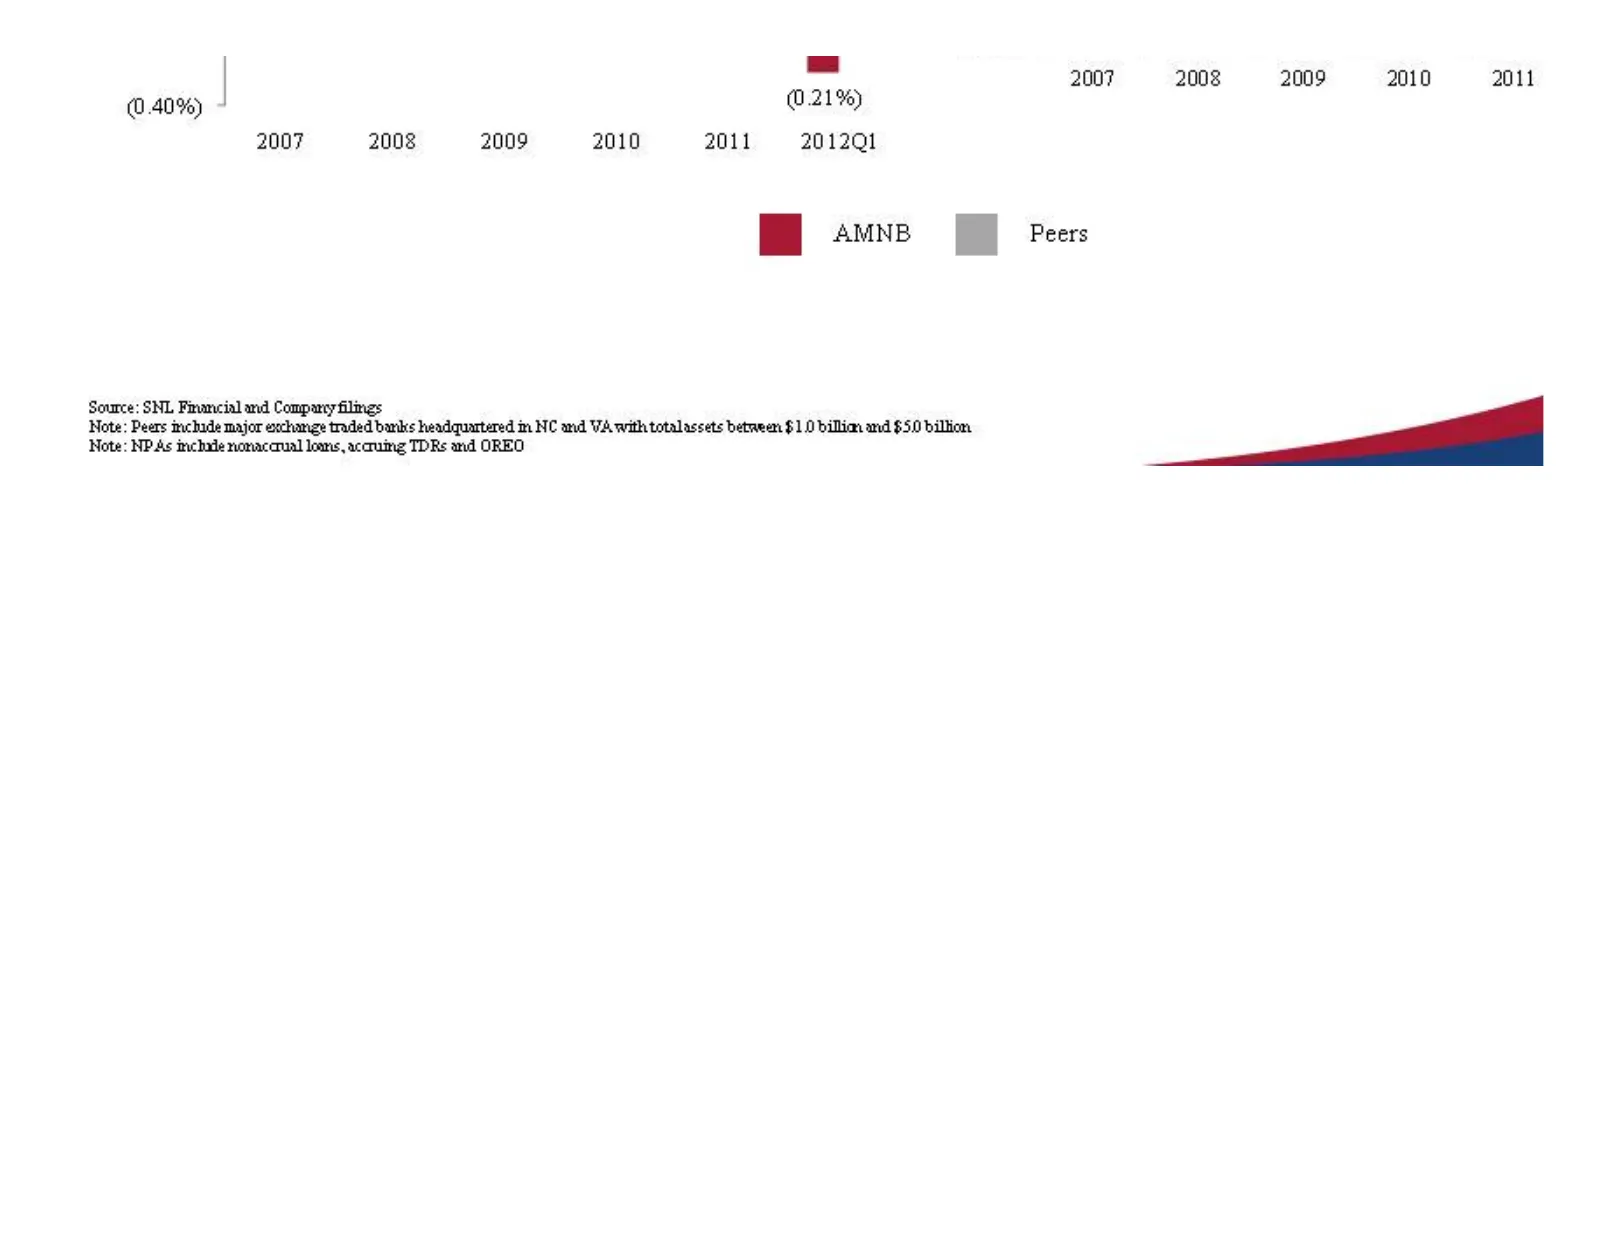
Slide 19: Asset Quality Charts
(0.40%) (0.21%) 2007 2008 2009 2010 2011 201201 im AMNB [J Peers 2007 2008 2009 2010 2011 Source: SNL Frumcial and Comparry filings ‘Note: Peers muchade major exchange traded barks headquartered m NC and VA with totalassets between $10 bili amd $50 billion ‘Note: NPAs mchade noraccrual lems, accrumg
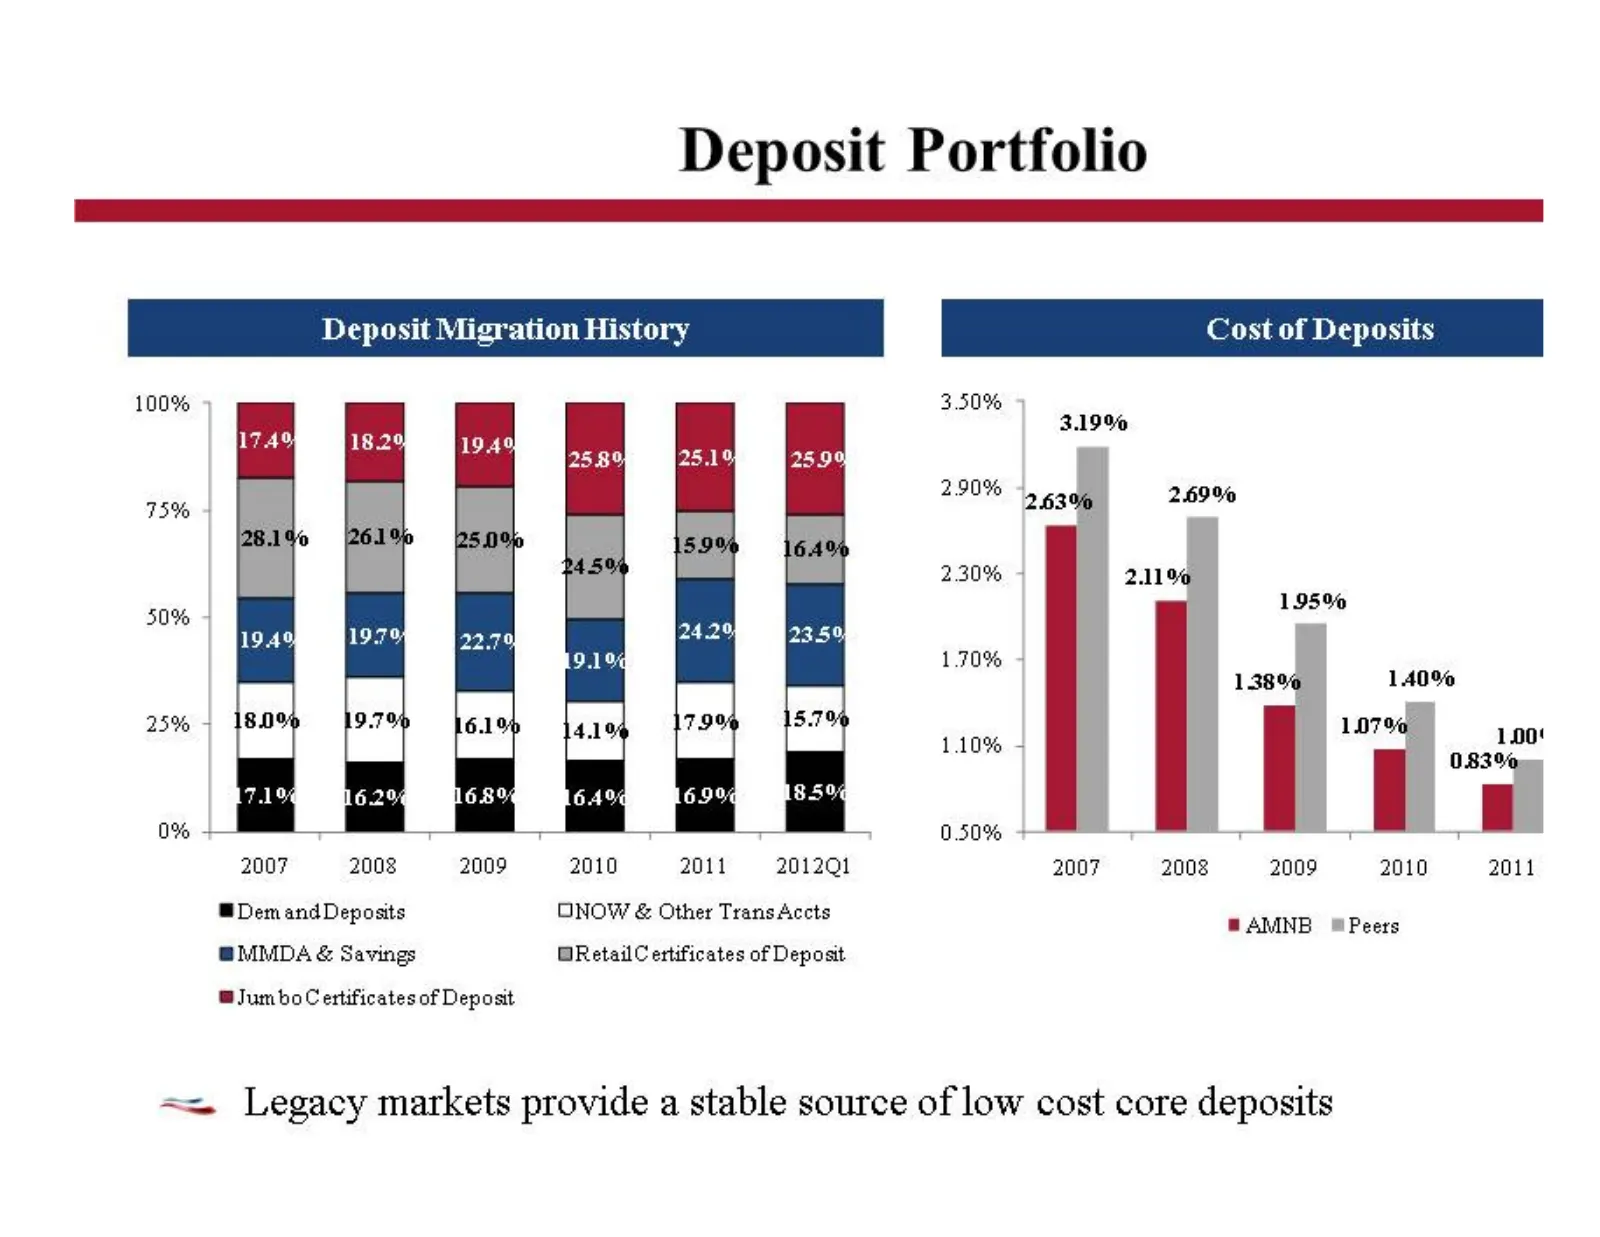
Slide 20: Deposit Portfolio
Deposit Portfolio Deposit Migration History ost of Deposits 100% 3.50% 3.19% 290% 4 75% 4 263 269% 2.30% + 2.11 50% 4 195% 1.70% 4 138 140% 25% 107 J 1.00‘ 1.10% 1 083 0% T T T 0.50% + T t T : 2007 2003 2009 2010 2011 2012Q1 2007 2003 2009 2010 2011 @ Demand Deposits ONOW & Other Trans Accts = AMNB
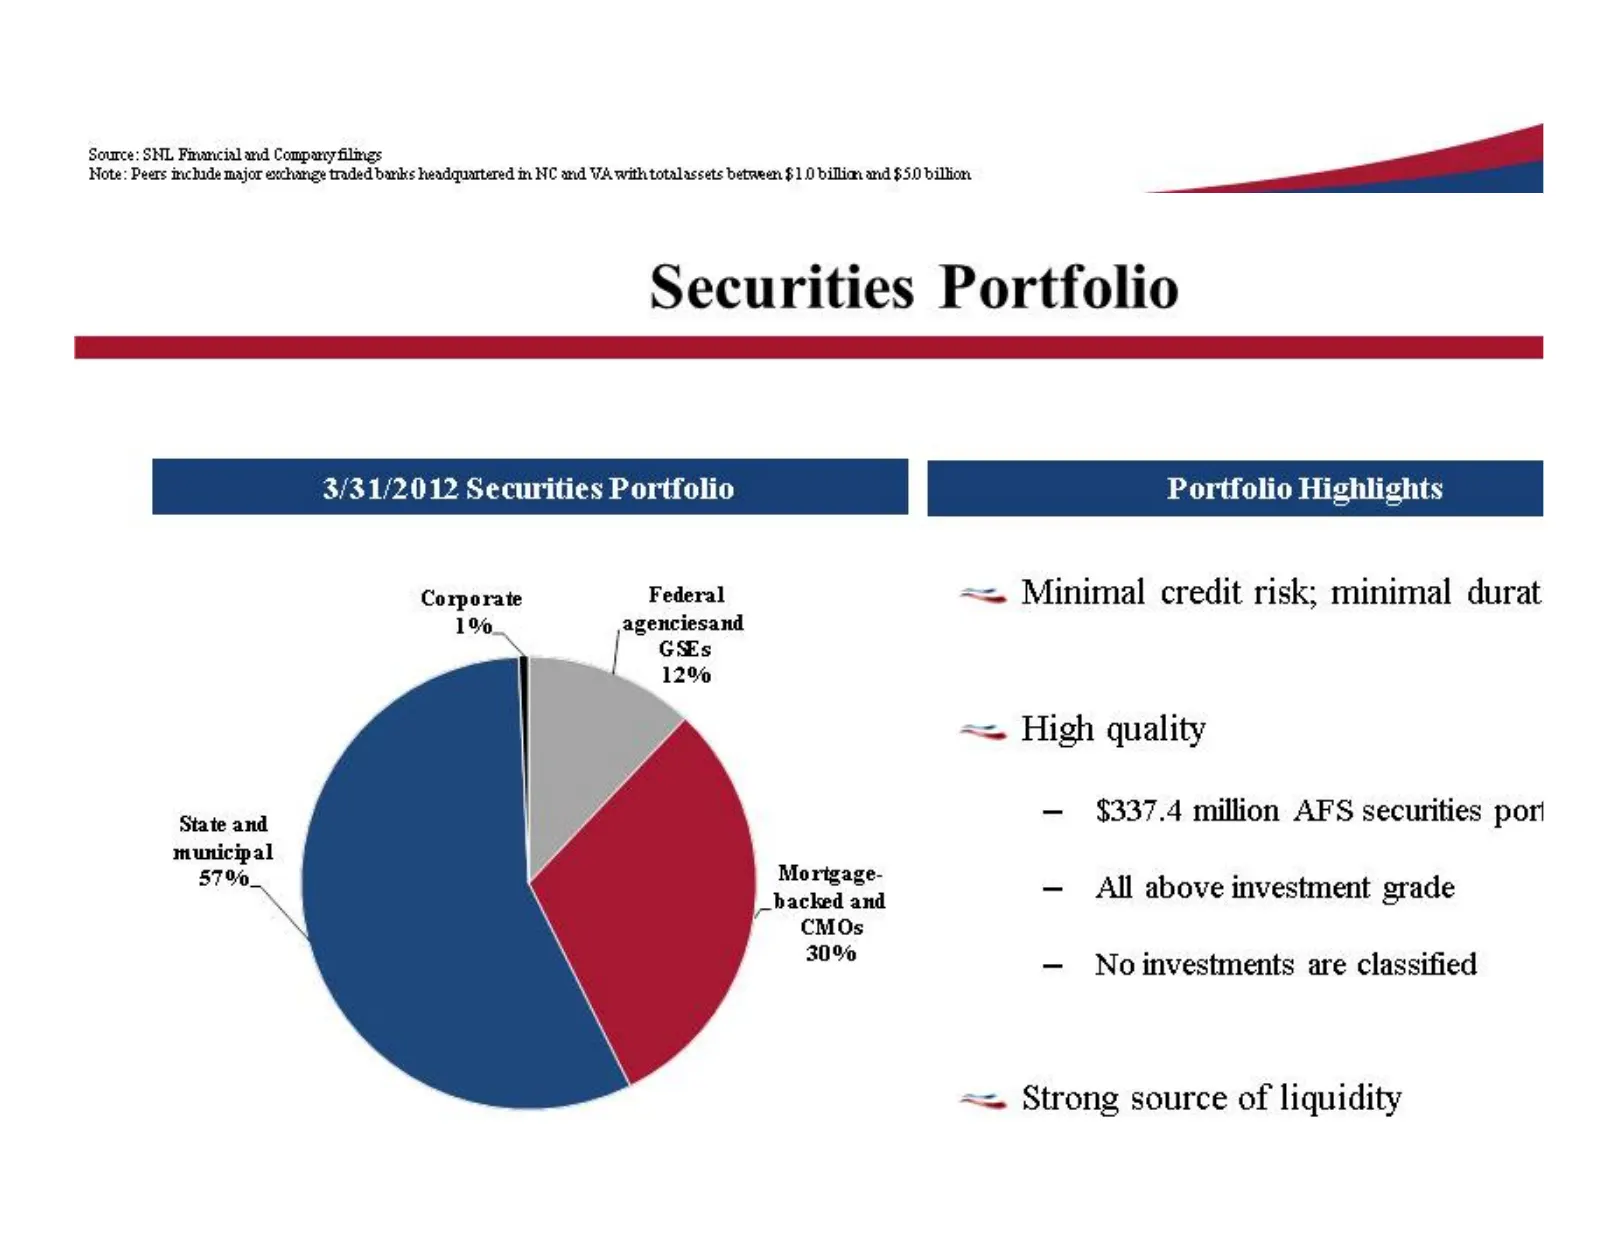
Slide 21: Securities Portfolio
Source: SNL Firancial and Company filmgs ‘Note: Peers muchade major exchange traded barks headquartered m NC and VA with totalassets between $10 billions amd $50 billion Securities Portfolio Portfolio Highlights Corporate Federal == Minimal credit risk; minimal durat 1%_ agenciesand GSEs 12% == High
Slide 22: Branch Franchise
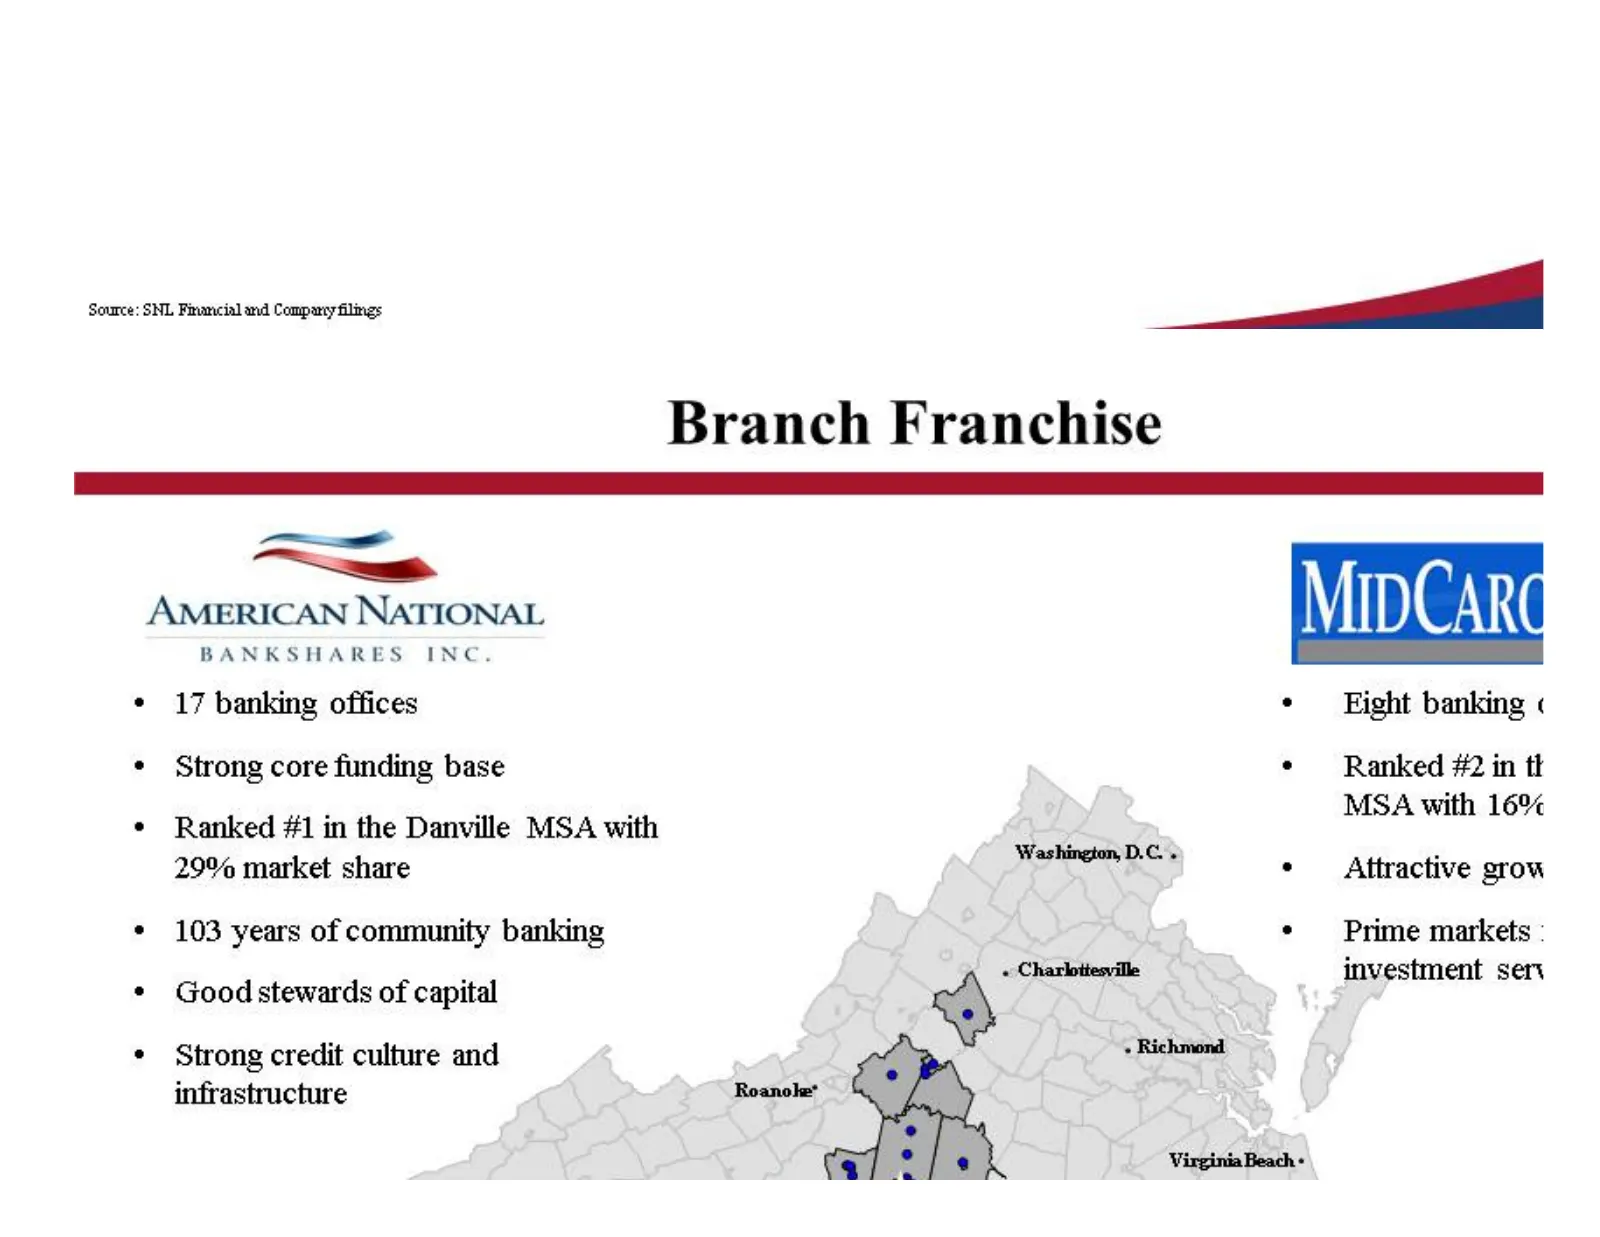
Source: SNL Fawncial and Company Slings — | Branch Franchise _— > AMERICAN NATIONAL MID CAR E BANKSHARES INC. ¢ 17 banking offices ¢ Eight banking « ¢ Strong core funding base ¢ Ranked #2 in tt i 0, * Ranked #1 in the Danville MSA with MSA with 16% 29% market share Washington, D.C. ¢ Attractive srow
Slide 23: Market Share Map
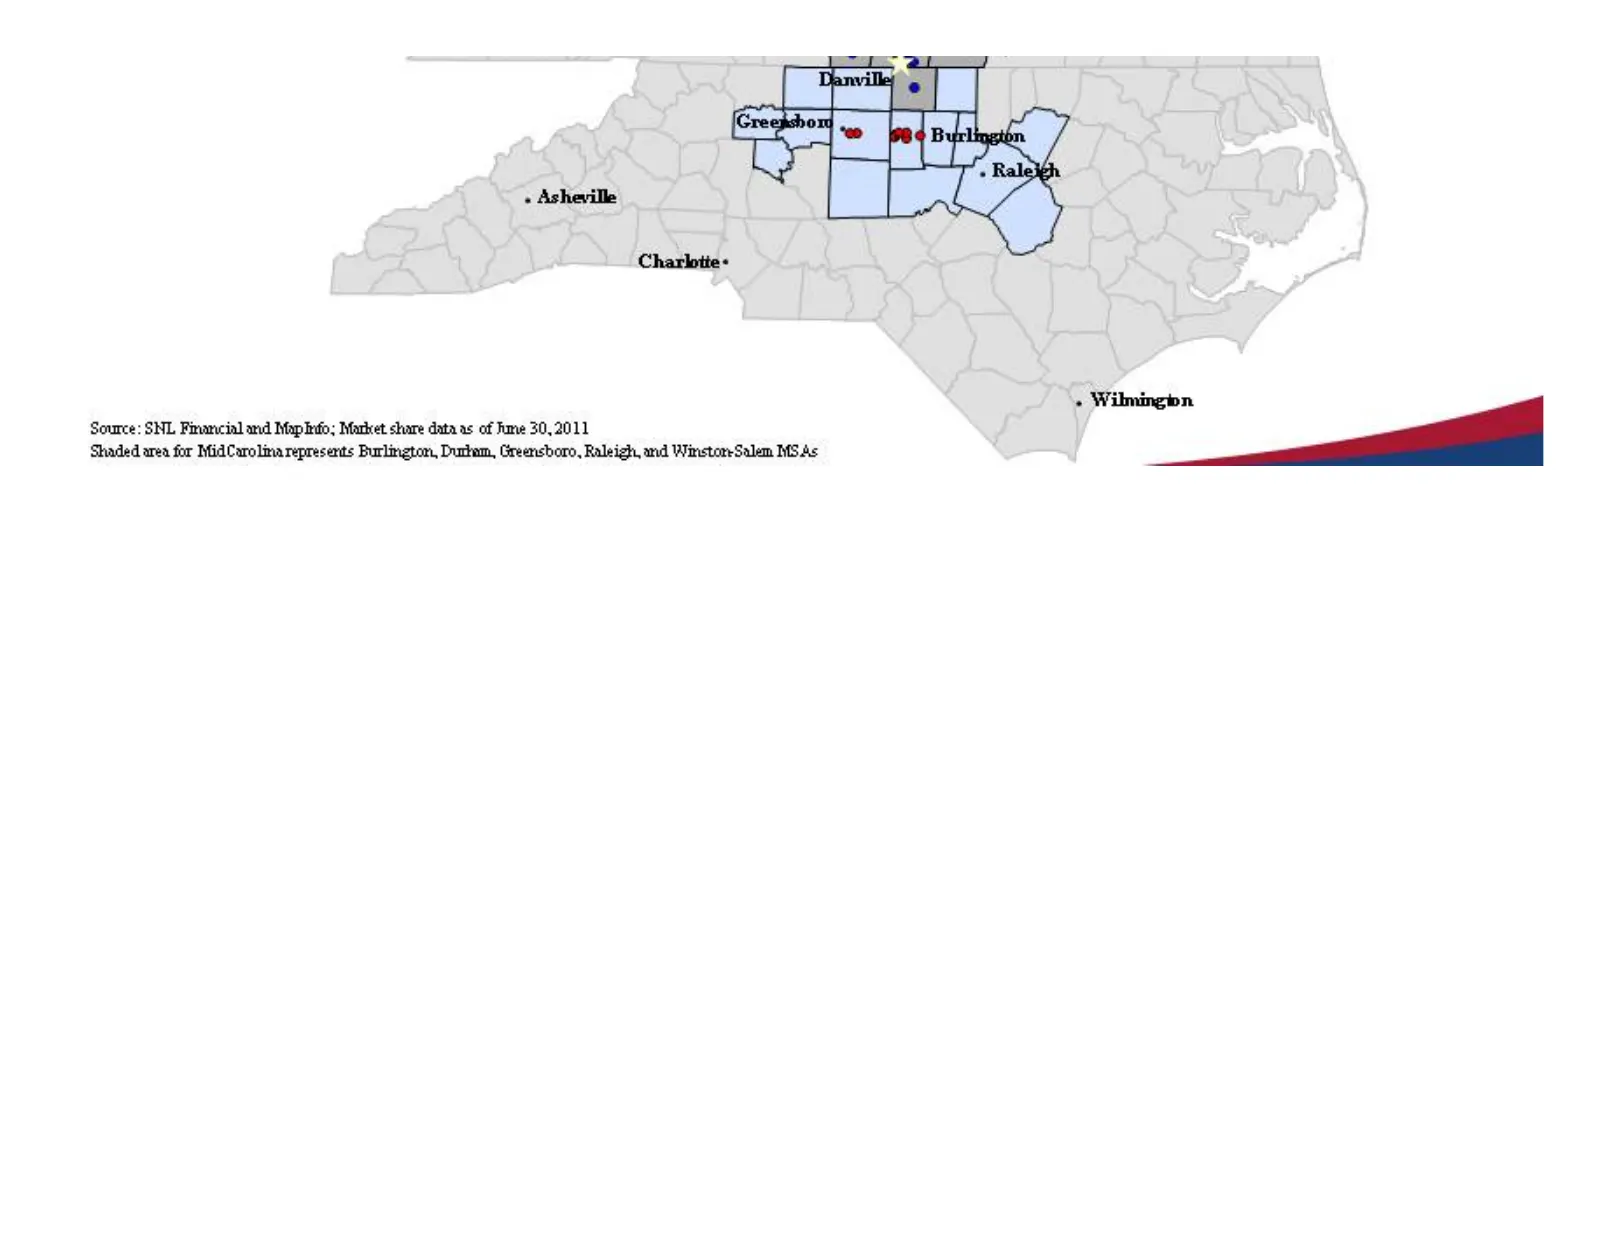
Source: SNL Financial and MapInfo; Market share data as of Fume 30,2011 Shaded area for Mid Carolina represents Burlmgton, Duttam, Greencboro, Raleigh, and Winston-Salem MSs
Slide 24: Why North Carolina?
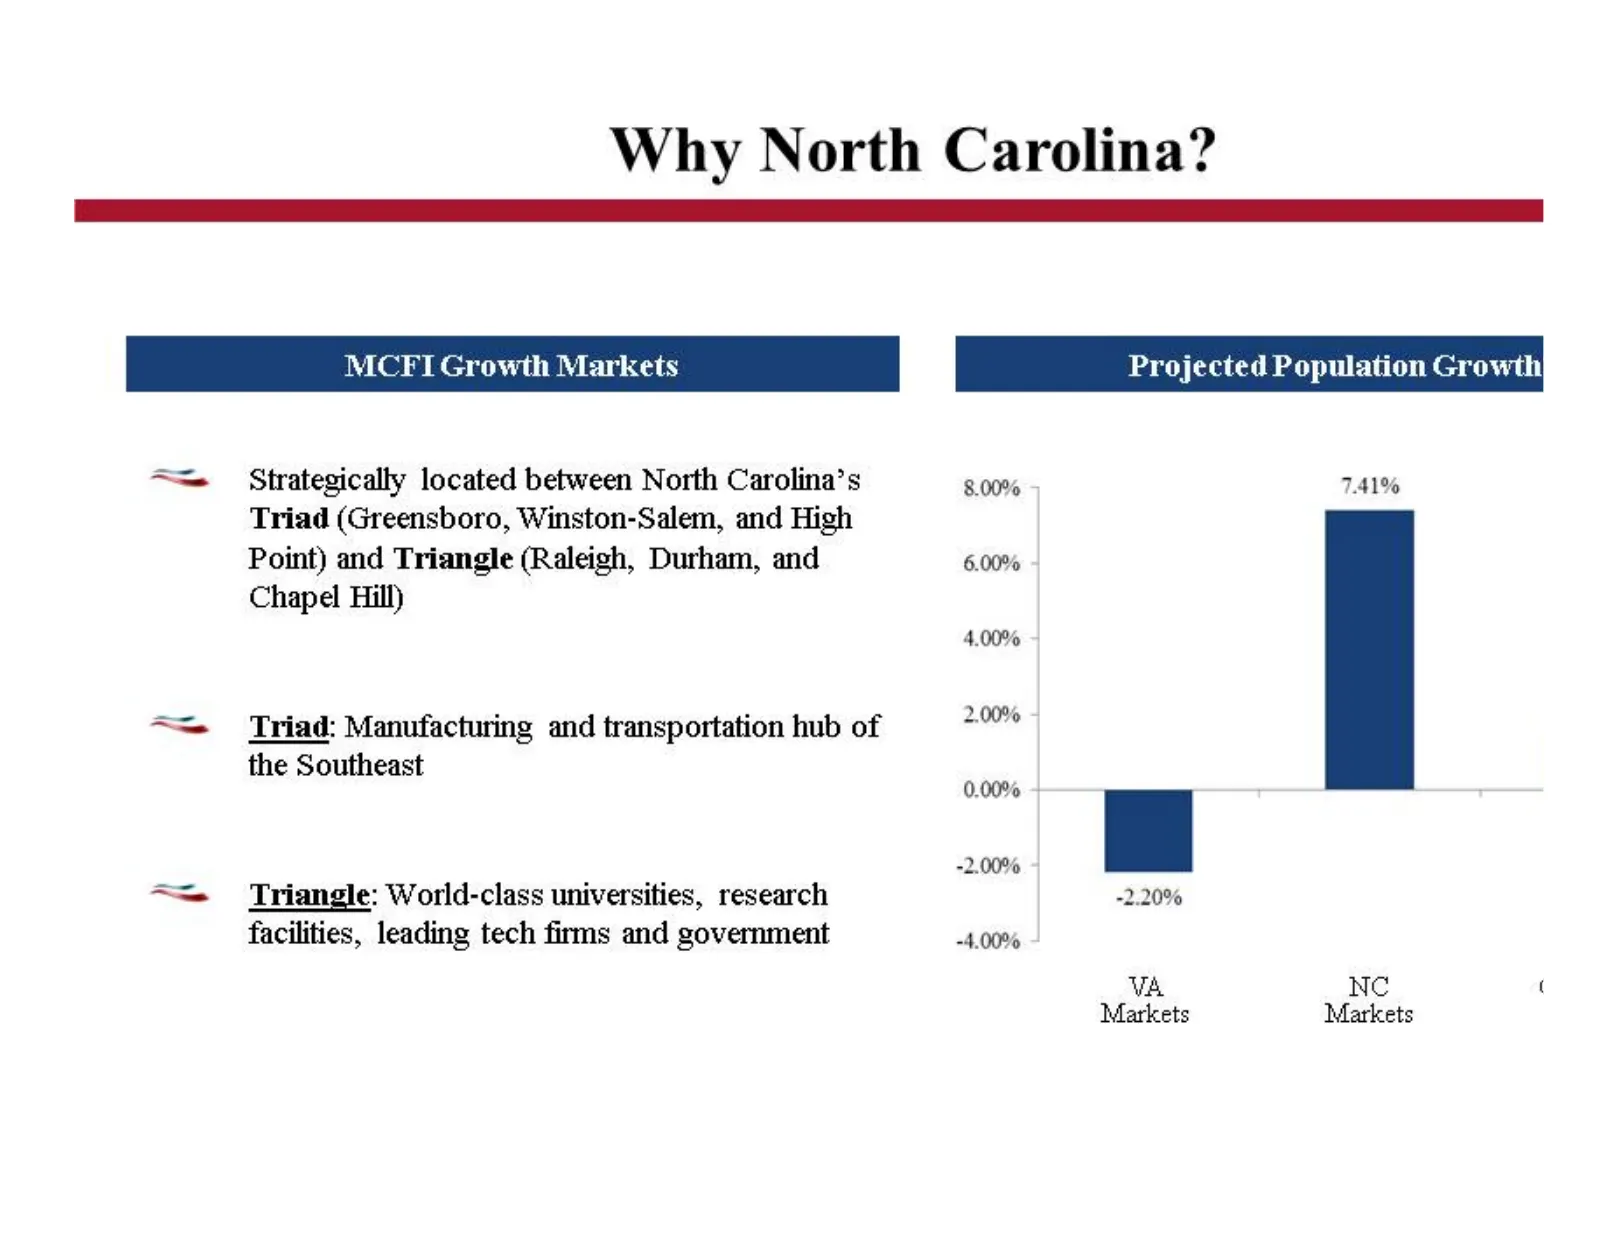
Why North Carolina? MCFI Growth Markets Projected Population Growth = Strategically located between North Carolina’s 8.00% 7.41% Triad (Greensboro, Winston-Salem, and High Point) and Triangle (Raleigh, Durham, and 6.00% Chapel Hill) 4.00% <= Triad: Manufacturing and transportation hub of 2.06 the So
Slide 25: Acquisition of MidCarolina
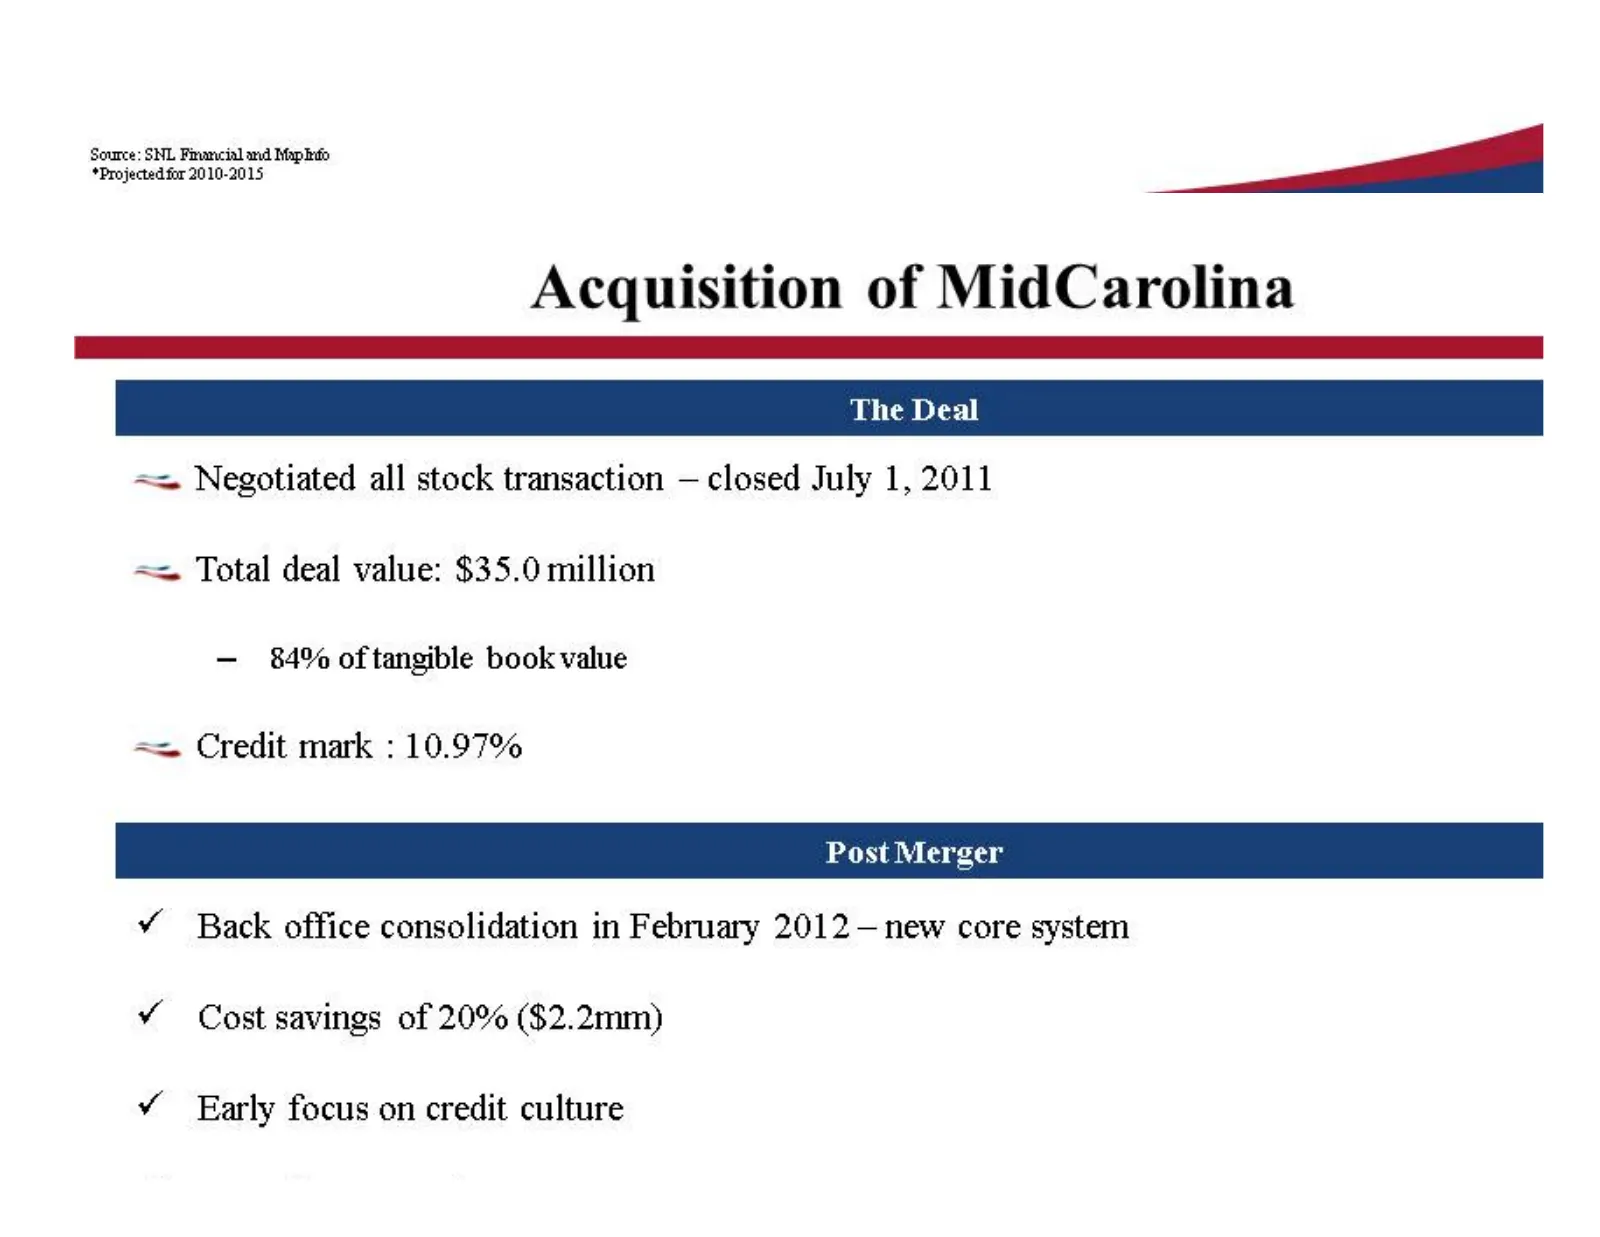
Source: SNL Financial and Map hifo *Projected for 2010-2015 | Acquisition of MidCarolina EEE == Negotiated all stock transaction — closed July 1, 2011 == Total deal value: $35.0 million — 84% oftangible book value == Credit mark : 10.97% Post Merger ¥ Back office consolidation in February 2012 —new
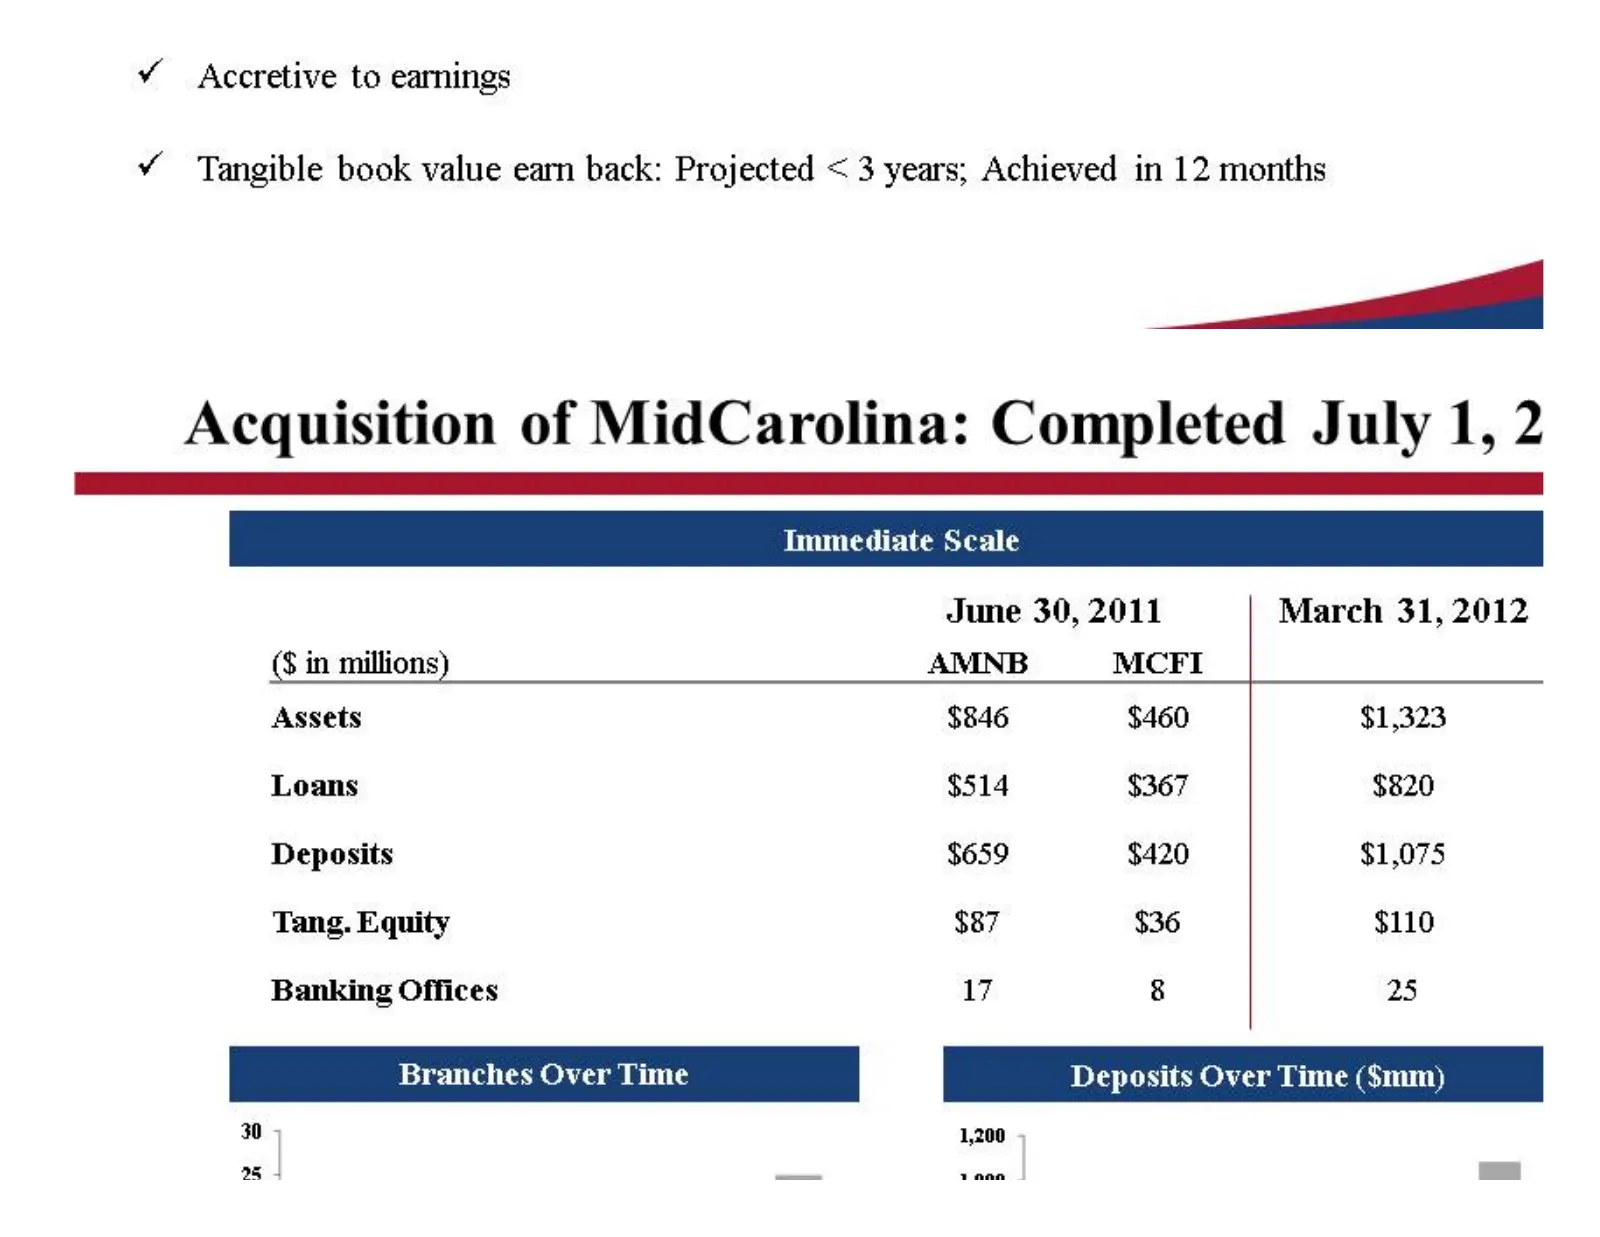
Slide 26: Acquisition of MidCarolina: Immediate Scale
¥ Accretive to earnings ¥ Tangible book value earn back: Projected < 3 years; Achieved in 12 months — Acquisition of MidCarolina: Completed July 1, 2 ESSSSSSSSSSS__=_S_=========—=========_—==_—======= Immediate Scale June 30, 2011 March 31, 2012 ($ in millions) AMNB MCFI Assets $846 $460 $1,323 Loan
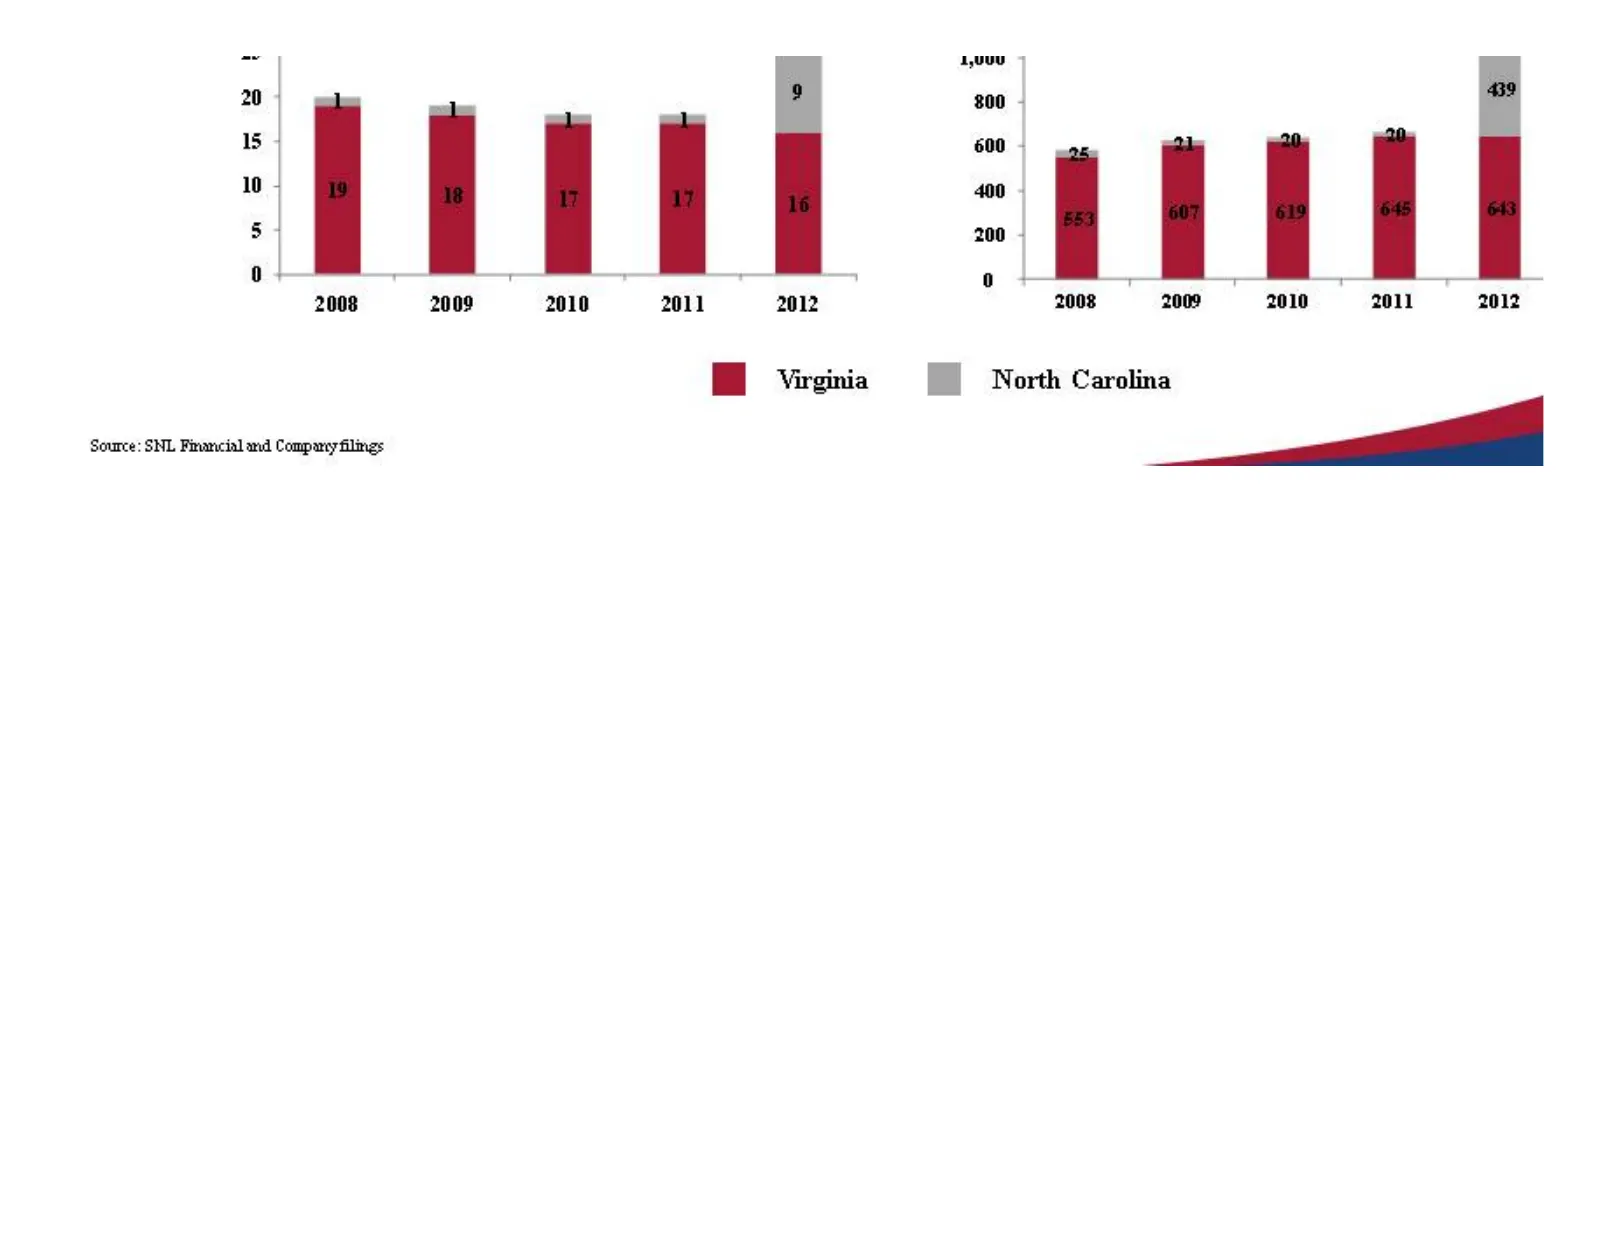
Slide 27: Branches and Deposits Over Time
TEOGD Zane 2010 2011 2012 2010 2011 2012 Wo ovrgnia =f) North Carolina Source: SHI Pounce] and Comparer igs —
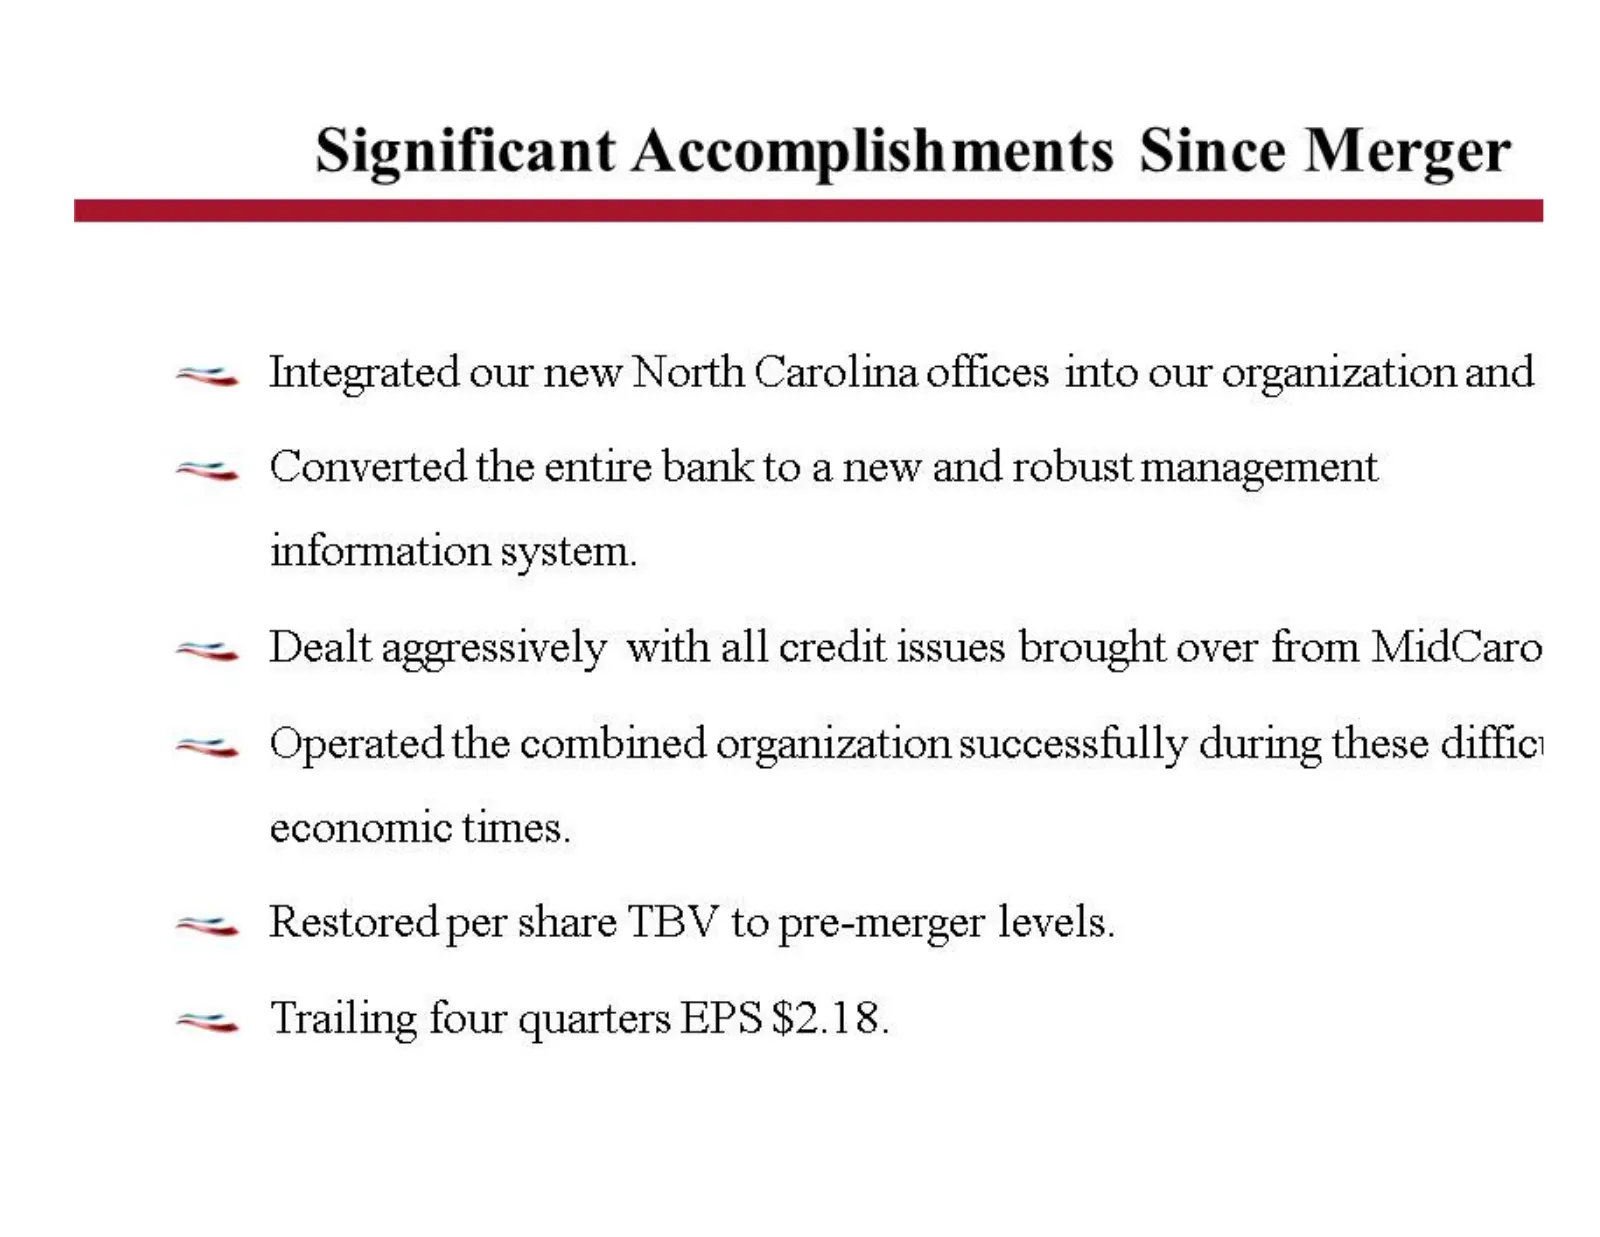
Slide 28: Significant Accomplishments Since Merger
Significant Accomplishments Since Merger == Integrated our new North Carolina offices into our organization and == Converted the entire bank to a new and robust management information system. == Dealt aggressively with all credit issues brought over from MidCaro == Operated the combined organization
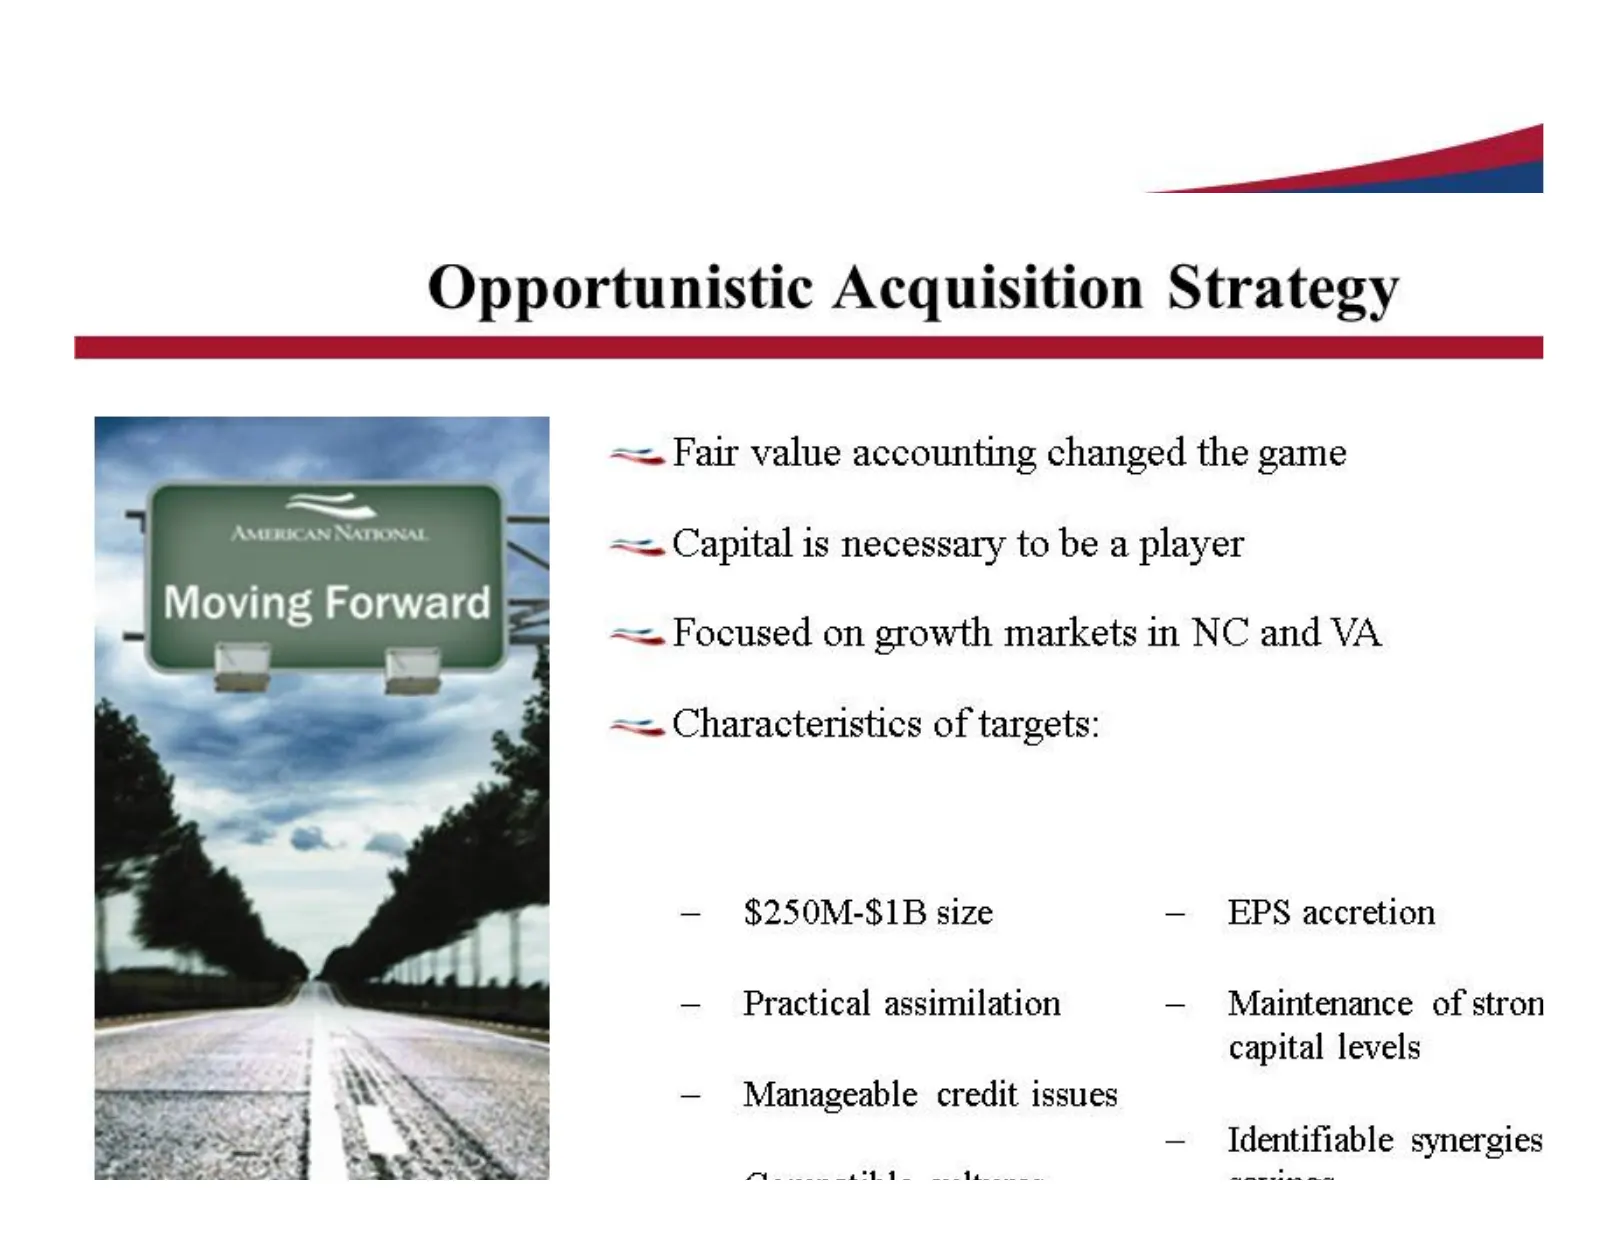
Slide 29: Opportunistic Acquisition Strategy
— Opportunistic Acquisition Strategy == Fair value accounting changed the game — a AMERICAN NATIONAL == Capital is necessary to be a player Moving Forward == Focused on growth markets in NC and VA == Characteristics of targets: — $250M-$1B size — EPS accretion — Practical assimilation — Maintenance
Slide 30: AMNB Acquisition Cycle
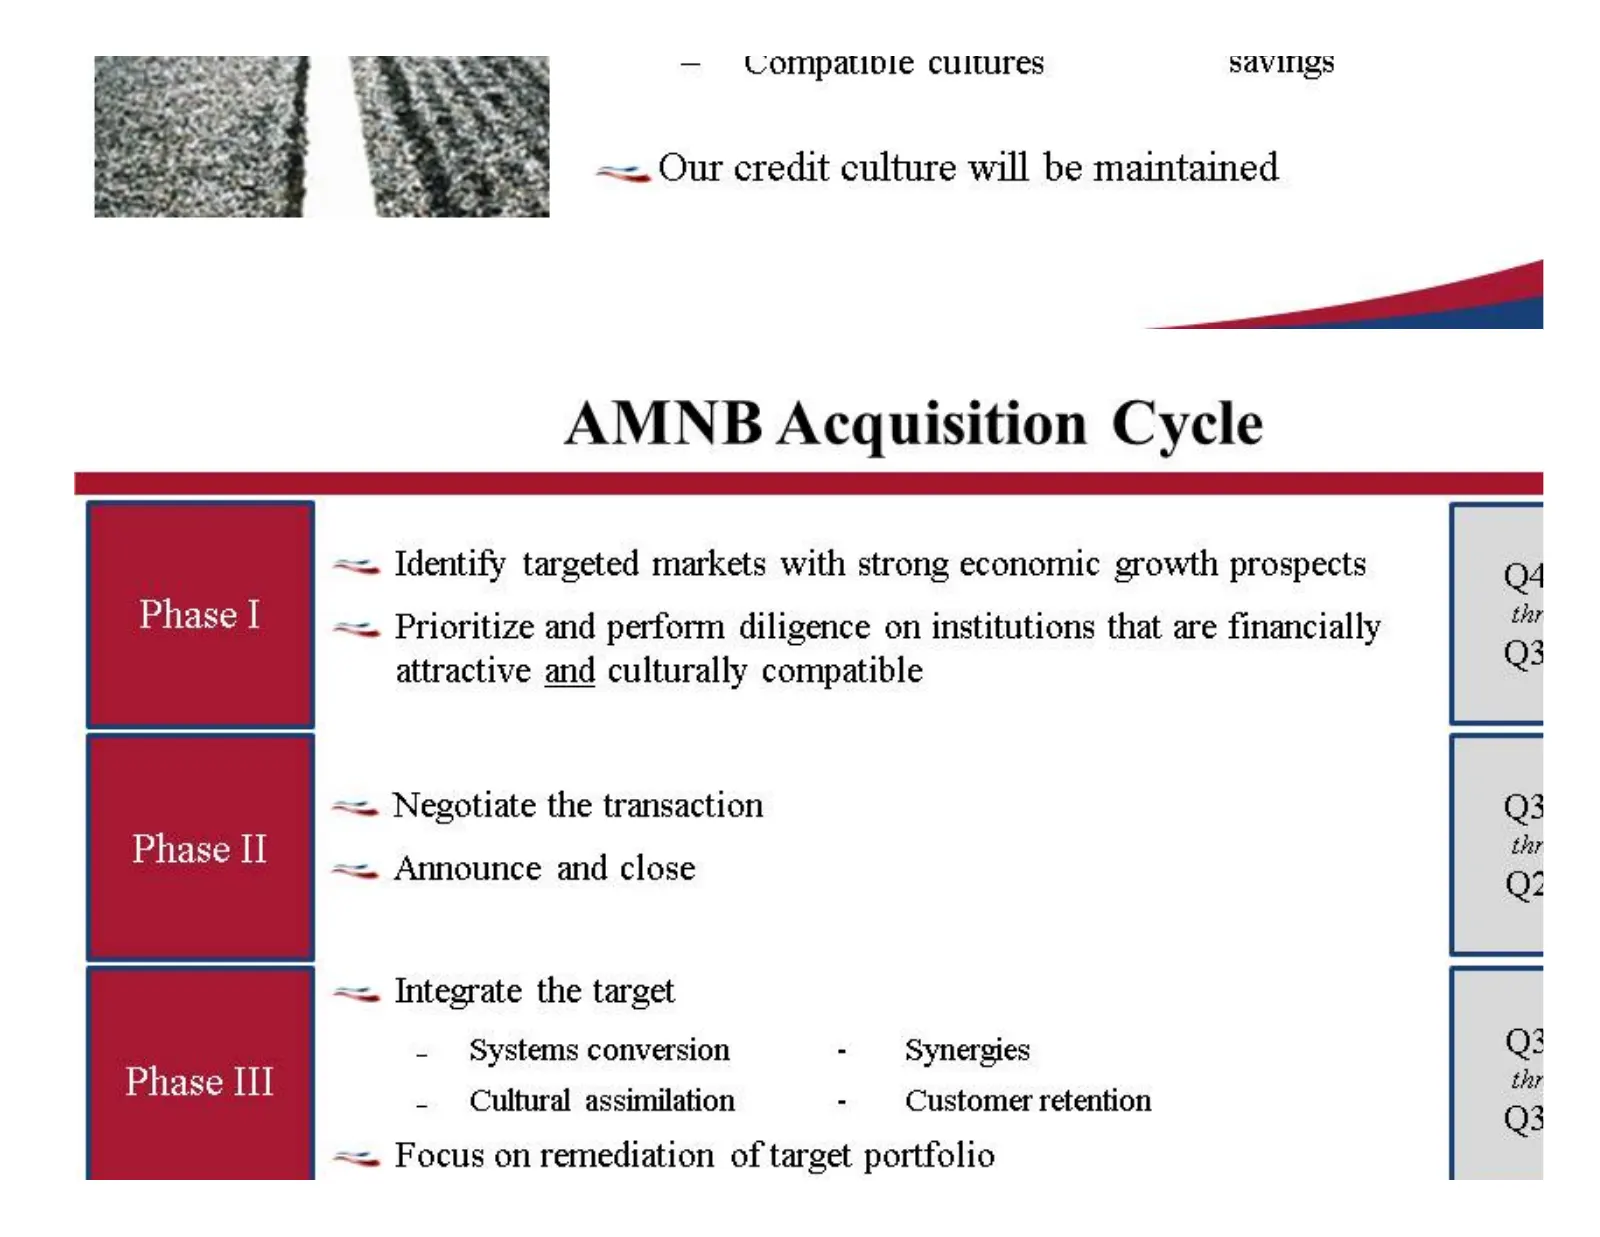
— Compatible cultures Savings ==. Our credit culture will be maintained | AMNB Acquisition Cycle == Identify targeted markets with strong economic growth prospects Phase | == Prioritize and perform diligence on institutions that are financially attractive and culturally compatible == Negotiate the t
Slide 31: Acquisition Cycle: Transition to Growth
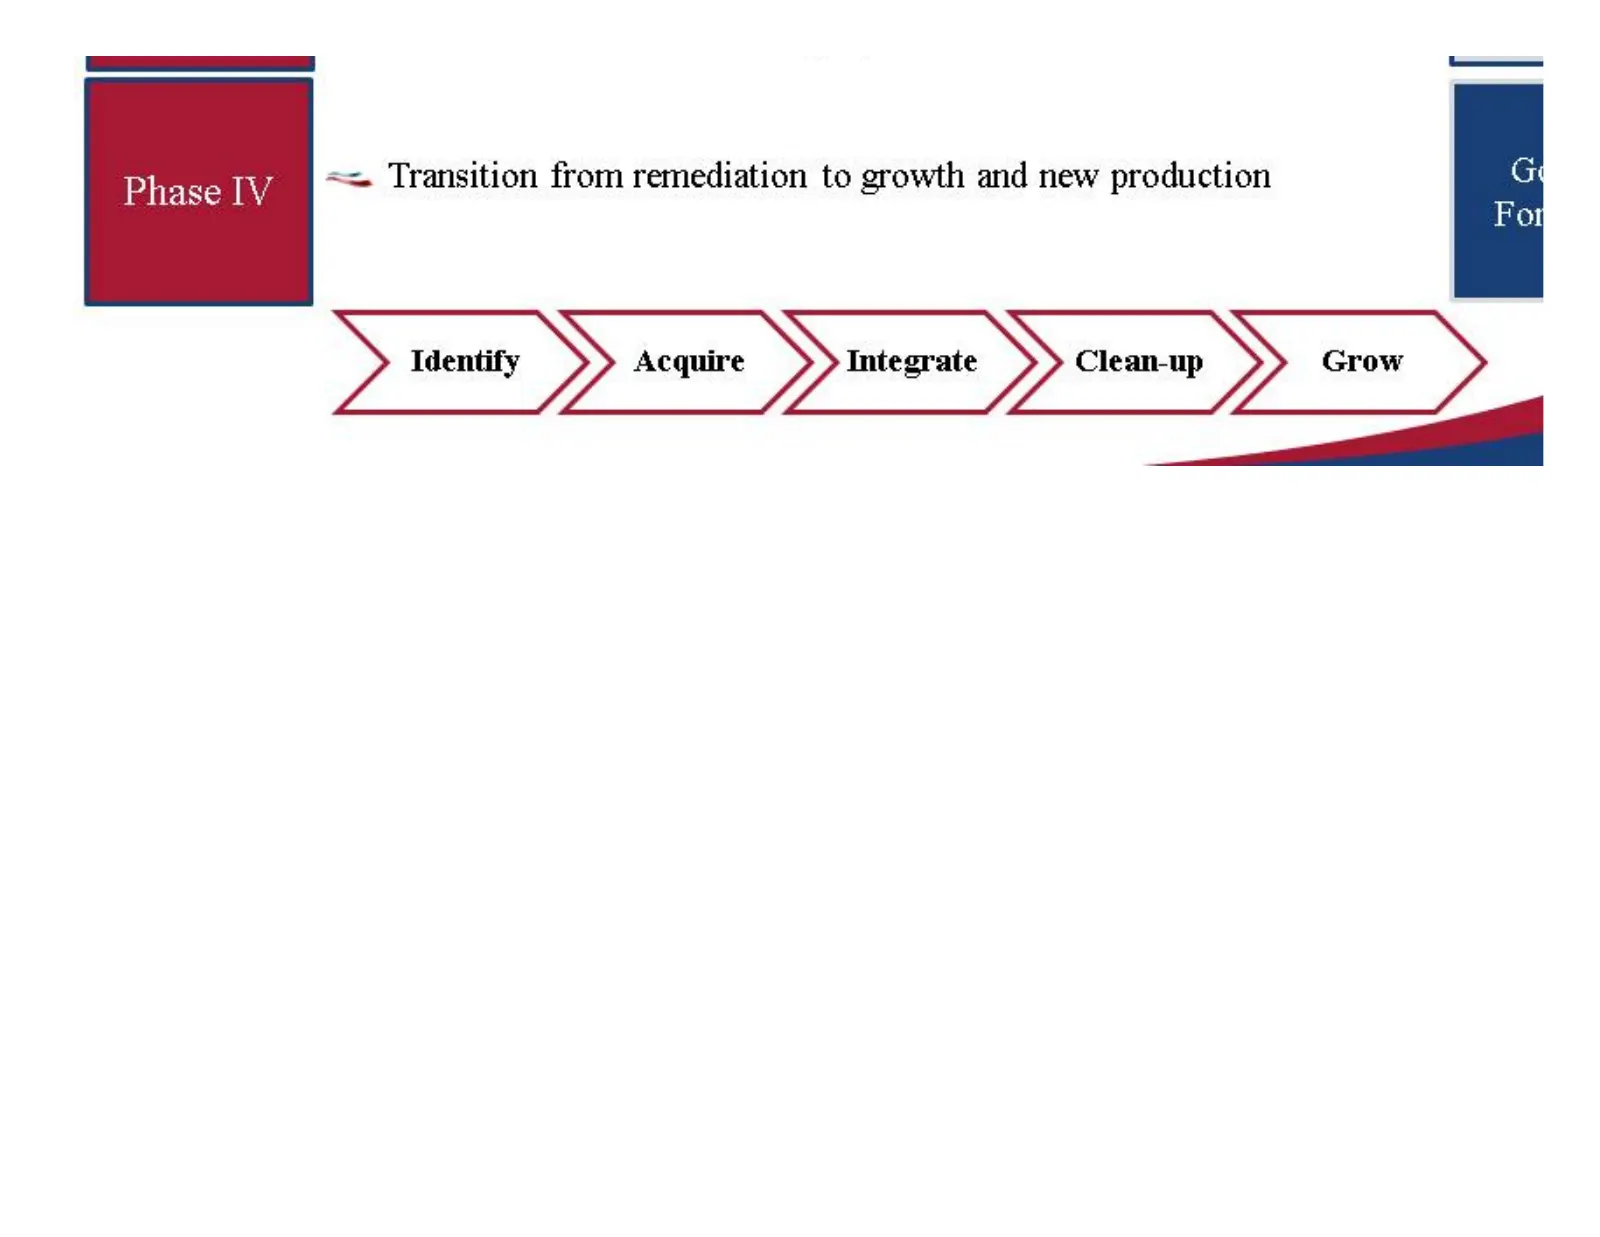
== Transition from remediation to growth and new production > Identity » Acquire => => crew >
Slide 32: Summary
Summary
Slide 33: Nationwide Q1 Comparison
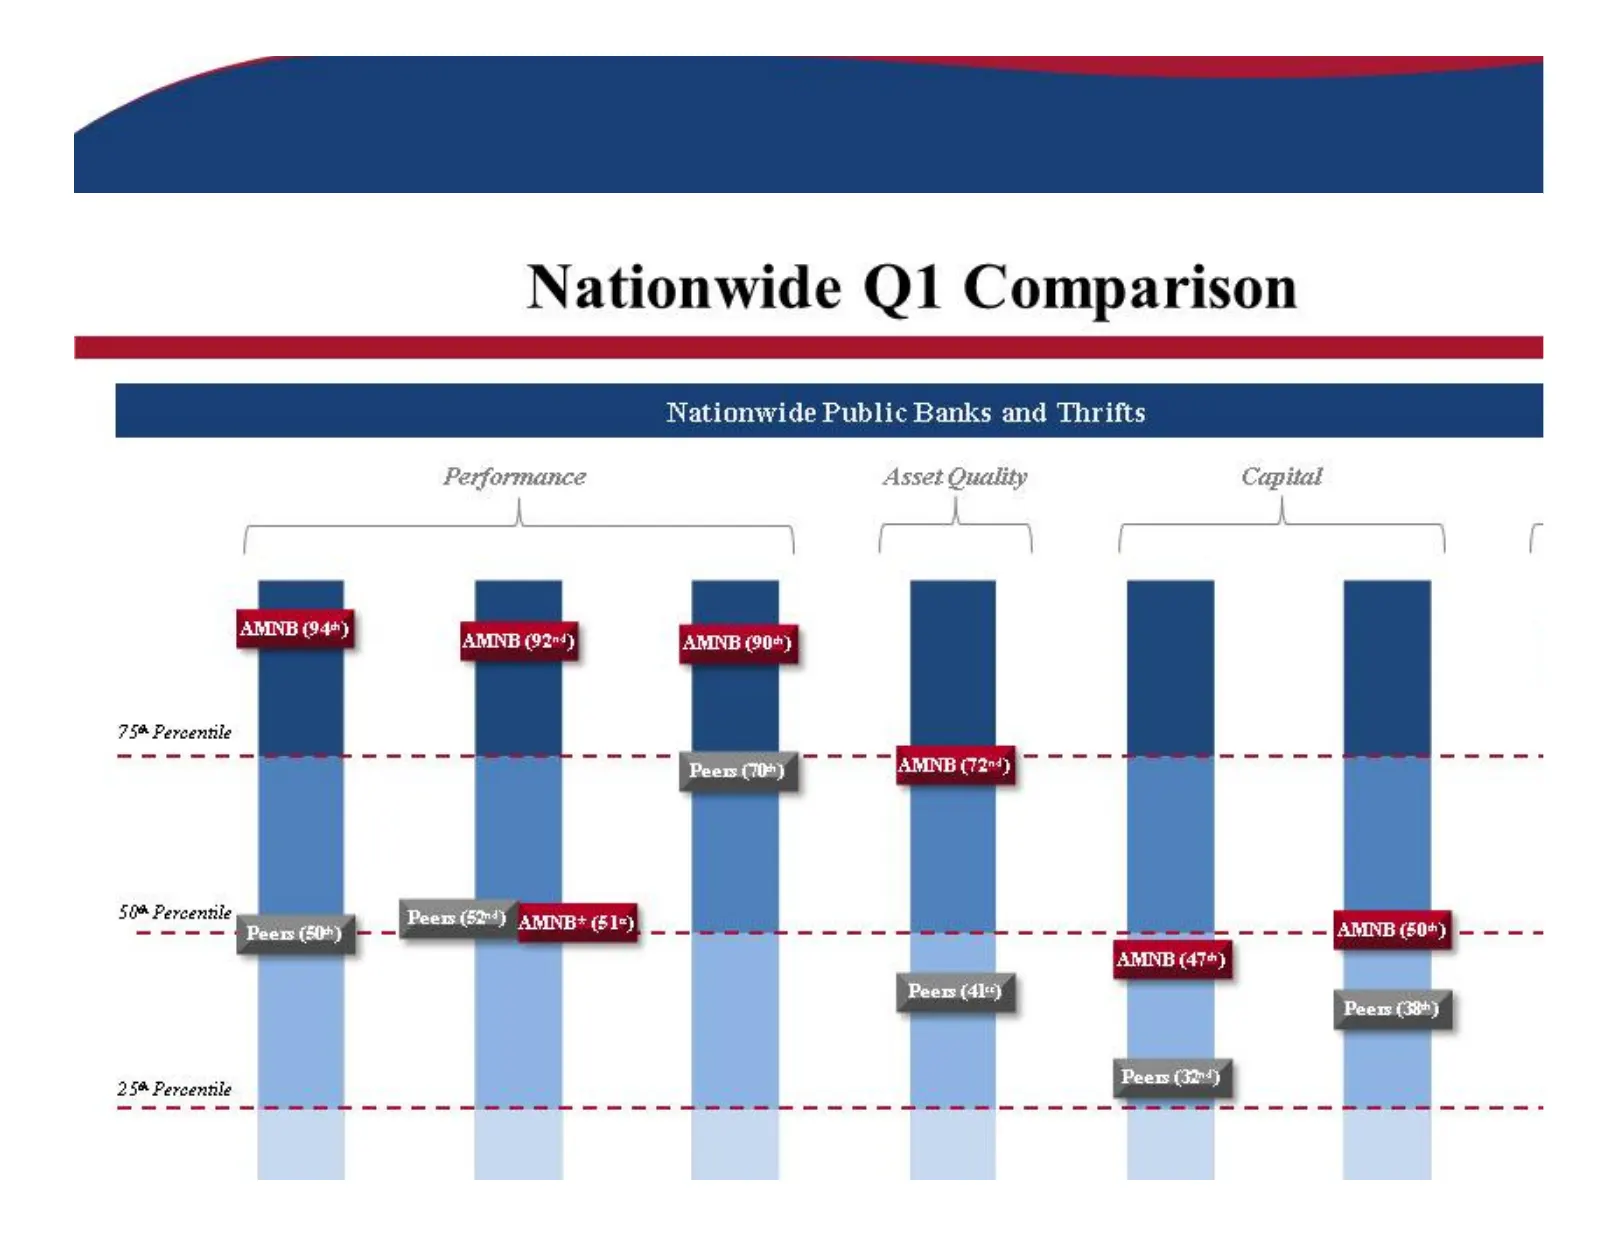
Nationwide Q1 Comparison Performance Asset Quaility Capitat | _——— | AMNB (94%) AMINE (92"4) AMNB (90%) 754 Percentile 50% Percentile Peem(62%} a MNBt (51=) AMNE (50*) Ee Peers (38) 254 Percentile
Slide 34: Peer Metrics and Summary
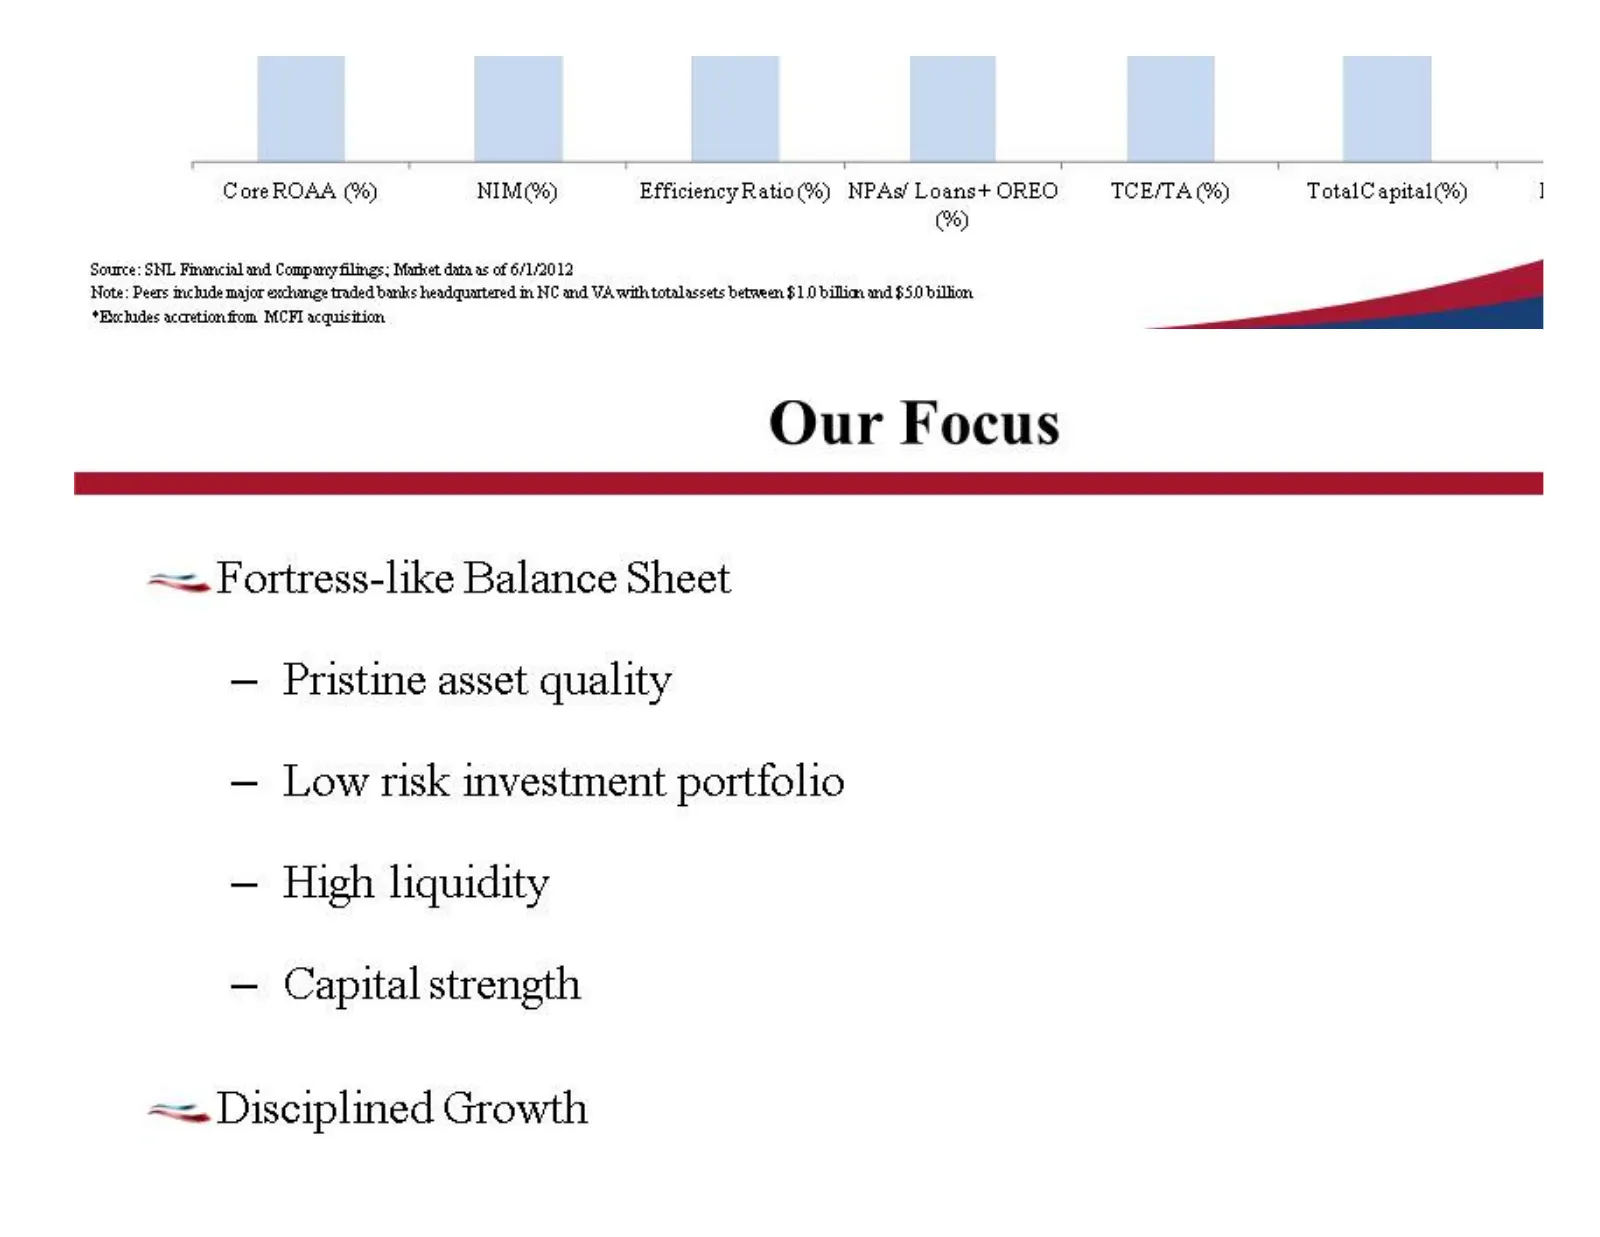
Core ROAA (%) NIM(%) EfficiencyRatio(%) NPAs’LoanstOREO — TCE/TA(%) TotalC apital(%) 1 (%) Source: SNL Frrancial and Company filmgs; Market data as of 6/1/2012 Note: Peers imchade major exchange traded barks headquartered im NC and VA with totalassets between $1.0 billion and $50 billion *Exchades a
Slide 35: Disciplined Growth
— Organic — External == Strong earnings stream
Slide 36: Q2 2012 Highlights
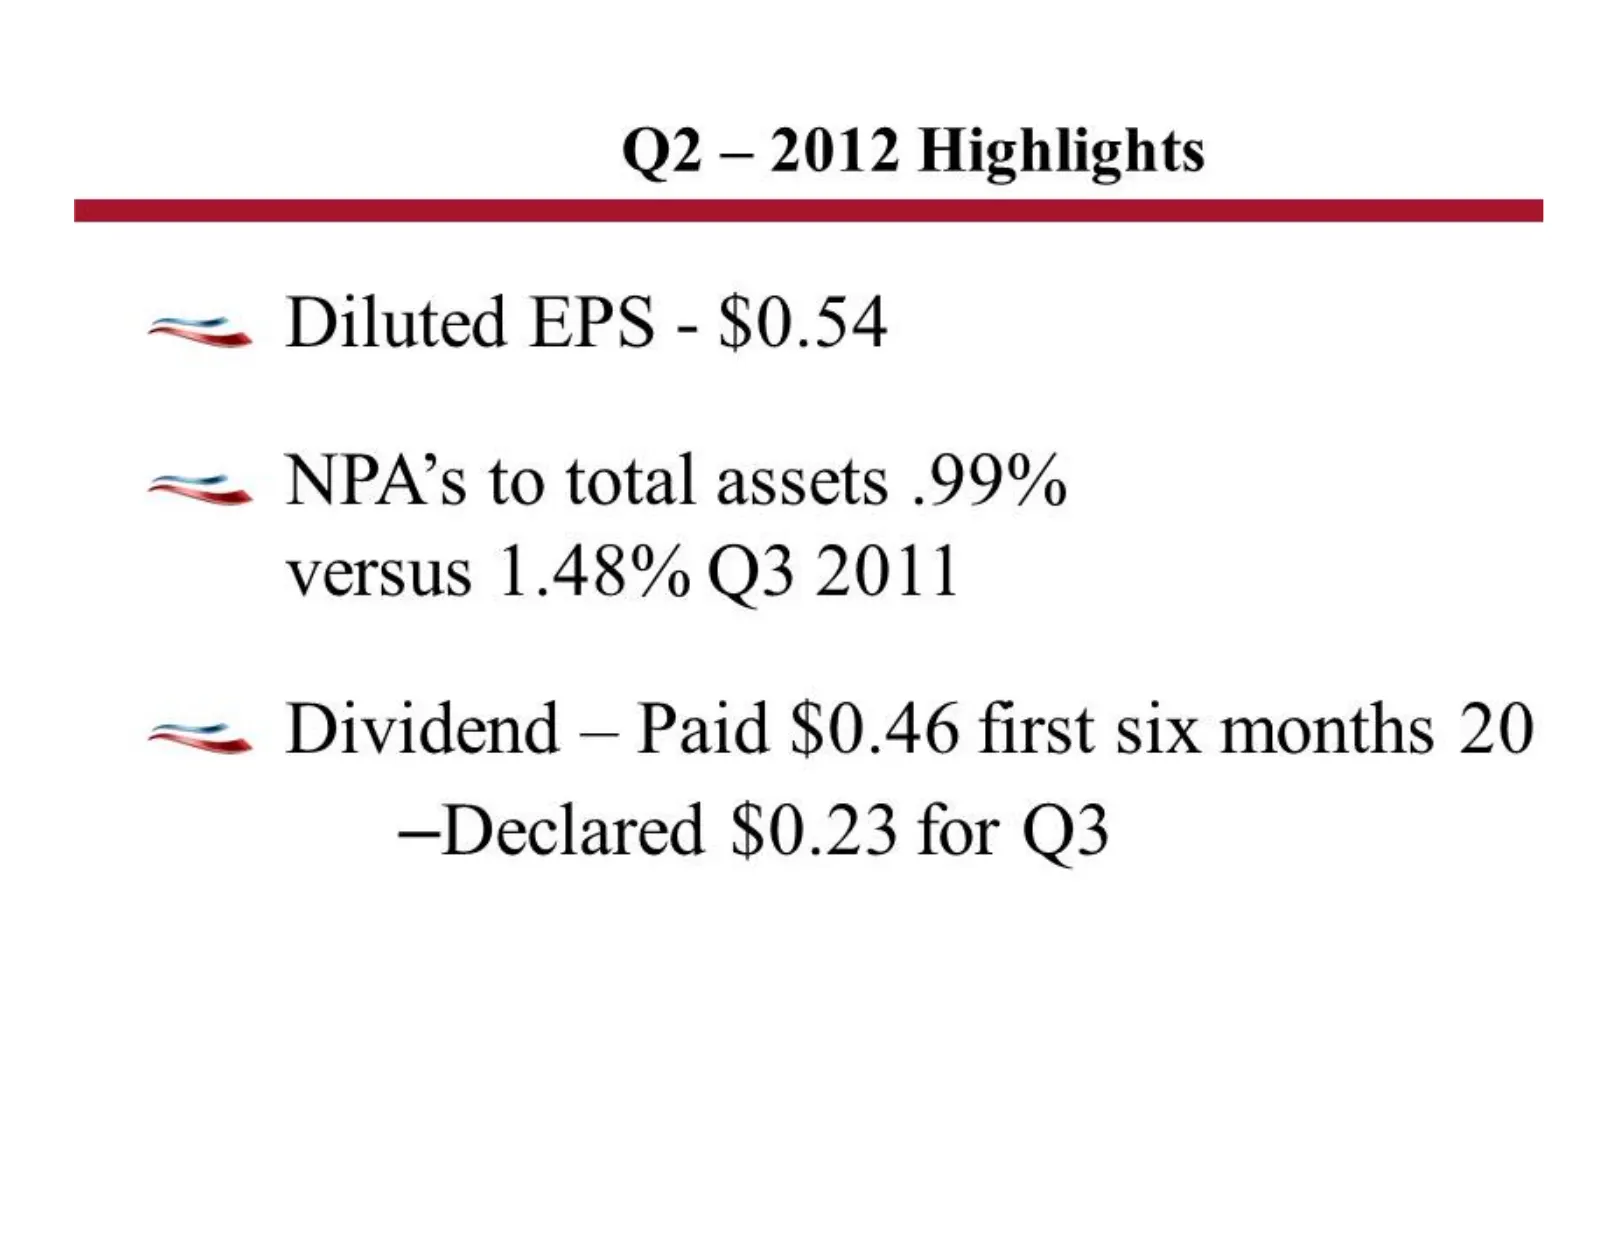
Q?2 — 2012 Highlights == Diluted EPS - $0.54 ==. NPA’s to total assets .99% versus 1.48% Q3 2011 ==. Dividend — Paid $0.46 first six months 20 —Declared $0.23 for Q3
Slide 37: American National - Your Relationship Bank
—————— —— AMERICAN NATIONAL Your Relationship Bank

Slide 38
Source: SEC EDGAR · 8-K filed Aug 1, 2012
More decks from American National Bankshares Inc
 Investor Presentation (July 2022)32 slides · Jul 27, 2022
 Investor Presentation (June 2022)32 slides · Jun 14, 2022
 Investor Presentation (May 2021)34 slides · May 28, 2021
 Investor Presentation (July 2019)47 slides · Jul 29, 2019
 Investor Presentation (July 2019)47 slides · Jul 8, 2019
 Investor Presentation (March 2019)42 slides · Mar 25, 2019