FNCB Bancorp — Boenning & Scattergood Community Bank Forum 2018
35 slides from FNCB Bancorp's conference presentation, Aug 8, 2018
Slide 1: FNCB Bancorp, Inc. Investor Presentation
© FNCB Bancorp, Inc. Investor Presentation August 2018 Discussion Materials for: Boenning & Scattergood Community Bank Forum 2018 Hershey, PA
Slide 2: Forward-Looking Statement Disclaimer
FORWARD-LOOKING STATEMENT DISCLAIMER FNCB may from time to time make written or oral “forward-looking statements,” including statements contained in our filings with the (‘SEC’), in reports to , and in our other tions, which are made in good faith by us pursuant to the “safe harbor” provisions of th
Slide 3: Full-Service Community Banking in Northeastern Pennsylvania
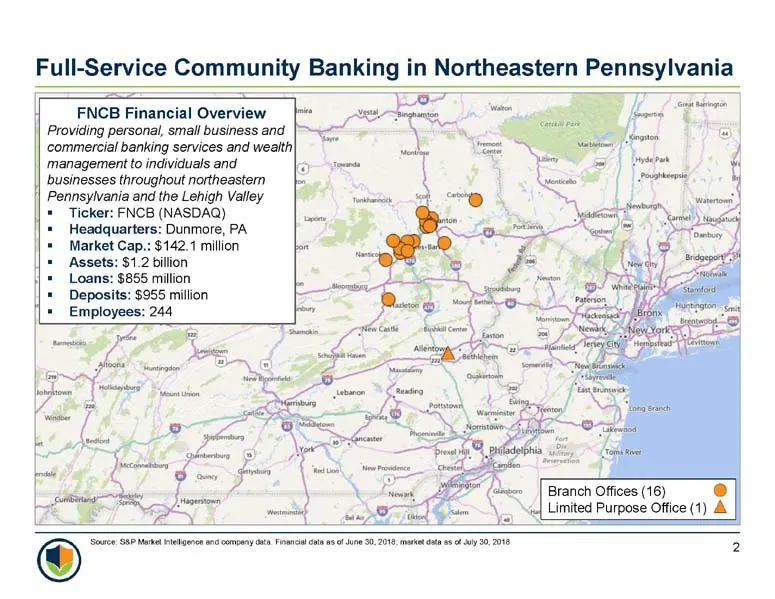
Full-Service Community Banking in Northeastern Pennsylvania FNCB Financial Overview Providing personal, small business and ‘commercial banking services and wealth ‘management to individuals and businesses throughout northeastern Pennsylvania and the Lehigh Valley Ticker: FNCB (NASDAQ) Headquarters:
Slide 4: Recent Financial Performance
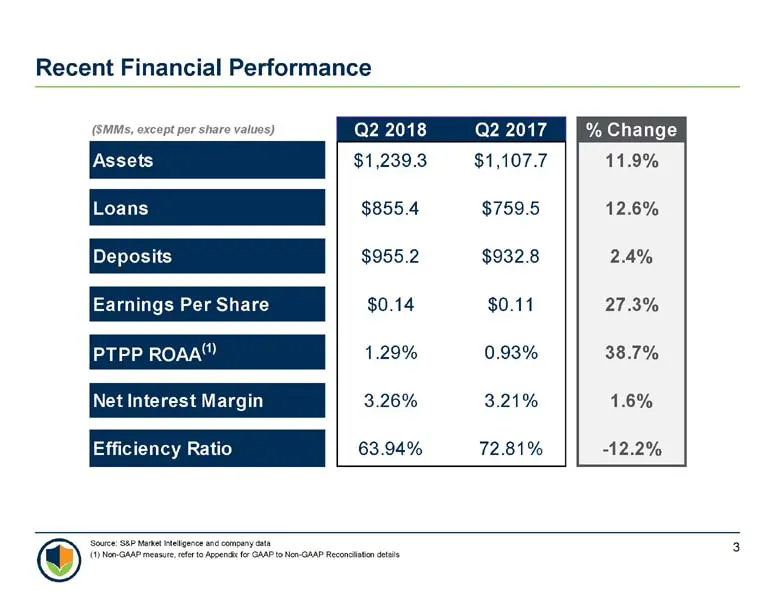
Recent Financial Performance (MMs, except por share values) Q2 2018 Q2 2017 ff % Change Assets $1,239.3 $1,107.7 11.9% Loans $855.4 $759.5 12.6% Deposits $955.2 $932.8 2.4% Earnings Per Share $0.14 $0.11 27.3% PTPP ROAA 1.29% 0.93% 38.7% Net Interest Margin 3.26% 3.21% 1.6% Efficiency Ratio 63.94% 7
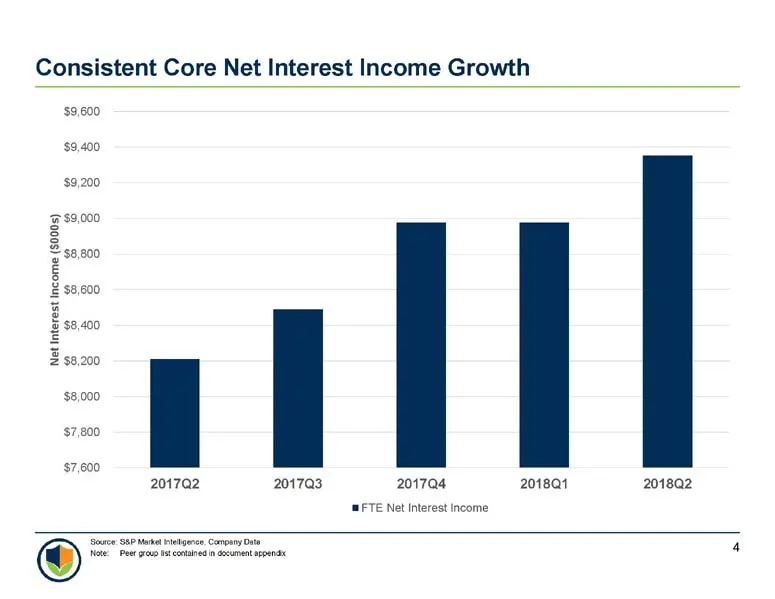
Slide 5: Consistent Core Net Interest Income Growth
Consistent Core Net Interest Income Growth $9,600 $9,400 $9,200 $9,000 $8,400 $8,000 $7,800 $7,800 201702 201703 201704 201801 201802 FTE Net Interest Income Net interest income ($000) 3 8 8 Nate” Pet grt cetatesinsocunent epee
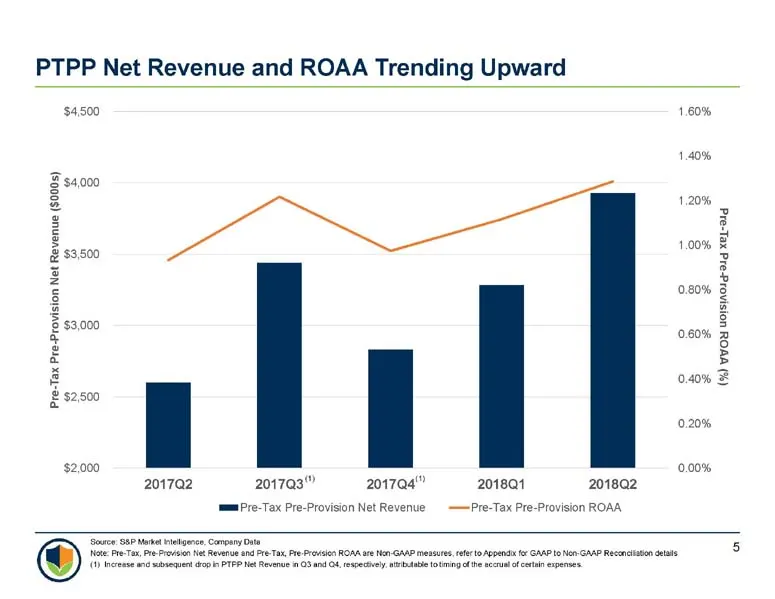
Slide 6: PTPP Net Revenue and ROAA Trending Upward
PTPP Net Revenue and ROAA Trending Upward $4,500 $s4,000 83500 2 3 $3,000 $ & 2500 | $2,000 201702 201793" 201704" 201801 201802 mmPre-Tax Pre-Provision Net Revenue —=Pre-Tax Pre-Provision ROAA 1.60% 1.40% 1.20% 2 3 1.00% & 3 * 0.80% 8 060% 2 E 0.40% & 0.20% 0.00% Nowe Pre-Tax, Pre ronson he Renu aa
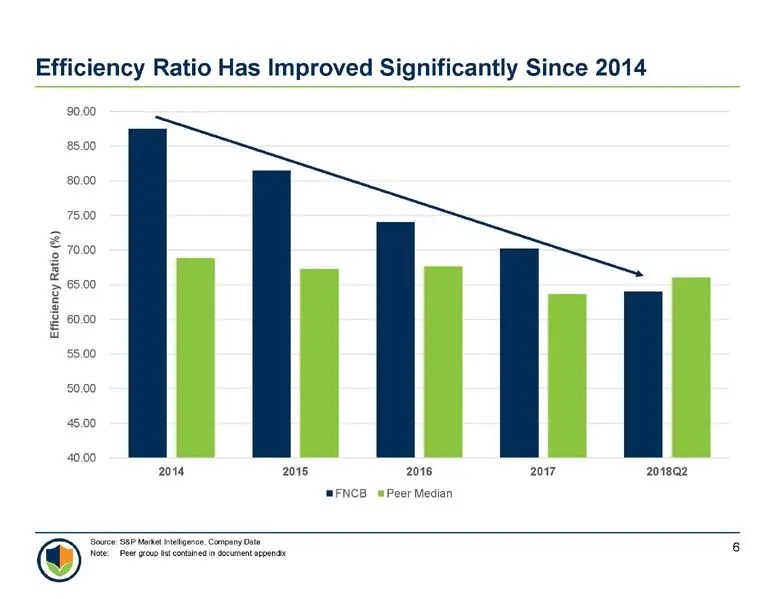
Slide 7: Efficiency Ratio Has Improved Significantly Since 2014
Efficiency Ratio Has Improved Significantly Since 2014 90,00 85.00 80,00 75.00 70.00 65.00 60.00 Efficiency Ratio (%) 55.00 50.00 45,00 40,00 2014 2015 2016 2017 201802 "FNCB m= Peer Median
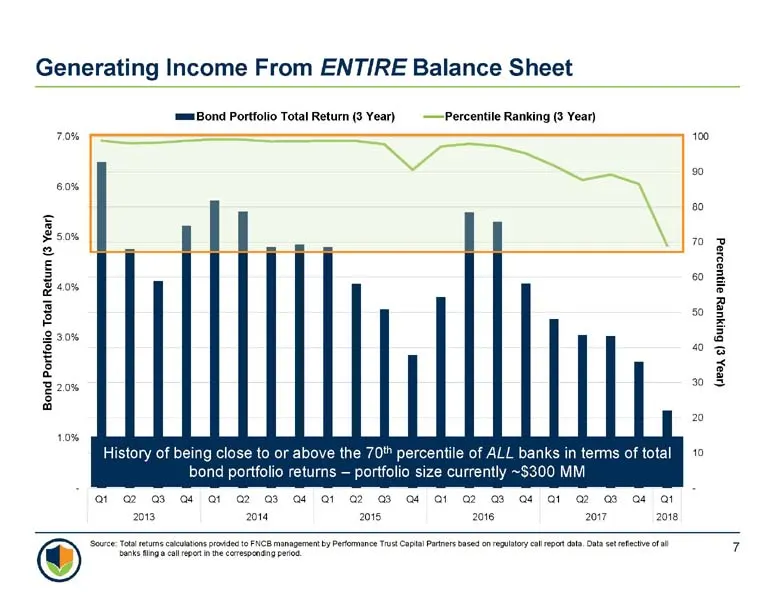
Slide 8: Generating Income From ENTIRE Balance Sheet
Generating Income From ENTIRE Balance Sheet ‘smmBond Portfolio Total Return {3 Year) —Percentile Ranking (3 Year) Bond Portfolio Total Return (3 Year) History of being close to or above the 70" percentile of ALL banks in terms of total bond portfolio returns — portfolio size currently ~$300 MM Or @
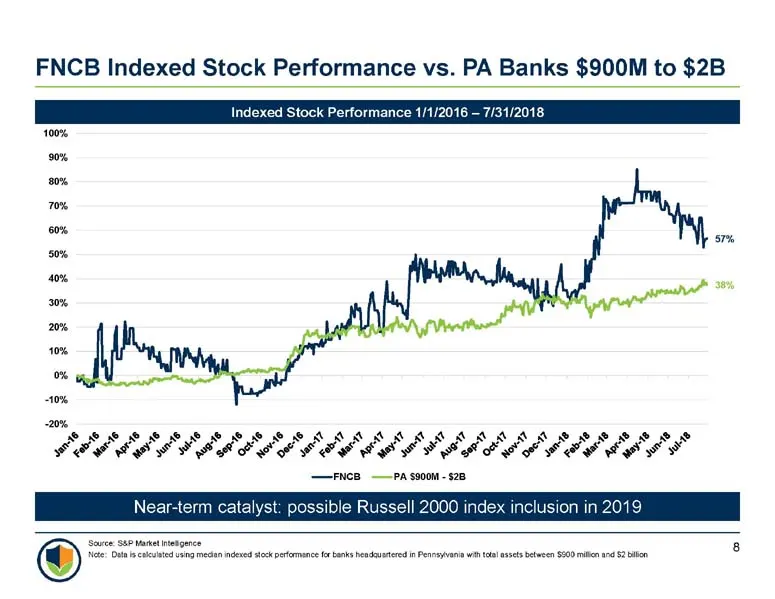
Slide 9: FNCB Indexed Stock Performance vs. PA Banks $900M to $2B
FNCB Indexed Stock Performance vs. PA Banks $900M to $2B wn wt bc 57% om bi) 38% 6 i ee 6 PEPEEPCEPEEP EEA ED? ia POE FEI EELS Near-term catalyst: possible Russell 2000 index inclusion in 2019 ©* Na Daan on dt ned sek pfomnes et hexdsend Pete wh lene nee ON in neon
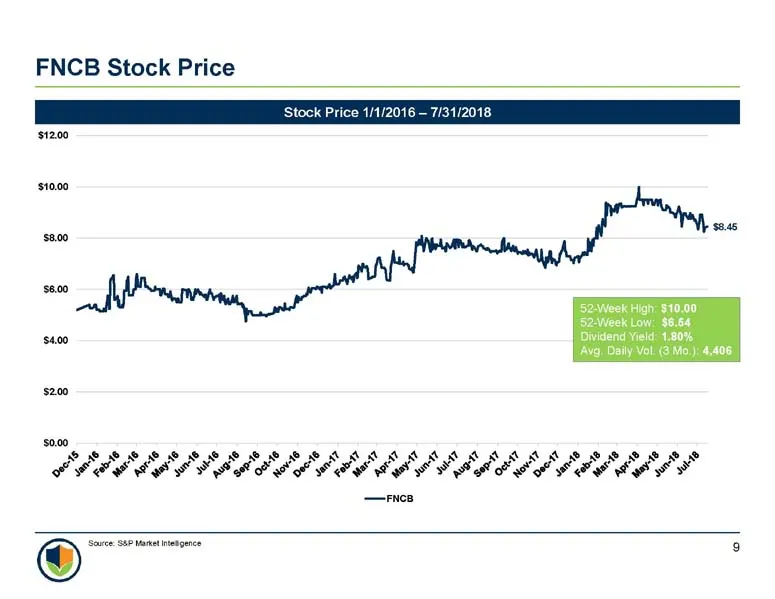
Slide 10: FNCB Stock Price
FNCB Stock Price Stock Price 1/1/2016 — 7/31/2018 ‘$12.00 ‘510.00 $8.00 a bie EE EP gra 2 o © Ror ot 8 2 OS DS Ow PFELLI IISA LEE IEP LL IISA ILLS EP EI IS —rnes
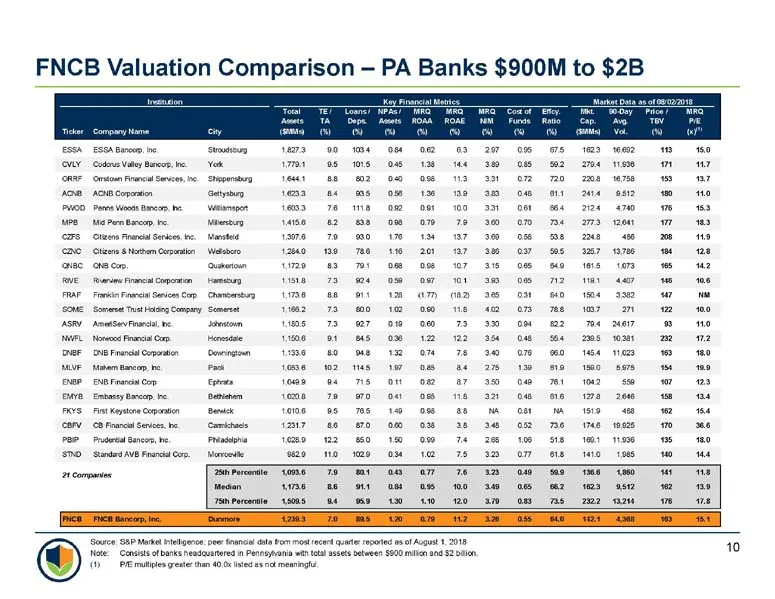
Slide 11: FNCB Valuation Comparison — PA Banks $900M to $2B
FNCB Valuation Comparison — PA Banks $900M to $2B aa@ SRS/ER SERRE SHER ER EER SEE
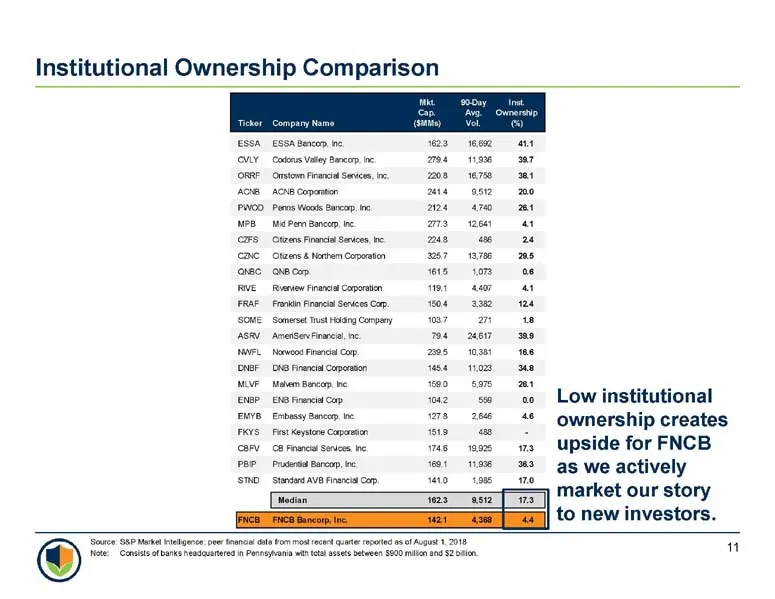
Slide 12: Institutional Ownership Comparison
Institutional Ownership Comparison ESSA ESSA Geneon ne yeas 1608 CMY Coton Vay Bea. moe 156 [ORR Ontom Final Savces, mos 1678 ACN ACNB Capertn ane ast WOO Perms Woats Barc he zoe 470 NPB MdPem2ancep, ne ma west (CFS Otzens Fare Snes, he mee CBC Ctzens & Herter Coperaion ms7 176 ‘NBC NB com, 115 107
Slide 13: Diversified Loan Composition
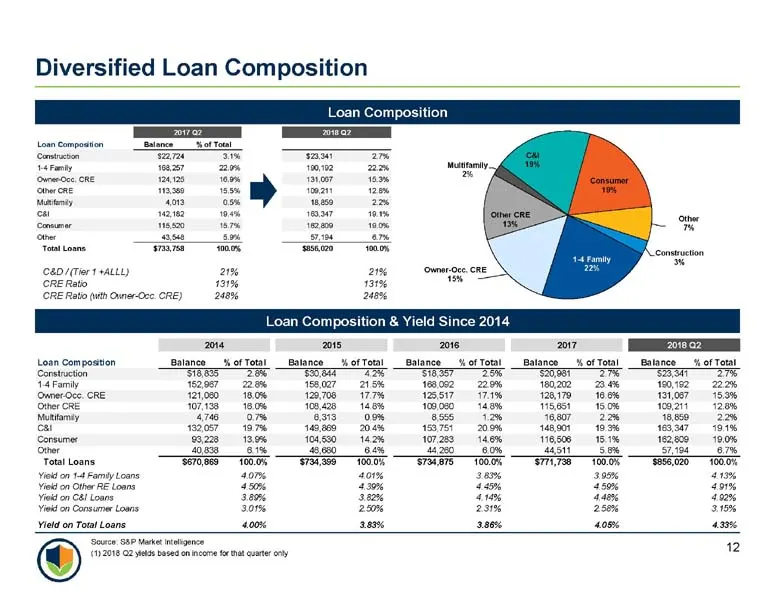
Diversified Loan Composition Loan Composition cab /(Tier +ALL) CRE Reto (CRE Risto (uth Owner-Dee CRE) Loan Composition & Yield Since 2014 2014 018 2016 2017 20a Loan compostion Balance of Total Balance _YofTotsl __Salance of Total Balance of Total _ Balance __% of Tot rscton 318; Le ce 28% —— S08 a
Slide 14: Accelerating Loan Growth
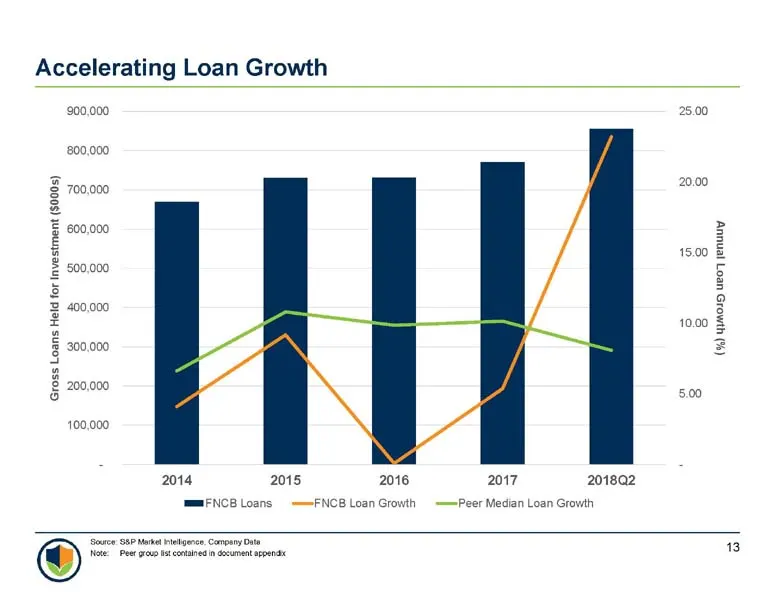
Accelerating Loan Growth 200,000 25.00 200,000 F room 2000 00.000 3 is 1500 § § 500,000 e £ roy 3 400.000 3 2 10.00 & © 200,000 2 § 0000 soo 100.000 2014 2015 2016 2017 2018Q2 mEEFNCB Loans -—=FNCB Loan Growth -—Peer Medan Loan Growth =a 8 Nate” Pet grt cetatesinsocunent epee
Slide 15: Rising Loan Yields
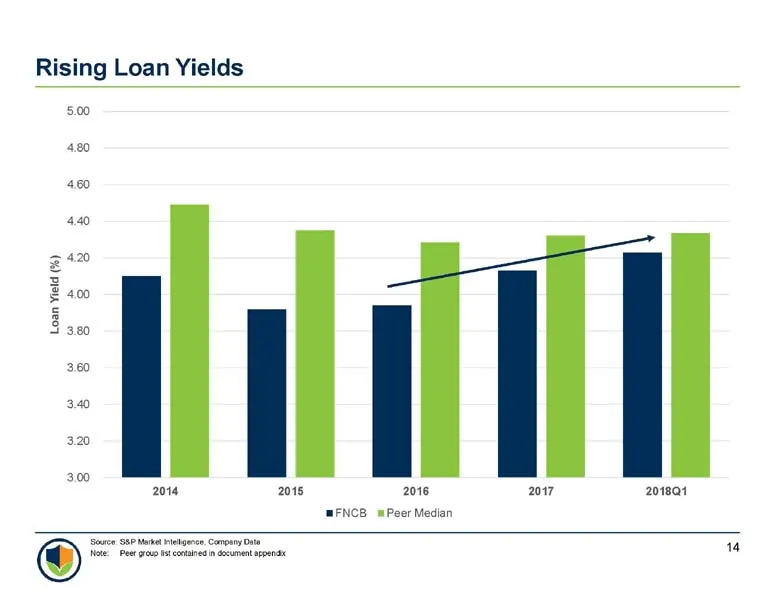
Rising Loan Yields 5.00 490 3.60 340 320 3.00 2014 2018 2016 2017 201801 MFNCB Peer Median Loan Yield ('%) 8 8 8
Slide 16: Attractive Deposit Composition
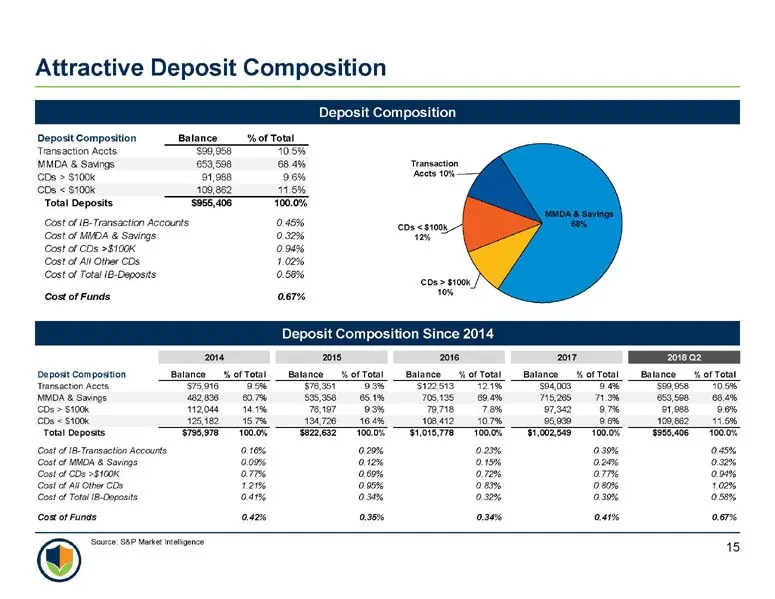
Attractive Deposit Composition Deposit Composition Deposit Composition Balance __%of Total Transaction Accts So 55 709% MMDA & Saurgs 659,588 68496, (GOs > $100 91,986 96% Ds < $1004 109,262 11.5% Total Deposits 3956 408 700.0% Cost of 1B-Transaction Accouts 0.45%6 Cost of MDA & Savings 0.32% Cost o
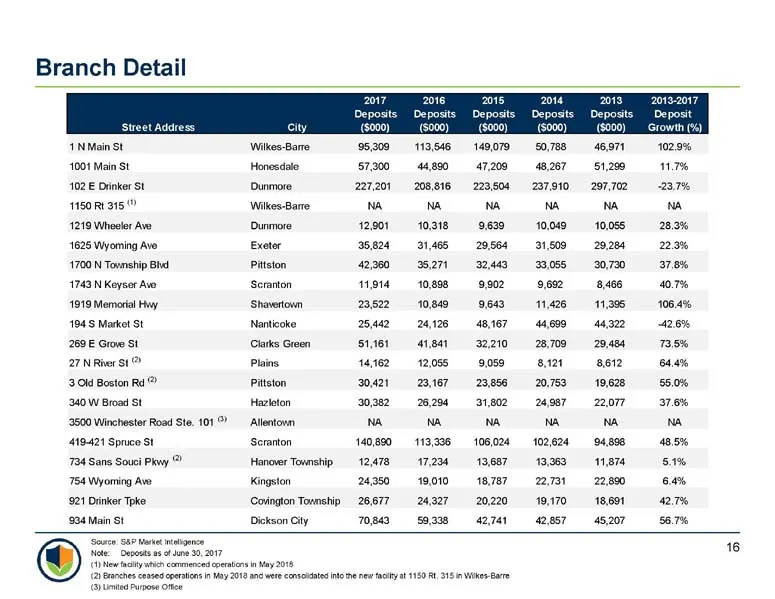
Slide 17: Branch Detail
Branch Detail 11NMain st 4001 Main St 102 E Drinker St 1150 R1 315" 1219 Wheeler Ave 1625 Wyoming Ave 1700 N Township Bt 1743 N Keyser Ave 4819 Memorial Huy 1945 Market St 289 Grow St 27 NRher st 30d Boston Rd ® ‘240 W Broad St 3500 Winchester Road Ste, 101° 419.421 Spruce st 734:Sans Souci Pkwy ® 7
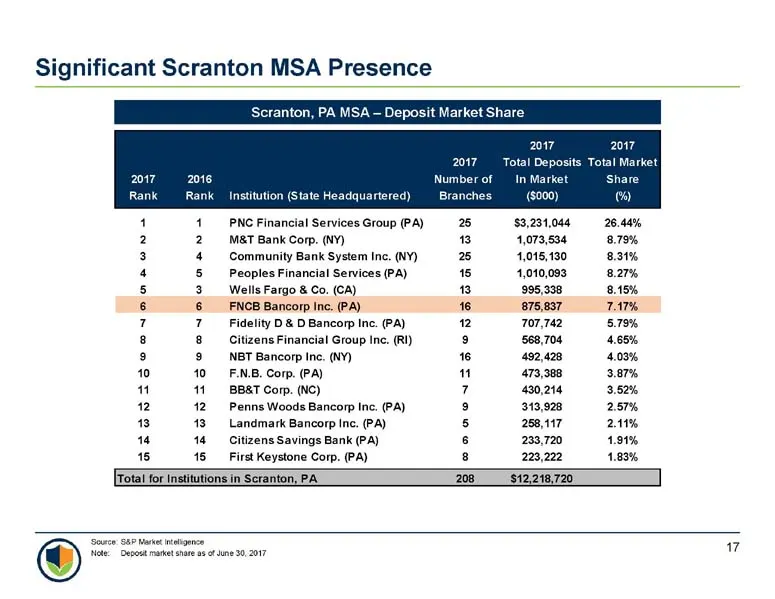
Slide 18: Significant Scranton MSA Presence
Significant Scranton MSA Presence Scranton, PA MSA — Deposit Market Shar 2017 2017 2017 Total Deposits Total Market Numberof In Market Share Institution (State Headquartered) Branches _—_($000) 3 1 1 PNCFinancial Services Group (PA) -25—=$3,.281,044 28.44% 2 2 M8T Bank Comp. (NY) 8 4,073,594 8.79% 3
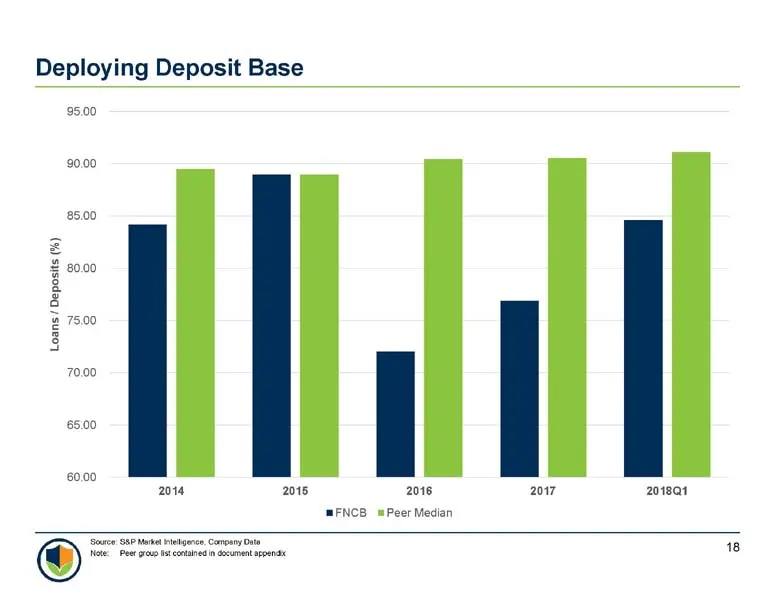
Slide 19: Deploying Deposit Base
Deploying Deposit Base 95.00 90.00 85.00 & 2 75.00 70.00 65.00 60.00 2014 2018 2018 2017 2018a1 "FNCB m= Peer Median ‘area SRP hl Fiowen, Canpany Oat 18
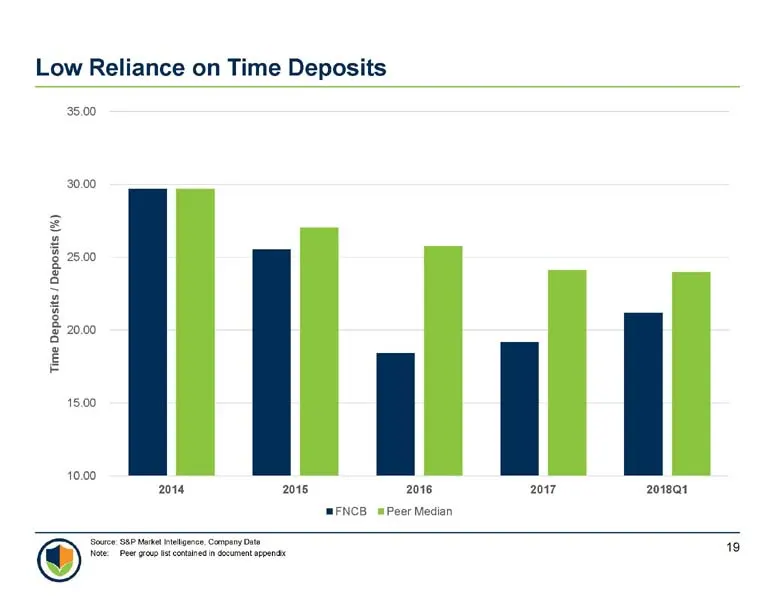
Slide 20: Low Reliance on Time Deposits
Low Reliance on Time Deposits 35.00 30.00 25.00 20.00 - | l 1000 2014 2016 2016 2017 2018a1 "FNCB mPeerMedian Time Deposits / Deposits (’4)
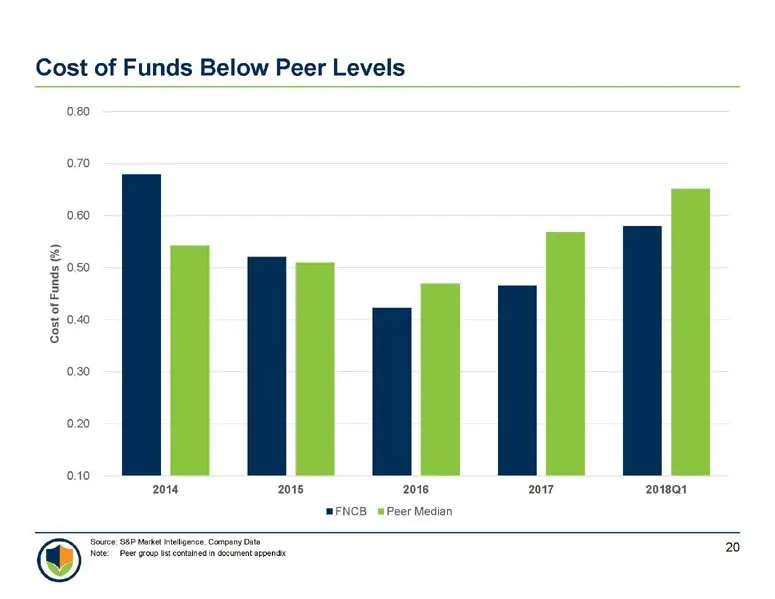
Slide 21: Cost of Funds Below Peer Levels
Cost of Funds Below Peer Levels 0.80 0.70 0.60 8 0 0 0.10 0 0 2014 2016 2016 2017 201801 FNCB mPeerMedian & Cost of Funds (%) 8
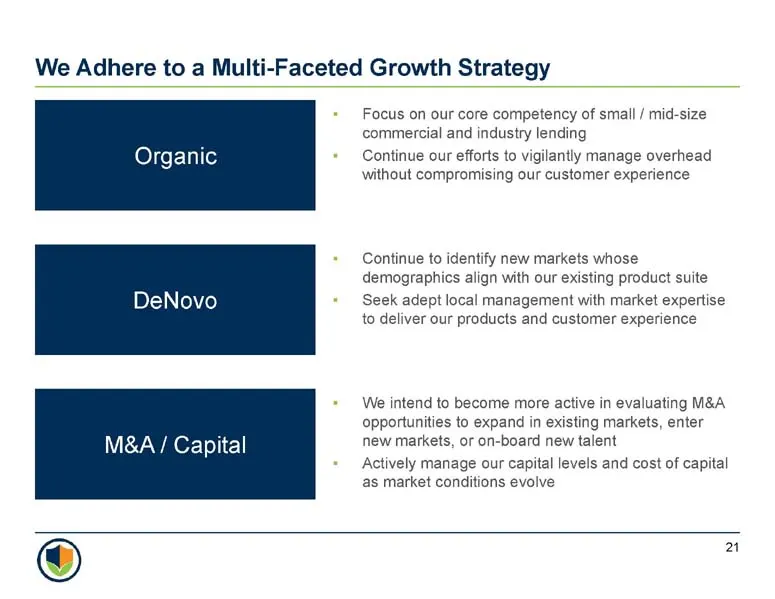
Slide 22: We Adhere to a Multi-Faceted Growth Strategy
We Adhere to a Multi-Faceted Growth Strategy Organic M&A / Capital Focus on our core competency of small / mid-size commercial and industry lending Continue our efforts to vigilantly manage overhead without compromising our customer experience Continue to identify new markets whose demographics alig
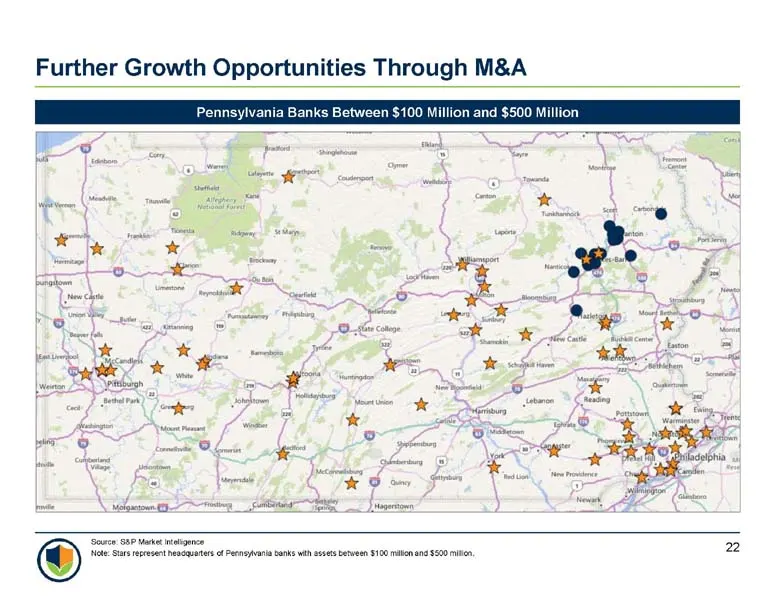
Slide 23: Further Growth Opportunities Through M&A
Further Growth Opportunities Through M&A Pennsylvania Banks Between $100 Million and $500 Million \ toe ‘ozee GAP Mae aigeen te: Sas Pensa banks wth 00 22
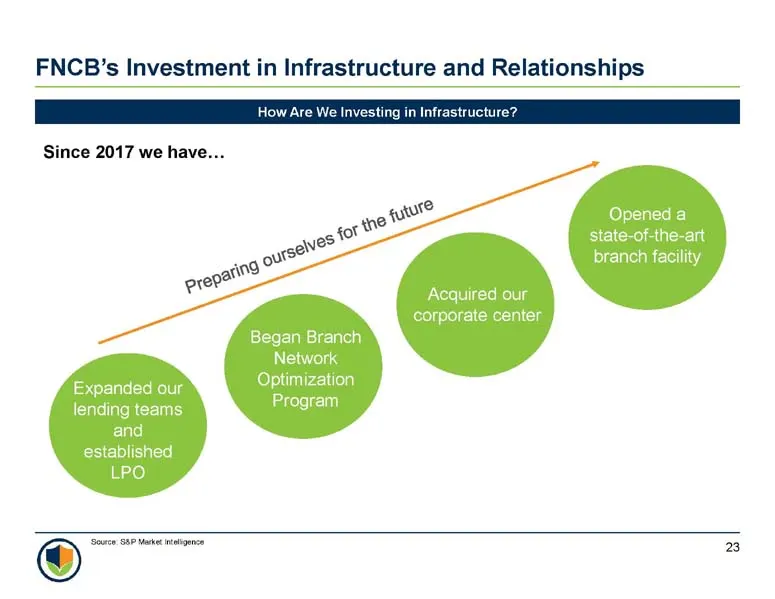
Slide 24: FNCB's Investment in Infrastructure and Relationships
FNCB’s Investment in Infrastructure and Relationships Since 2017 we have... Began Branch Optimization Expanded our in Program lending team and established LPO oo 3
Slide 25: Gerard A. Champi
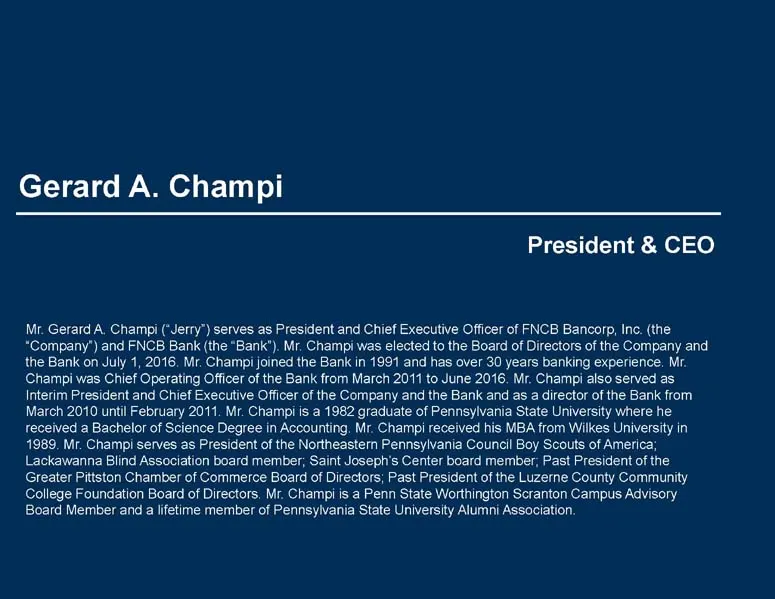
Gerard A. Champi President & CEO Mr. Gerard A. Champi (“Jerry”) serves as President and Chief Executive Officer of FNCB Bancorp, Inc. (the *Company’) and FNCB Bank (the “Bank’). Mr. Champi was elected to the Board of Directors of the Company and. the Bank on July 1, 2016. Mr, Champi joined the Bank
Slide 26: James M. Bone Jr., CPA
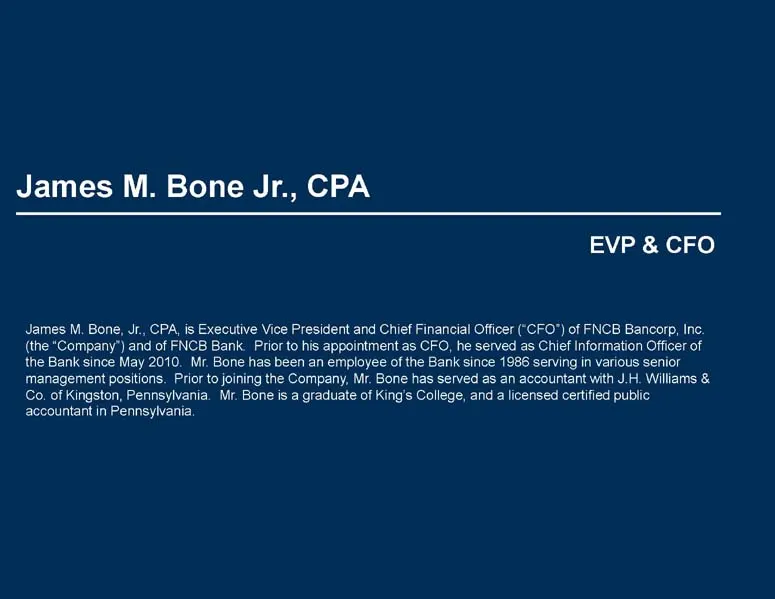
James M. Bone Jr., CPA EVP & CFO James M. Bone, Jr., CPA, is Executive Vice President and Chief Financial Officer (‘CFO") of FNCB Bancorp, Inc. (the “Company’) and of FNCB Bank. Prior to his appointment as CFO, he served as Chief Information Officer of the Bank since May 2010. Mr. Bone has been an e
Slide 27: Board of Directors (1 of 5)
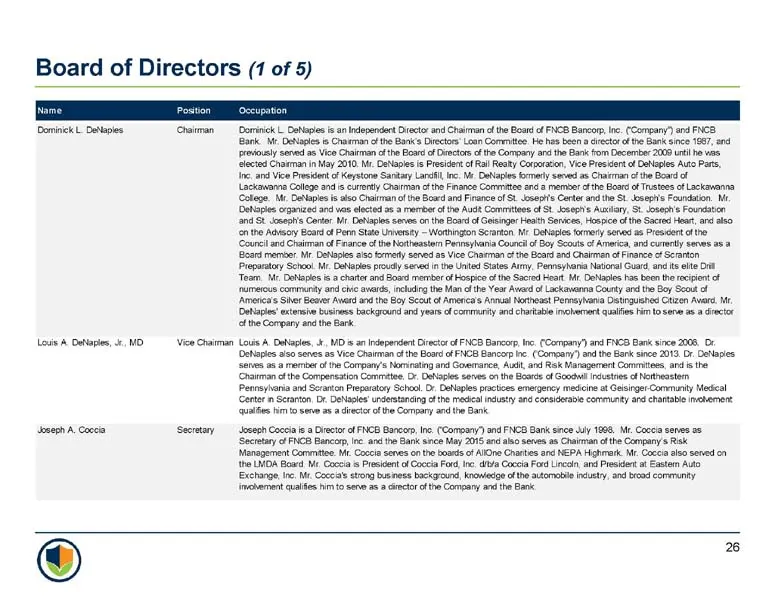
Board of Directors (1 of 5) Dominick L Dettpies| ‘Chalman Dominick L Delos isan Independent Dect and Chama othe Board of FNCB Banco, Inc. (Company) and FNC ‘Bork, Dsapes Cnermon othe Boats Diecton’ Loan Conmites He hasbeen a cector ofthe Bank since 187, er ‘rexsly sened as Vie Chatman cl the Board o
Slide 28: Board of Directors (2 of 5)
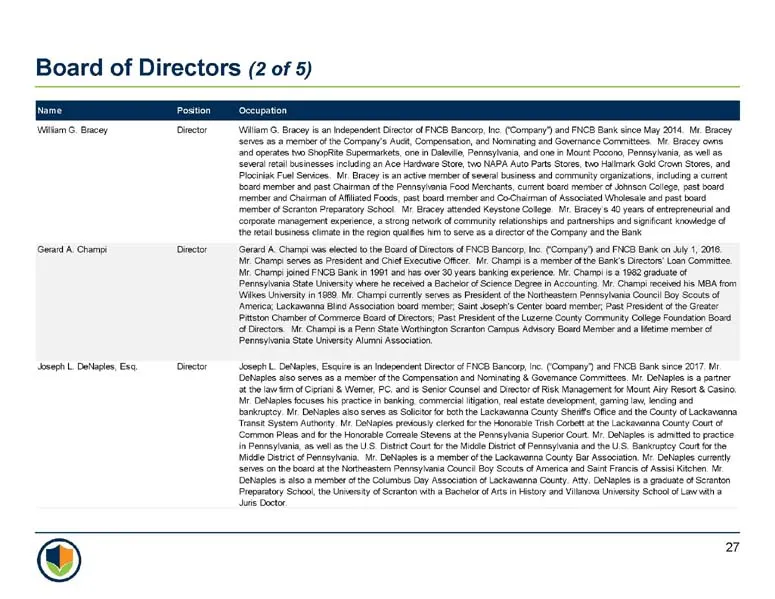
Board of Directors (2 of 5) ‘Walle. Bey ‘Bret, Wile. Bacey fan dependent recor of FNCE Bancor, le. (Company) and ENCE Bank ice May 2014, Me. Bacay compart ‘he vtal business emate 9 Be regan quaios hm to sane ssa eco fhe Company athe Bank Gerard A Char Dctor Gerad A. Chap was lected to the Board ef r
Slide 29: Board of Directors (3 of 5)
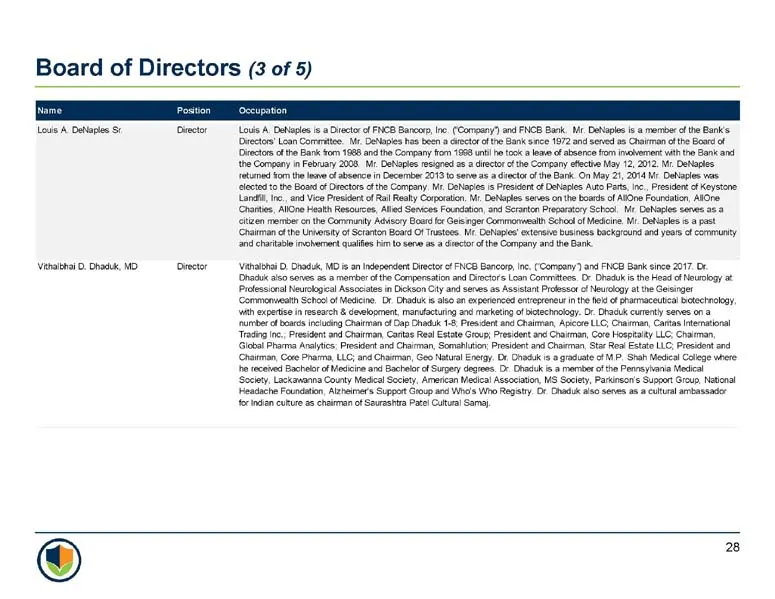
Board of Directors (3 of 5) Ls A Detapes i Diector Lois A. Deals isa Diectr ef FNCS Barcer, le (Coroar/) and FNCB Bark. Deals isa member the Bank's ‘rector! Loan Corte Mr. OeNoies hs been 9 crete othe Sank ace 1072 nd sewed as Charman othe Boars ‘rectors of th Ean orn 1988 andthe Company om 1953 ul
Slide 30: Board of Directors (4 of 5)
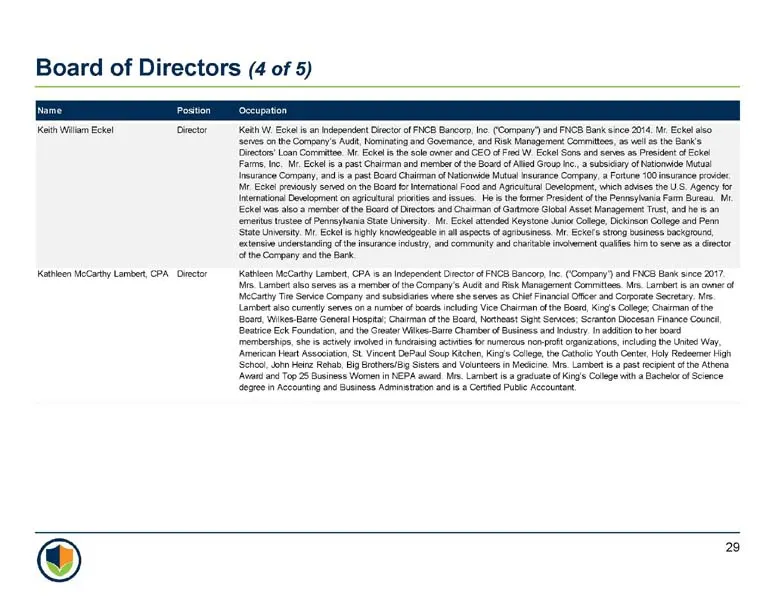
Board of Directors (4 of 5) Kath Wiliam Eckel ‘ietor Kathleen McCarty Lanter, CPA. Ovector eth Wi, Eckel is an independent Onecir of FNCE Bancorp, he (Company) and FNCB Bank since 2014, Mi Eckl also ‘sens onthe Company's Aut, Nominating and Gowemance, ad Risk Mangement Cormier, as ila the Bank's ‘re
Slide 31: Board of Directors (5 of 5)
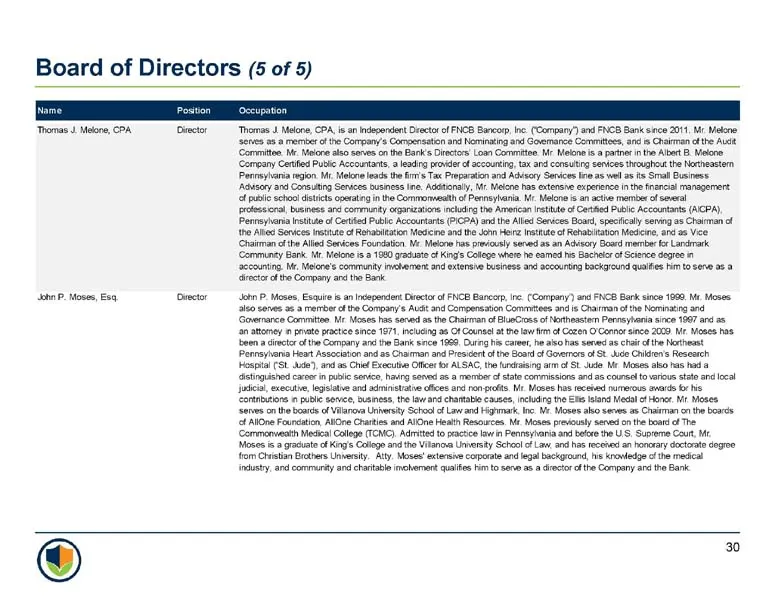
Board of Directors (5 of 5) Thomas. Mele, CPA lector kha P. Moses, E53 rector ‘Thomas J Malone, CPA san dependent Deetar of FNCB Bancorp, Ine: (Company and FNCB Sank since 2011, Mr Malone ‘rector fhe Company ath Banke ot P. Moses, Esau san Inspendert Overt of FCB Barcap ne (Company) ant FNC Bark sit
Slide 32: Q&A
Q&A
Slide 33: Appendix
Appendix
Slide 34: GAAP to Non-GAAP Reconciliation
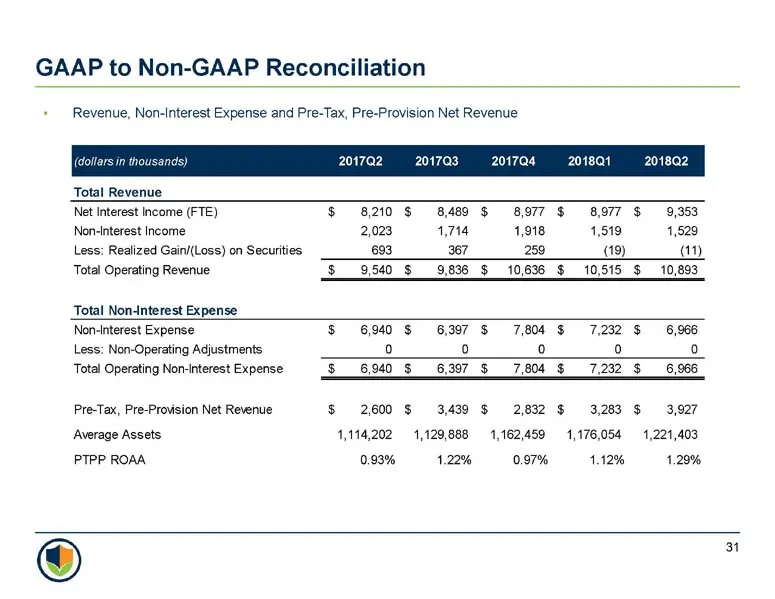
GAAP to Non-GAAP Reconciliation * Revenue, Non-interest Expense and Pre-Tax, Pre-Provision Net Revenue Total Revenue 201702 201703 201704 201801 201802 Net Interest income (FTE) $8210 8,489 ag77 $ 8977 $ 9,353 Non-Interest Income 2,023, 4714 4,918 4,519 4,529 Less: Realized Gain/(Loss) on Securities
Slide 35: FNCB Financial Peer Group
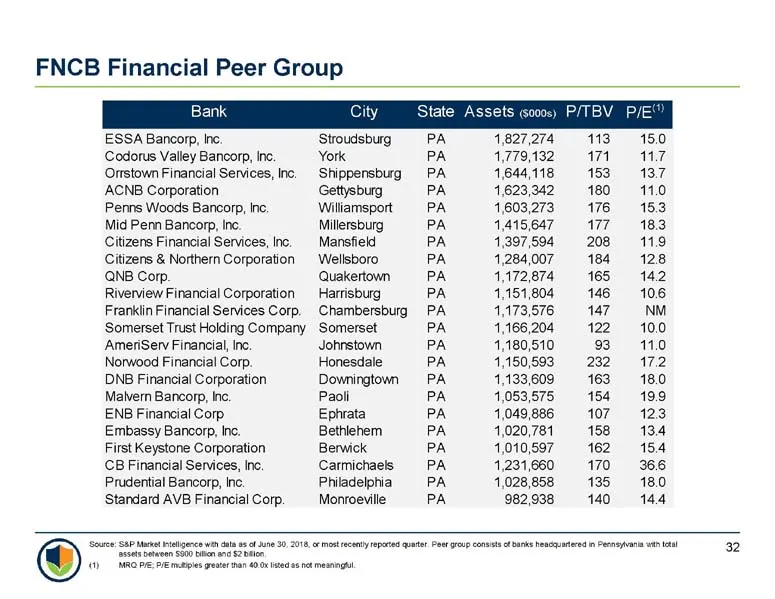
FNCB Financial Peer Group ESSA Bancorp, inc. Stroudsburg Codorus Valley Bancorp, Inc. York Onstown Financial Services, Inc. Shippensburg ‘ACNB Corporation Gettysburg Penns Woods Bancorp, Inc. Williamsport Mid Penn Bancorp, Inc Millersburg Citizens Financial Services, Inc. Mansfield Citizens & Northe
Source: SEC EDGAR · 8-K filed Aug 8, 2018
More decks from FNCB Bancorp Inc
 Merger or Acquisition (November 2023)17 slides · Nov 20, 2023
 Investor Presentation (November 2023)16 slides · Nov 17, 2023
 Merger or Acquisition (September 2023)31 slides · Sep 28, 2023
 Investor Presentation (August 2023)15 slides · Aug 14, 2023
 Investor Presentation (May 2023)15 slides · May 25, 2023
 Shareholder Meeting (May 2023)30 slides · May 17, 2023