Enventis — Hickory Tech — Shareholder Meeting (May 2008)
22 slides from Enventis's shareholder meeting presentation, May 7, 2008
Slide 1: Annual Meeting May 6, 2008
Poser Annual Meeting May 6, 2008
Slide 2: Forward Looking Statement
2 Forward Looking Statement Information set forth in this presentation contains financial estimates and other forward-looking statements that are subject to risks and uncertainties; therefore, actual results might differ materially from such statements, whether as a result of new information, future
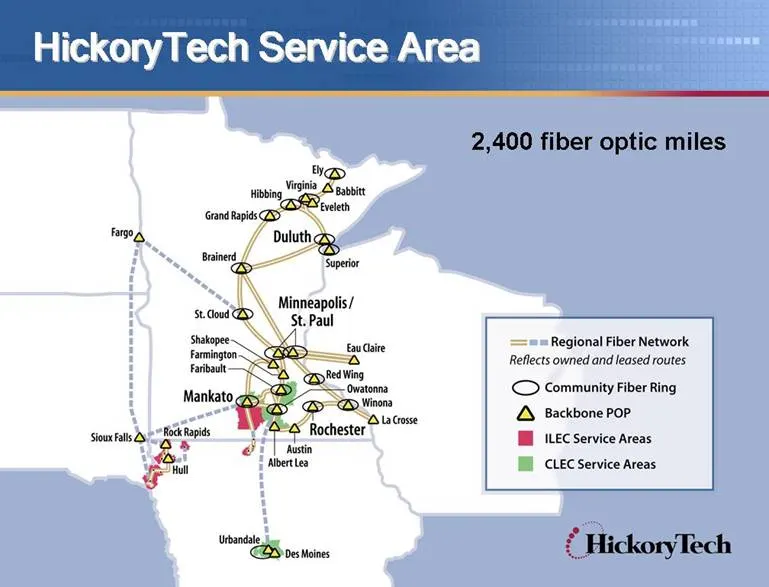
Slide 3: HickoryTech Service Area
3 Q4-2007 Earnings | 02.28.08 | HTCO HickoryTech Service Area 2,400 fiber optic miles
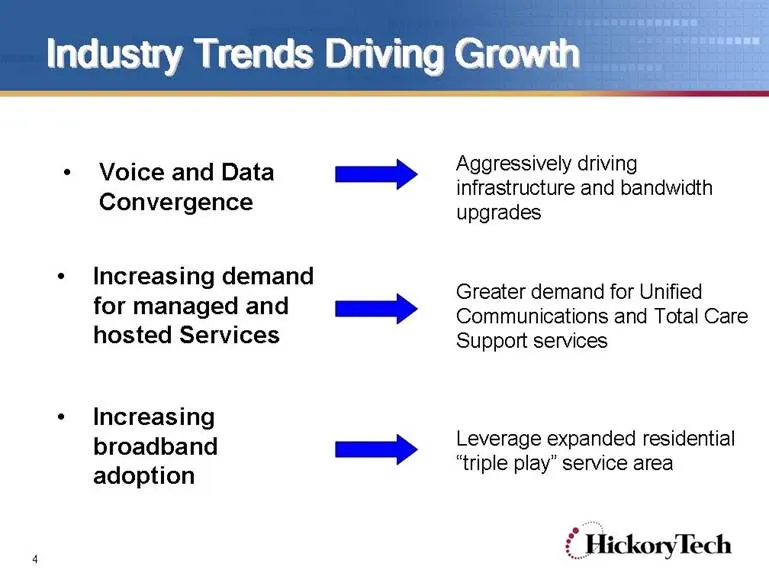
Slide 4: Industry Trends Driving Growth
4 Industry Trends Driving Growth Aggressively driving infrastructure and bandwidth upgrades • Increasing demand for managed and hosted Services • Increasing broadband adoption Greater demand for Unified Communications and Total Care Support services Leverage expanded residential “triple play” servic
Slide 5: 2007 Financial Highlights
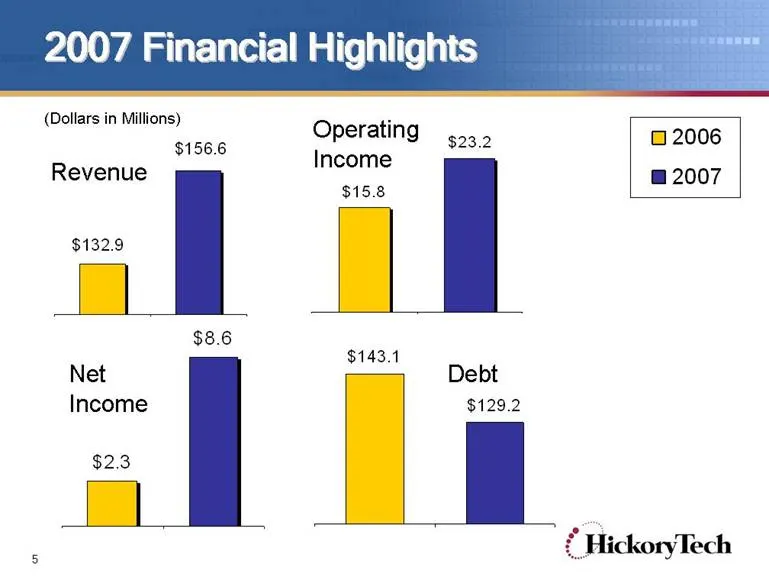
5 2007 Financial Highlights 2006 2007 (Dollars in Millions) $15.8 $23.2 $156.6 $132.9 $2.3 $8.6 Revenue Operating Income Net Income $143.1 $129.2 Debt
Slide 6: Revenue Diversification
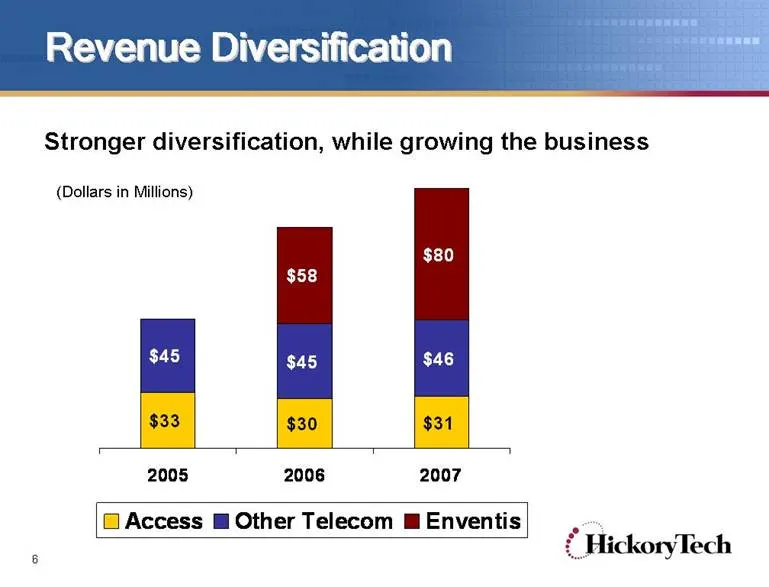
6 Revenue Diversification Stronger diversification, while growing the business $33 $30 $31 $45 $45 $46 $58 $80 2005 2006 2007 Access Other Telecom Enventis (Dollars in Millions)
Slide 7: Telecom Strategy
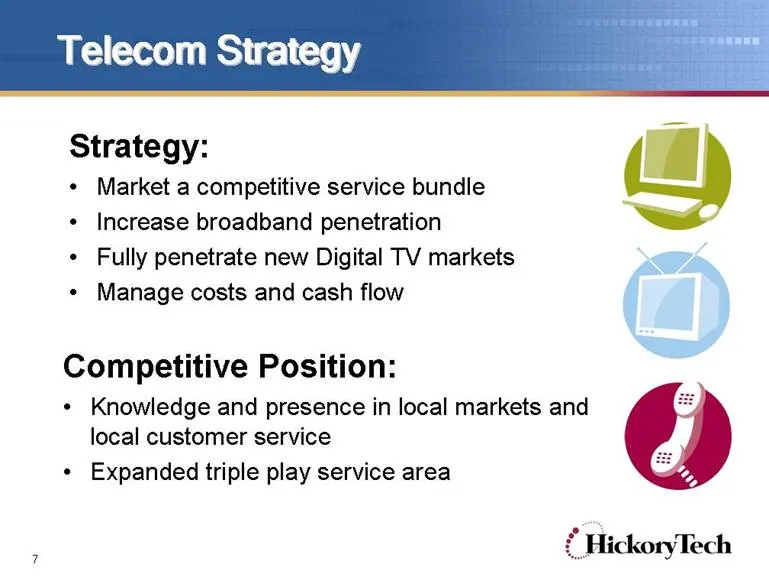
7 Telecom Strategy Competitive Position: • Knowledge and presence in local markets and local customer service • Expanded triple play service area Strategy: • Market a competitive service bundle • Increase broadband penetration • Fully penetrate new Digital TV markets • Manage costs and cash flow
Slide 8: Telecom Digital TV Expansion Markets
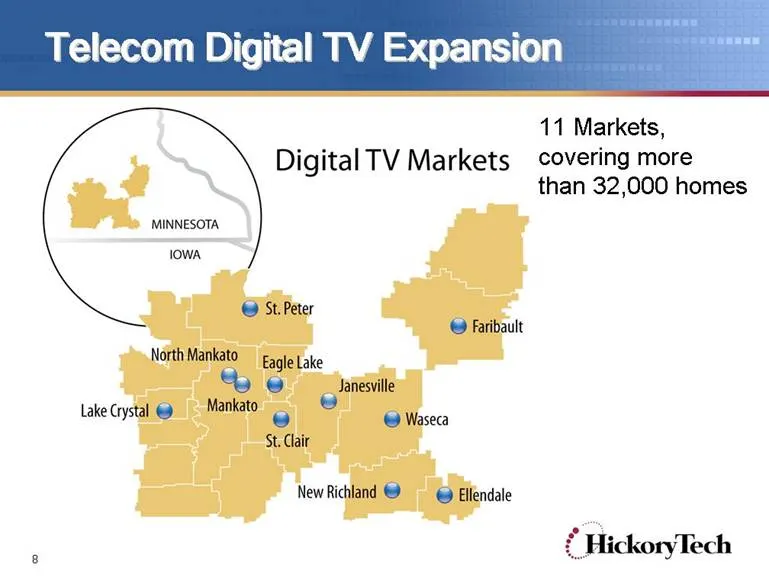
8 Telecom Digital TV Expansion 11 Markets, covering more than 32,000 homes
Slide 9: Enventis Business Strategy
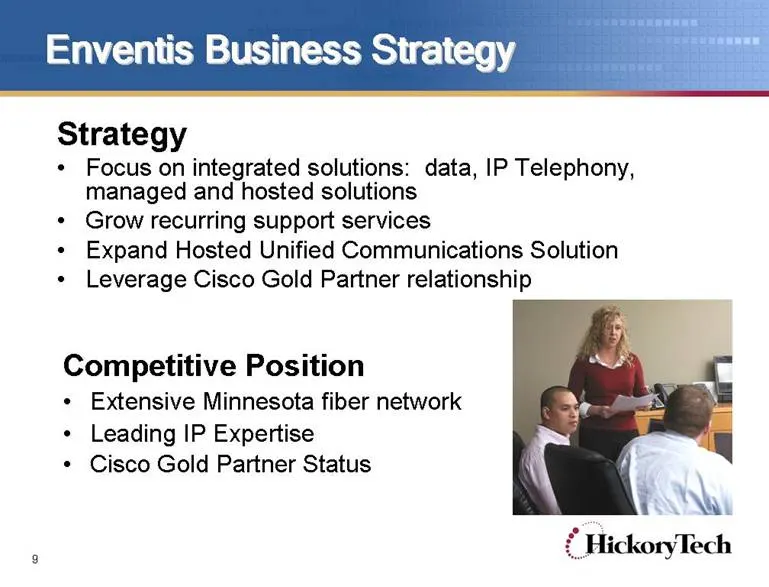
9 Enventis Business Strategy Strategy • Focus on integrated solutions: data, IP Telephony, managed and hosted solutions • Grow recurring support services • Expand Hosted Unified Communications Solution • Leverage Cisco Gold Partner relationship Competitive Position • Extensive Minnesota fiber networ
Slide 10: Enventis is a Cisco Gold Partner
10 Enventis is a Cisco Gold Partner Highest level of partnership with Cisco • Provides sales leads and referrals • Economic incentives • Only partner based in Minnesota with metro and out state operations
Slide 11: 2007 Operational Highlights
11 2007 Operational Highlights Grew Enventis business • Named Dell Silverback Partner of the Year • Launched Total Care Support Services • Recognized by Cisco for Enterprise Segment Excellence Stability within Telecom • Continued Broadband growth • Expanded Digital TV Service Area Focus on B2B produ
Slide 12: Growth Strategy
12 Growth Strategy Maximize profitability and cash flows from legacy telecom businesses Invest in and grow IP services • Enventis to exploit data convergence, trend toward unified communications and adoption of IP technologies Optimize use of our free cash flow • Organic growth of products and servi
Slide 13: Strong 2007 Results
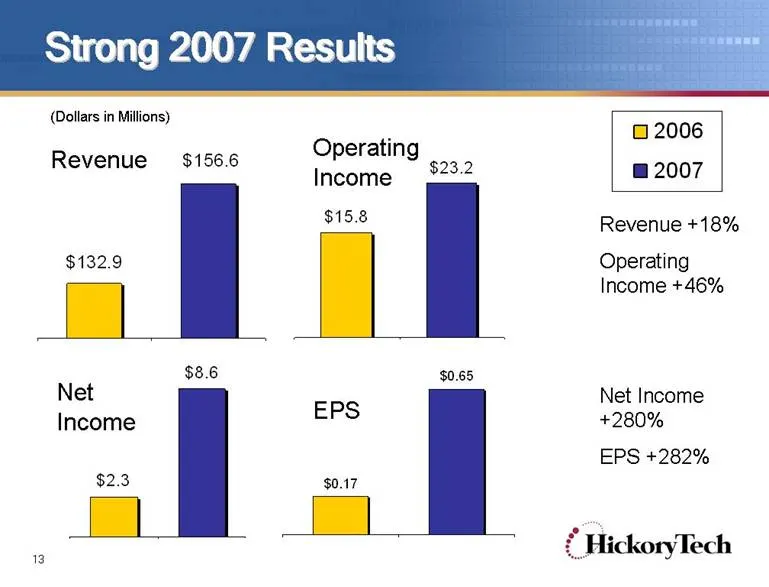
13 Strong 2007 Results $132.9 $156.6 Revenue $0.17 $0.65 EPS $2.3 $8.6 Net Income Revenue +18% Operating Income +46% Net Income +280% EPS +282% (Dollars in Millions) 2006 2007 $15.8 $23.2 Operating Income
Slide 14: 2007 Telecom Sector Results
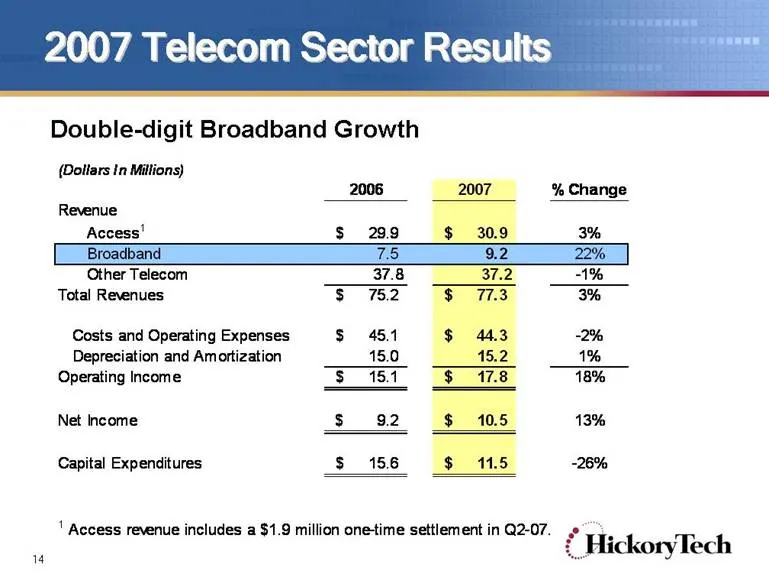
14 2007 Telecom Sector Results (Dollars In Millions) 2006 2007 % Change Revenue Access1 29.9 $ 30.9 $ 3% Broadband 7.5 9.2 22% Other Telecom 37.8 37.2 -1% Total Revenues 75.2 $ 77.3 $ 3% Costs and Operating Expenses 45.1 $ 44.3 $ -2% Depreciation and Amortization 15.0 15.2 1% Operating Income 15.1 $
Slide 15: Enventis Provides Growth
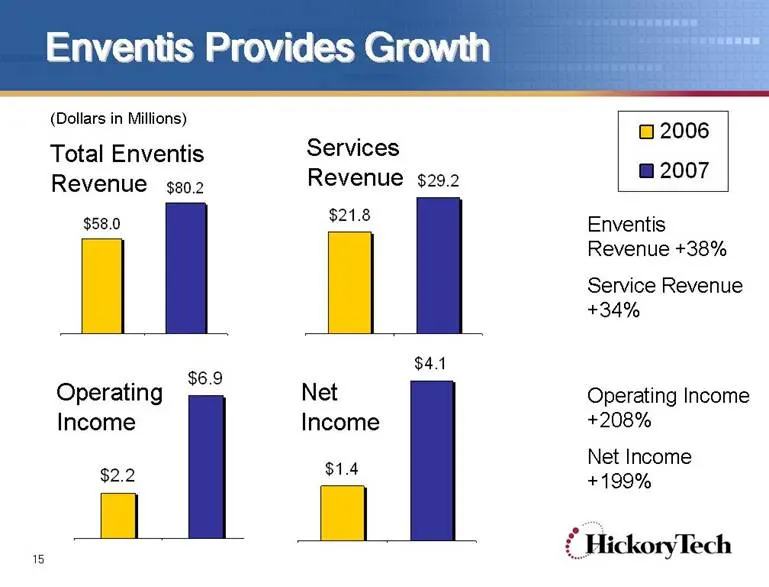
15 Enventis Provides Growth Enventis Revenue +38% Service Revenue +34% Operating Income +208% Net Income +199% $58.0 $80.2 Total Enventis Revenue $21.8 $29.2 Services Revenue (Dollars in Millions) $1.4 $4.1 Net Income 2006 2007 $2.2 $6.9 Operating Income
Slide 16: Enventis Revenue
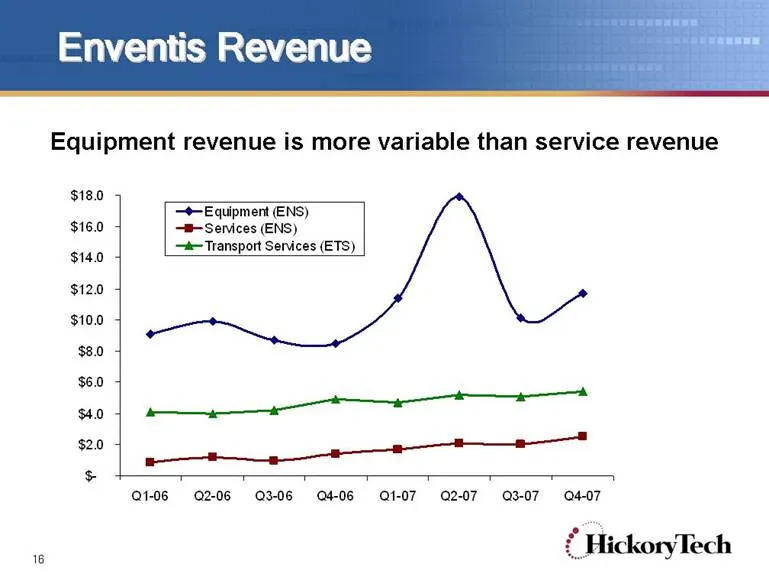
16 Enventis Revenue Equipment revenue is more variable than service revenue $- $2.0 $4.0 $6.0 $8.0 $10.0 $12.0 $14.0 $16.0 $18.0 Q1-06 Q2-06 Q3-06 Q4-06 Q1-07 Q2-07 Q3-07 Q4-07 Equipment (ENS) Services (ENS) Transport Services (ETS)
Slide 17: Debt Level
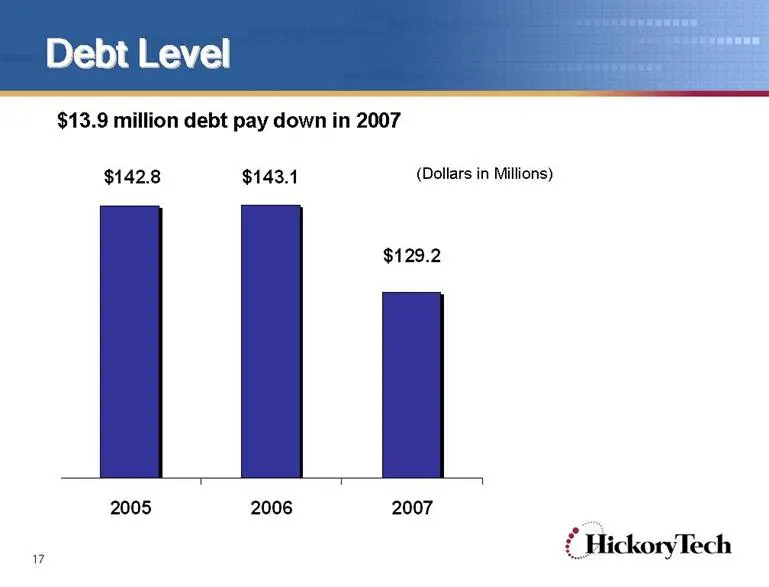
17 Debt Level $13.9 million debt pay down in 2007 $142.8 $129.2 $143.1 2005 2006 2007 (Dollars in Millions)
Slide 18: Free Cash Flow
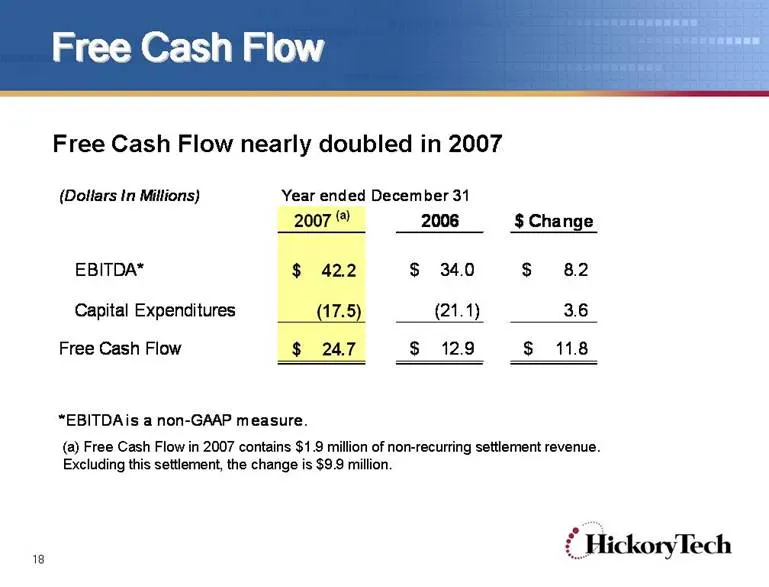
18 Free Cash Flow Free Cash Flow Year ended December 31 2007 (a) 2006 $ Change EBITDA* 42.2 $ 34.0 $ 8.2 $ (17.5) (21.1) 3.6 Free Cash Flow 24.7 $ 12.9 $ 11.8 $ *EBITDA is a non-GAAP measure. (Dollars In Millions) Capital Expenditures Free Cash Flow nearly doubled in 2007 (a) Free Cash Flow in 2007
Slide 19: Reconciliation of Operating Income to EBITDA
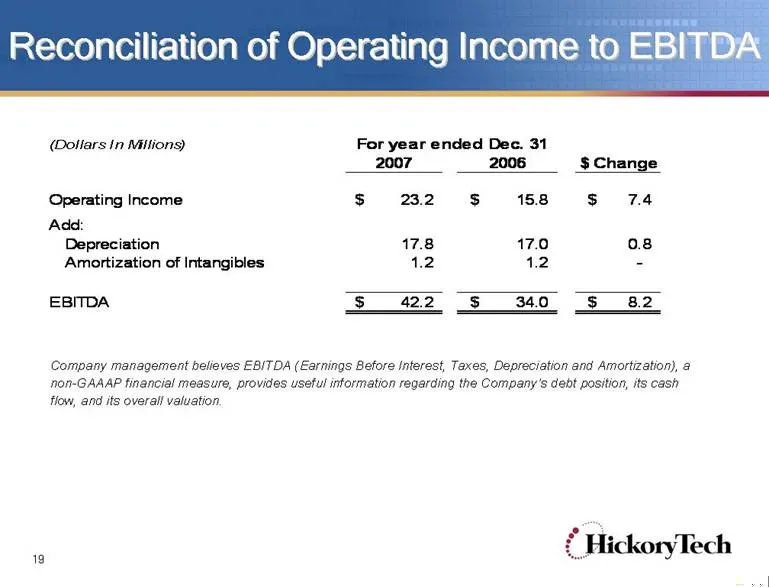
19 Reconciliation of Operating Income to EBITDA Company management believes EBITDA (Earnings Before Interest, Taxes, Depreciation and Amortization), a non-GAAAP financial measure, provides useful information regarding the Company’s debt position, its cash flow, and its overall valuation. 2007 2006 $
Slide 20: First Quarter 2008 Results
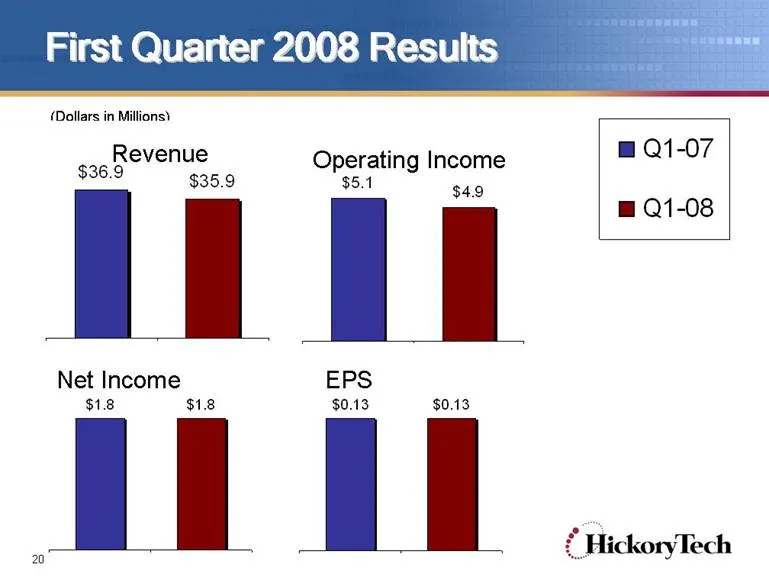
20 First Quarter 2008 Results (Dollars in Millions) $5.1 $4.9 Operating Income $1.8 $1.8 Net Income $0.13 $0.13 EPS Q1-07 Q1-08 $36.9 $35.9 Revenue
Slide 21: Investor Relations Focus
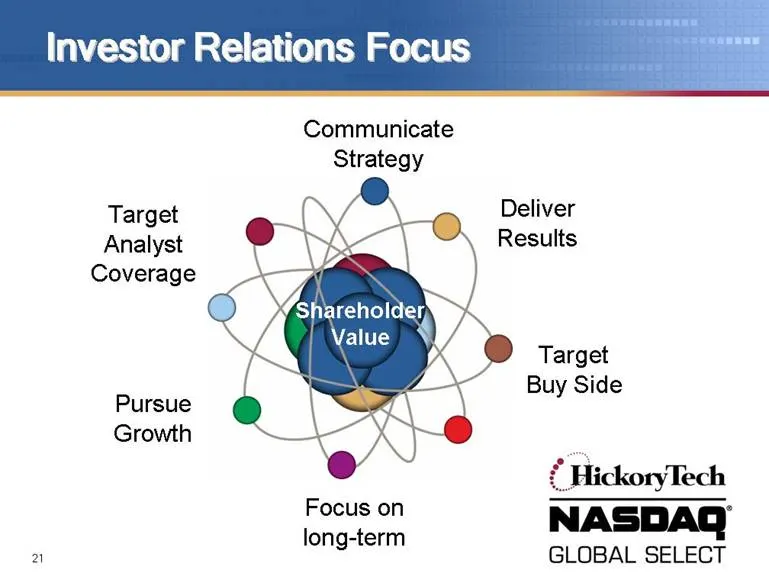
22 Investor Relations Focus Shareholder Value Communicate Strategy Deliver Results Target Analyst Coverage Pursue Growth Focus on long-term Target Buy Side
Slide 22: Thank You
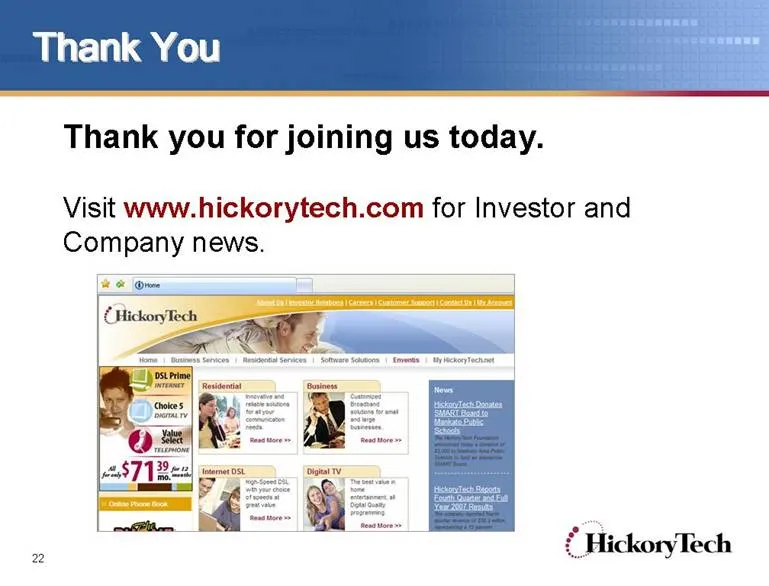
23 Thank You Thank You for joining us today. Visit www.hickorytech.com for Investor and Company news.
Source: SEC EDGAR · 8-K filed May 7, 2008
More decks from Enventis Corp
 Merger or Acquisition (June 2014)12 slides · Jun 30, 2014
 Hickory Tech — Shareholder Meeting (May 2014)36 slides · May 7, 2014
 Hickory Tech — Q1 2014 Earnings Presentation16 slides · May 2, 2014
 Hickory Tech — Deutsche Bank Media, Internet and Telecom Conference 201431 slides · Mar 11, 2014
 Hickory Tech — Q4 2013 Earnings Presentation21 slides · Mar 4, 2014
 Hickory Tech — Q3 2013 Earnings Presentation16 slides · Nov 7, 2013