Yadkin Financial — Gulf South Bank Conference 2015
21 slides from Yadkin Financial's conference presentation, May 4, 2015
Slide 1: Gulf South Bank Conference May 4-5, 2015
(NYSE: YDKN) Gulf South Bank Conference May 4-5, 2015
Slide 2: Forward Looking Statements
Forward Looking Statements Information in this presentation contains forward-looking statements within the meaning of the Private Securities Litigation Reform Act of 1995. These statements involve risks and uncertainties that could cause actual results to differ materially, including without limitat
Slide 3: Investment Thesis
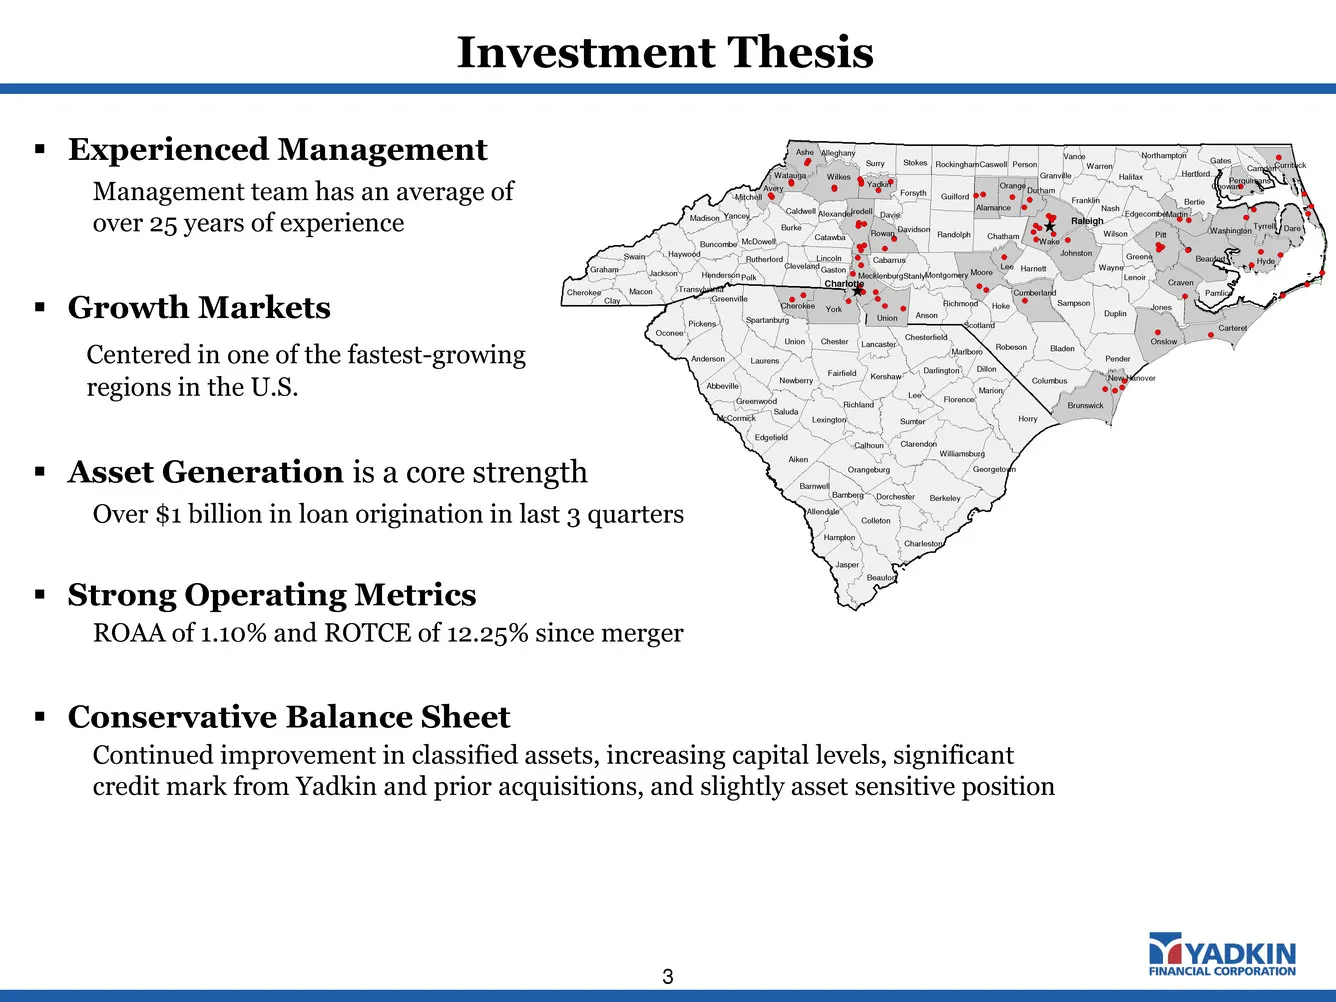
Investment Thesis 3 Stanly Cabarrus Vance Richmond Anson Florence Marion Darlington Marlboro Barnwell Greenwood Dillon Chesterfield Lancaster Columbus Lenoir Wayne Cleveland Rutherford Sampson Union Brunswick Cumberland Moore Lee Alamance Orange Iredell Wake Pitt Carteret Onslow Craven Watauga Perqu
Slide 4: Growth Markets: Population
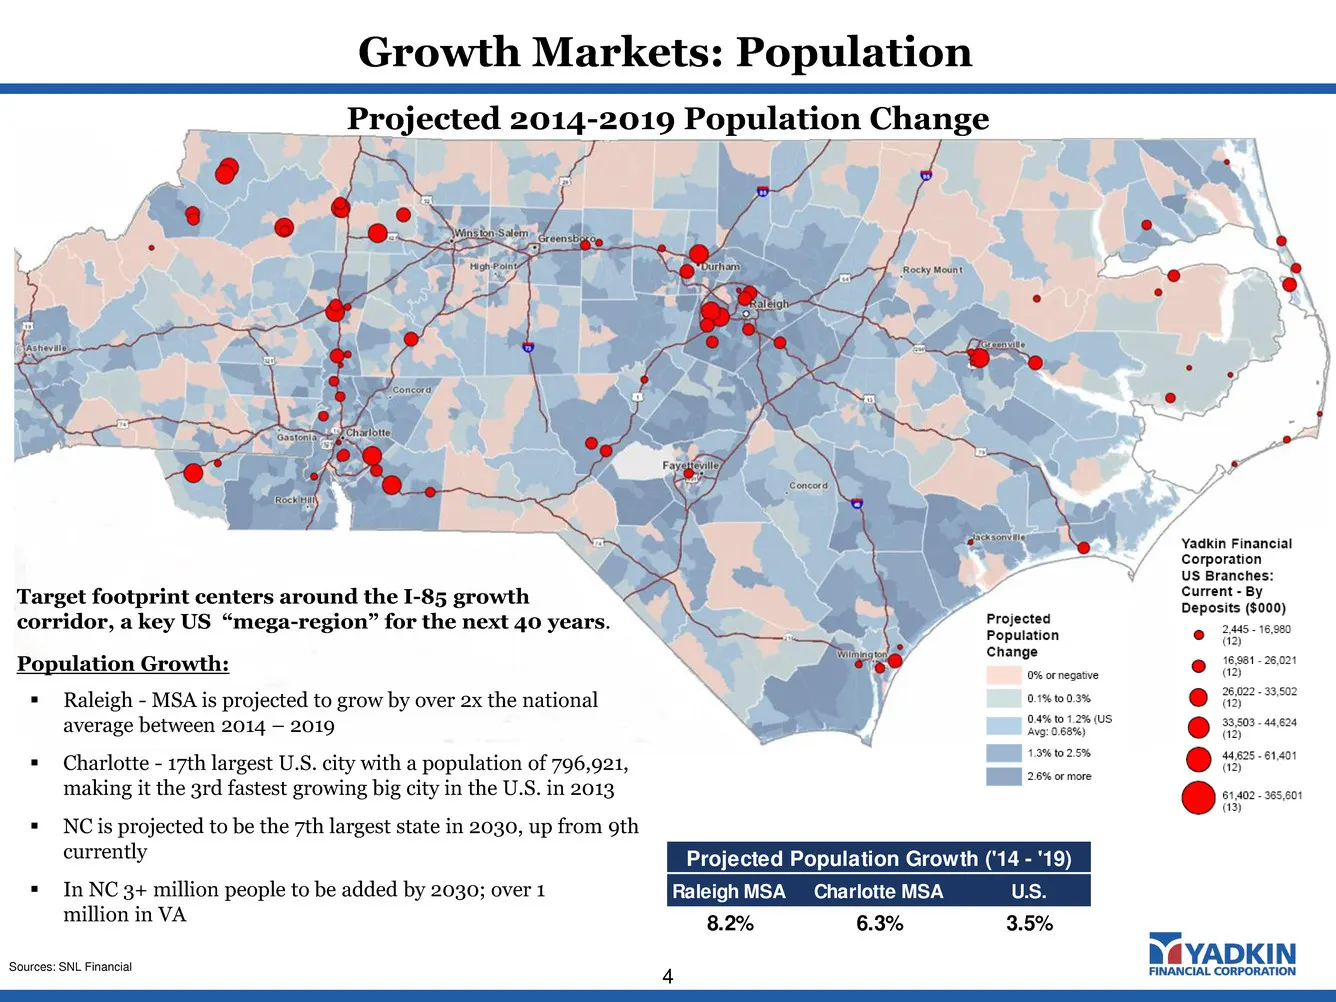
Growth Markets: Population 4 Sources: SNL Financial Target footprint centers around the I-85 growth corridor, a key US “mega-region” for the next 40 years. Population Growth: Raleigh - MSA is projected to grow by over 2x the national average between 2014 – 2019 Charlotte - 17th largest U.S. city
Slide 5: Growth Markets: Business Climate
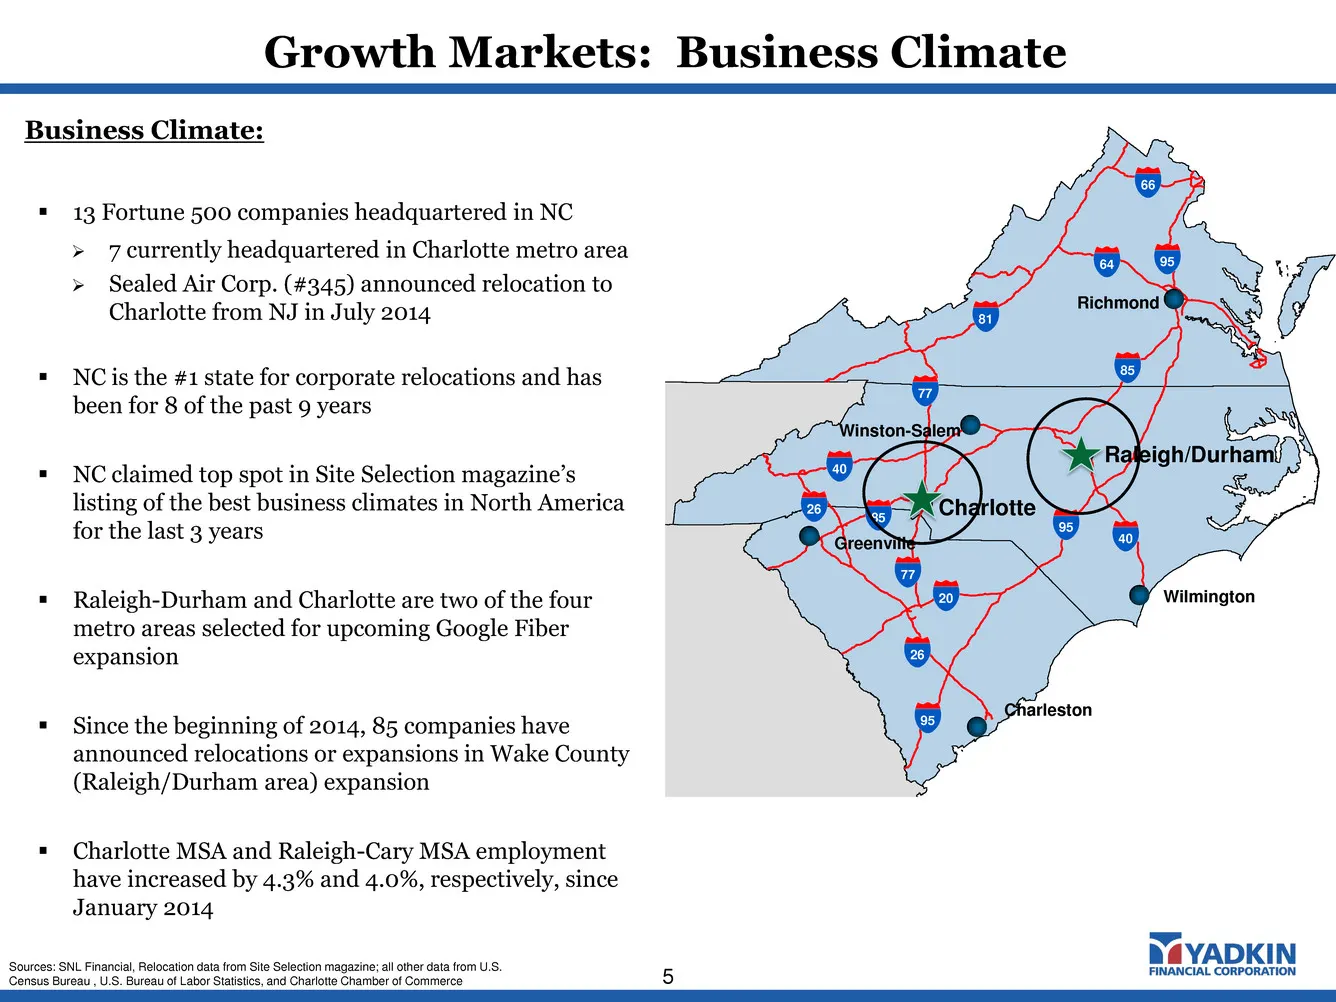
Growth Markets: Business Climate 5 438430_1.WOR Richmond Winston-Salem Greenville Wilmington 20 81 64 66 95 95 85 77 40 40 85 26 77 95 26 Charleston Raleigh/Durham Charlotte Business Climate: 13 Fortune 500 companies headquartered in NC 7 currently headquartered in Charlotte metro area Sealed
Slide 6: Positive Business Momentum Since Merger Announcement
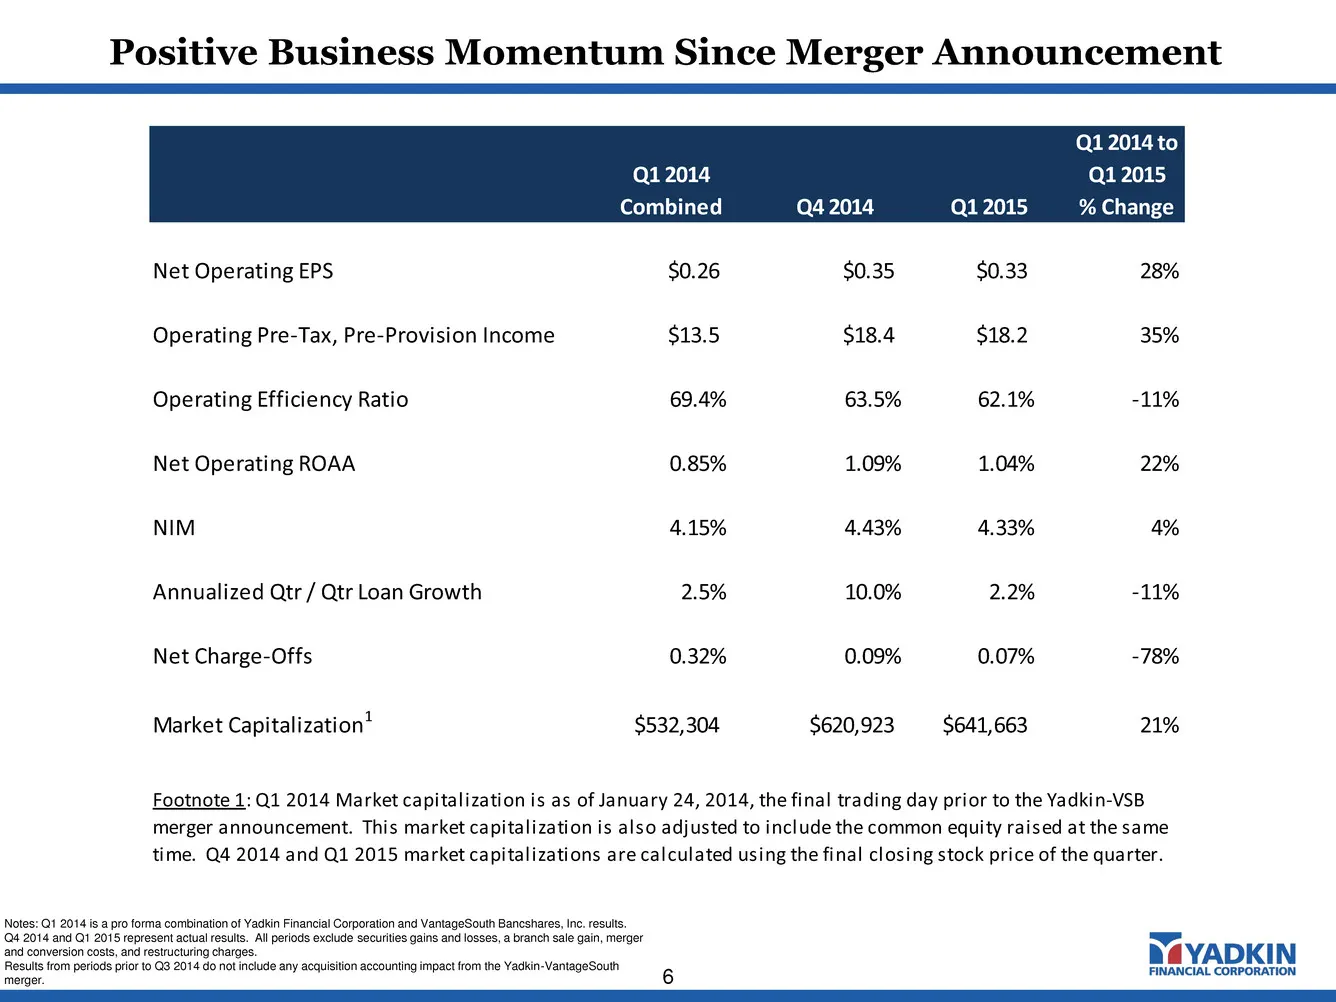
Positive Business Momentum Since Merger Announcement 6 Notes: Q1 2014 is a pro forma combination of Yadkin Financial Corporation and VantageSouth Bancshares, Inc. results. Q4 2014 and Q1 2015 represent actual results. All periods exclude securities gains and losses, a branch sale gain, merger and co
Slide 7: Diversified Business Lines
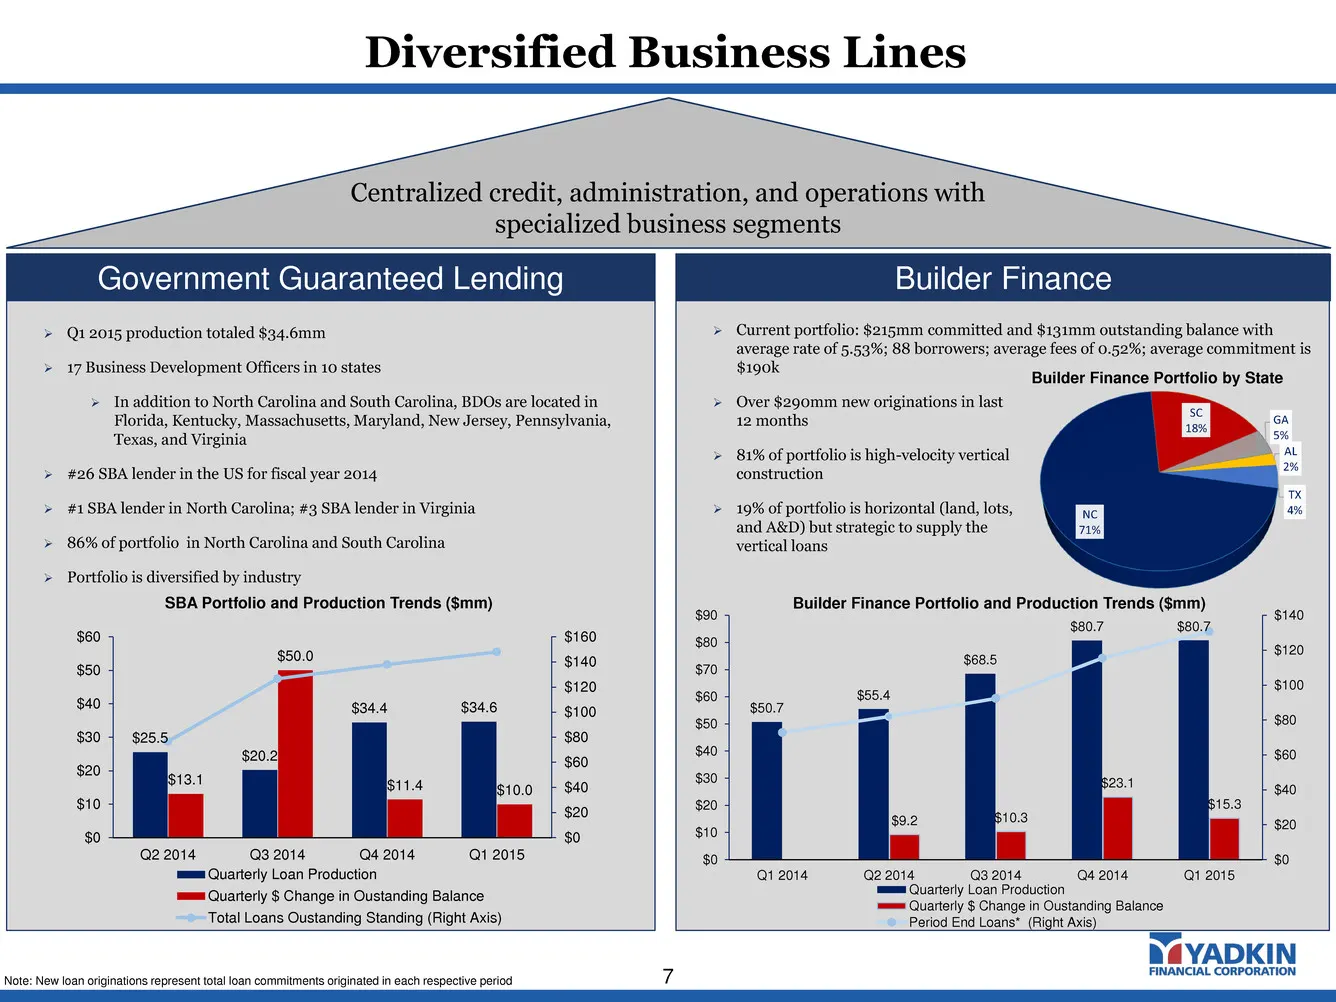
Diversified Business Lines 7 Current portfolio: $215mm committed and $131mm outstanding balance with average rate of 5.53%; 88 borrowers; average fees of 0.52%; average commitment is $190k Over $290mm new originations in last 12 months 81% of portfolio is high-velocity vertical construction
Slide 8: Diversified Business Lines
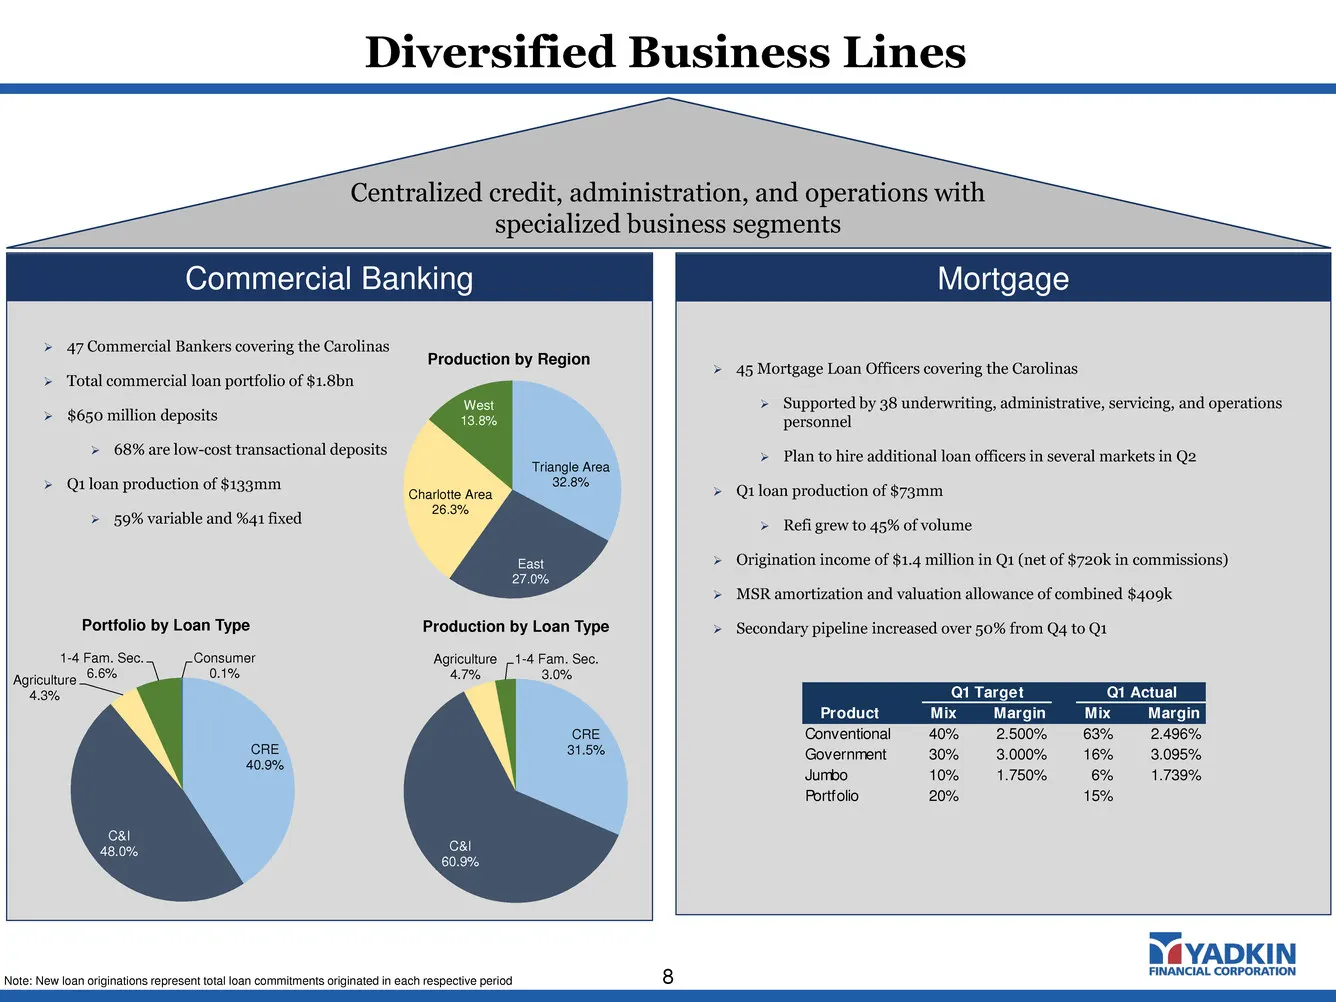
Diversified Business Lines 8 47 Commercial Bankers covering the Carolinas Total commercial loan portfolio of $1.8bn $650 million deposits 68% are low-cost transactional deposits Q1 loan production of $133mm 59% variable and %41 fixed Note: New loan originations represent total loan commi
Slide 9: First Quarter 2015 Results Highlights
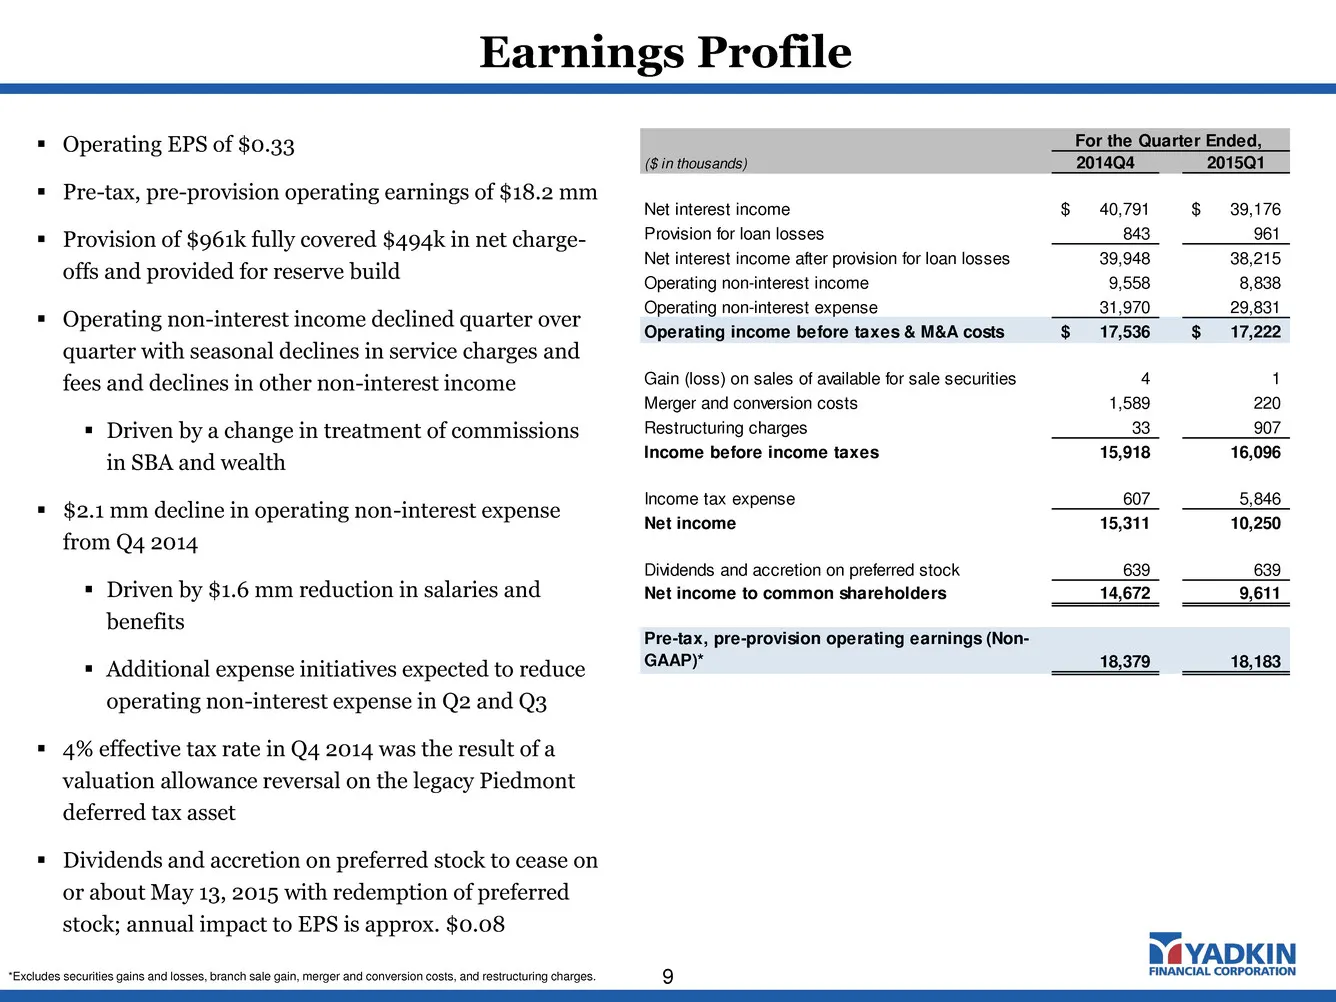
Operating EPS of $0.33 Pre-tax, pre-provision operating earnings of $18.2 mm Provision of $961k fully covered $494k in net charge- offs and provided for reserve build Operating non-interest income declined quarter over quarter with seasonal declines in service charges and fees and declines i
Slide 10: Net Interest Income
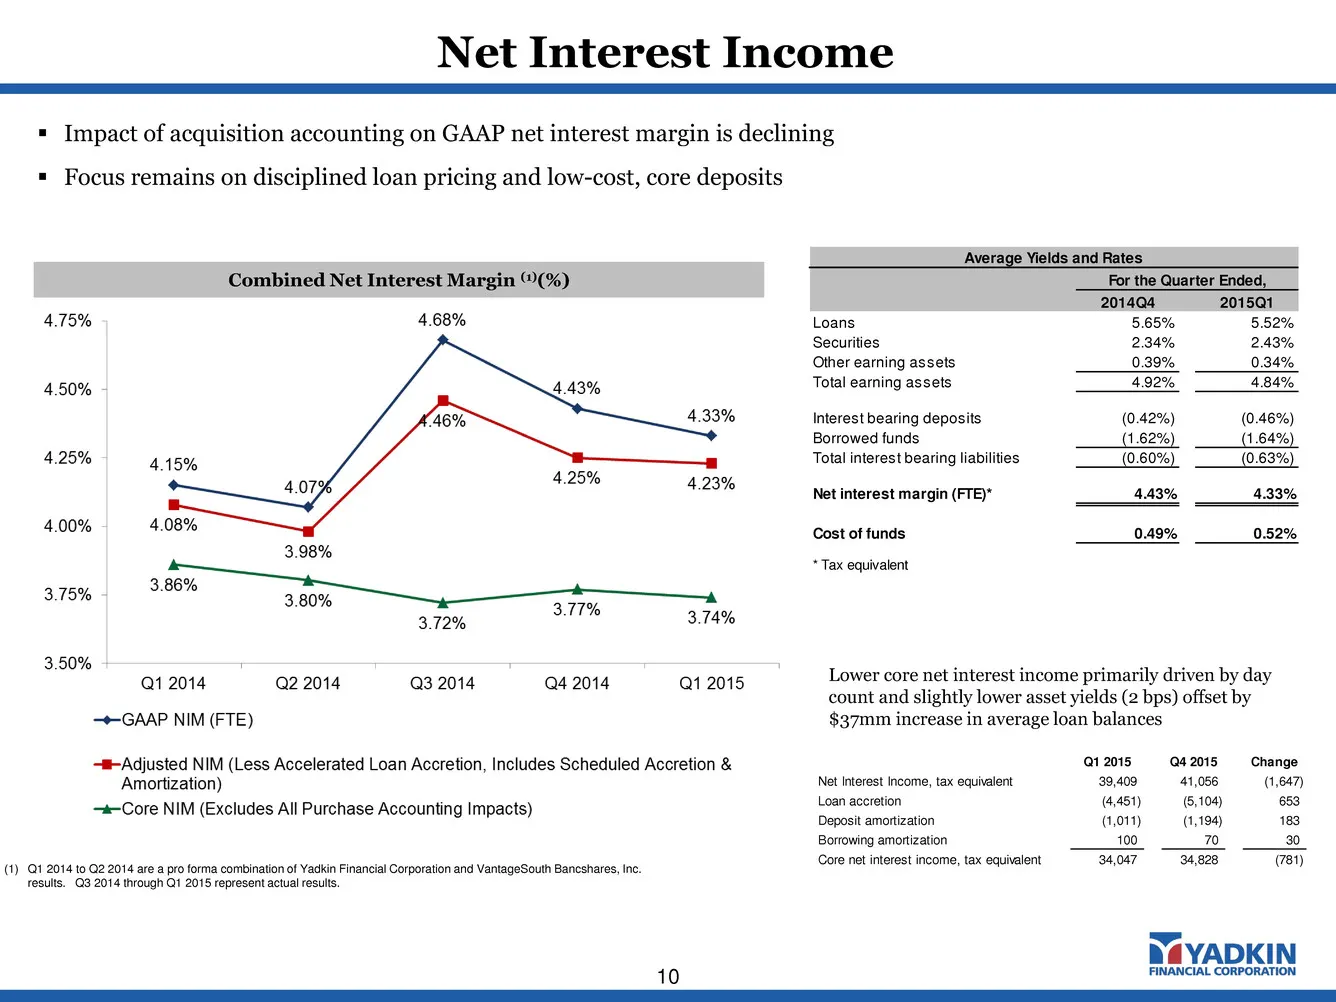
Net Interest Income 10 Combined Net Interest Margin (1)(%) Impact of acquisition accounting on GAAP net interest margin is declining Focus remains on disciplined loan pricing and low-cost, core deposits Average Yields and Rates For the Quarter Ended, 2014Q4 2015Q1 Loans 5.65% 5.52% Securities 2.
Slide 11: Diverse Drivers of Non-Interest Income Growth
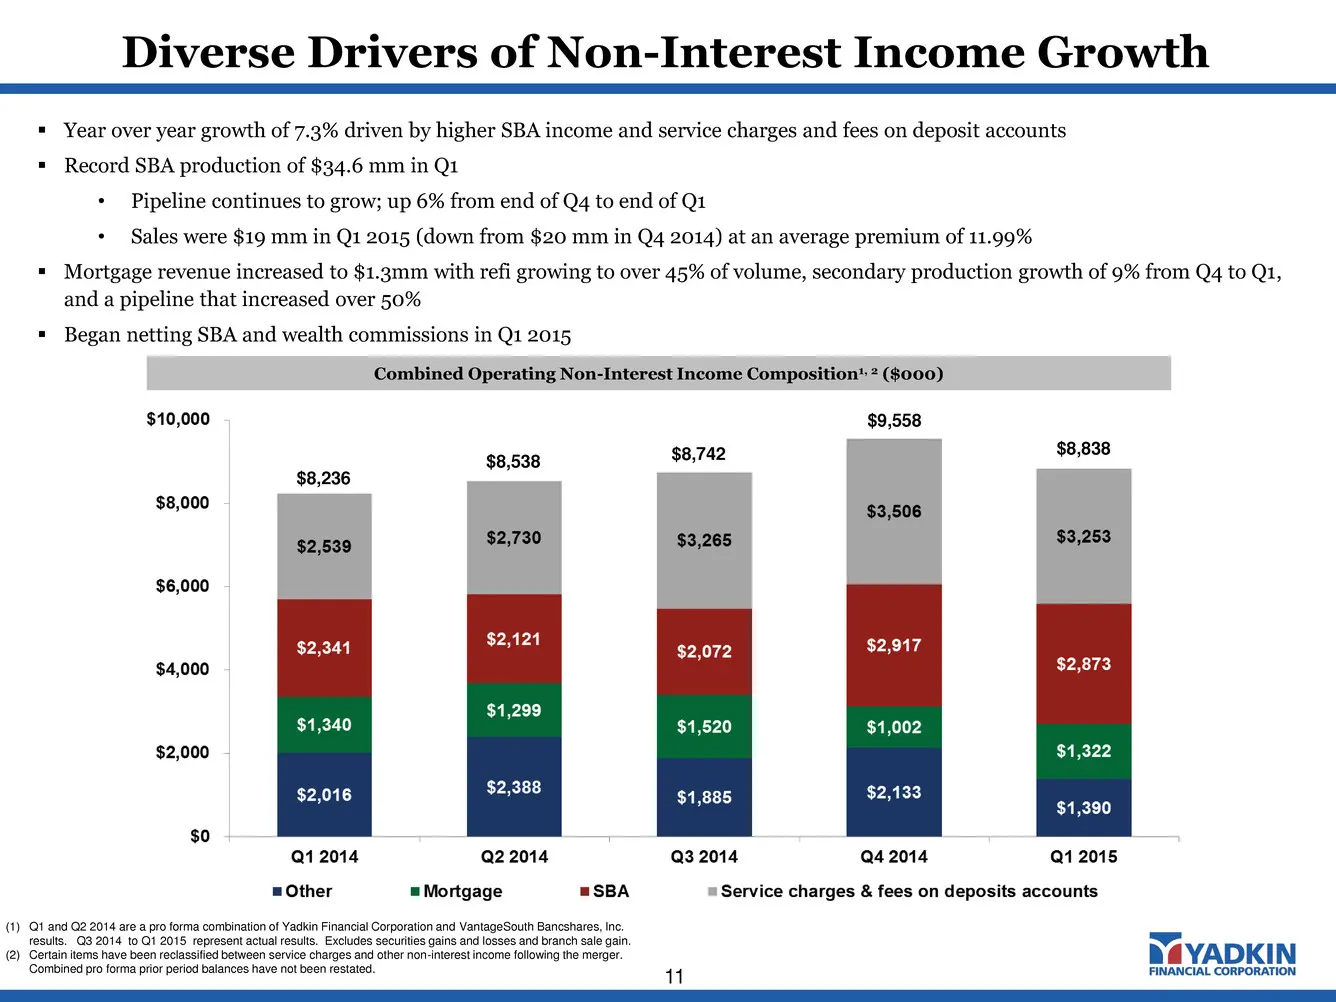
Diverse Drivers of Non-Interest Income Growth 11 Combined Operating Non-Interest Income Composition1, 2 ($000) $8,236 $8,538 $8,742 Year over year growth of 7.3% driven by higher SBA income and service charges and fees on deposit accounts Record SBA production of $34.6 mm in Q1 • Pipeline contin
Slide 12: Non-Interest Expense
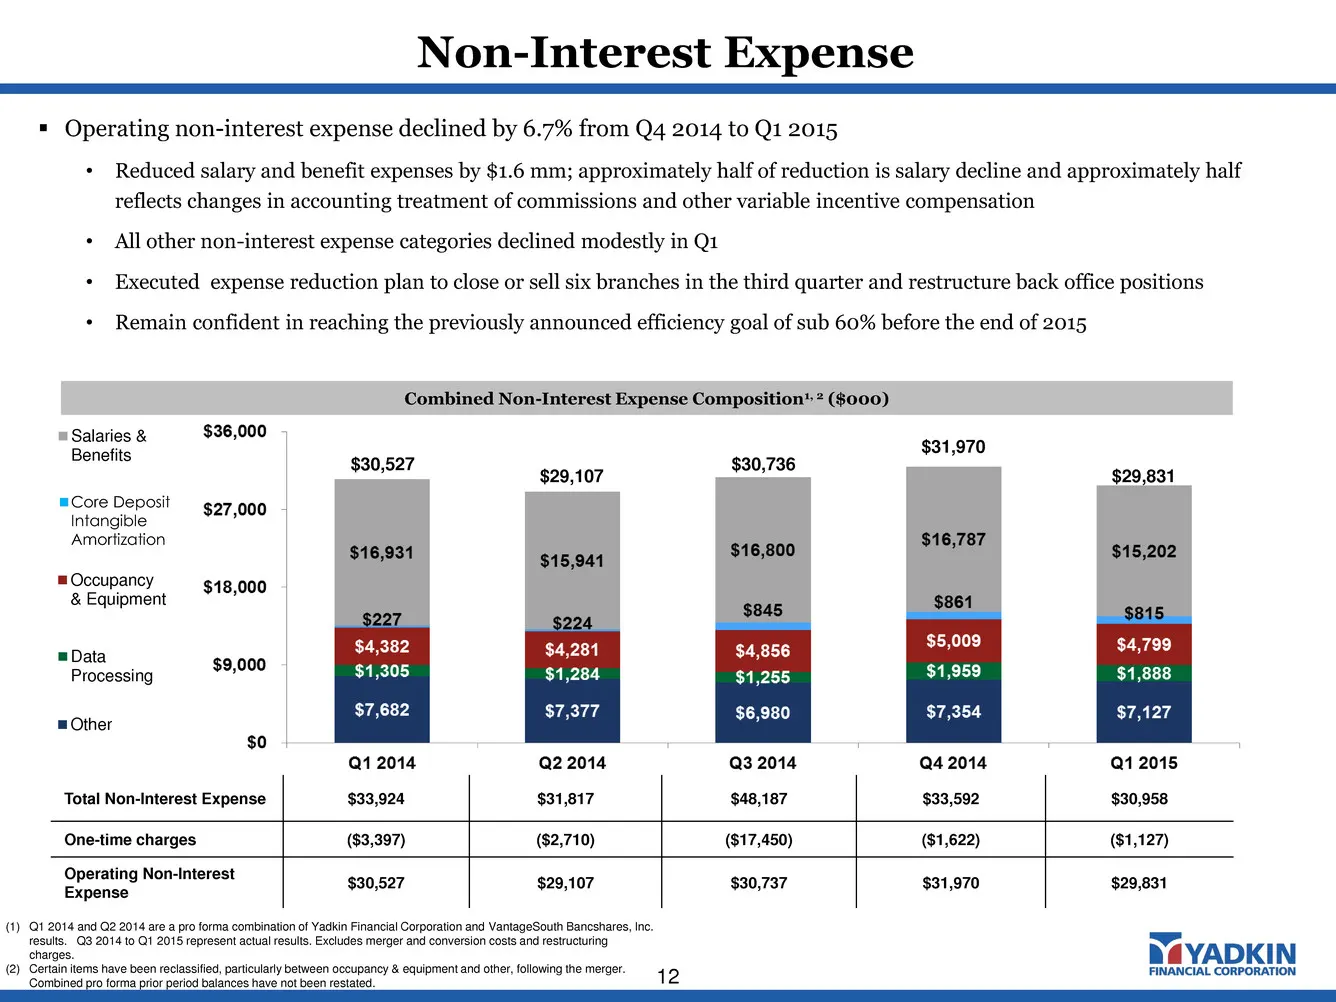
Non-Interest Expense 12 Combined Non-Interest Expense Composition1, 2 ($000) Operating non-interest expense declined by 6.7% from Q4 2014 to Q1 2015 • Reduced salary and benefit expenses by $1.6 mm; approximately half of reduction is salary decline and approximately half reflects changes in accoun
Slide 13: Conservative Balance Sheet
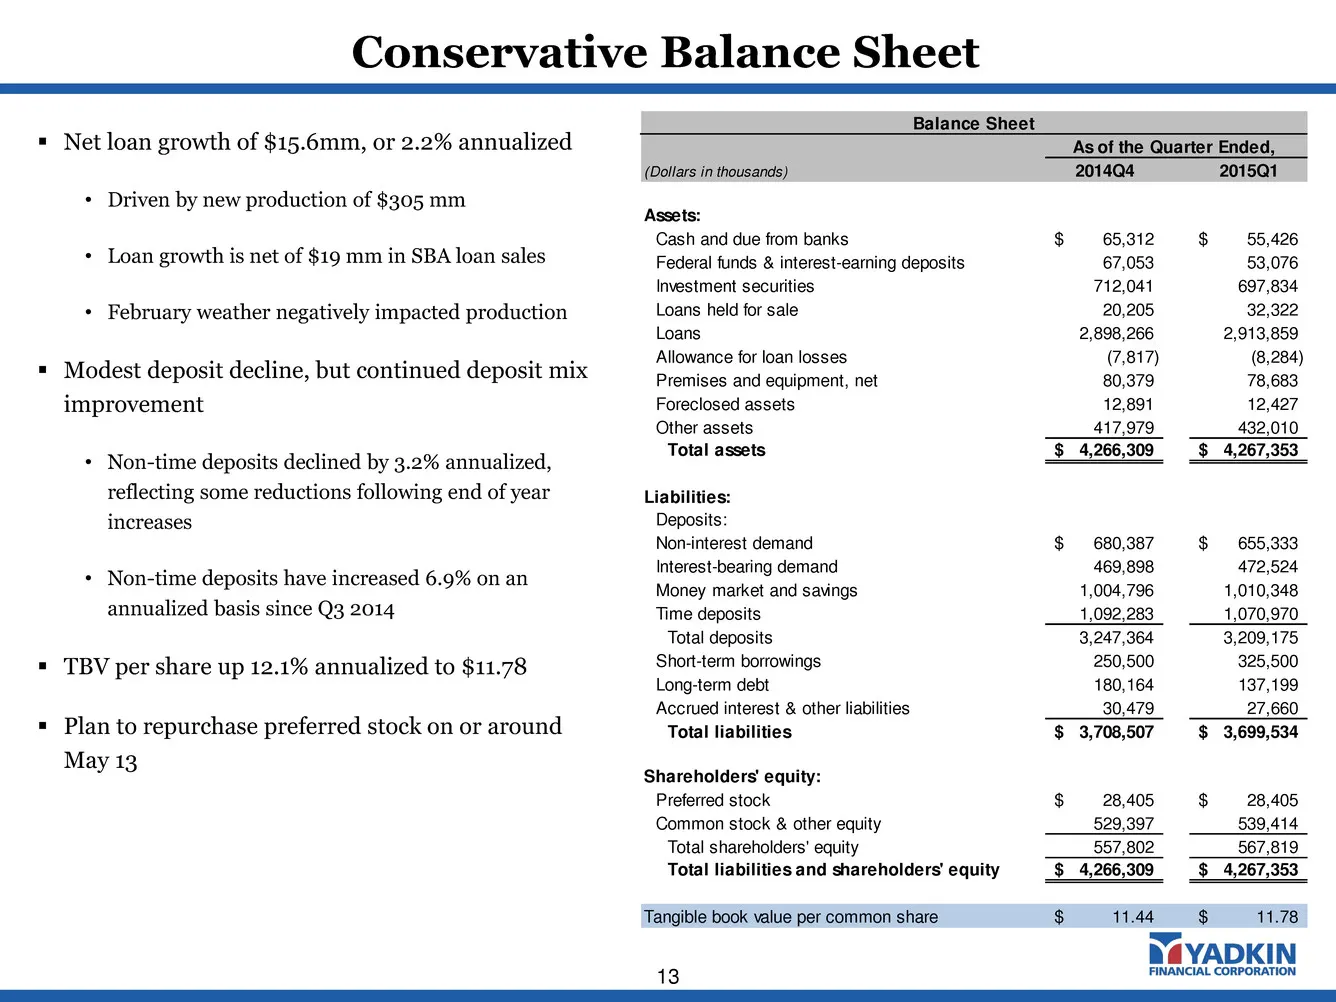
Conservative Balance Sheet 13 Net loan growth of $15.6mm, or 2.2% annualized • Driven by new production of $305 mm • Loan growth is net of $19 mm in SBA loan sales • February weather negatively impacted production Modest deposit decline, but continued deposit mix improvement • Non-time deposits
Slide 14: Positive Balance Sheet Trends
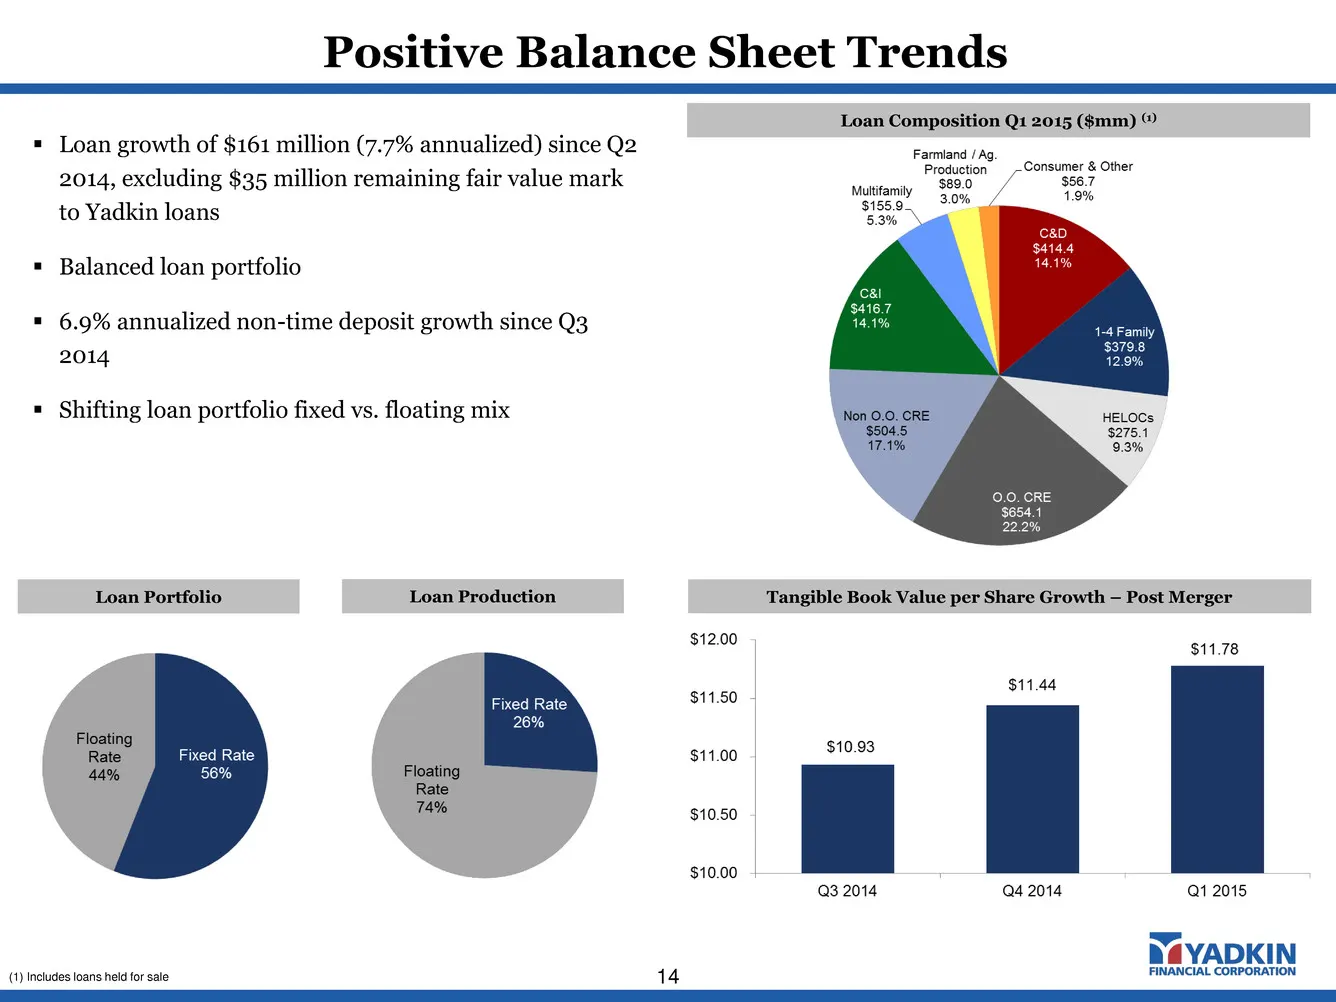
Positive Balance Sheet Trends 14 Tangible Book Value per Share Growth – Post Merger Loan Composition Q1 2015 ($mm) (1) Loan growth of $161 million (7.7% annualized) since Q2 2014, excluding $35 million remaining fair value mark to Yadkin loans Balanced loan portfolio 6.9% annualized non-time d
Slide 15: Asset Sensitive Balance Sheet
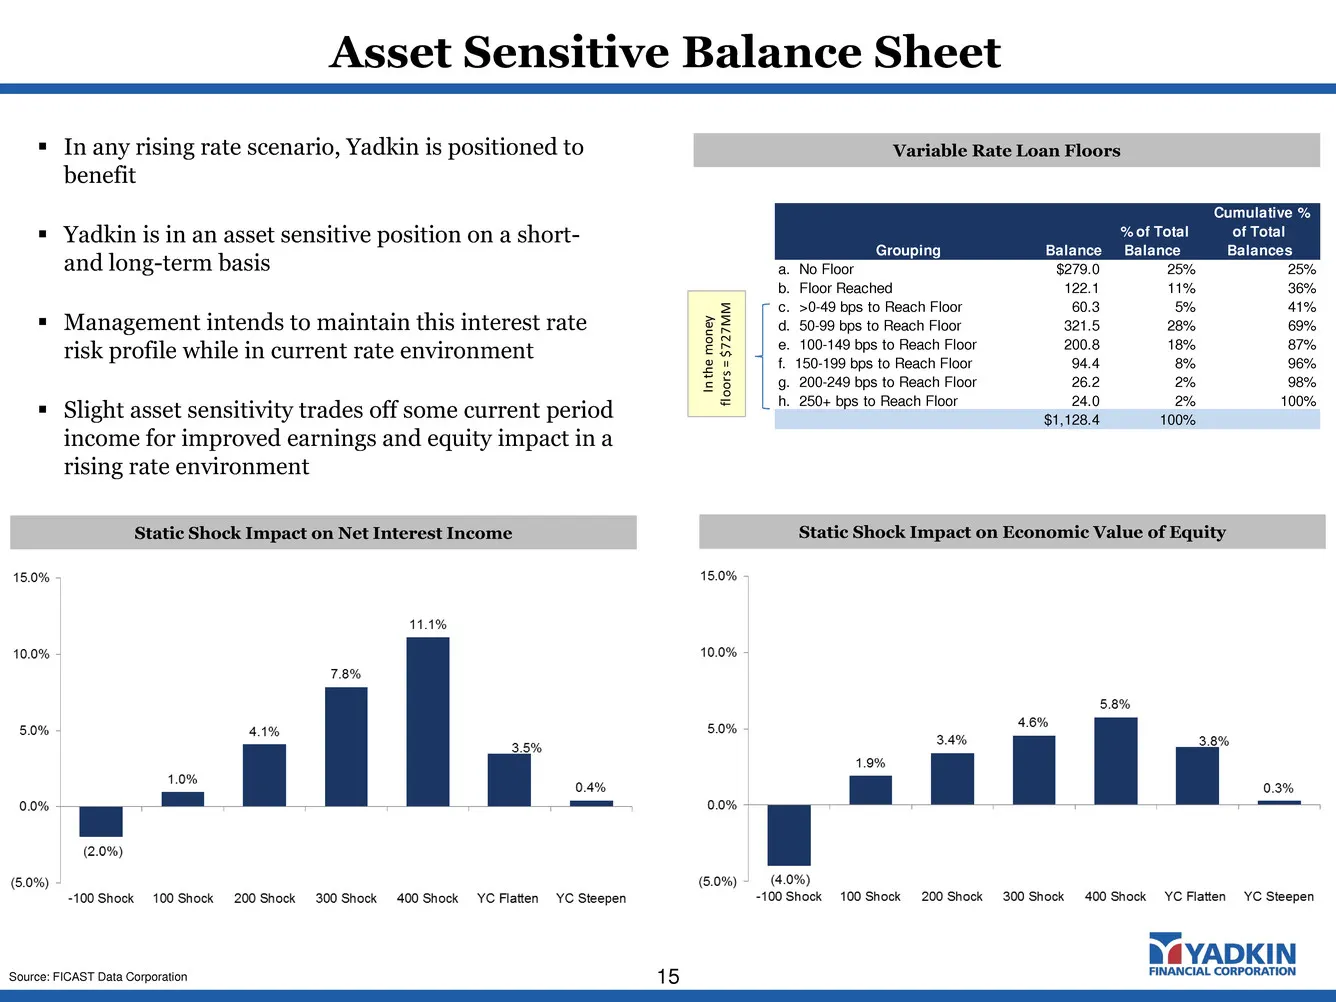
Asset Sensitive Balance Sheet 15 Static Shock Impact on Economic Value of Equity Static Shock Impact on Net Interest Income Variable Rate Loan Floors In any rising rate scenario, Yadkin is positioned to benefit Yadkin is in an asset sensitive position on a short- and long-term basis Management
Slide 16: Strong Capital Position
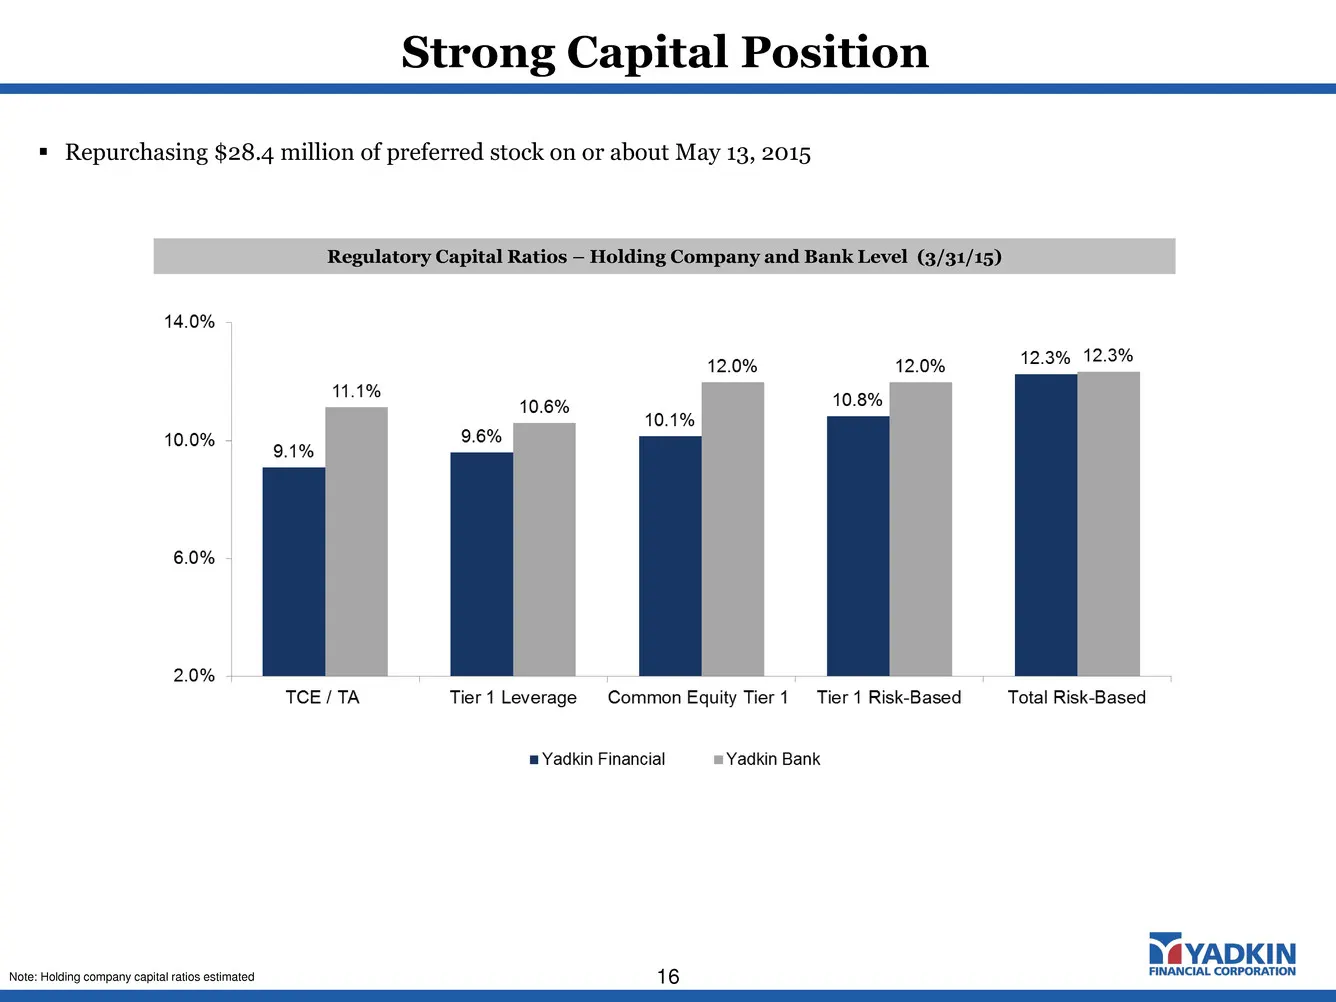
Strong Capital Position 16 Regulatory Capital Ratios – Holding Company and Bank Level (3/31/15) Repurchasing $28.4 million of preferred stock on or about May 13, 2015 Note: Holding company capital ratios estimated
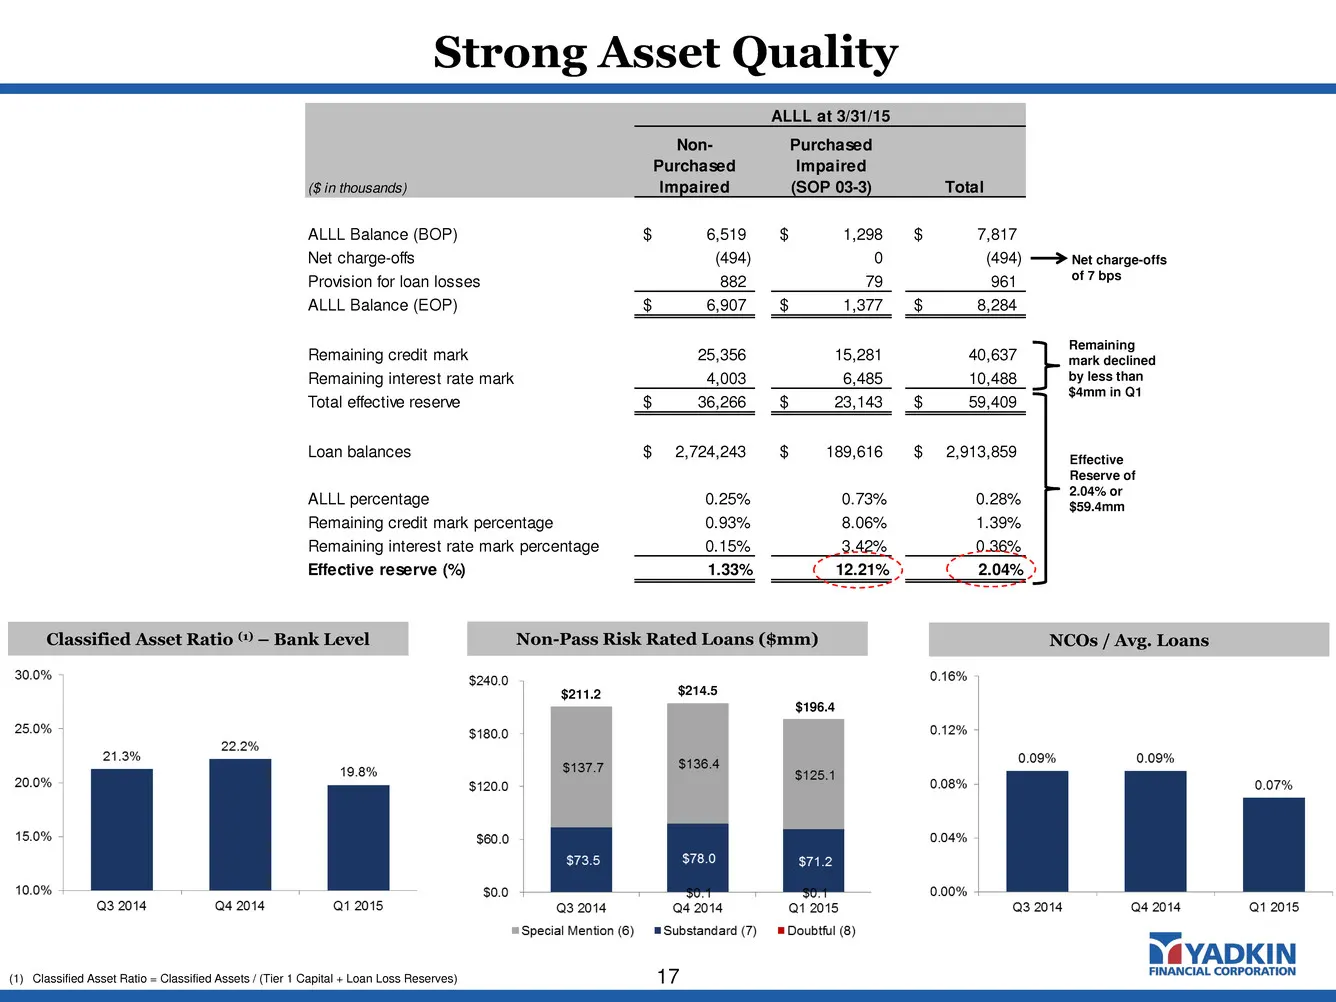
Slide 17: Strong Asset Quality
ALLL at 3/31/15 ($ in thousands) Non- Purchased Impaired Purchased Impaired (SOP 03-3) Total ALLL Balance (BOP) 6,519$ 1,298$ 7,817$ Net charge-offs (494) 0 (494) Provision for loan losses 882 79 961 ALLL Balance (EOP) 6,907$ 1,377$ 8,284$ Remaining credit mark 25,356 15,281 40,637 Remaining interes
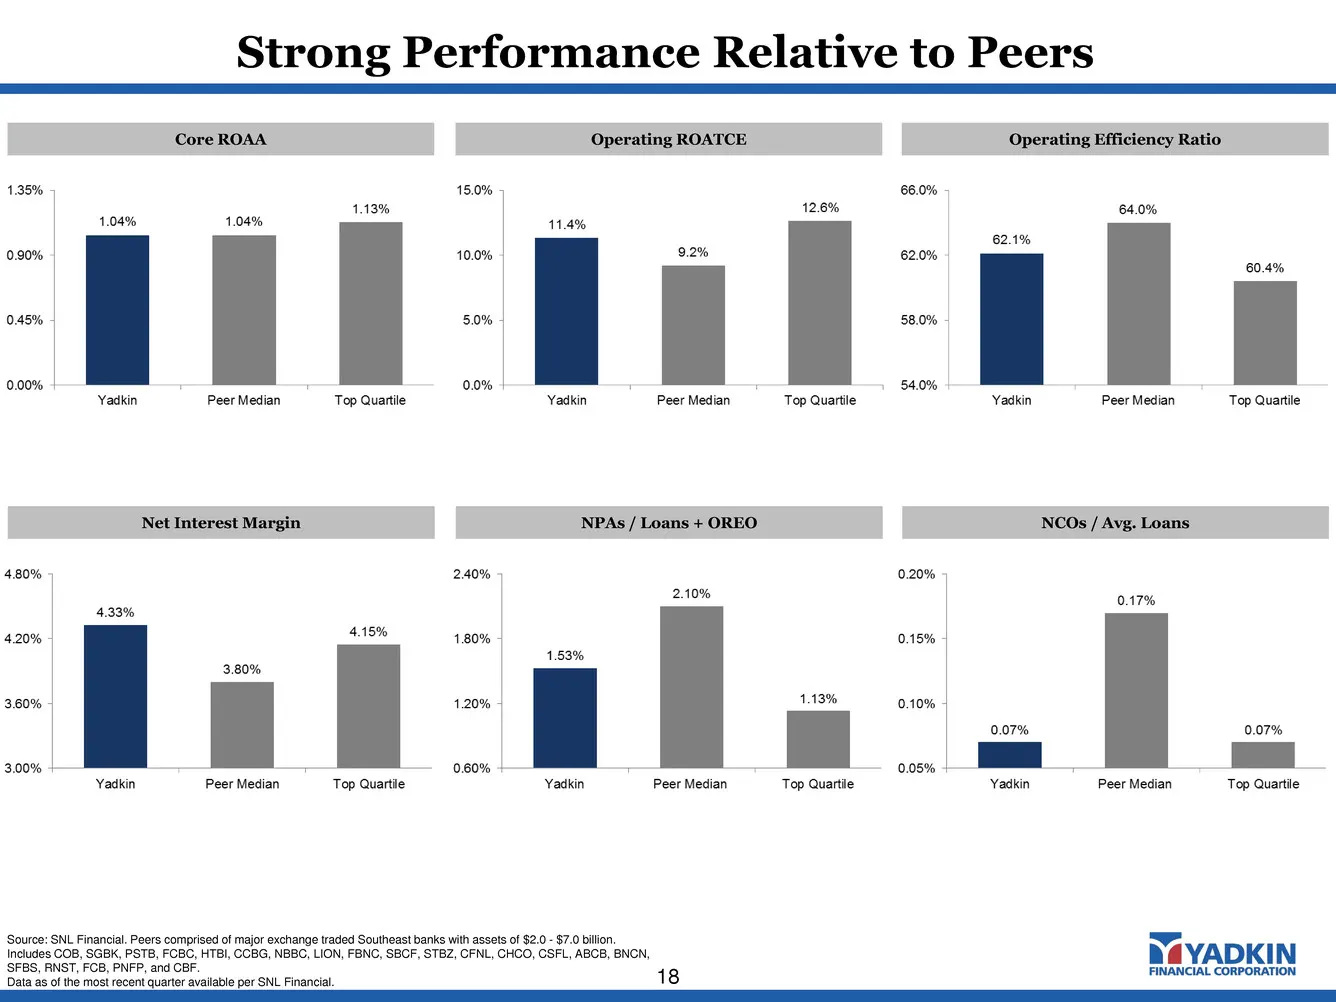
Slide 18: Strong Performance Relative to Peers
Strong Performance Relative to Peers 18 Core ROAA Operating ROATCE Operating Efficiency Ratio Net Interest Margin NPAs / Loans + OREO NCOs / Avg. Loans Source: SNL Financial. Peers comprised of major exchange traded Southeast banks with assets of $2.0 - $7.0 billion. Includes COB, SGBK, PSTB, FCBC,
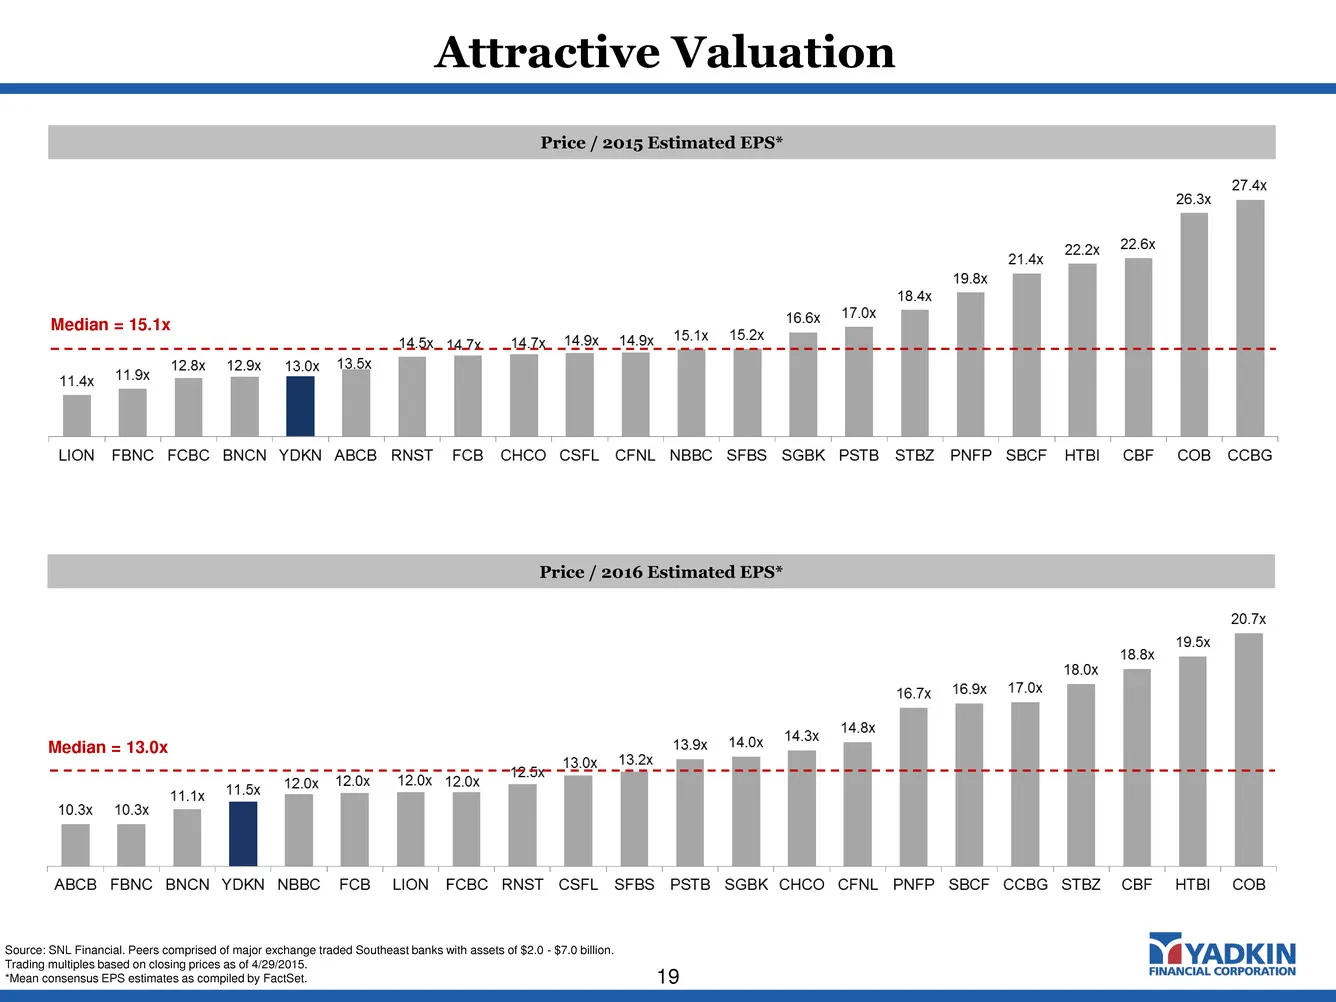
Slide 19: Attractive Valuation
Attractive Valuation 19 Price / 2016 Estimated EPS* Median = 13.0x Source: SNL Financial. Peers comprised of major exchange traded Southeast banks with assets of $2.0 - $7.0 billion. Trading multiples based on closing prices as of 4/29/2015. *Mean consensus EPS estimates as compiled by FactSet. Pric
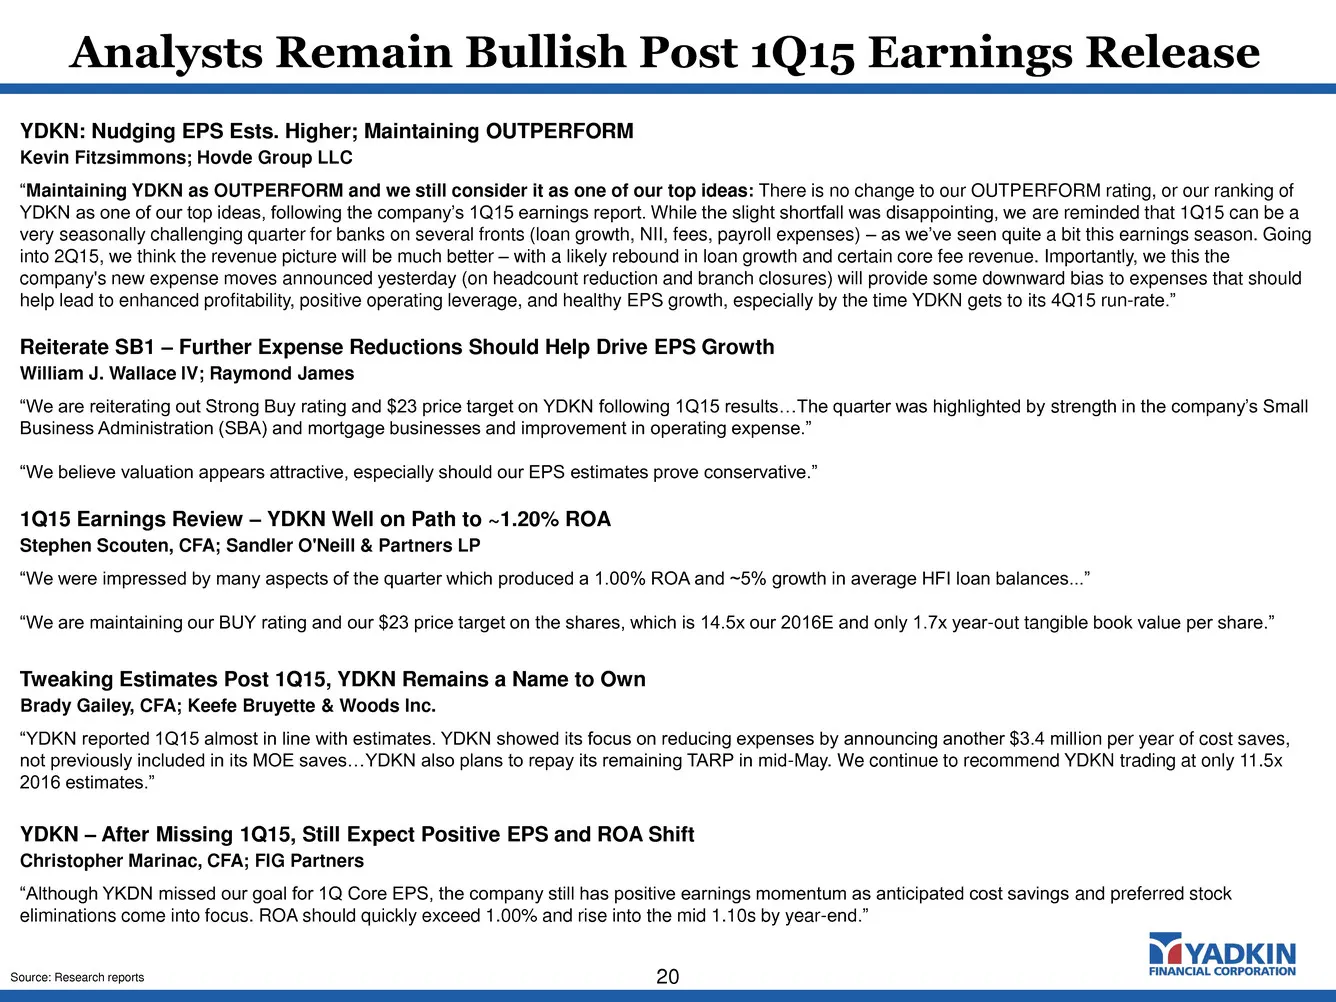
Slide 20: Analysts Remain Bullish Post 1Q15 Earnings Release
Analysts Remain Bullish Post 1Q15 Earnings Release 20 YDKN: Nudging EPS Ests. Higher; Maintaining OUTPERFORM Kevin Fitzsimmons; Hovde Group LLC “Maintaining YDKN as OUTPERFORM and we still consider it as one of our top ideas: There is no change to our OUTPERFORM rating, or our ranking of YDKN as one
Slide 21: Analyst Recommendations
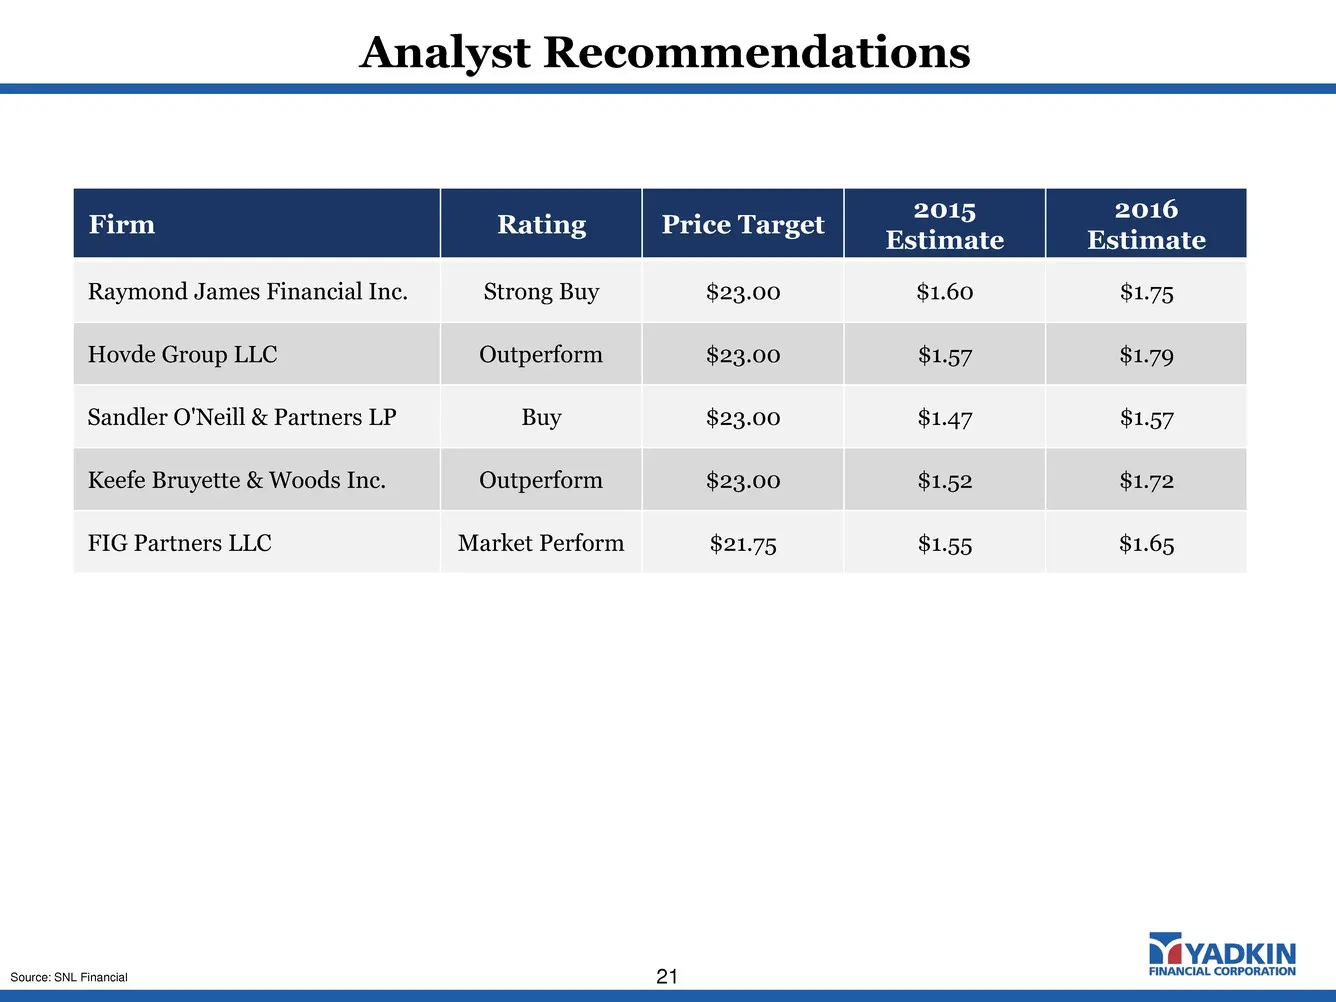
Analyst Recommendations 21 Firm Rating Price Target 2015 Estimate 2016 Estimate Raymond James Financial Inc. Strong Buy $23.00 $1.60 $1.75 Hovde Group LLC Outperform $23.00 $1.57 $1.79 Sandler O'Neill & Partners LP Buy $23.00 $1.47 $1.57 Keefe Bruyette & Woods Inc. Outperform $23.00 $1.52 $1.72 FIG
Source: SEC EDGAR · 8-K filed May 4, 2015
More decks from Yadkin Financial Corp
 Merger or Acquisition (August 2016)38 slides · Aug 16, 2016
 Merger or Acquisition (July 2016)20 slides · Jul 21, 2016
 Gulf South Bank Conference 201624 slides · May 2, 2016
 Q1 2016 Earnings Presentation10 slides · Apr 21, 2016
 Q4 2015 Earnings Presentation13 slides · Jan 28, 2016
 Q3 2015 Earnings Presentation29 slides · Nov 10, 2015