Universal American — Raymond James Healthcare Conference 2011
15 slides from Universal American's conference presentation, Mar 9, 2011
Slide 1: Raymond James Healthcare Conference March 8, 2011
Raymond James Healthcare Conference March 8, 2011
Slide 2: Forward-Looking Statements/Non-GAAP Financial Measures
Forward-Looking Statements/Non-GAAP Financial Measures This presentation contains "forward-looking" statements within the meaning of the federal securities. We warn you that forward-looking statements are only predictions and estimates, which are inherently subject to risks, trends and uncertainties
Slide 3: Additional Information
Additional Information In connection with the proposed transaction with CVS Caremark, New UAM will file with the SEC a Registration Statement on Form S-4 that will include a proxy statement of Universal American that also constitutes a prospectus of New UAM. We will mail the proxy statement/prospect
Slide 4: Senior Market: It's only just beginning
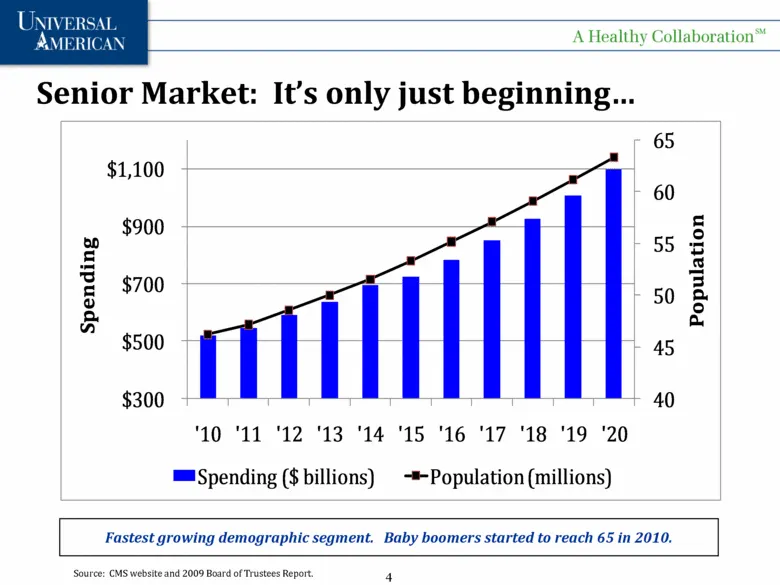
Senior Market: It’s only just beginning Fastest growing demographic segment. Baby boomers started to reach 65 in 2010. Source: CMS website and 2009 Board of Trustees Report. 40 45 50 55 60 65 $300 $500 $700 $900 $1,100 '10 '11 '12 '13 '14 '15 '16 '17 '18 '19 '20 Population Spending Spending ($ billi
Slide 5: Universal American Evolution
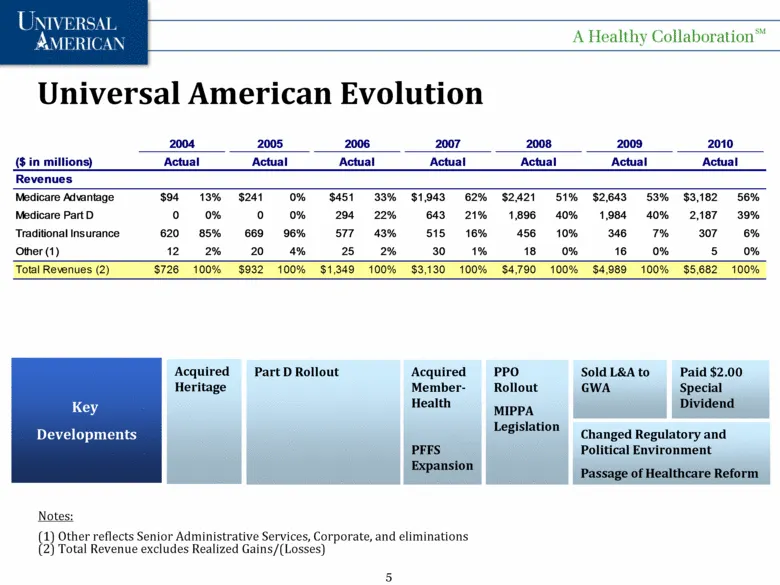
Universal American Evolution Part D Rollout Acquired Member-Health PFFS Expansion Key Developments PPO Rollout MIPPA Legislation Changed Regulatory and Political Environment Passage of Healthcare Reform Notes: (1) Other reflects Senior Administrative Services, Corporate, and eliminations (2) Total R
Slide 6: Summary P&L – Full year 2010
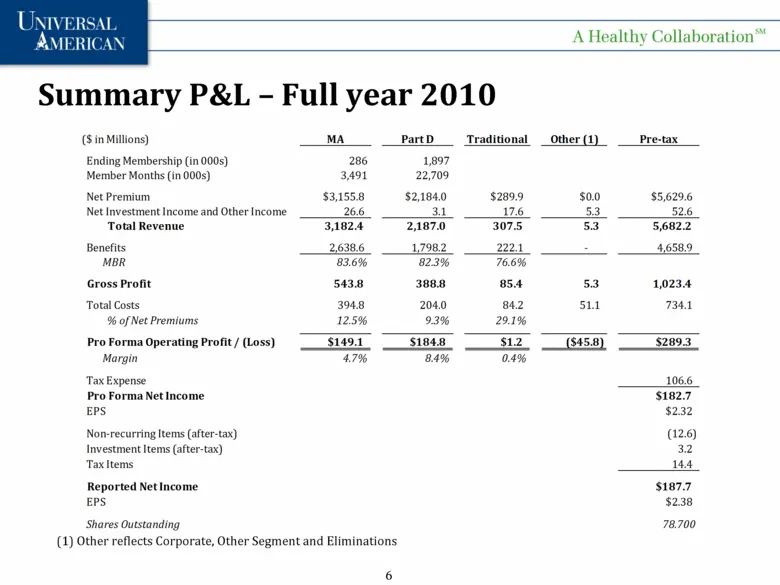
Summary P&L – Full year 2010 (1) Other reflects Corporate, Other Segment and Eliminations ($ in Millions) MA Part D Traditional Other (1) Pre-tax Ending Membership (in 000s) 286 1,897 Member Months (in 000s) 3,491 22,709 Net Premium $3,155.8 $2,184.0 $289.9 $0.0 $5,629.6 Net Investment Income and Ot
Slide 7: Balance Sheet
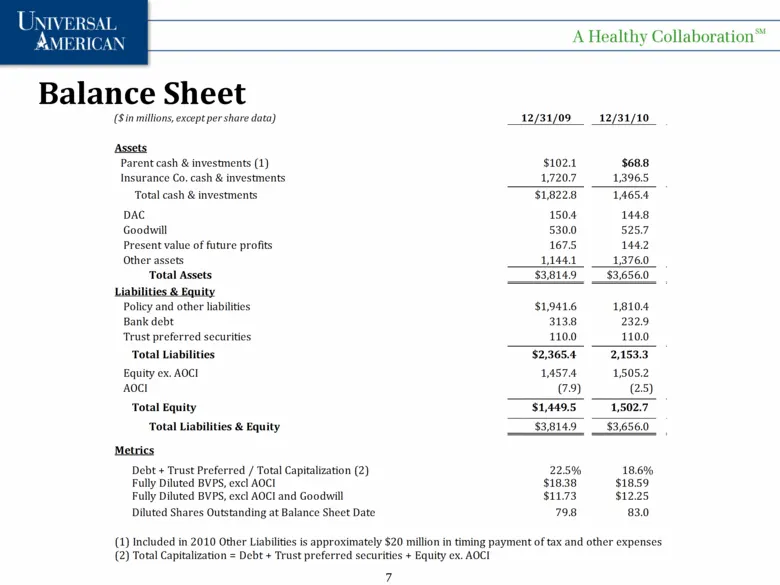
Balance Sheet ($ in millions, except per share data) 12/31/09 12/31/10 Assets Parent cash & investments (1) $102.1 $68.8 Insurance Co. cash & investments 1,720.7 1,396.5 Total cash & investments $1,822.8 1,465.4 DAC 150.4 144.8 Goodwill 530.0 525.7 Present value of future profits 167.5 144.2 Other a
Slide 8: Medicare Part D Highlights
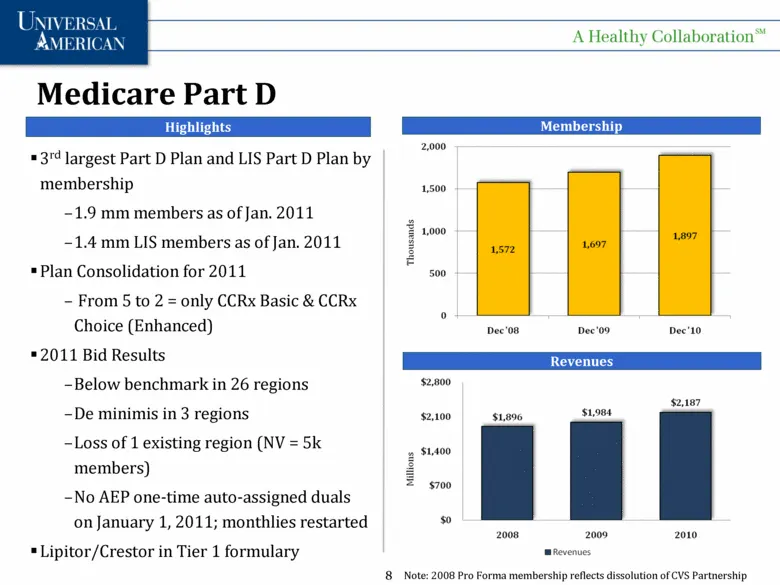
Medicare Part D Highlights Revenues Membership Note: 2008 Pro Forma membership reflects dissolution of CVS Partnership 3rd largest Part D Plan and LIS Part D Plan by membership 1.9 mm members as of Jan. 2011 1.4 mm LIS members as of Jan. 2011 Plan Consolidation for 2011 From 5 to 2 = only CCRx Basic
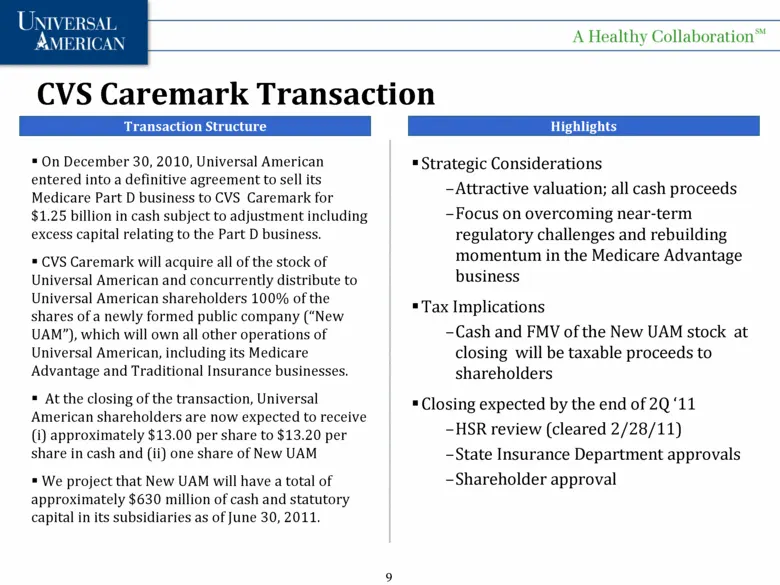
Slide 9: CVS Caremark Transaction Highlights
CVS Caremark Transaction Highlights Strategic Considerations Attractive valuation; all cash proceeds Focus on overcoming near-term regulatory challenges and rebuilding momentum in the Medicare Advantage business Tax Implications Cash and FMV of the New UAM stock at closing will be taxable proceeds t
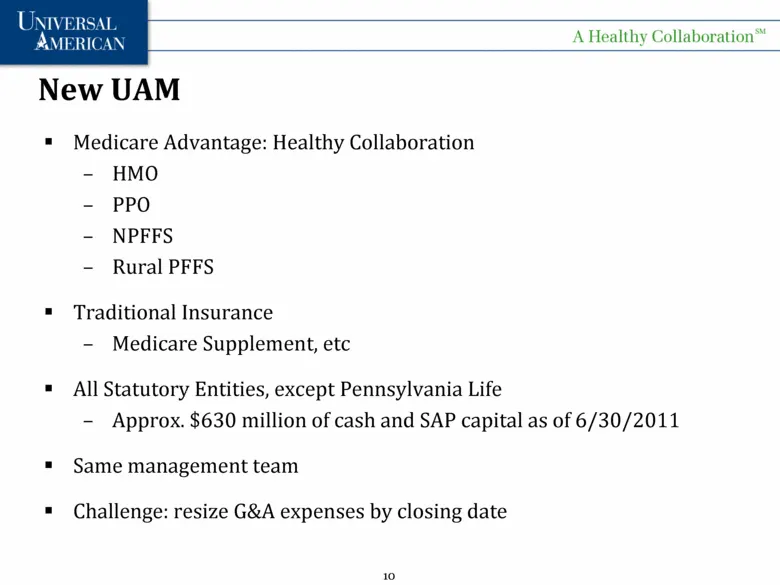
Slide 10: New UAM Medicare Advantage: Healthy Collaboration
New UAM Medicare Advantage: Healthy Collaboration HMO PPO NPFFS Rural PFFS Traditional Insurance Medicare Supplement, etc All Statutory Entities, except Pennsylvania Life Approx. $630 million of cash and SAP capital as of 6/30/2011 Same management team Challenge: resize G&A expenses by closing date
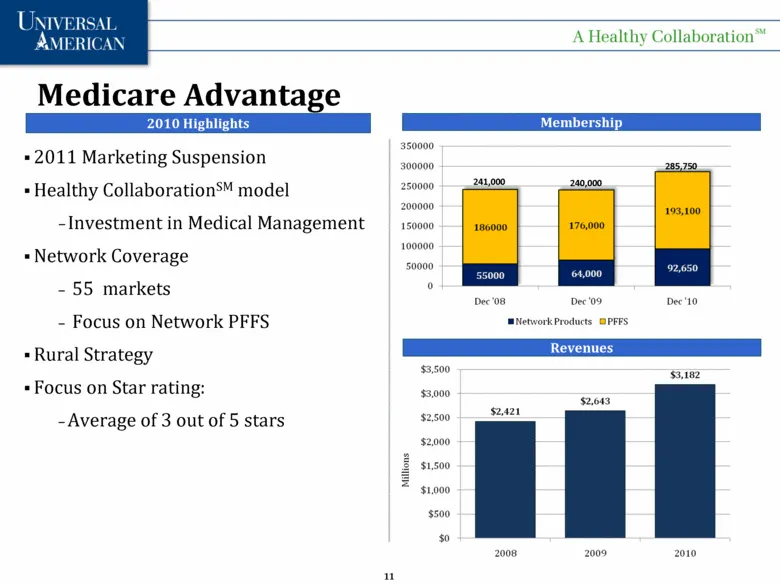
Slide 11: Medicare Advantage 2010 Highlights
Medicare Advantage 2010 Highlights Revenues Membership 241,000 240,000 285,750 2011 Marketing Suspension Healthy CollaborationSM model Investment in Medical Management Network Coverage 55 markets Focus on Network PFFS Rural Strategy Focus on Star rating: Average of 3 out of 5 stars
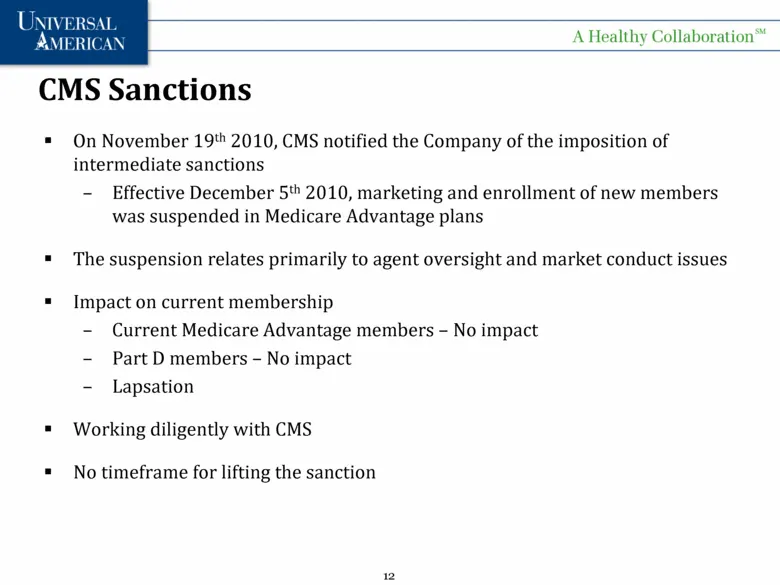
Slide 12: CMS Sanctions
On November 19th 2010, CMS notified the Company of the imposition of intermediate sanctions Effective December 5th 2010, marketing and enrollment of new members was suspended in Medicare Advantage plans The suspension relates primarily to agent oversight and market conduct issues Impact on current m
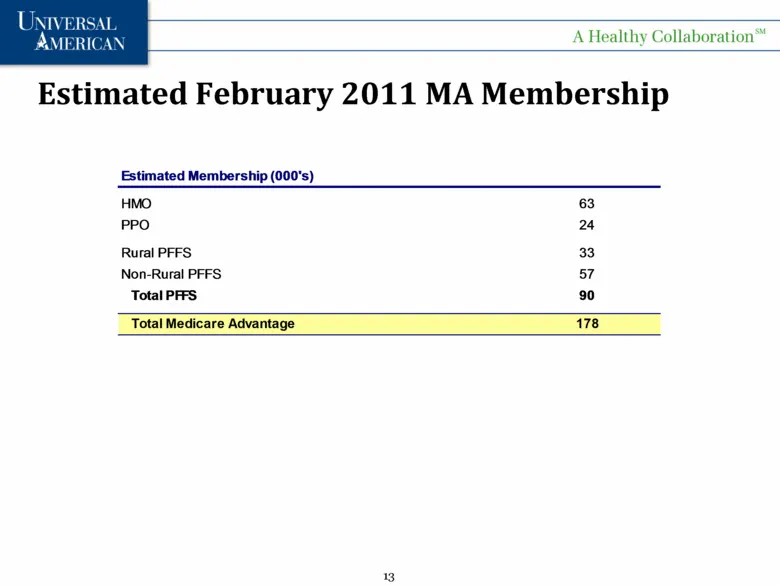
Slide 13: Estimated February 2011 MA Membership
Estimated February 2011 MA Membership Estimated Membership (000's) HMO 63 PPO 24 Rural PFFS 33 Non-Rural PFFS 57 Total PFFS 90 Total Medicare Advantage 178
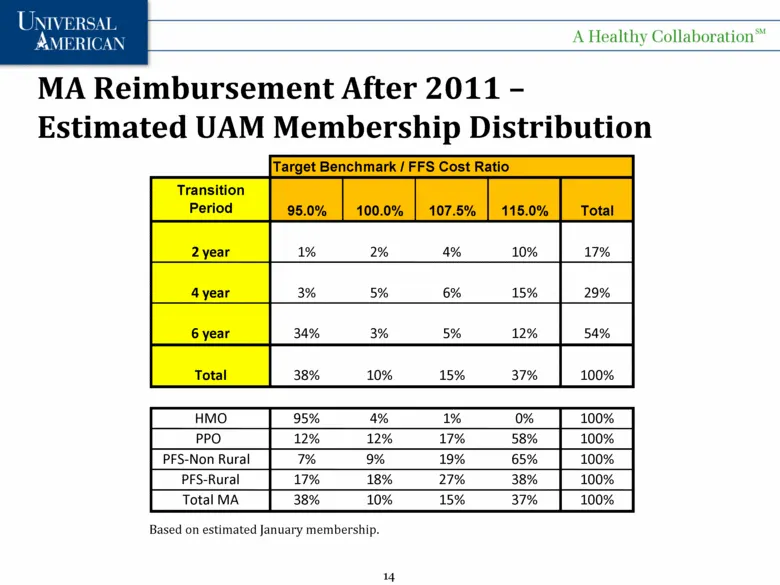
Slide 14: MA Reimbursement After 2011 – Estimated UAM Membership Distribution
MA Reimbursement After 2011 – Estimated UAM Membership Distribution Based on estimated January membership. Target Benchmark / FFS Cost Ratio Transition Period 95.0% 100.0% 107.5% 115.0% Total 2 year 1% 2% 4% 10% 17% 4 year 3% 5% 6% 15% 29% 6 year 34% 3% 5% 12% 54% Total 38% 10% 15% 37% 100% HMO 95%

Slide 15: Universal American: A Healthy Collaboration
UNIVERSAL AMERICAN A Healthy Collaboration
Source: SEC EDGAR · 425 filed Mar 9, 2011
More decks from Universal American Corp
 Barclays Capital Global Healthcare Conference 201115 slides · Mar 15, 2011
 Q4 2010 Earnings Presentation14 slides · Feb 17, 2011
 JP Morgan Healthcare Conference 201114 slides · Jan 12, 2011
 Goldman Sachs Healthcare Conference 201016 slides · Jun 17, 2010
 Universal American Financial — Investor Day (December 2007)42 slides · Dec 14, 2007