Seacoast Banking Corporation of Florida · NASDAQ:SBCF
Seacoast Banking Corporation of Florida — Seacoast Banking Corp of Florida — Q3 2024 Earnings Presentation
37 slides from Seacoast Banking Corporation of Florida's earnings presentation, Nov 6, 2024
Slide 1: Third Quarter 2024 Investor Presentation
INVESTOR PRESENTATION THIRD QUARTER 2024 2024
Slide 2: Cautionary Notice Regarding Forward-Looking Statements
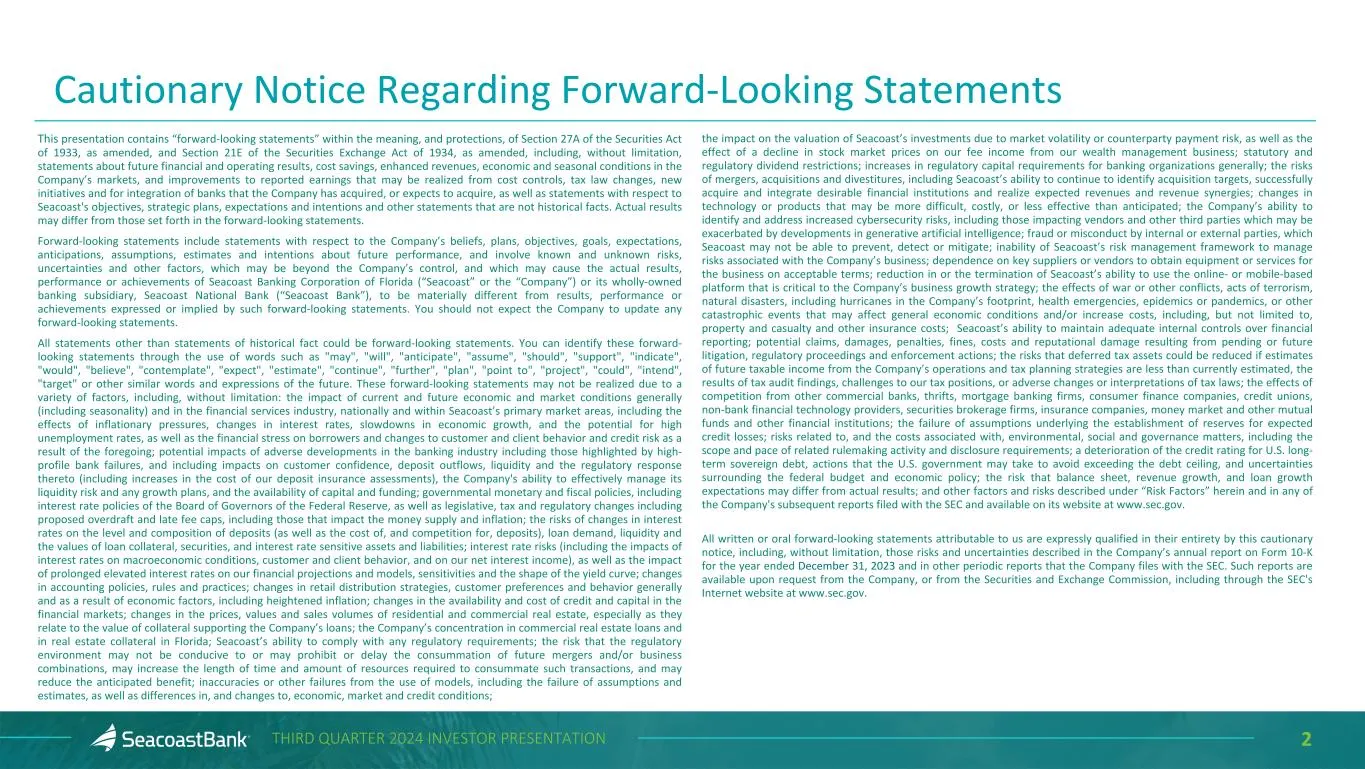
2THIRD QUARTER 2024 INVESTOR PRESENTATION Cautionary Notice Regarding Forward-Looking Statements This presentation contains “forward-looking statements” within the meaning, and protections, of Section 27A of the Securities Act of 1933, as amended, and Section 21E of the Securities Exchange Act of 19
Slide 3: Agenda
01 ABOUT SEACOAST BANK 02 OUTLOOK 03 COMPANY PERFORMANCE 04 APPENDIX

Slide 4: About Seacoast Bank
AGENDA ABOUT SEACOAST BANK
Slide 5: Valuable Florida Franchise with Strong Capital and Liquidity
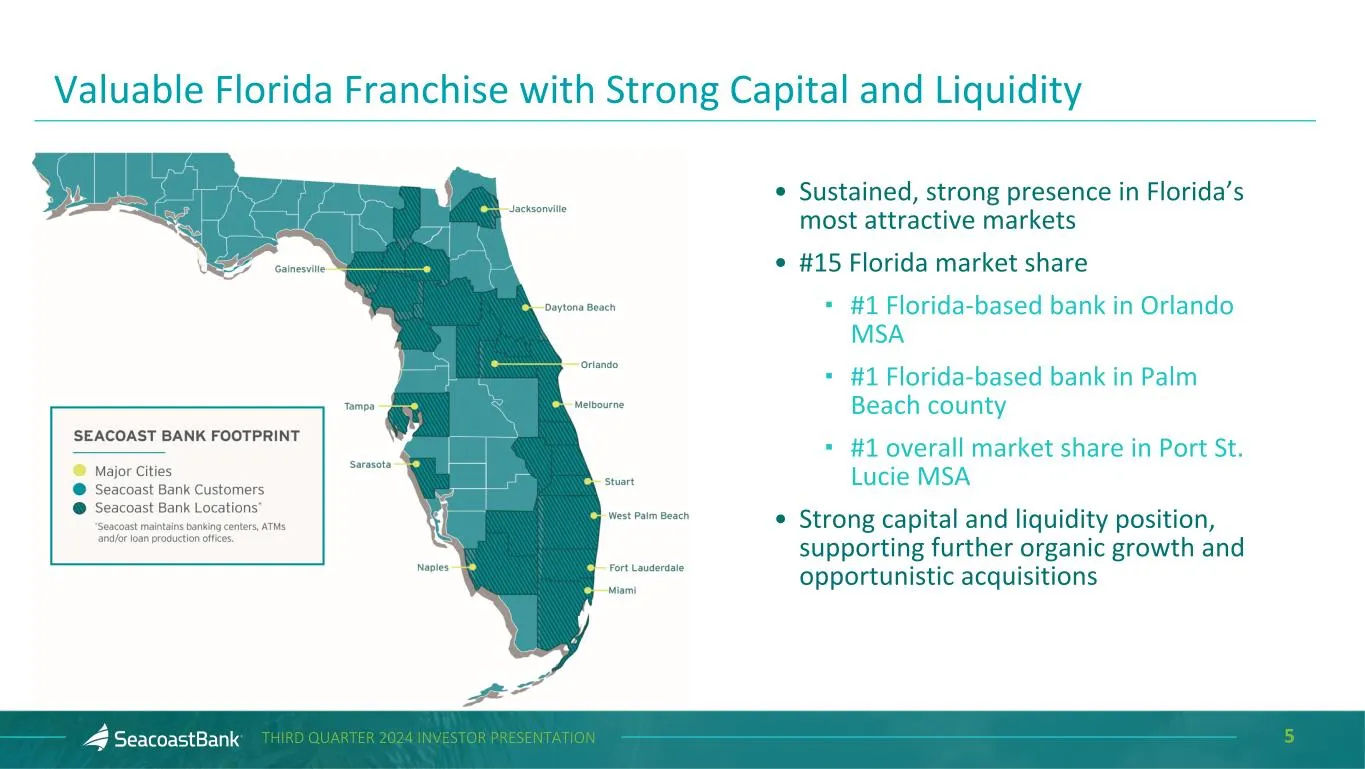
5THIRD QUARTER 2024 INVESTOR PRESENTATION • Sustained, strong presence in Florida’s most attractive markets • #15 Florida market share ▪ #1 Florida-based bank in Orlando MSA ▪ #1 Florida-based bank in Palm Beach county ▪ #1 overall market share in Port St. Lucie MSA • Strong capital and liquidity po
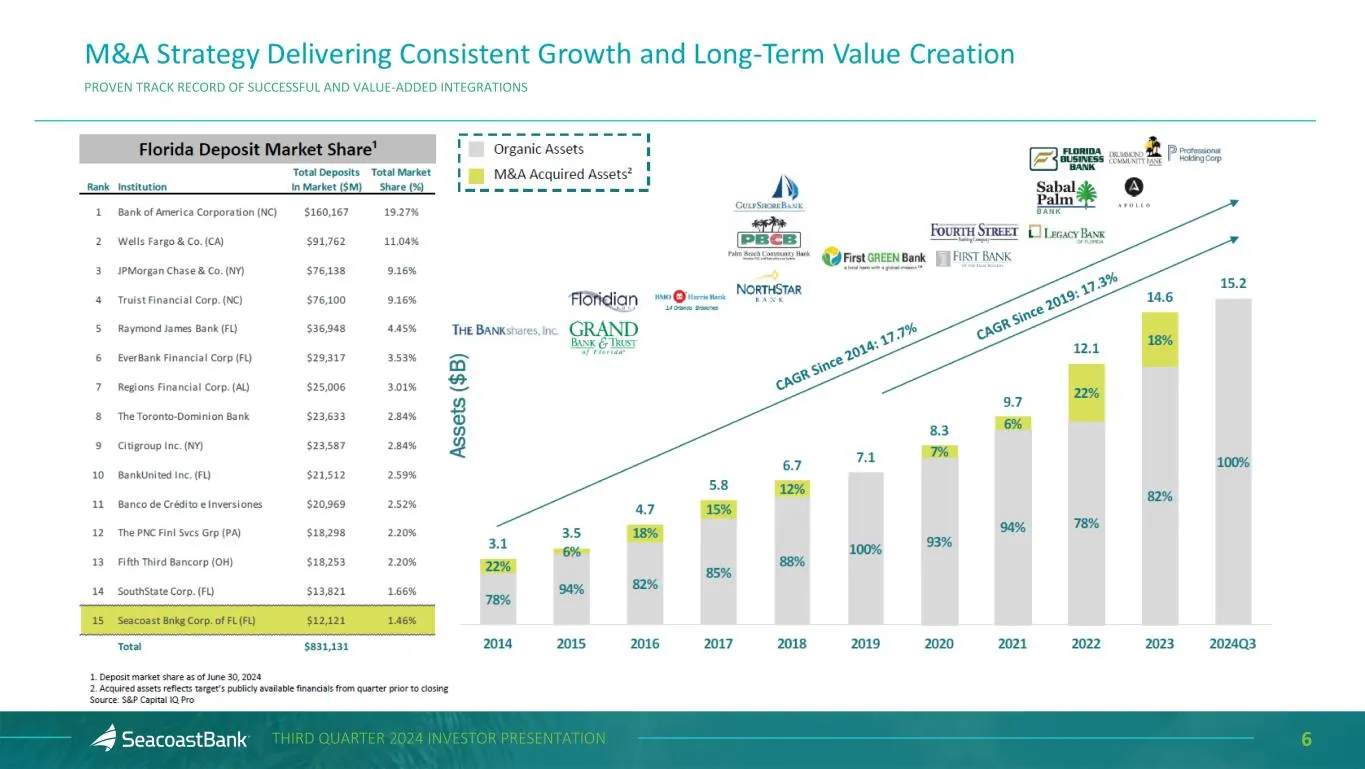
Slide 6: Proven Track Record of Successful and Value-Added Integrations
6THIRD QUARTER 2024 INVESTOR PRESENTATION PROVEN TRACK RECORD OF SUCCESSFUL AND VALUE-ADDED INTEGRATIONS

Slide 7: Outlook
AGENDA OUTLOOK
Slide 8: Executing Our Balanced Growth Strategy
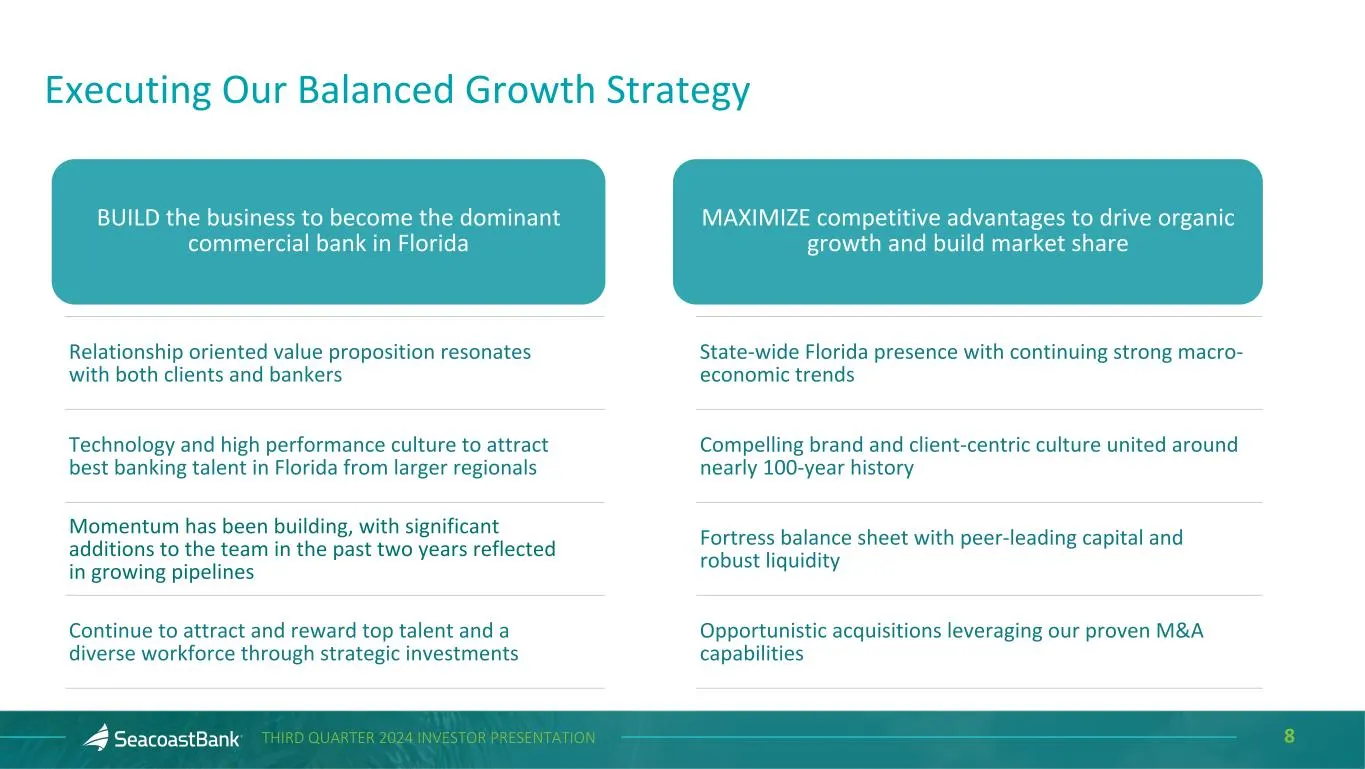
8THIRD QUARTER 2024 INVESTOR PRESENTATION Executing Our Balanced Growth Strategy Relationship oriented value proposition resonates with both clients and bankers Technology and high performance culture to attract best banking talent in Florida from larger regionals Momentum has been building, with si
Slide 9: Company Performance
AGENDA COMPANY PERFORMANCE
Slide 10: Third Quarter 2024 Highlights
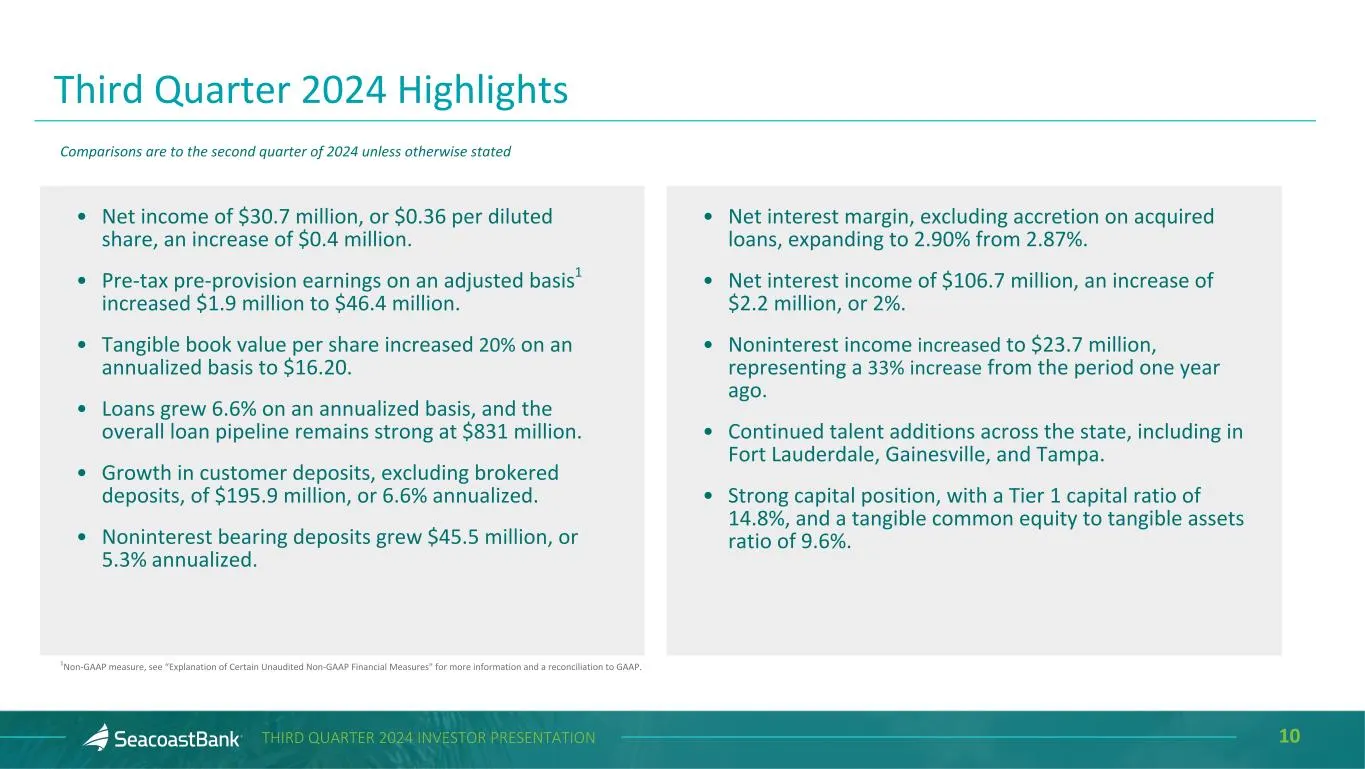
10THIRD QUARTER 2024 INVESTOR PRESENTATION • Net income of $30.7 million, or $0.36 per diluted share, an increase of $0.4 million. • Pre-tax pre-provision earnings on an adjusted basis1 increased $1.9 million to $46.4 million. • Tangible book value per share increased 20% on an annualized basis to $
Slide 11: Net Interest Income
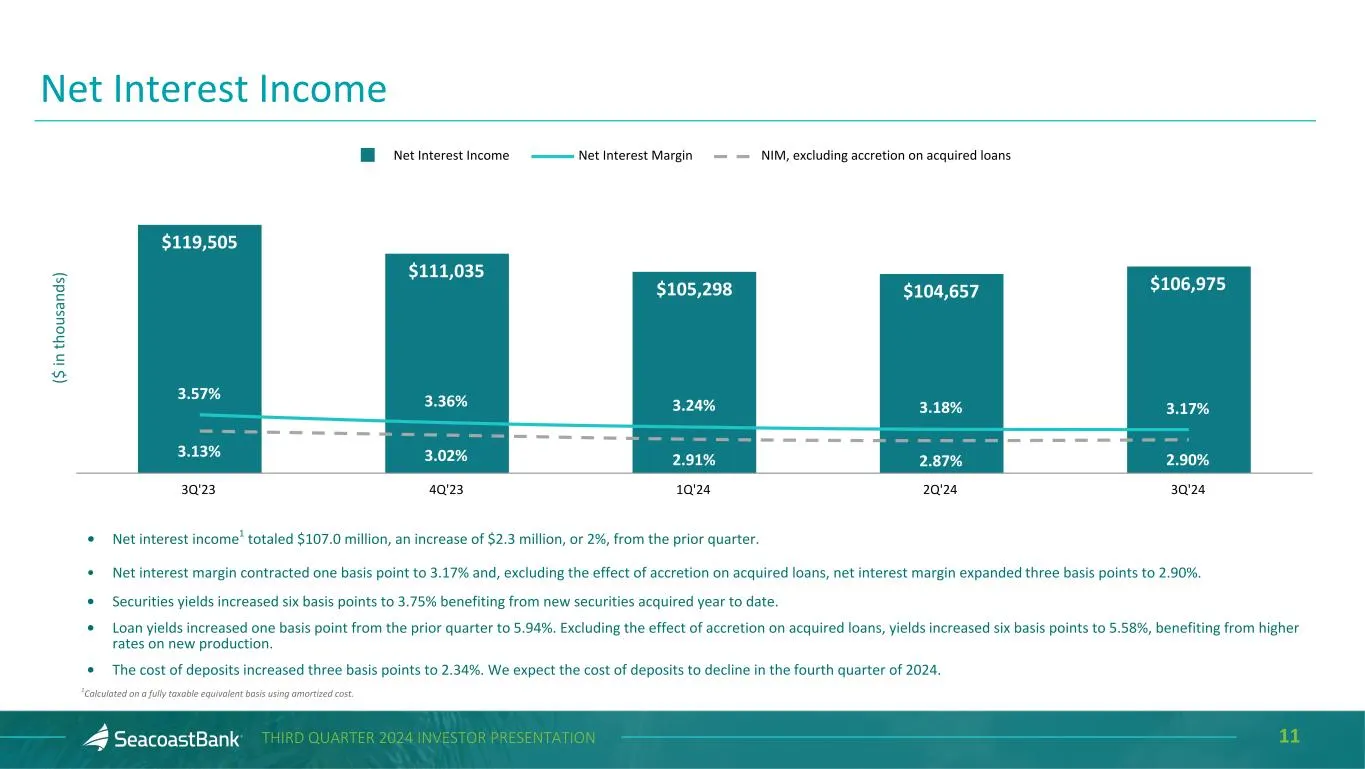
11THIRD QUARTER 2024 INVESTOR PRESENTATION Net Interest Income ($ in th ou sa nd s) $119,505 $111,035 $105,298 $104,657 $106,975 3.57% 3.36% 3.24% 3.18% 3.17% 3.13% 3.02% 2.91% 2.87% 2.90% Net Interest Income Net Interest Margin NIM, excluding accretion on acquired loans 3Q'23 4Q'23 1Q'24 2Q'24 3Q'2
Slide 12: Noninterest Income
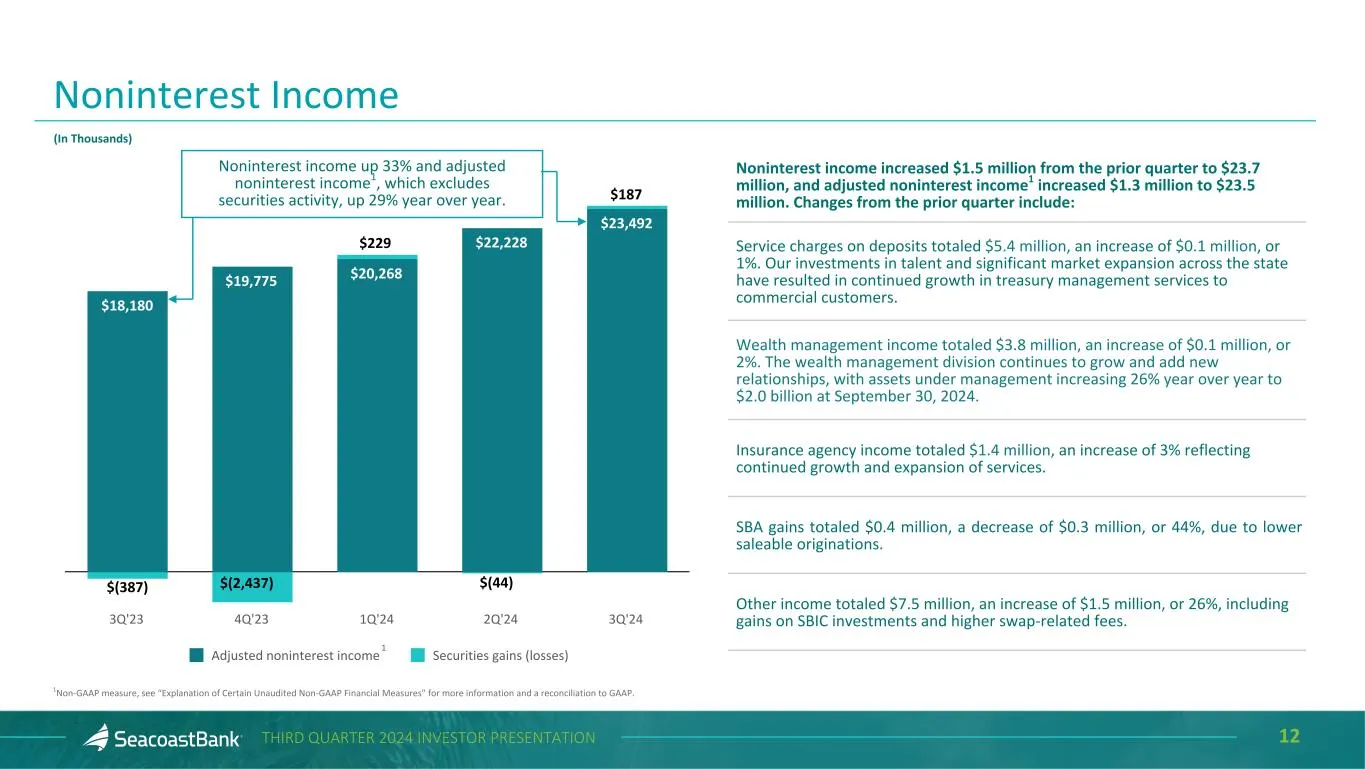
12THIRD QUARTER 2024 INVESTOR PRESENTATION Noninterest income increased $1.5 million from the prior quarter to $23.7 million, and adjusted noninterest income1 increased $1.3 million to $23.5 million. Changes from the prior quarter include: Service charges on deposits totaled $5.4 million, an increas
Slide 13: Continued Focus on Building Wealth Management Assets
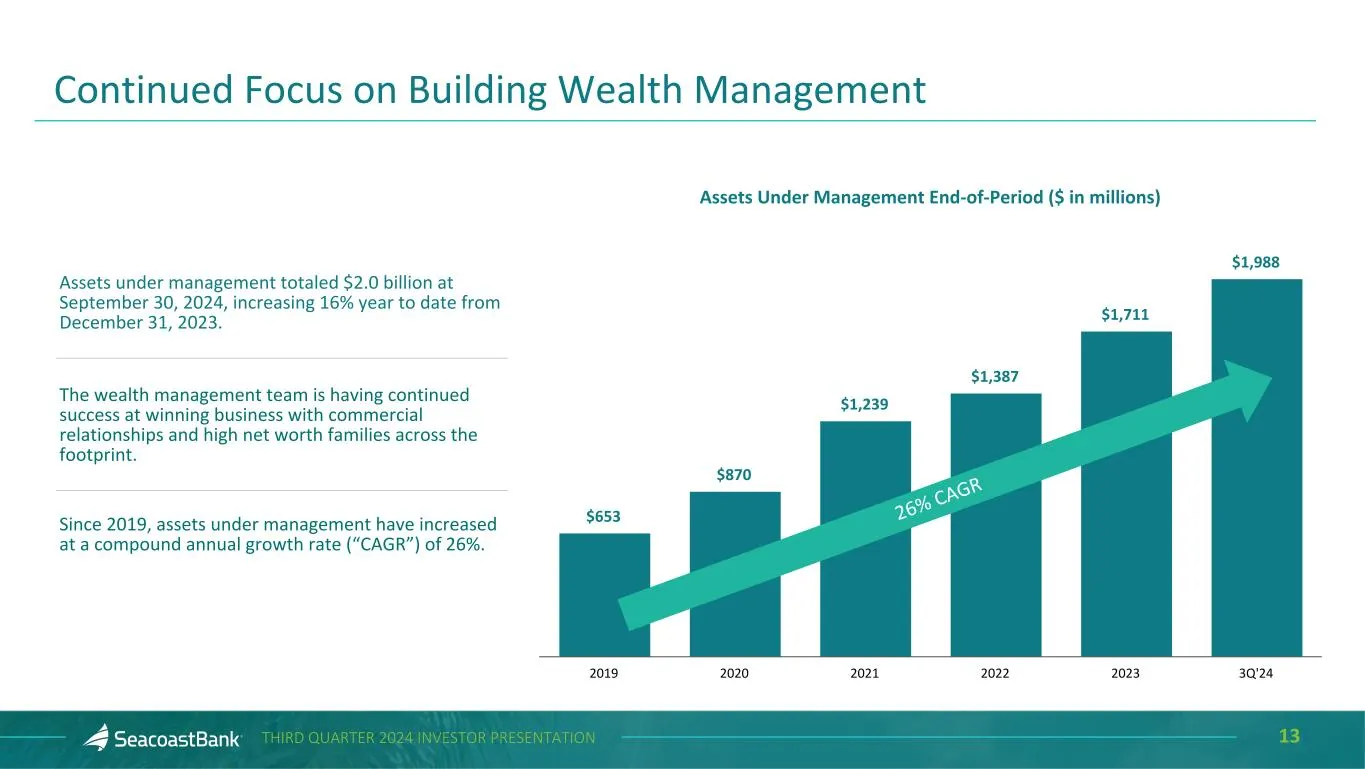
13THIRD QUARTER 2024 INVESTOR PRESENTATION Assets Under Management End-of-Period ($ in millions) $653 $870 $1,239 $1,387 $1,711 $1,988 2019 2020 2021 2022 2023 3Q'24 Continued Focus on Building Wealth Management Assets under management totaled $2.0 billion at September 30, 2024, increasing 16% year
Slide 14: Noninterest Expense
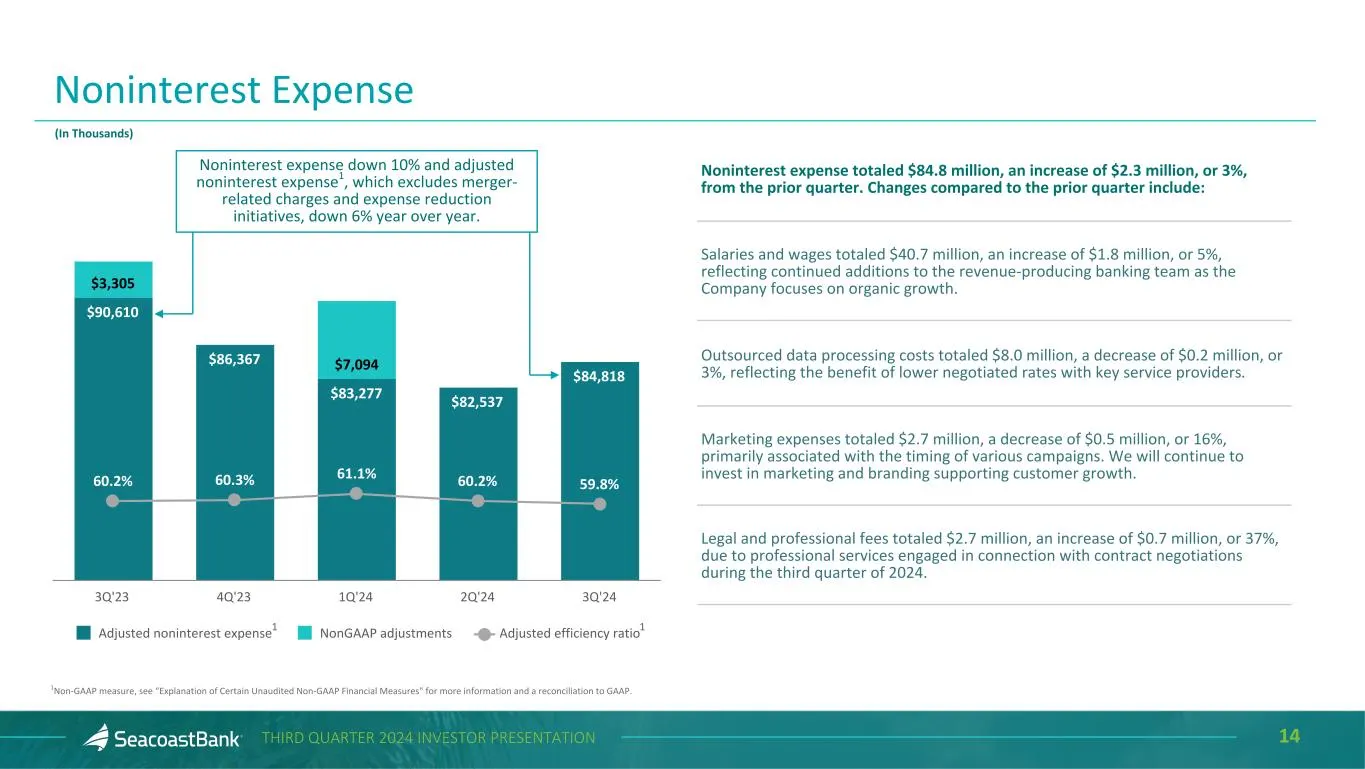
14THIRD QUARTER 2024 INVESTOR PRESENTATION Noninterest Expense Noninterest expense totaled $84.8 million, an increase of $2.3 million, or 3%, from the prior quarter. Changes compared to the prior quarter include: Salaries and wages totaled $40.7 million, an increase of $1.8 million, or 5%, reflectin
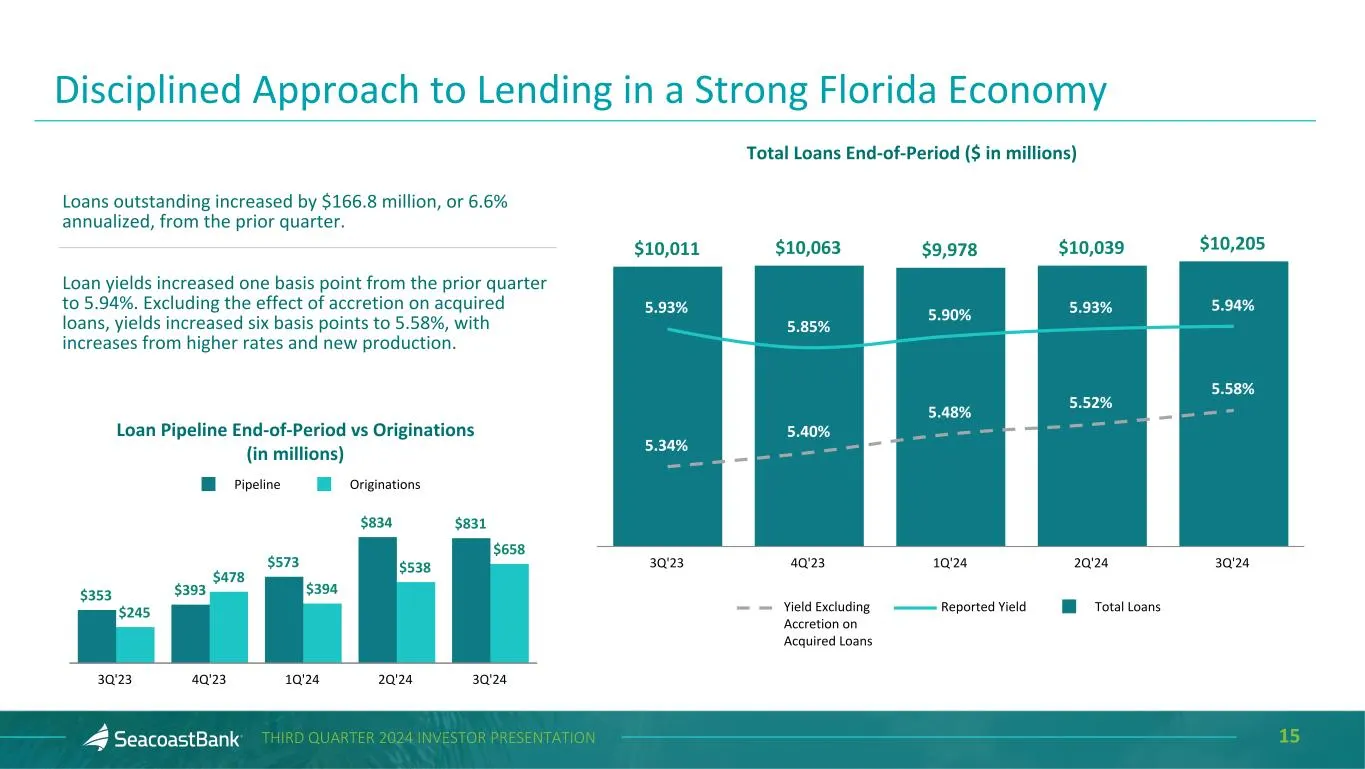
Slide 15: Disciplined Approach to Lending in a Strong Florida Economy
15THIRD QUARTER 2024 INVESTOR PRESENTATION $353 $393 $573 $834 $831 $245 $478 $394 $538 $658 Pipeline Originations 3Q'23 4Q'23 1Q'24 2Q'24 3Q'24 Loan Pipeline End-of-Period vs Originations (in millions) $10,011 $10,063 $9,978 $10,039 $10,205 5.93% 5.85% 5.90% 5.93% 5.94% 5.34% 5.40% 5.48% 5.52% 5.58
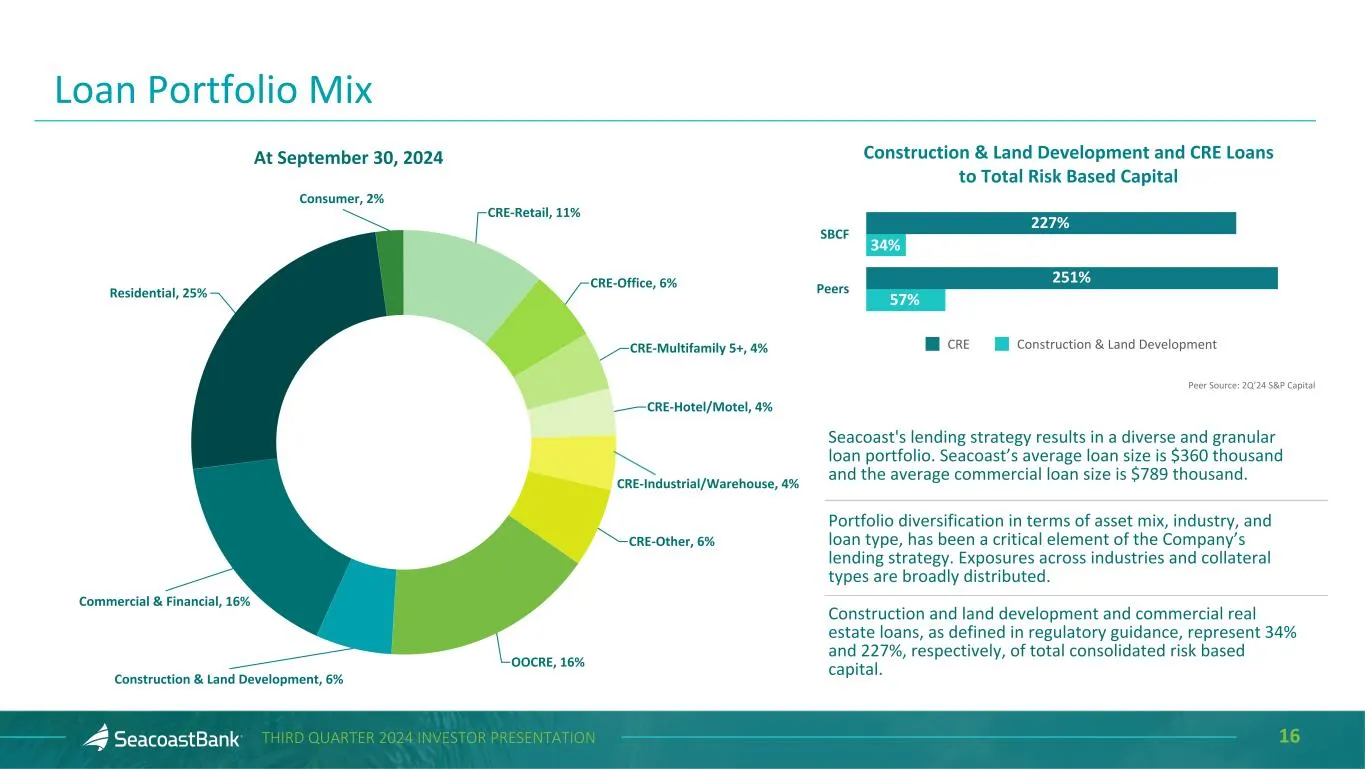
Slide 16: Loan Portfolio Mix
16THIRD QUARTER 2024 INVESTOR PRESENTATION At September 30, 2024 Loan Portfolio Mix Seacoast's lending strategy results in a diverse and granular loan portfolio. Seacoast’s average loan size is $360 thousand and the average commercial loan size is $789 thousand. Portfolio diversification in terms of
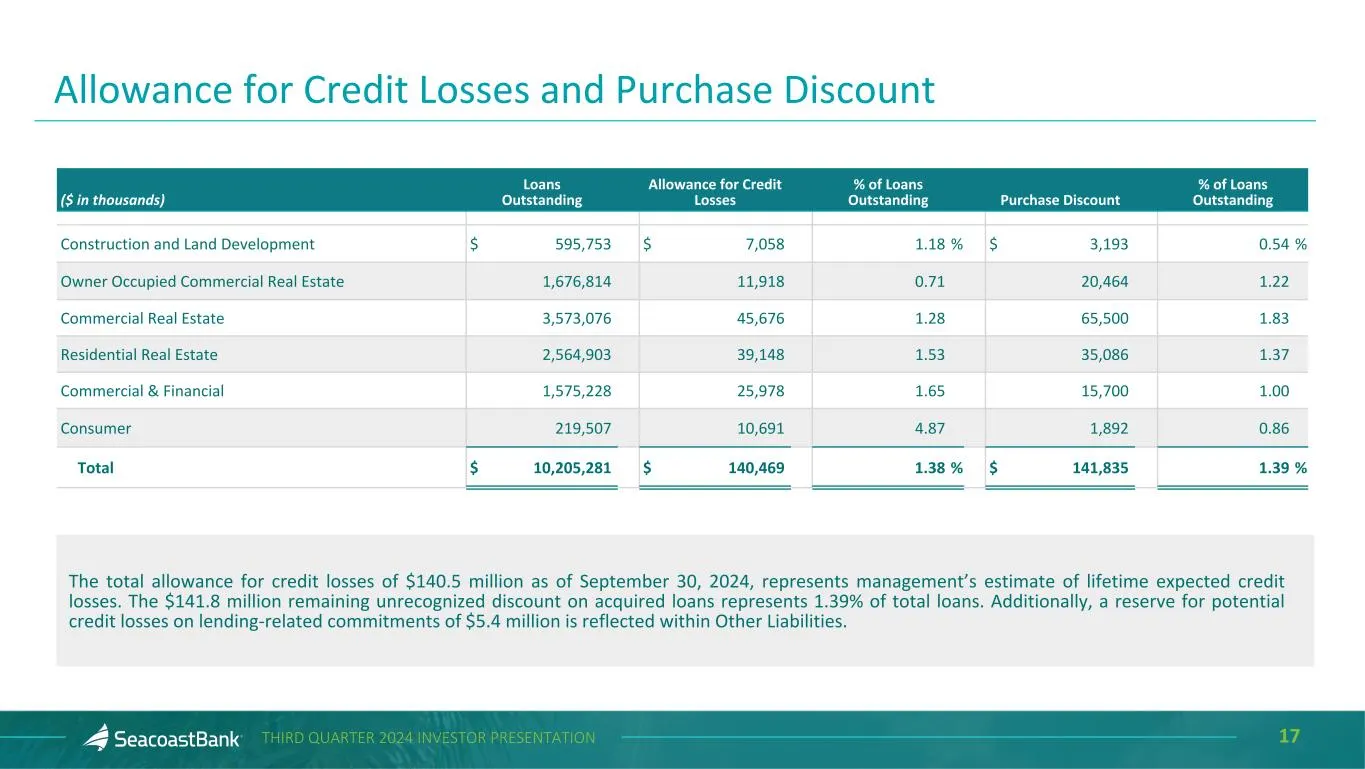
Slide 17: Allowance for Credit Losses and Purchase Discount
17THIRD QUARTER 2024 INVESTOR PRESENTATION Allowance for Credit Losses and Purchase Discount ($ in thousands) Loans Outstanding Allowance for Credit Losses % of Loans Outstanding Purchase Discount % of Loans Outstanding Construction and Land Development $ 595,753 $ 7,058 1.18 % $ 3,193 0.54 % Owner
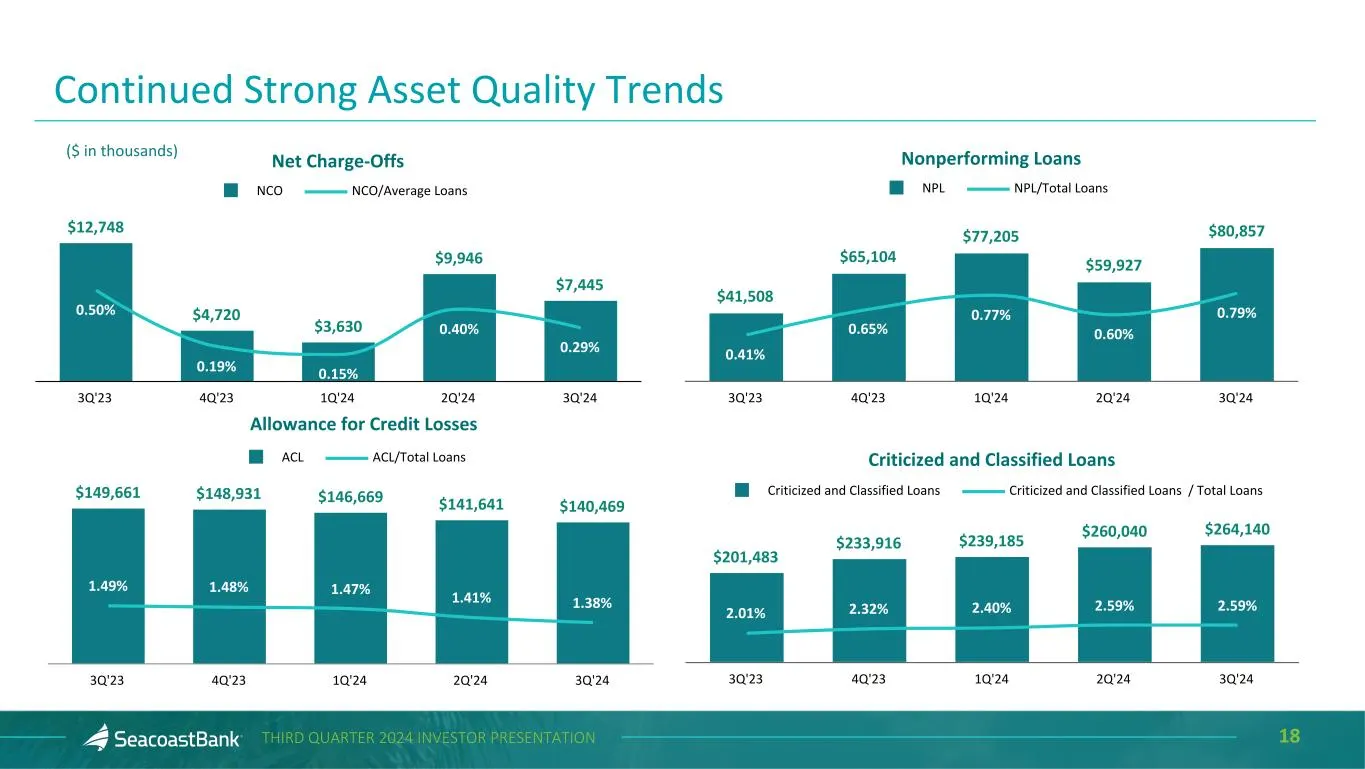
Slide 18: Continued Strong Asset Quality Trends
18THIRD QUARTER 2024 INVESTOR PRESENTATION Net Charge-Offs $12,748 $4,720 $3,630 $9,946 $7,445 0.50% 0.19% 0.15% 0.40% 0.29% NCO NCO/Average Loans 3Q'23 4Q'23 1Q'24 2Q'24 3Q'24 ($ in thousands) $149,661 $148,931 $146,669 $141,641 $140,469 1.49% 1.48% 1.47% 1.41% 1.38% ACL ACL/Total Loans 3Q'23 4Q'23
Slide 19: Investment Securities Performance and Composition
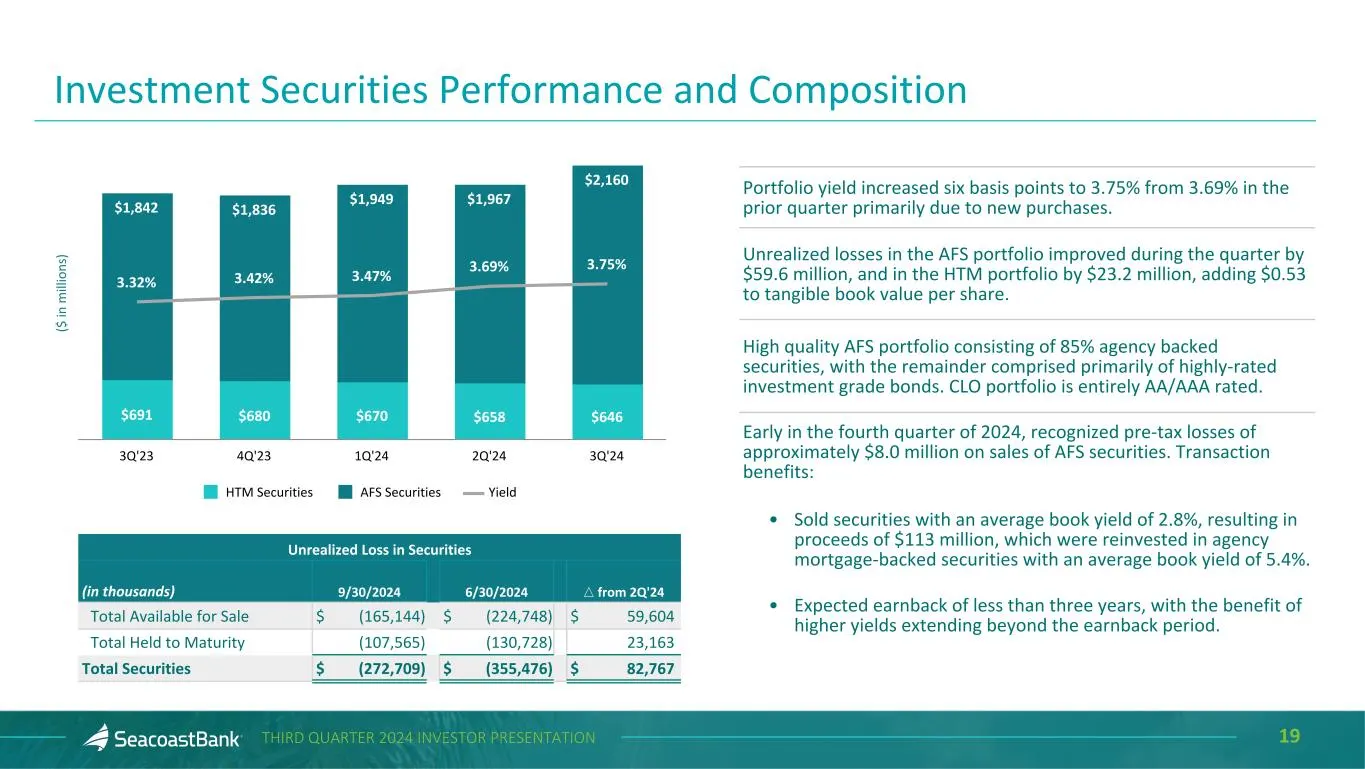
19THIRD QUARTER 2024 INVESTOR PRESENTATION Investment Securities Performance and Composition Portfolio yield increased six basis points to 3.75% from 3.69% in the prior quarter primarily due to new purchases. Unrealized losses in the AFS portfolio improved during the quarter by $59.6 million, and in
Slide 20: Distinctive Deposit Franchise Supported by Attractive Markets
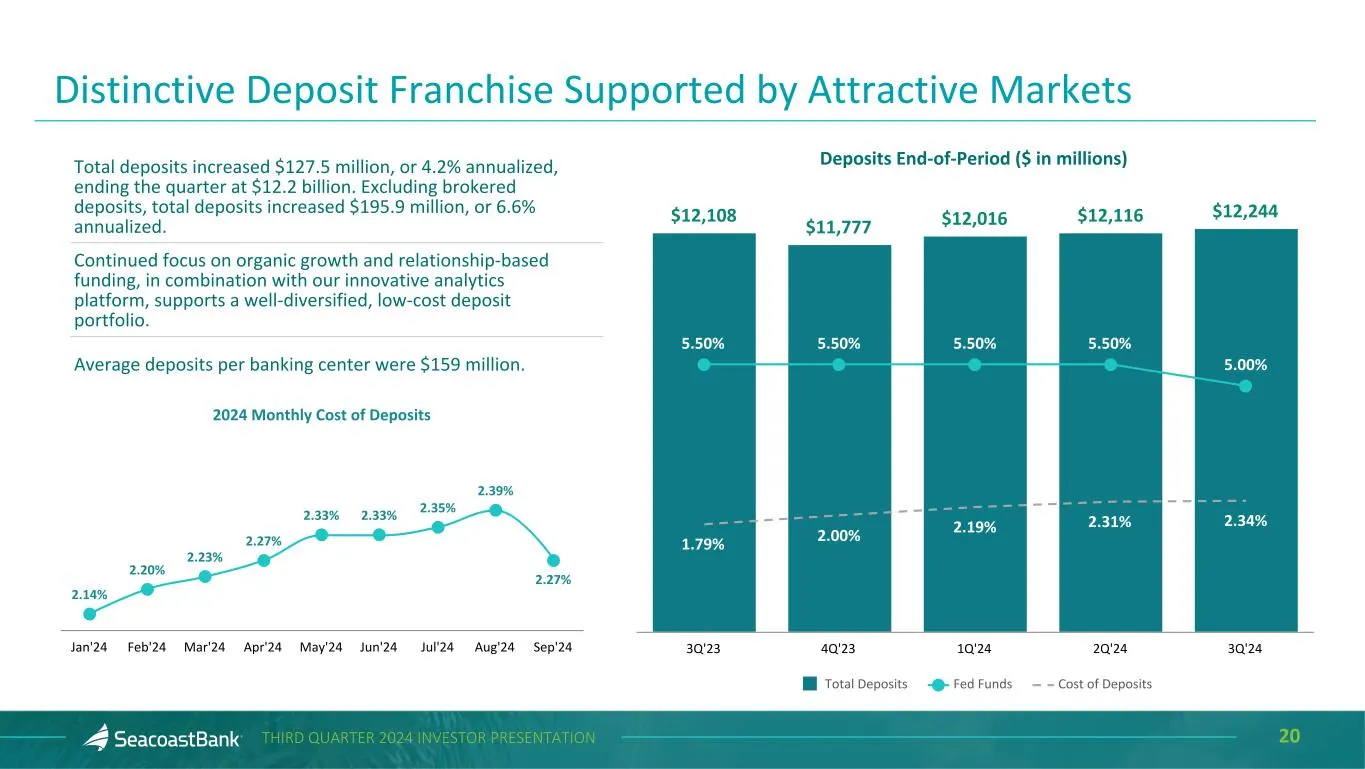
20THIRD QUARTER 2024 INVESTOR PRESENTATION Deposits End-of-Period ($ in millions) $12,108 $11,777 $12,016 $12,116 $12,244 5.50% 5.50% 5.50% 5.50% 5.00% 1.79% 2.00% 2.19% 2.31% 2.34% Total Deposits Fed Funds Cost of Deposits 3Q'23 4Q'23 1Q'24 2Q'24 3Q'24 Distinctive Deposit Franchise Supported by Att
Slide 21: Granular, Diverse and Relationship-Focused Customer Funding Base
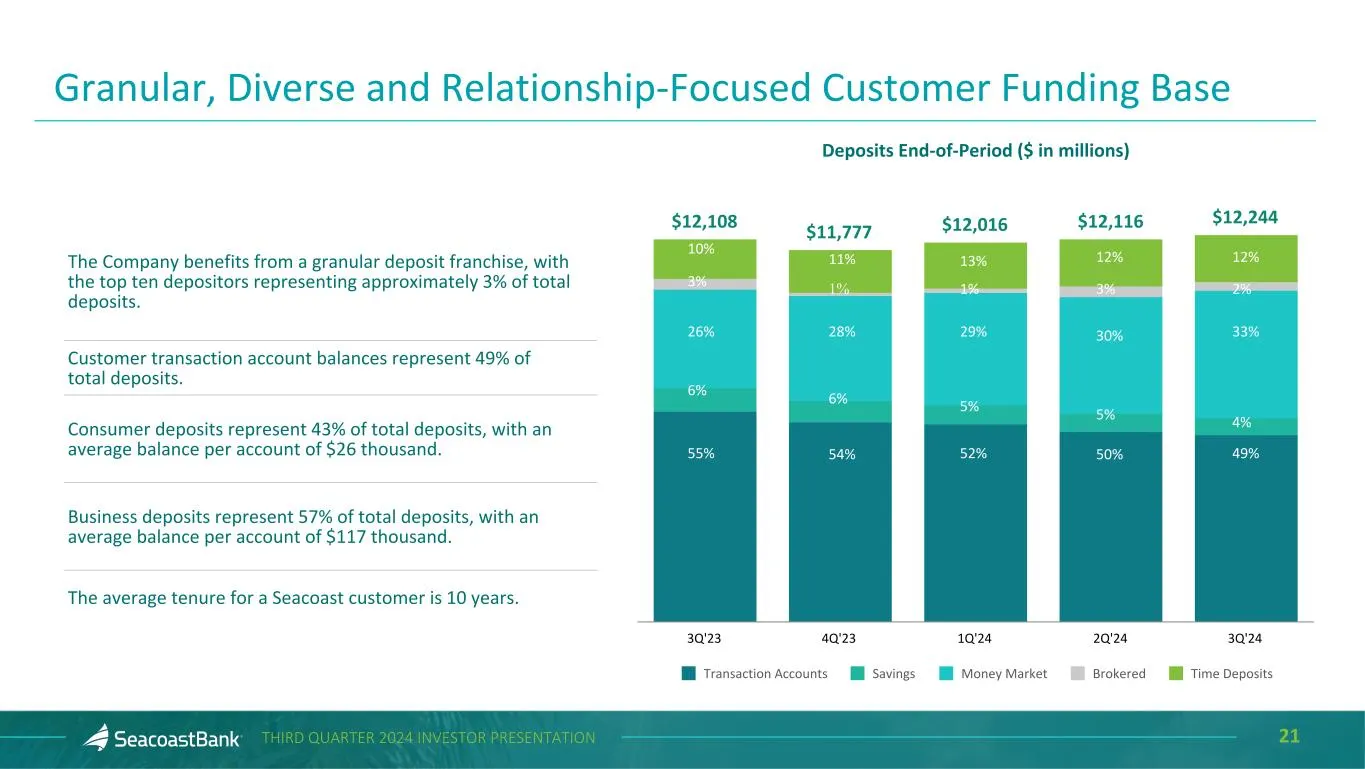
21THIRD QUARTER 2024 INVESTOR PRESENTATION Deposits End-of-Period ($ in millions) $12,108 $11,777 $12,016 $12,116 $12,244 Transaction Accounts Savings Money Market Brokered Time Deposits 3Q'23 4Q'23 1Q'24 2Q'24 3Q'24 Granular, Diverse and Relationship-Focused Customer Funding Base The Company benefi
Slide 22: Robust Capital Position Supporting a Fortress Balance Sheet
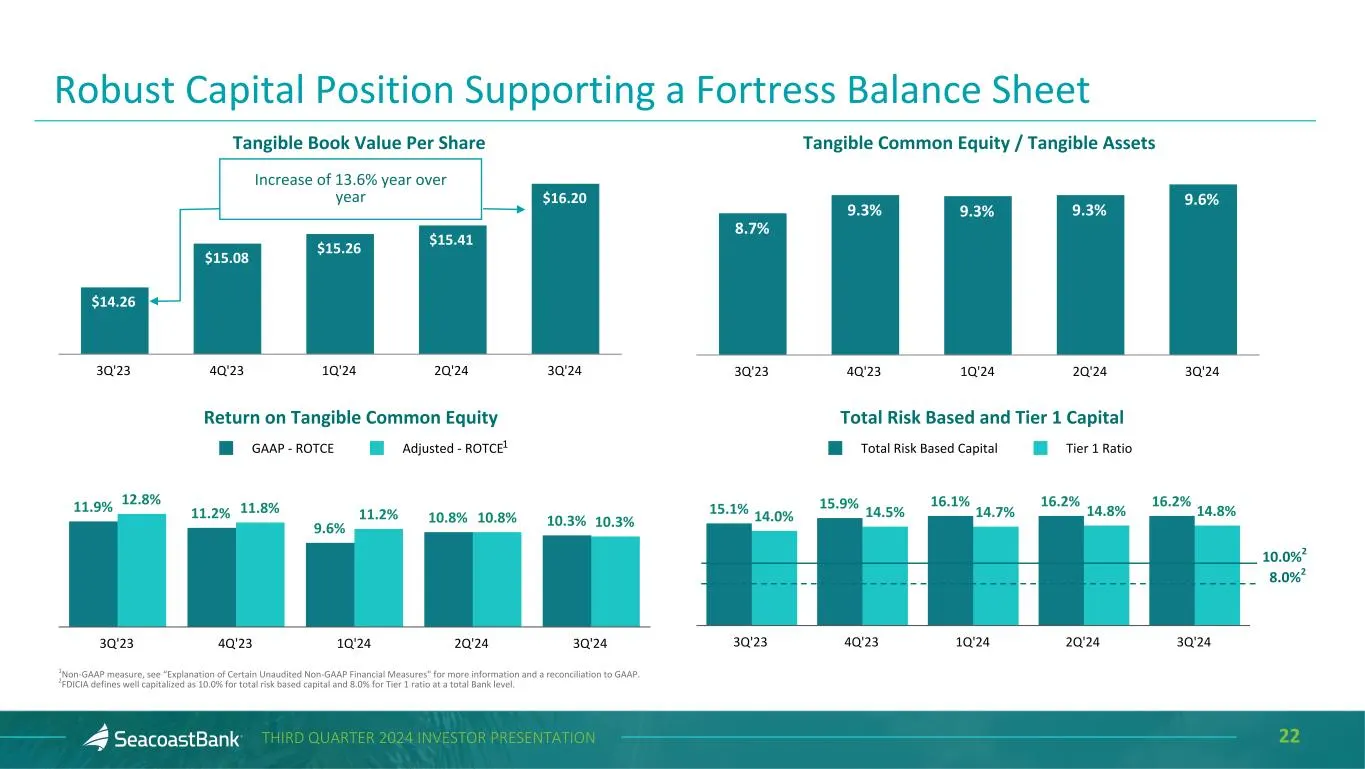
22THIRD QUARTER 2024 INVESTOR PRESENTATION $14.26 $15.08 $15.26 $15.41 $16.20 3Q'23 4Q'23 1Q'24 2Q'24 3Q'24 8.7% 9.3% 9.3% 9.3% 9.6% 3Q'23 4Q'23 1Q'24 2Q'24 3Q'24 15.1% 15.9% 16.1% 16.2% 16.2% 14.0% 14.5% 14.7% 14.8% 14.8% Total Risk Based Capital Tier 1 Ratio 3Q'23 4Q'23 1Q'24 2Q'24 3Q'24 11.9% 11.
Slide 23: Investor Relations
Michael Young EVP, Treasurer & Director of Investor Relations [email protected] (772) 403-0451 INVESTOR RELATIONS NASDAQ: SBCF

Slide 24: Appendix
24THIRD QUARTER 2024 INVESTOR PRESENTATION Appendix
Slide 25: Quarterly Trend
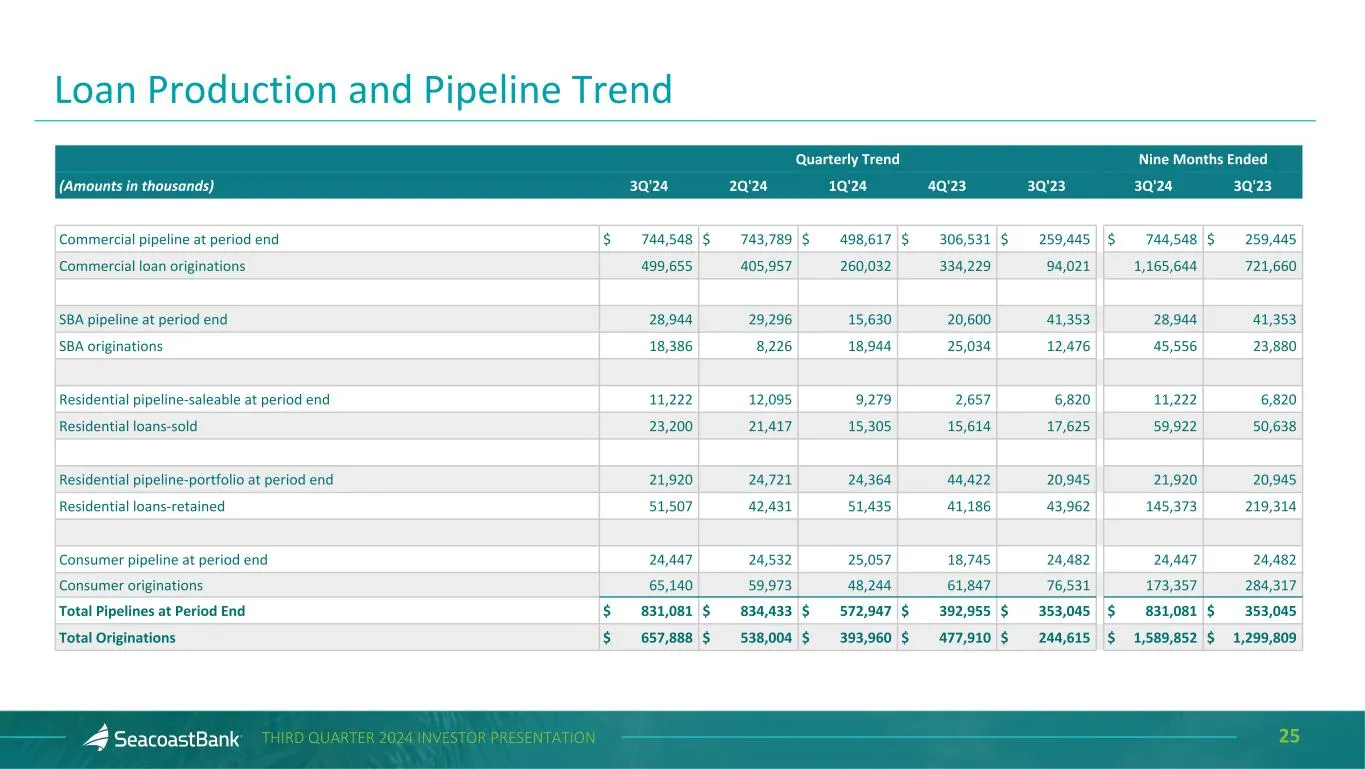
25THIRD QUARTER 2024 INVESTOR PRESENTATION Quarterly Trend Nine Months Ended (Amounts in thousands) 3Q'24 2Q'24 1Q'24 4Q'23 3Q'23 3Q'24 3Q'23 Commercial pipeline at period end $ 744,548 $ 743,789 $ 498,617 $ 306,531 $ 259,445 $ 744,548 $ 259,445 Commercial loan originations 499,655 405,957 260,032 3
Slide 26: Non-owner Occupied Commercial Real Estate
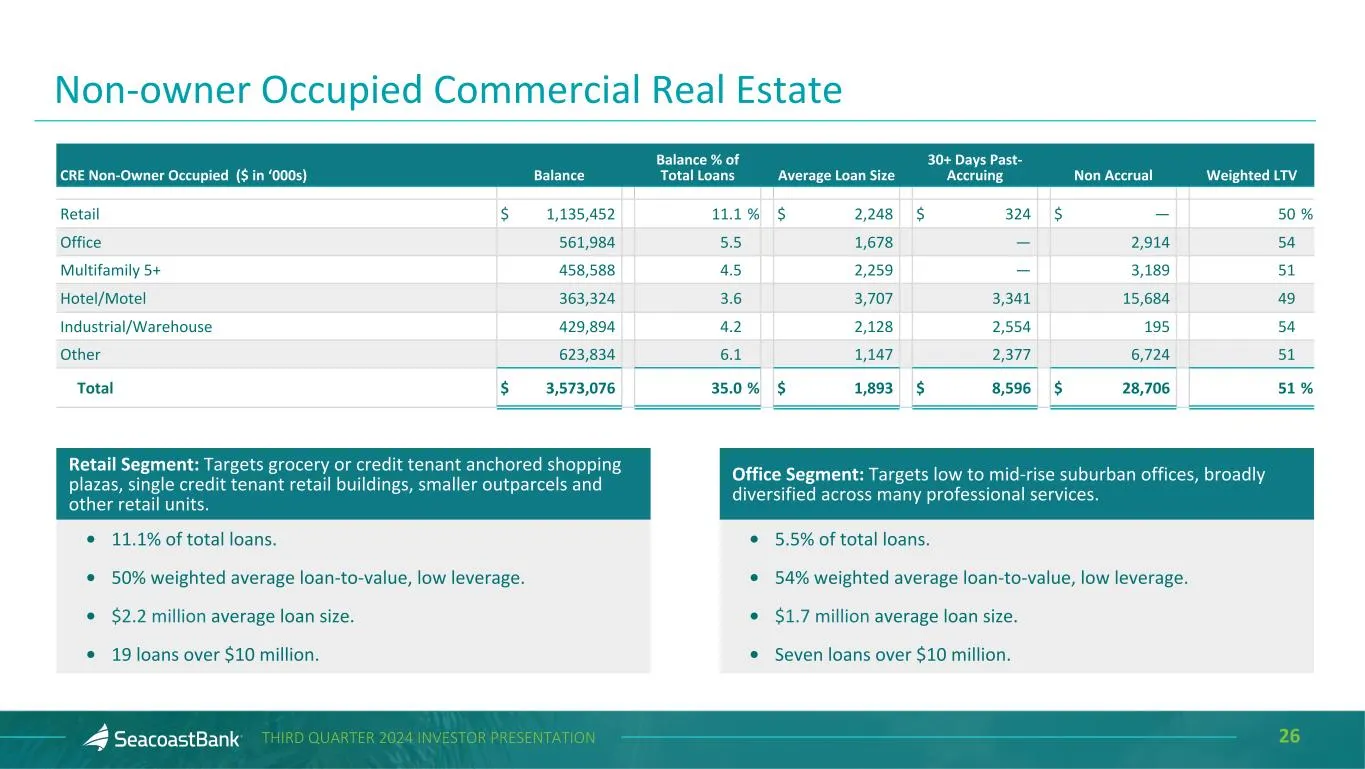
26THIRD QUARTER 2024 INVESTOR PRESENTATION Non-owner Occupied Commercial Real Estate CRE Non-Owner Occupied ($ in ‘000s) Balance Balance % of Total Loans Average Loan Size 30+ Days Past- Accruing Non Accrual Weighted LTV Retail $ 1,135,452 11.1 % $ 2,248 $ 324 $ — 50 % Office 561,984 5.5 1,678 — 2,9
Slide 27: Liquidity Sources vs Uninsured Deposits
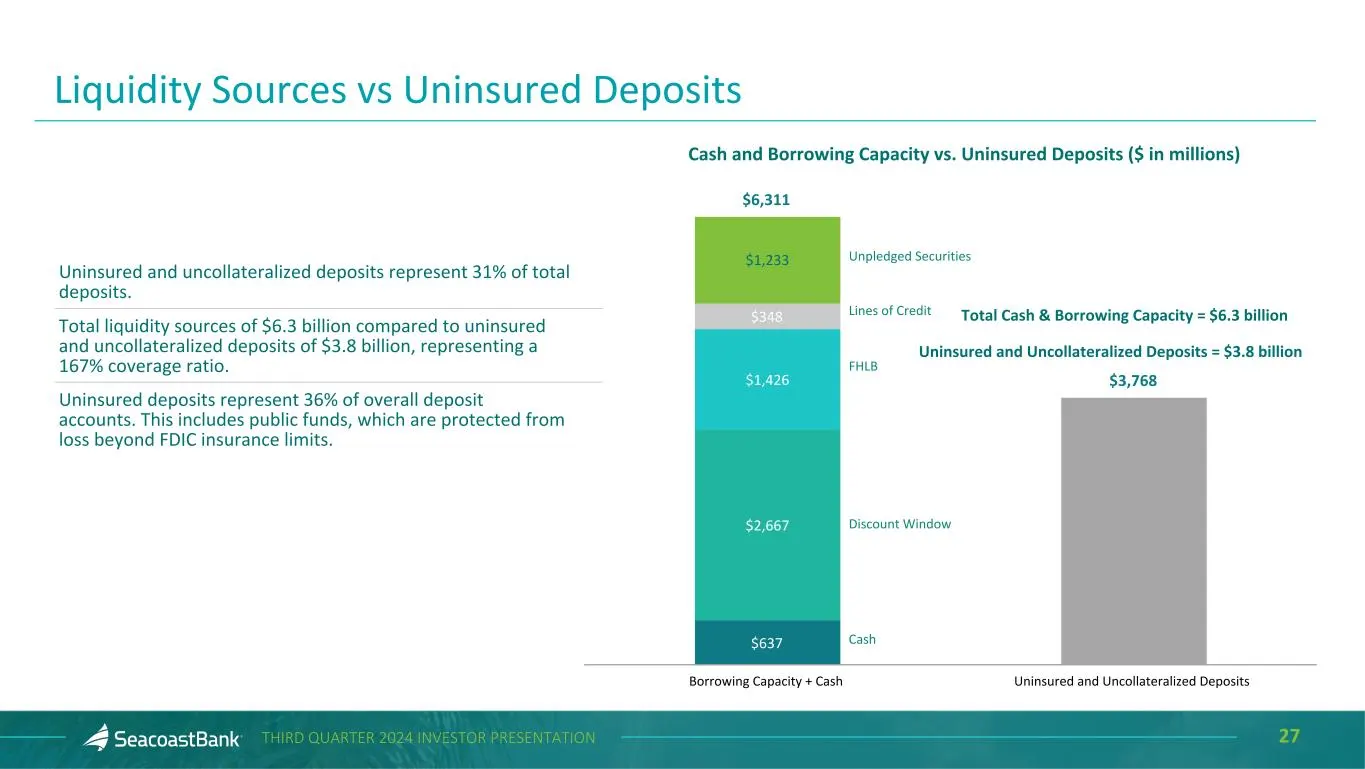
27THIRD QUARTER 2024 INVESTOR PRESENTATION Liquidity Sources vs Uninsured Deposits Cash and Borrowing Capacity vs. Uninsured Deposits ($ in millions) $6,311 $3,768 $637 $2,667 $1,426 $348 $1,233 Borrowing Capacity + Cash Uninsured and Uncollateralized Deposits Total Cash & Borrowing Capacity = $6.3
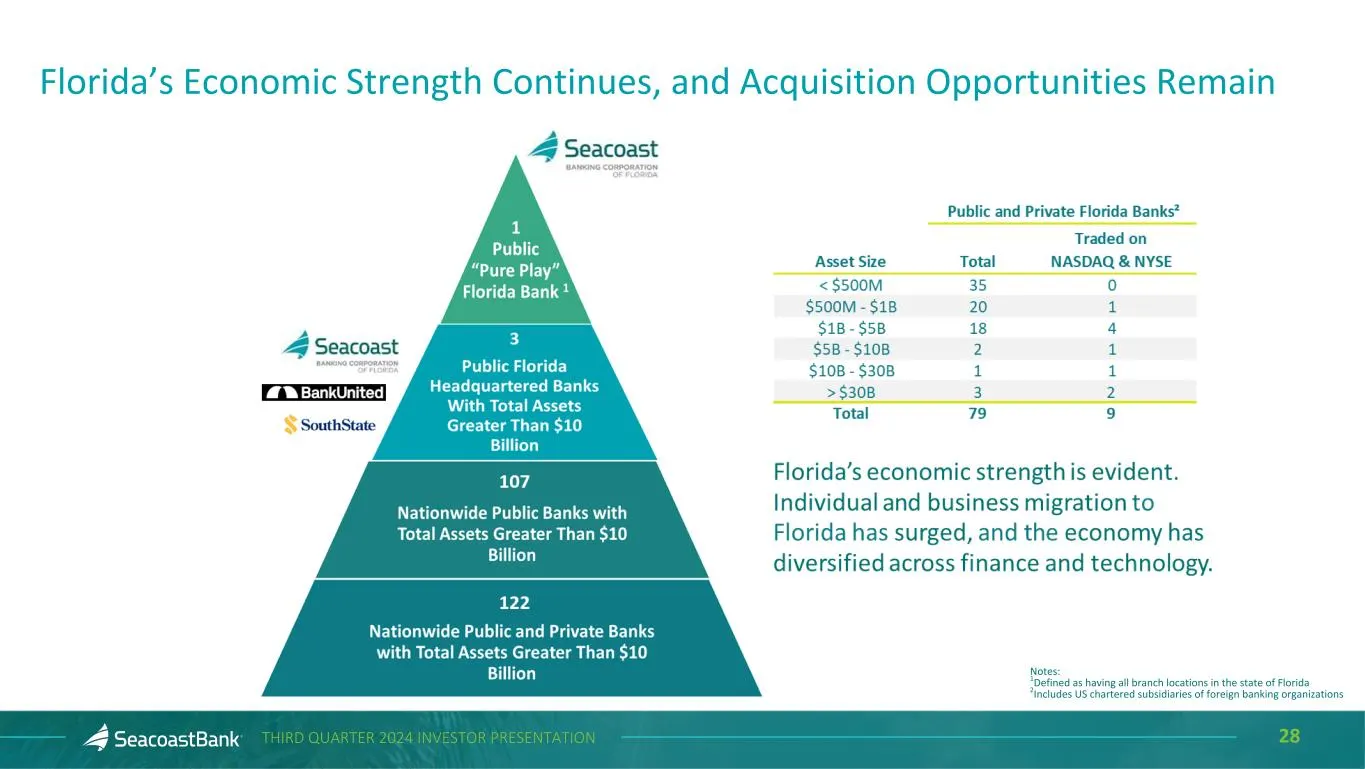
Slide 28: Florida's Economic Strength Continues, and Acquisition Opportunities Remain
28THIRD QUARTER 2024 INVESTOR PRESENTATION Florida’s Economic Strength Continues, and Acquisition Opportunities Remain Notes: 1Defined as having all branch locations in the state of Florida 2Includes US chartered subsidiaries of foreign banking organizations
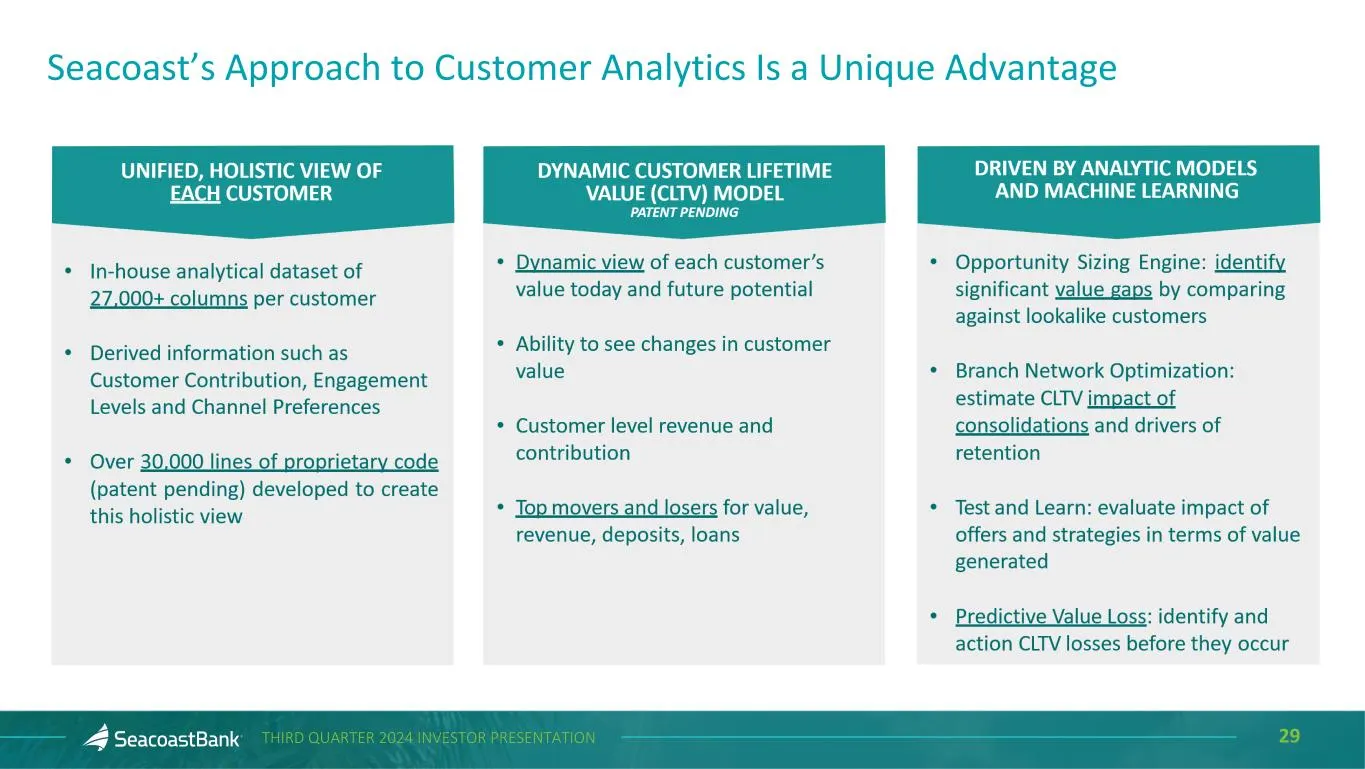
Slide 29: Seacoast's Approach to Customer Analytics Is a Unique Advantage
29THIRD QUARTER 2024 INVESTOR PRESENTATION Seacoast’s Approach to Customer Analytics Is a Unique Advantage
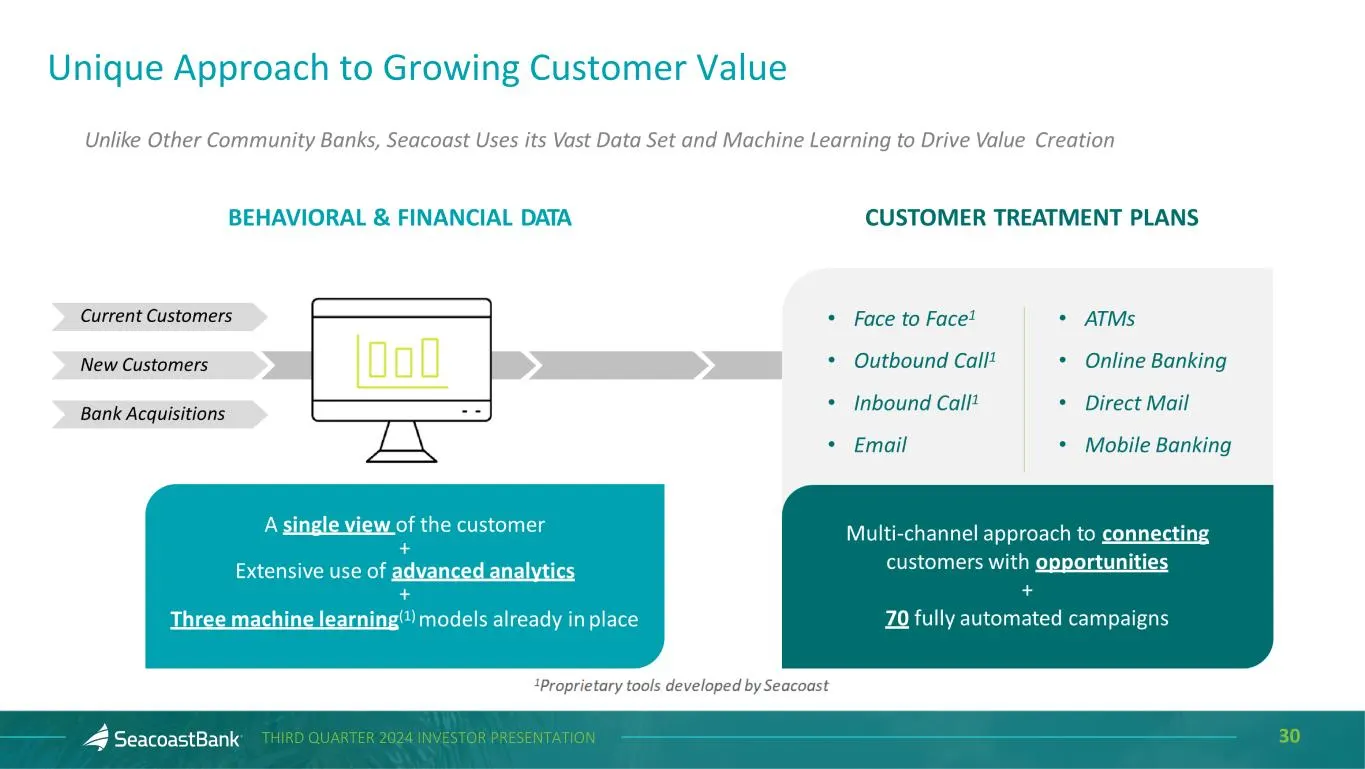
Slide 30: Unique Approach to Growing Customer Value
30THIRD QUARTER 2024 INVESTOR PRESENTATION Unique Approach to Growing Customer Value
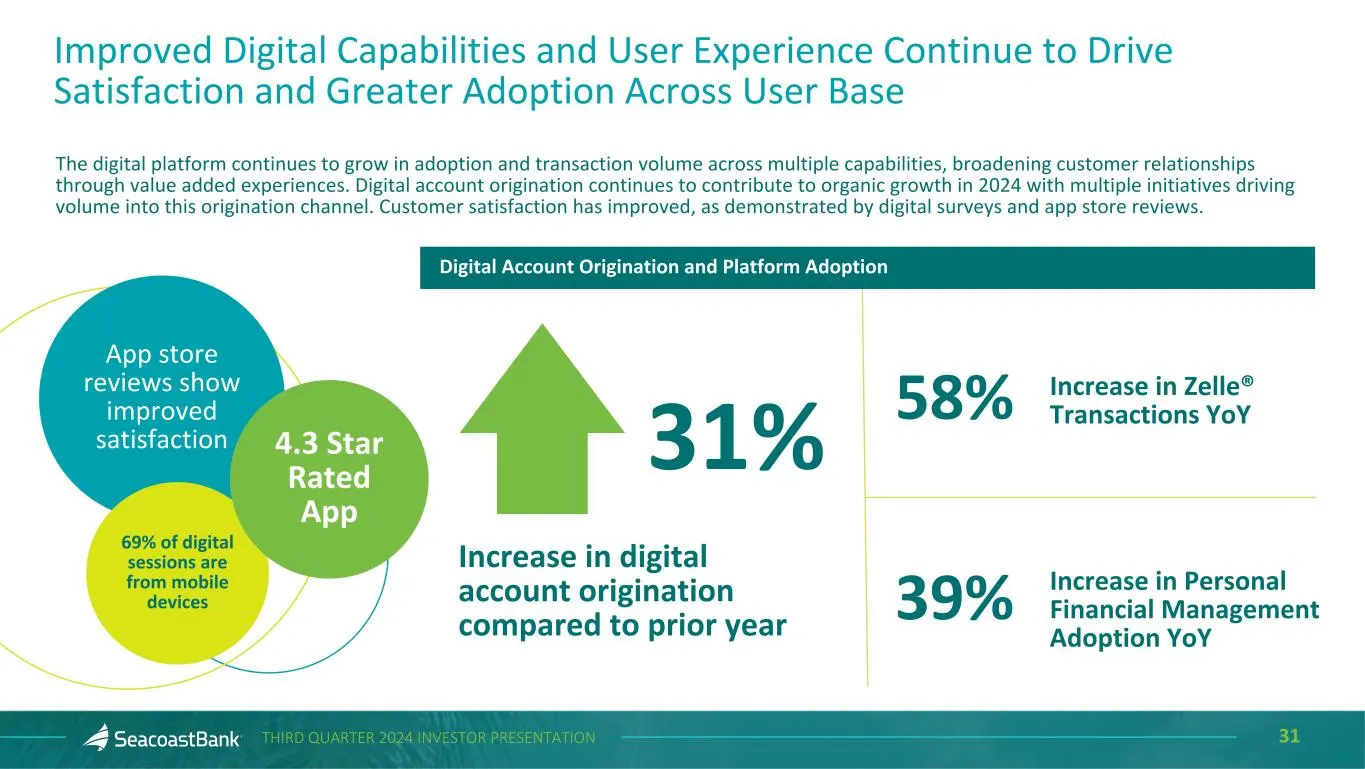
Slide 31: Improved Digital Capabilities and User Experience
31THIRD QUARTER 2024 INVESTOR PRESENTATION Improved Digital Capabilities and User Experience Continue to Drive Satisfaction and Greater Adoption Across User Base Increase in digital account origination compared to prior year The digital platform continues to grow in adoption and transaction volume a
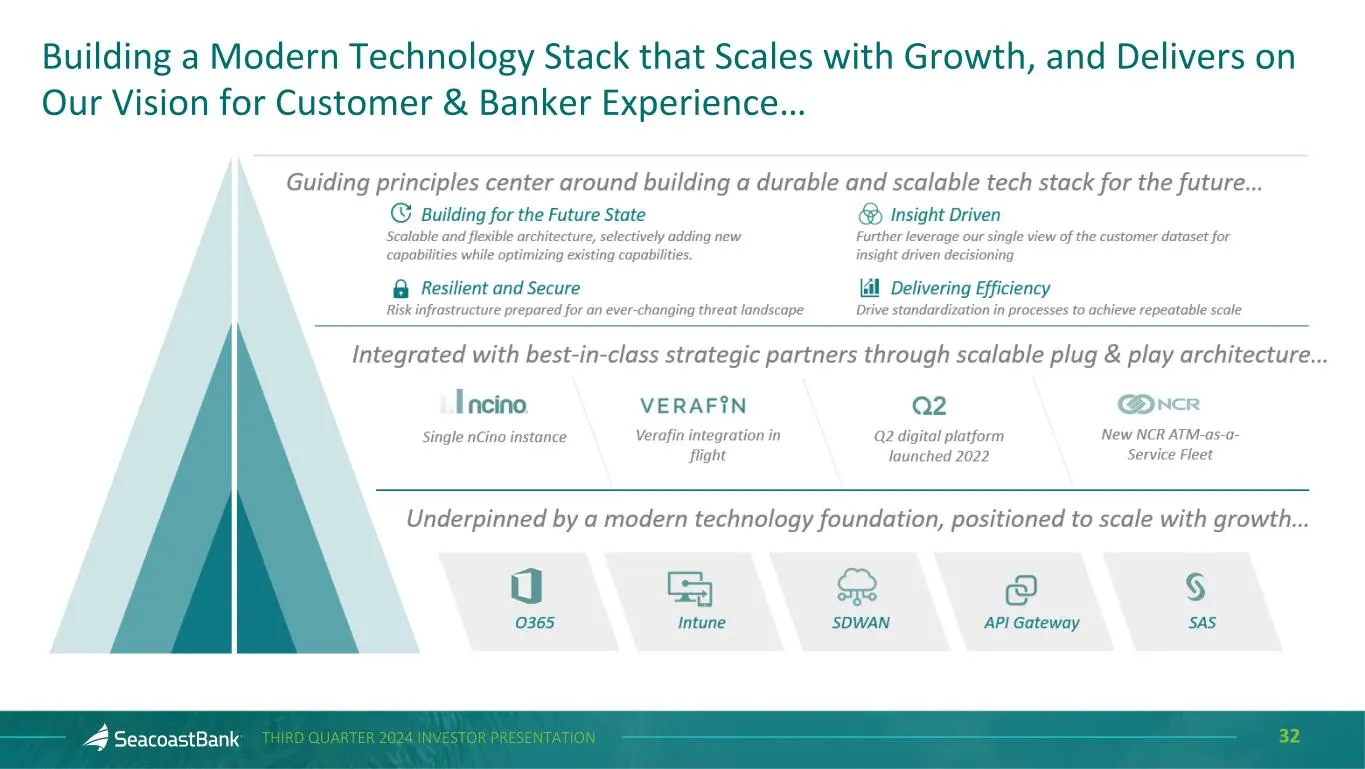
Slide 32: Building a Modern Technology Stack that Scales with Growth
32THIRD QUARTER 2024 INVESTOR PRESENTATION Building a Modern Technology Stack that Scales with Growth, and Delivers on Our Vision for Customer & Banker Experience… Q2 digital platform launched 2022 Q2 digital platform launched 2022 Q2 digital platform launched 2022 Q2 digital platform launched 2022
Slide 33: Explanation of Certain Unaudited Non-GAAP Financial Measures
33THIRD QUARTER 2024 INVESTOR PRESENTATION This presentation contains financial information determined by methods other than Generally Accepted Accounting Principles (“GAAP”). The financial highlights provide reconciliations between GAAP and adjusted financial measures including net income, noninter
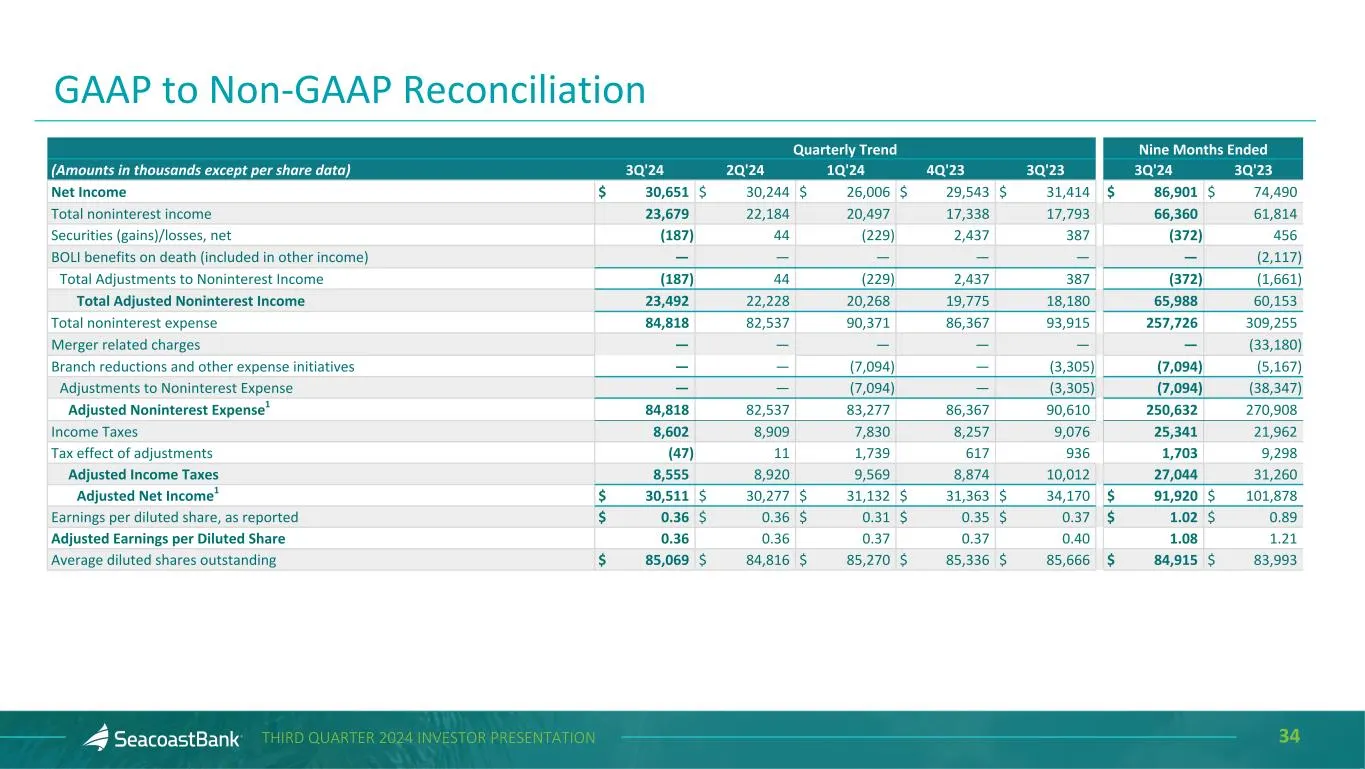
Slide 34: Quarterly Trend
34THIRD QUARTER 2024 INVESTOR PRESENTATION Quarterly Trend Nine Months Ended (Amounts in thousands except per share data) 3Q'24 2Q'24 1Q'24 4Q'23 3Q'23 3Q'24 3Q'23 Net Income $ 30,651 $ 30,244 $ 26,006 $ 29,543 $ 31,414 $ 86,901 $ 74,490 Total noninterest income 23,679 22,184 20,497 17,338 17,793 66
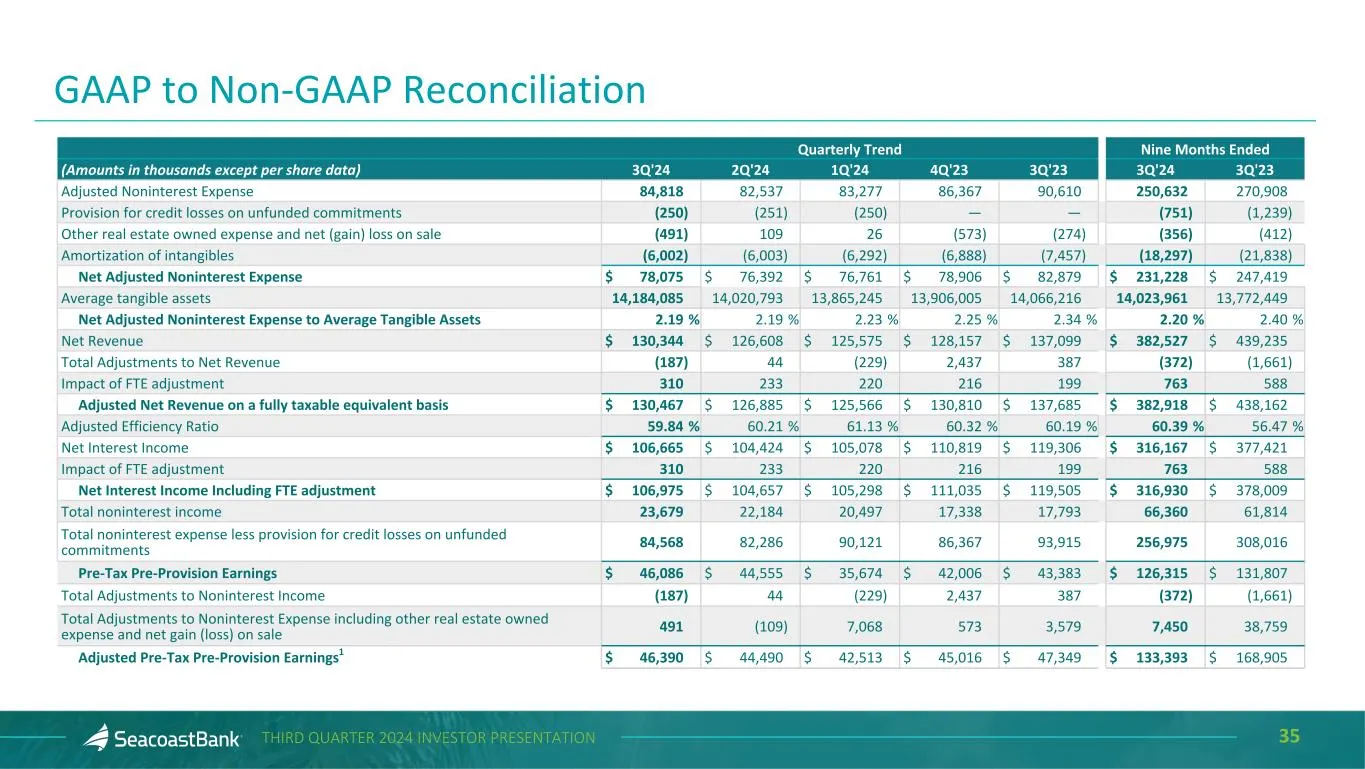
Slide 35: Quarterly Trend
35THIRD QUARTER 2024 INVESTOR PRESENTATION Quarterly Trend Nine Months Ended (Amounts in thousands except per share data) 3Q'24 2Q'24 1Q'24 4Q'23 3Q'23 3Q'24 3Q'23 Adjusted Noninterest Expense 84,818 82,537 83,277 86,367 90,610 250,632 270,908 Provision for credit losses on unfunded commitments (250
Slide 36: Quarterly Trend
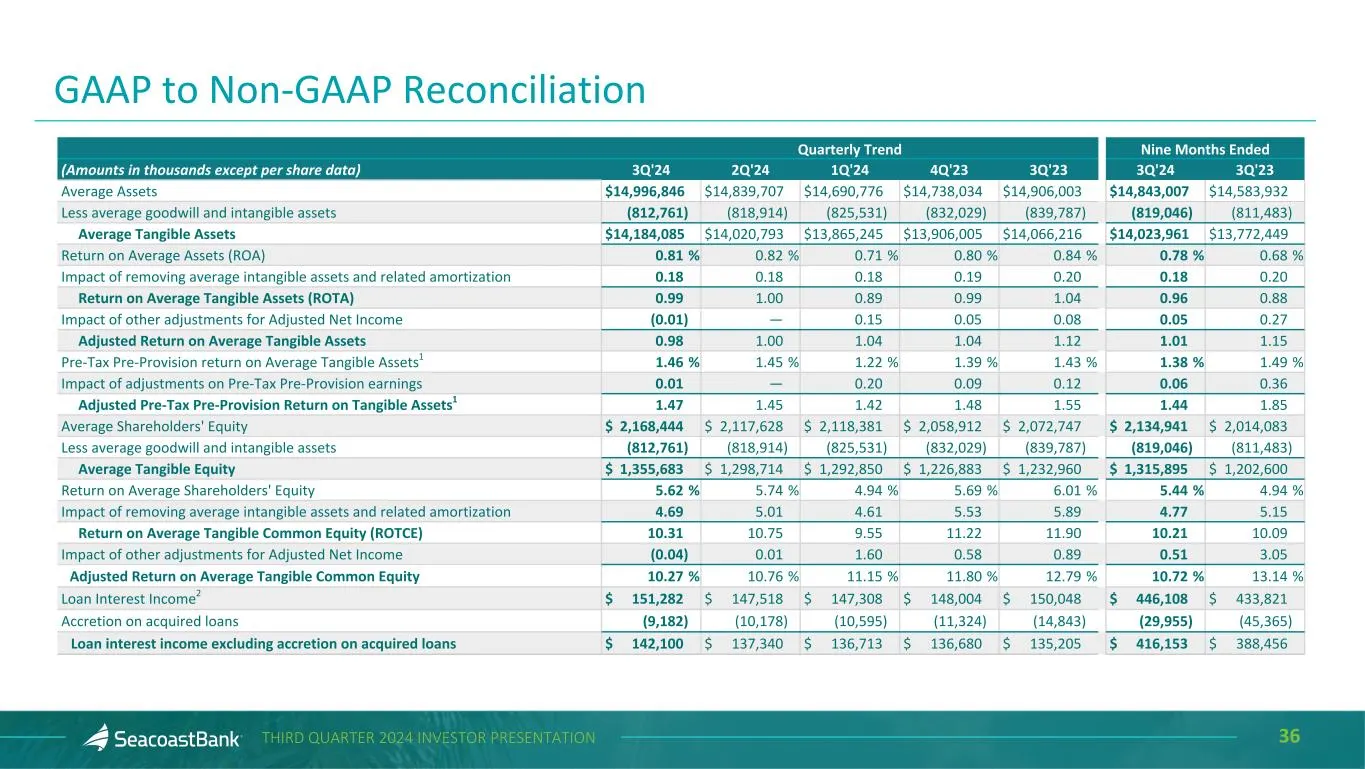
36THIRD QUARTER 2024 INVESTOR PRESENTATION Quarterly Trend Nine Months Ended (Amounts in thousands except per share data) 3Q'24 2Q'24 1Q'24 4Q'23 3Q'23 3Q'24 3Q'23 Average Assets $ 14,996,846 $ 14,839,707 $ 14,690,776 $ 14,738,034 $ 14,906,003 $ 14,843,007 $ 14,583,932 Less average goodwill and inta
Slide 37: Quarterly Trend
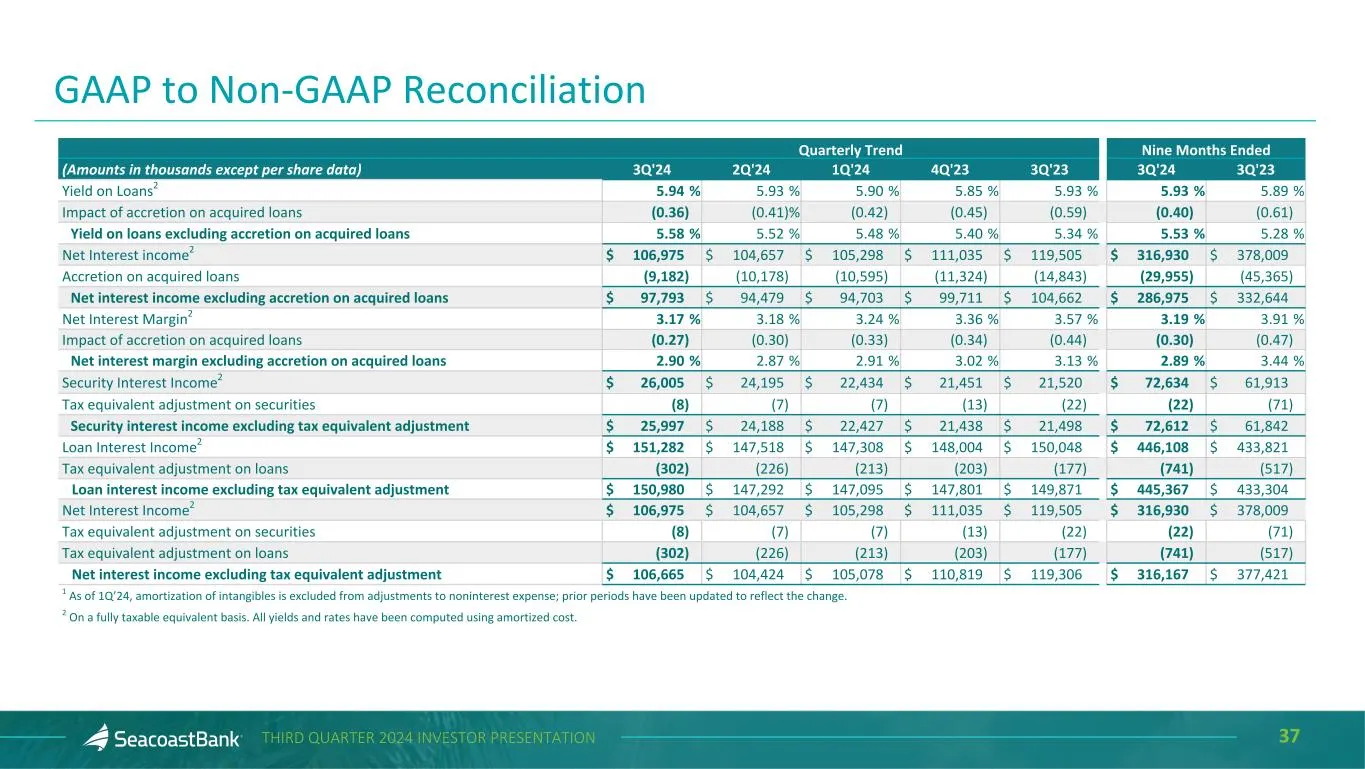
37THIRD QUARTER 2024 INVESTOR PRESENTATION Quarterly Trend Nine Months Ended (Amounts in thousands except per share data) 3Q'24 2Q'24 1Q'24 4Q'23 3Q'23 3Q'24 3Q'23 Yield on Loans2 5.94 % 5.93 % 5.90 % 5.85 % 5.93 % 5.93 % 5.89 % Impact of accretion on acquired loans (0.36) (0.41) % (0.42) (0.45) (0.
Source: SEC EDGAR · 8-K filed Nov 6, 2024
More decks from Seacoast Banking Corporation of Florida
 Seacoast Banking Corp of Florida — Q3 2026 Earnings Presentation35 slides · Nov 4, 2026
 Q3 2026 Earnings Presentation27 slides · Oct 27, 2026
 Seacoast Banking Corp of Florida — Q2 2026 Earnings Presentation34 slides · Sep 9, 2026
 Q2 2026 Earnings Presentation26 slides · Jul 29, 2026
 Seacoast Banking Corp of Florida — Investor Presentation (May 2026)34 slides · May 13, 2026
 Q1 2026 Earnings Presentation26 slides · Apr 29, 2026