Diversicare Healthcare Services Inc
Diversicare Healthcare Services — Shareholder Meeting (June 2013)
23 slides from Diversicare Healthcare Services's shareholder meeting presentation, Jun 7, 2013

Slide 1: Annual Meeting of Shareholders
_ (J Diversicare Annual Meeting of Shareholders June 5, 2013
Slide 2: Forward-Looking Statements
Forward-Looking Statements tomer looking srt Hed us ye pose involve a number of risks and mearanies, thas not ited to, our ability t ur renovated facilities, changes in gov ental remeron, including “ihe itipact ar he are final rule that has resulted in a reduction in ‘Medica reimbursement as of Octo
Slide 3: Who Is Diversicare?
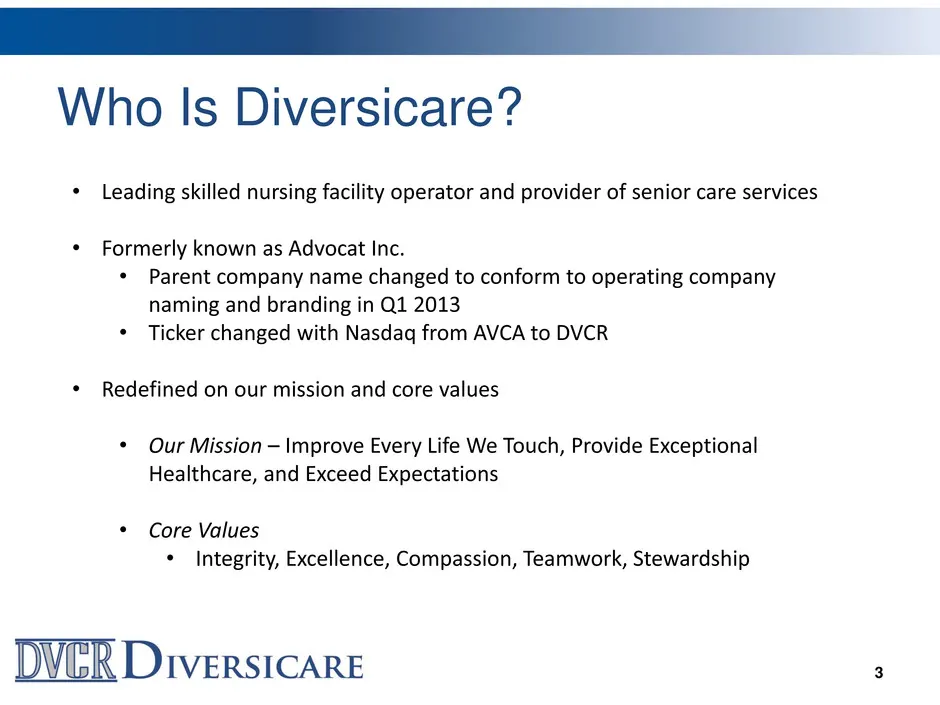
lc lll Who Is Diversicare? * Leading skilled nursing facility operator and provider of senior care services * Formerly known as Advocat Inc. Parent company name changed to conform to operating company naming and branding in Q1 2013 Ticker changed with Nasdaq from AVCA to DVCR * Redefined on our miss
Slide 4: Portfolio Footprint
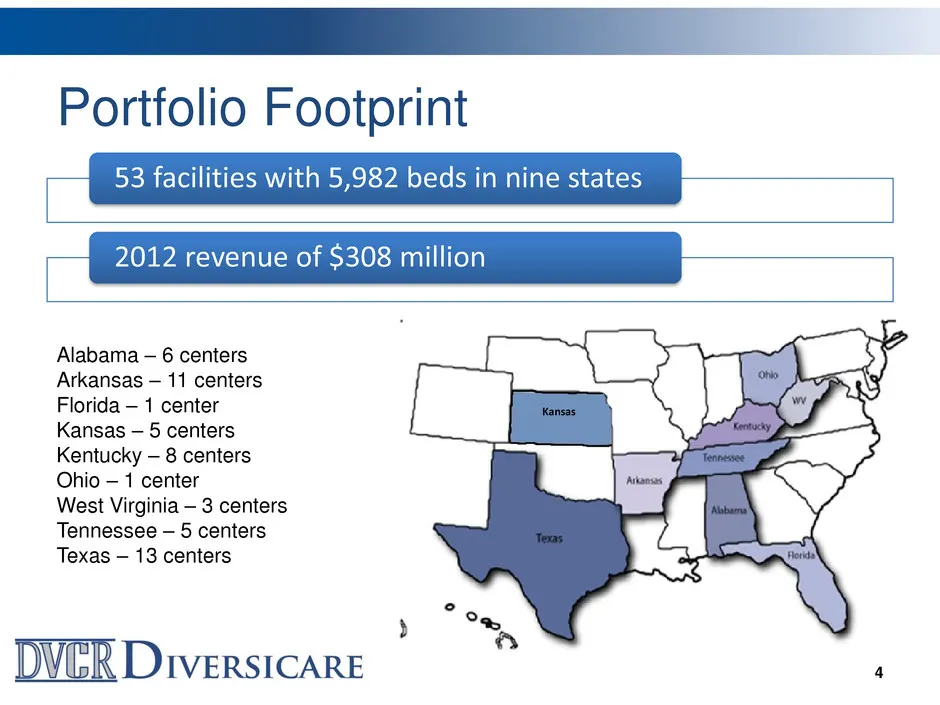
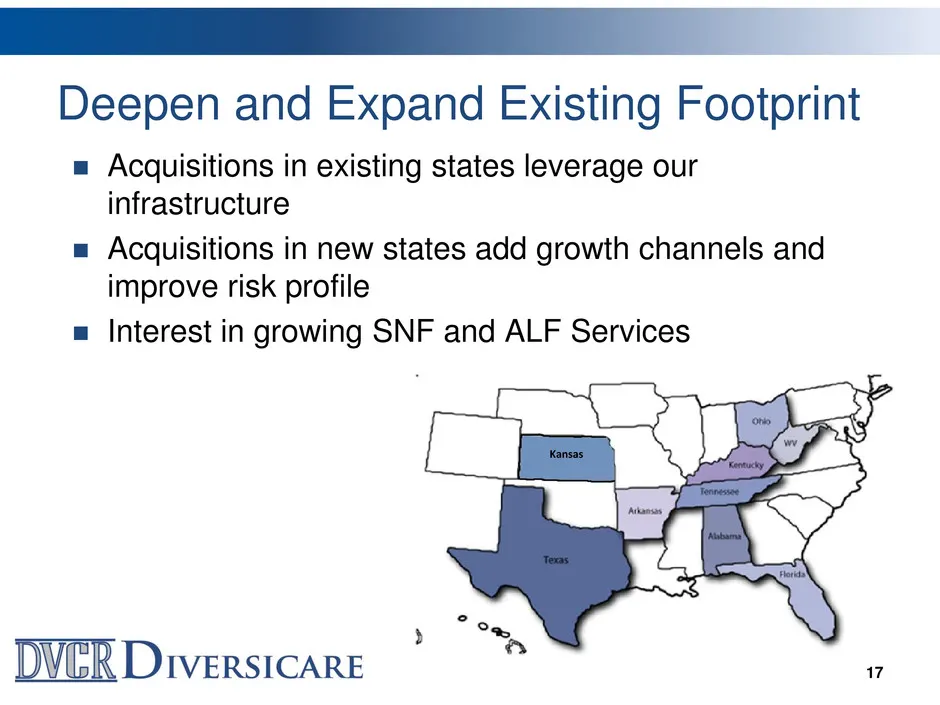
a Portfolio Footprint 53 facilities with 5,982 beds in nine states 2012 revenue of $308 million Alabama — 6 centers Arkansas — 11 centers Florida — 1 center Kansas — 5 centers Kentucky — 8 centers Ohio — 1 center West Virginia — 3 centers Tennessee — 5 centers Texas — 13 centers DVER DiversicarE
Slide 5: Areas of Strategic Focus
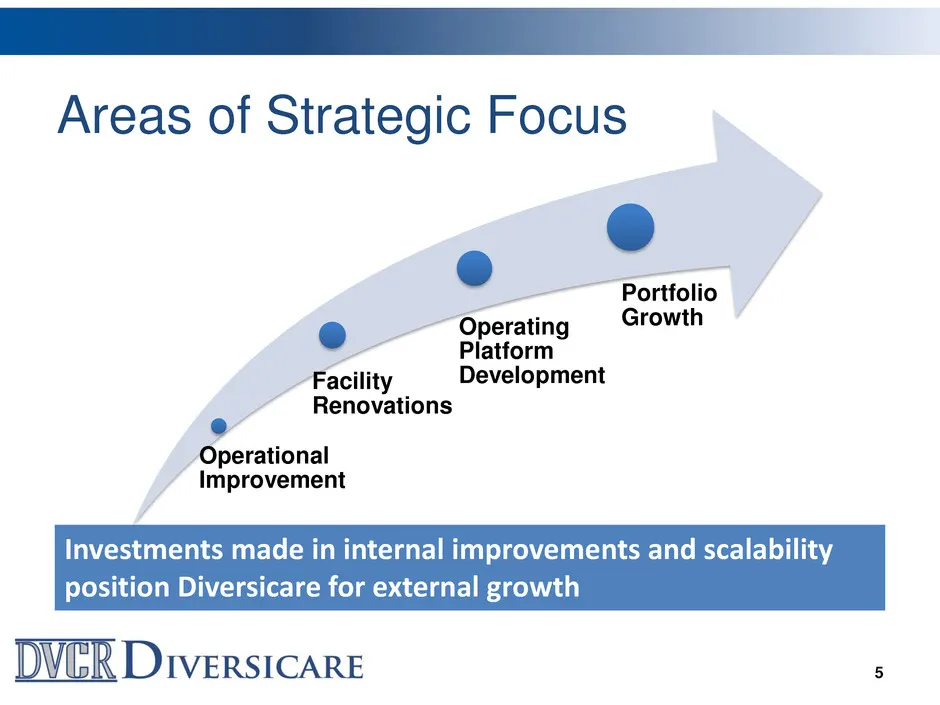
Areas of Strategic Focus Portfolio eo Operating Growth Platform ‘acility Development Renovations perational Improvement Investments made in internal improvements and scalability position Diversicare for external growth DVER DiversicareE :
Slide 6: Operational Improvements Yield Enhanced Facility-Level Margins
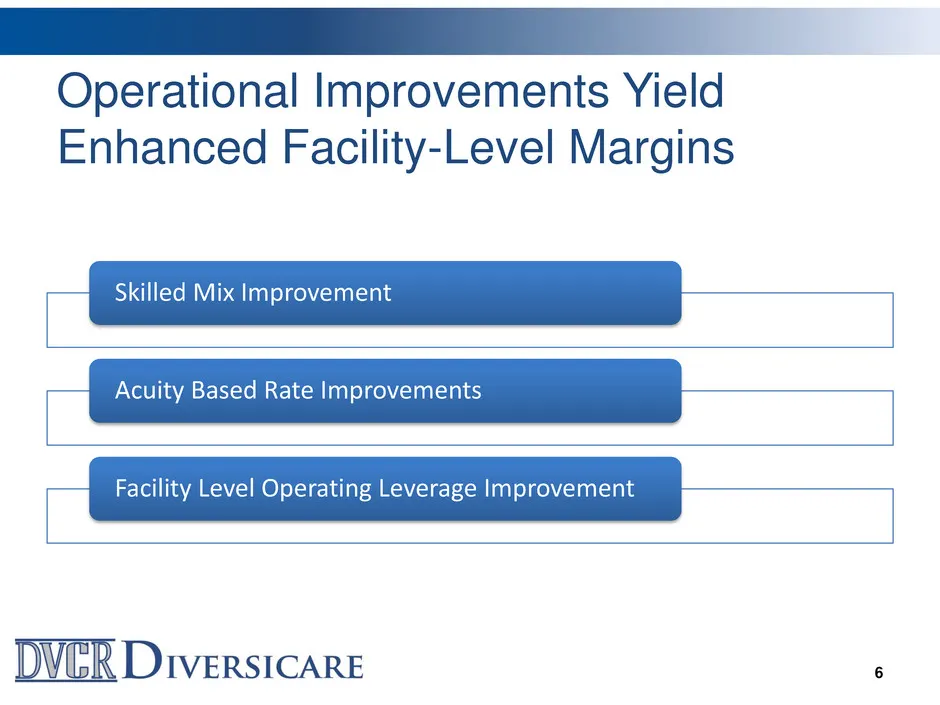
Operational Improvements Yield Enhanced Facility-Level Margins Skilled Mix Improvement Acuity Based Rate Improvements Facility Level Operating Leverage Improvement I WER Diversicare ‘
Slide 7: Focus on Higher Acuity and Patient Mix
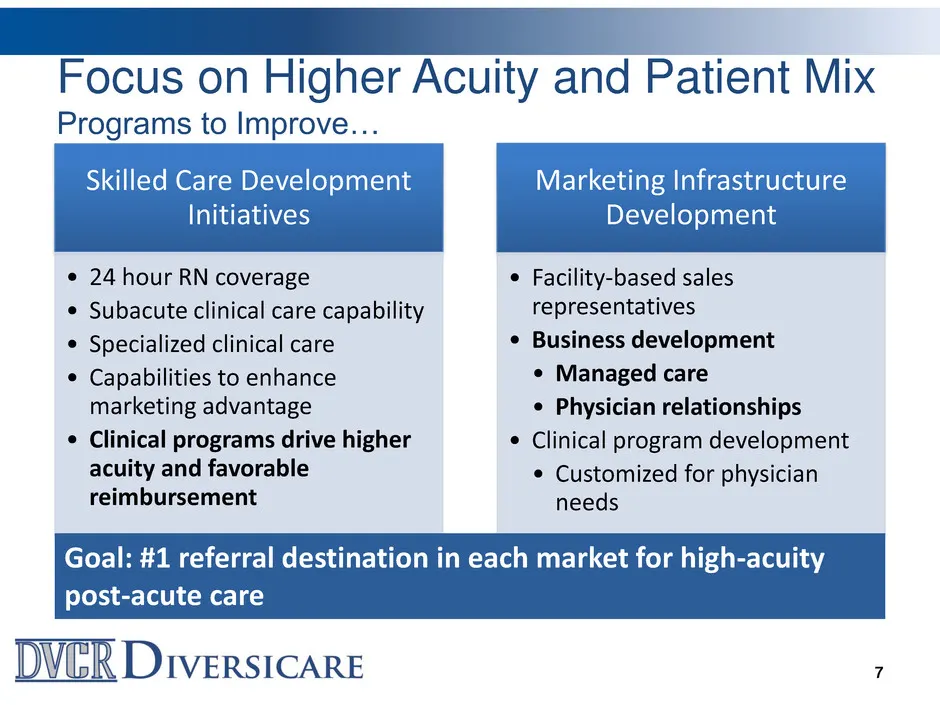
q Focus on Higher Acuity and Patient Mix Programs to Improve... SI Initiatives Development © 24 hour RN coverage Facility-based sales ¢ Subacute clinical care capability representatives © Specialized clinical care ¢ Business development * Capabilities to enhance * Managed care marketing advantage ¢
Slide 8: Results: Improved Patient Mix
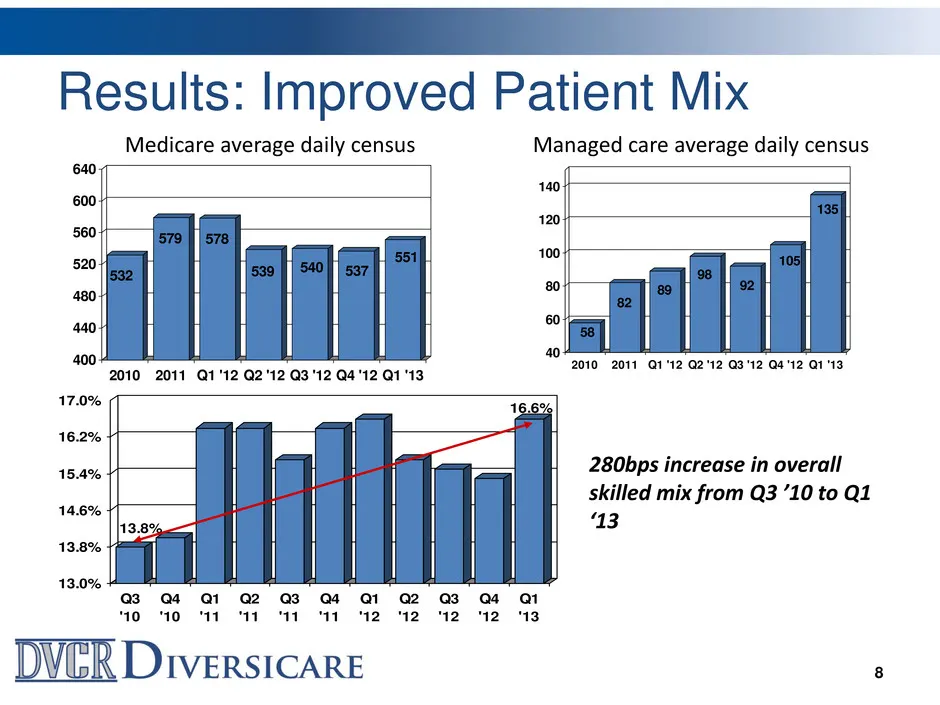
ll EE Results: Improved Patient Mix Medicare average daily census Managed care average daily census 640: ey | 140 = 600 Tal 120 ooo 579 || | 578 = 551 og J 105) 520 (ao 539 ||| 540])| 537 2 |S 80 89 480: 82 60 440. 58 2010 J 2011 Q1 12 Q2'12 Q3'12 Q4'12 Q1'13 2010, BOUL SEM? O22 BAZ Oe aL 280bps inc
Slide 9: Results: Favorable Rate Trends
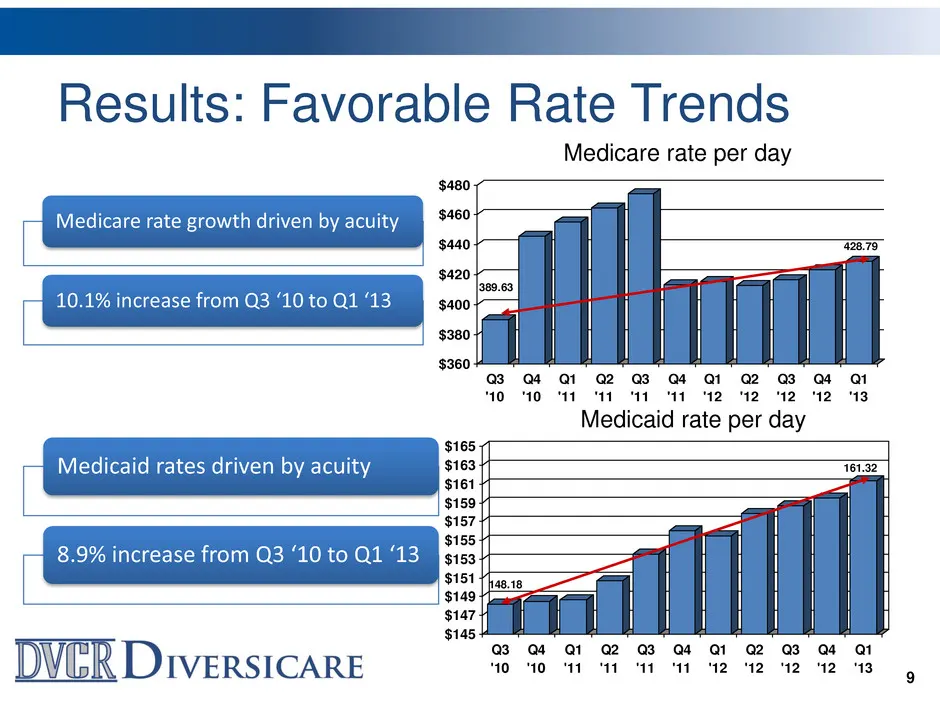
Results: Favorable Rate Trends Medicare rate growth driven by acuity Medicare rate per day 10.1% increase from Q3 ‘10 to Q1 ‘13 @3 Q4 Qi @2 G3 @4 Qi a2 @ a a 10 10 11 11 2 12 42 12 43 7 Tt Oe Medicaid rate per day $ Medicaid rates driven by acuity 8.9% increase from Q3 ‘10 to Q1 ‘13 WER Diversicare
Slide 10: Facility Renovation Program
Facility Renovation Program Supports Operational Improvements Enhances Marketing Capability Attractive Return On Investment Demonstrates Ability to Drive Improvement in Acquired Assets WER Diversicare ‘0
Slide 11: Facility Renovations Initiative
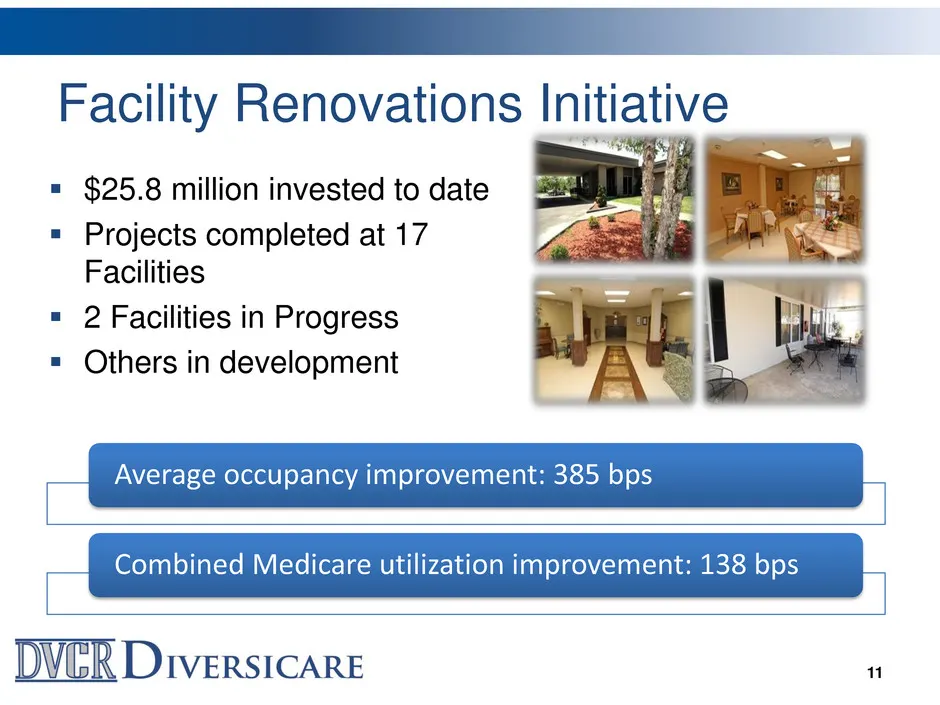
Facility Renovations Initiative = $25.8 million invested to date = Projects completed at 17 Facilities = 2 Facilities in Progress = Others in development WER Diversicare "
Slide 12: Operating Platform Development
Operating Platform Development Positions Company for Future Growth Added needed functionality Expanded operating capacity Created future operating leverage ll WER Diversicare 2
Slide 13: Portfolio Growth Is Now Primary Focus
Portfolio Growth Is Now Primary Focus Target 5-10 New Facilities per Year (3 in 2012, 5 YTD in 2013) Active Pipeline and Buyer-Friendly Market Expanded Operating Infrastructure = Scalability Flexibility on Structure = Several Sources of Financial Capacity WER Diversicare
Slide 14: Flexibility on Acquisition Structure
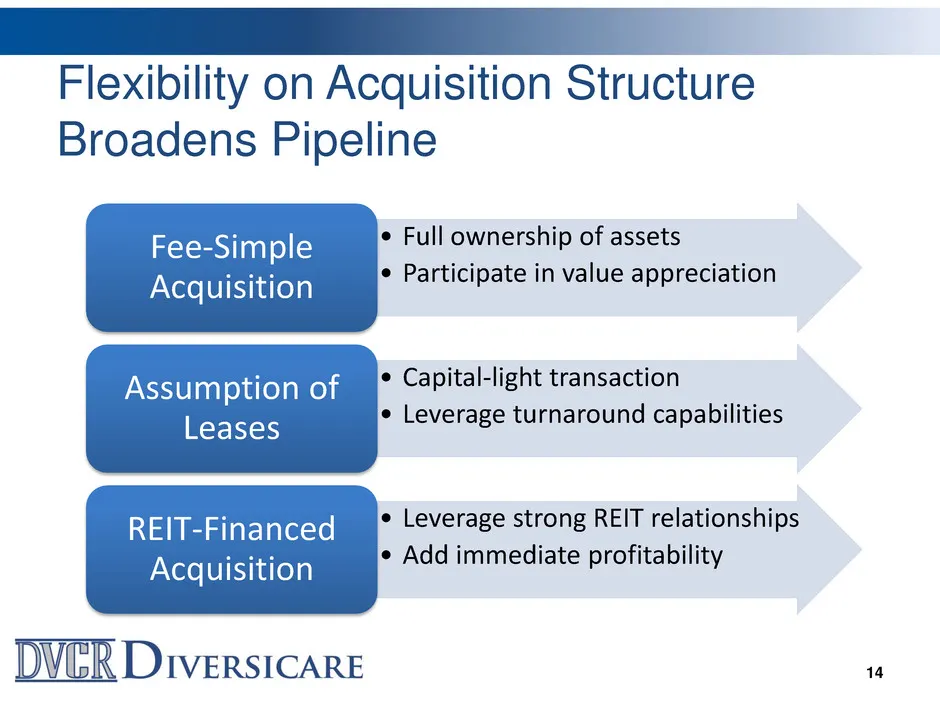
Flexibility on Acquisition Structure Broadens Pipeline ¢ Full ownership of assets Fee-Simple ¢ Participate in value appreciation Acquisition ¢ Capital-light transaction Assumption of ¢ Leverage turnaround capabilities Leases REIT-Financed & Leverage strong REIT relationships Acquisition ¢ Add immedi
Slide 15: 2012 Portfolio Expansion
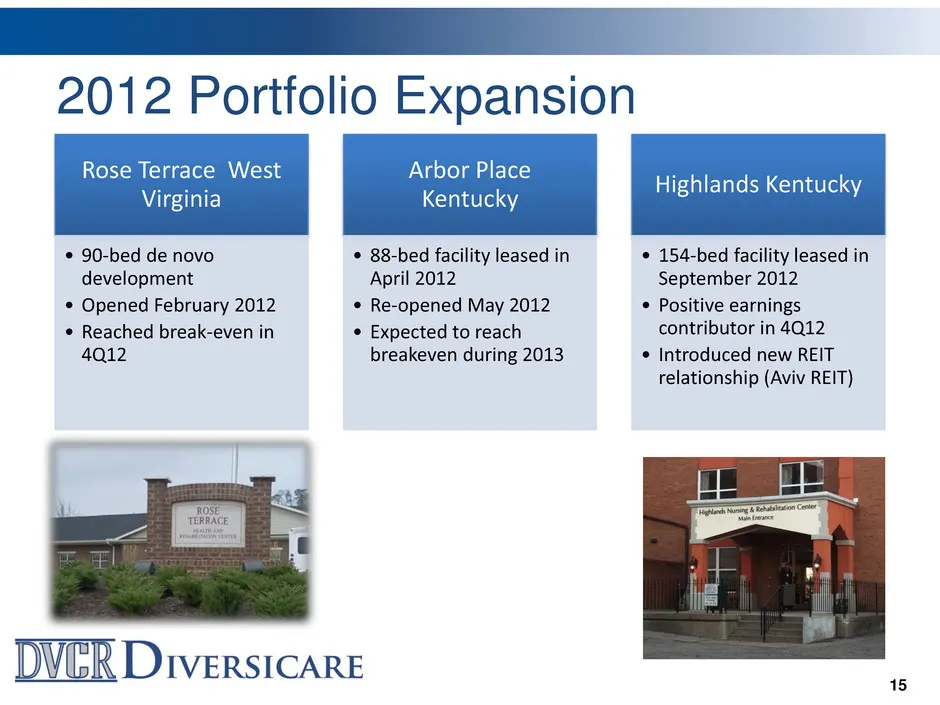
2012 Portfolio Expansion * 90-bed de novo * 88-bed facility leased in ¢ 154-bed facility leased in development April 2012 September 2012 * Opened February 2012 * Re-opened May 2012 * Positive earnings Reached break-even in Expected to reach contributor in 4Q12 4Q12 breakeven during 2013 Introduced n
Slide 16: 2013 Acquisition of Kansas Portfolio
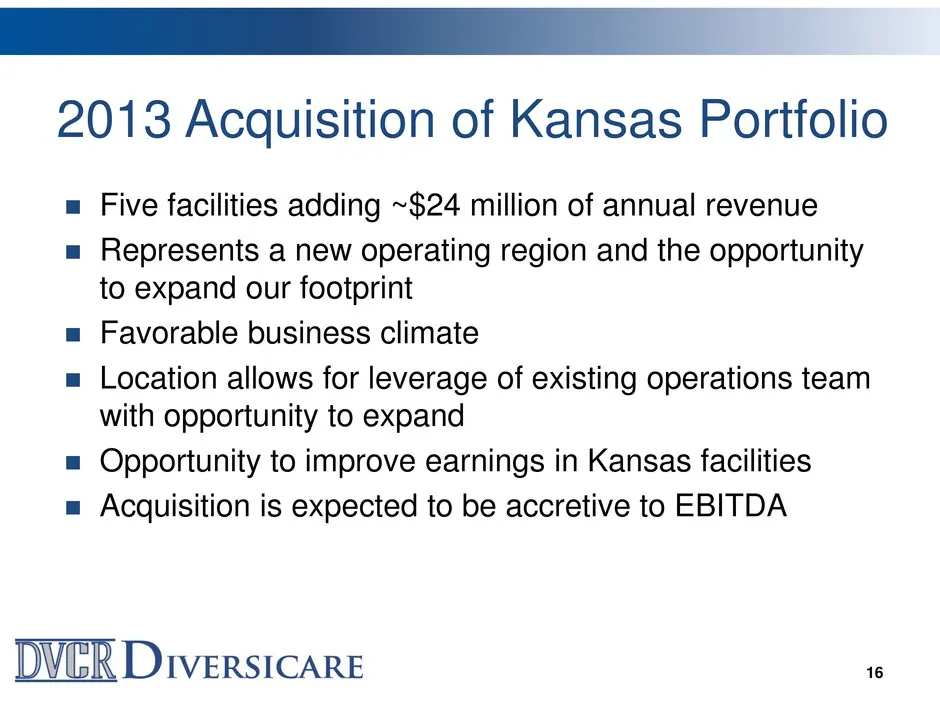
2013 Acquisition of Kansas Portfolio a Five facilities adding ~$24 million of annual revenue Represents a new operating region and the opportunity to expand our footprint Favorable business climate Location allows for leverage of existing operations team with opportunity to expand Opportunity to imp
Slide 17: Deepen and Expand Existing Footprint
Deepen and Expand Existing Footprint = Acquisitions in existing states leverage our infrastructure = Acquisitions in new states add growth channels and improve risk profile = Interest in growing SNF and ALF Services WER Diversicare
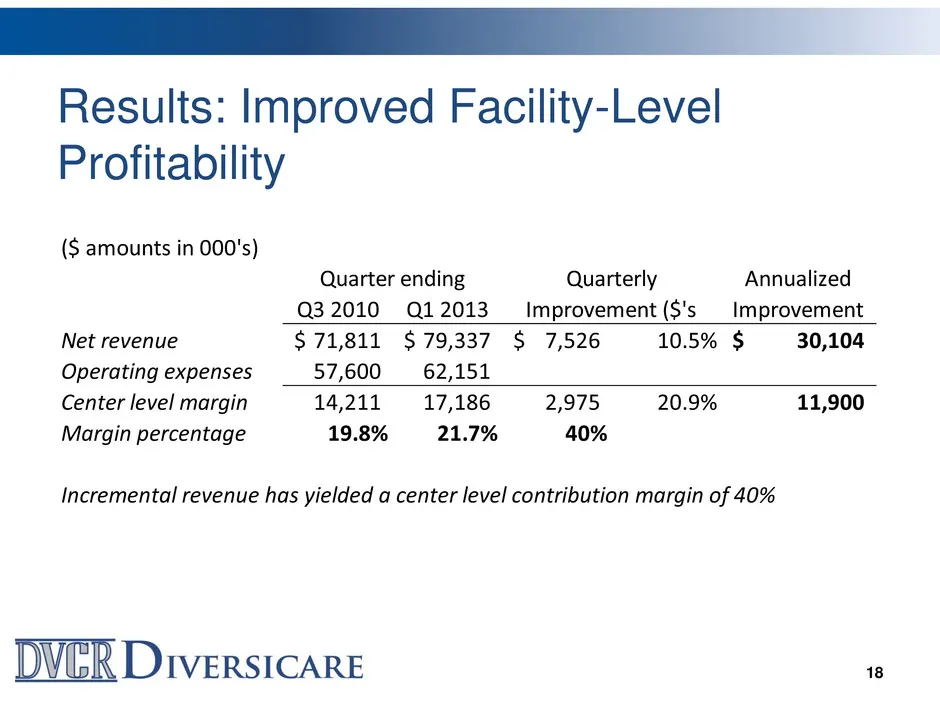
Slide 18: Results: Improved Facility-Level Profitability
Results: Improved Facility-Level Profitability (S$ amounts in 000's) Quarter ending Quarterly Annualized Q3 2010 Q1 2013 p (S's p Net revenue $71,811 $79,337 $ 7,526 10.5% $ 30,104 Operating expenses 57,600 62,151 Center level margin 14,211 17,186 2,975 20.9% 11,900 Margin percentage 19.8% 21.7% 40%
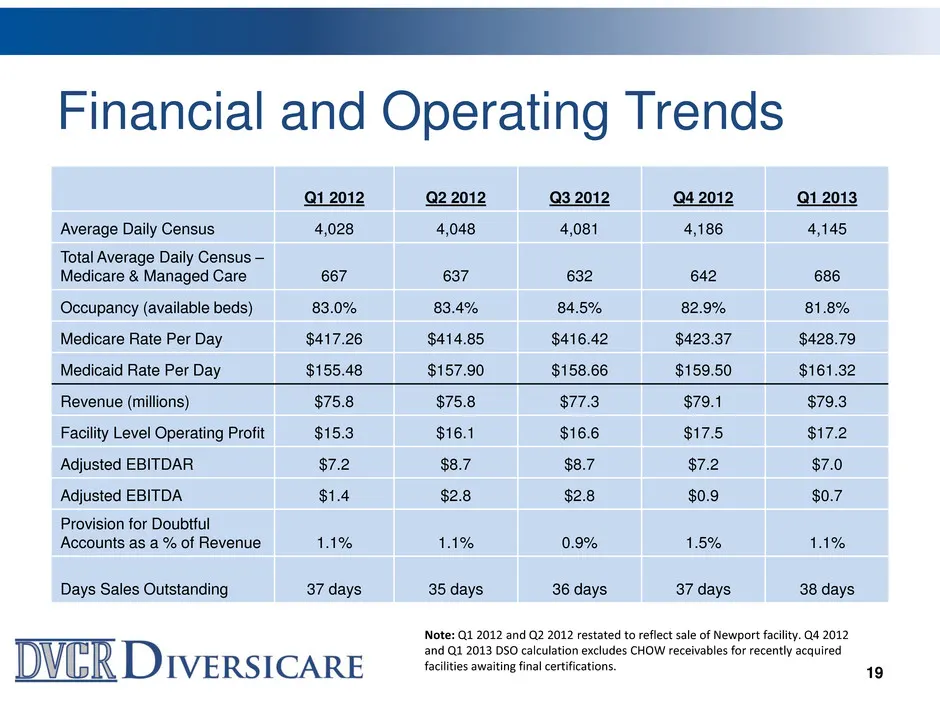
Slide 19: Financial and Operating Trends
Financial and Operating Trends M1 2012 Q2 2012 Q3 2012 Q4 2012 Q1 2013 Average Daily Census 4,028 4,048 4,081 4,186 4,145 Total Average Daily Census — Medicare & Managed Care 667 637 632 642 686 Occupancy (available beds) 83.0% 83.4% 84.5% 82.9% 81.8% Medicare Rate Per Day $417.26 $414.85 $416.42 $4
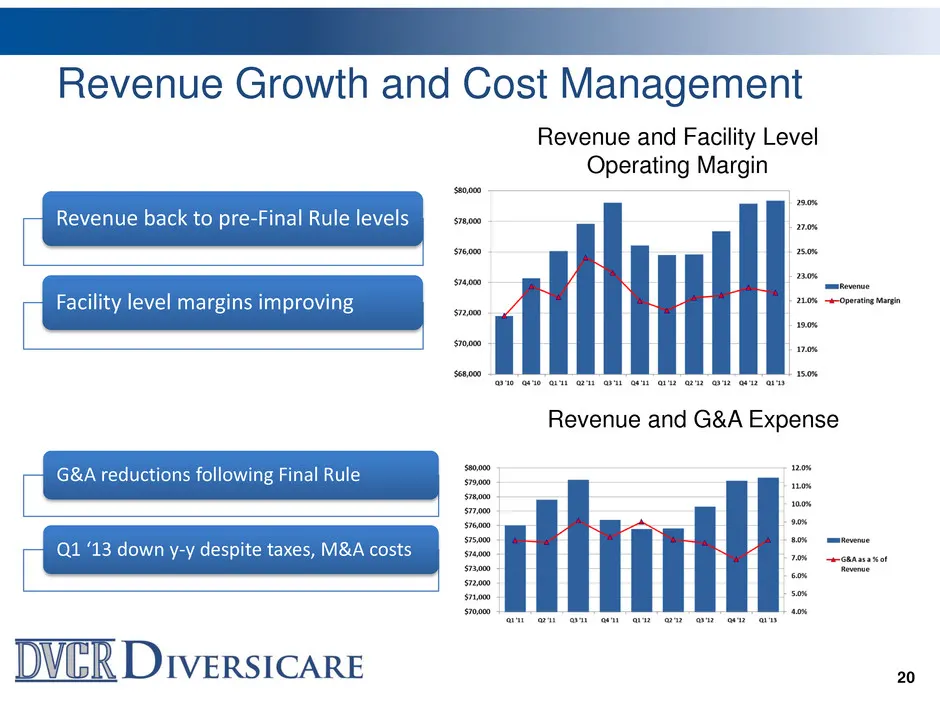
Slide 20: Revenue Growth and Cost Management
Revenue Growth and Cost Management Revenue back to pre-Final Rule levels Facility level margins improving G&A reductions following Final Rule Q1 ‘13 down y-y despite taxes, M&A costs WER Diversicare Revenue and Facility Level Operating Margin 7600 aso 00 N snow _ alll - 800 150% Revenue and G&A Expe
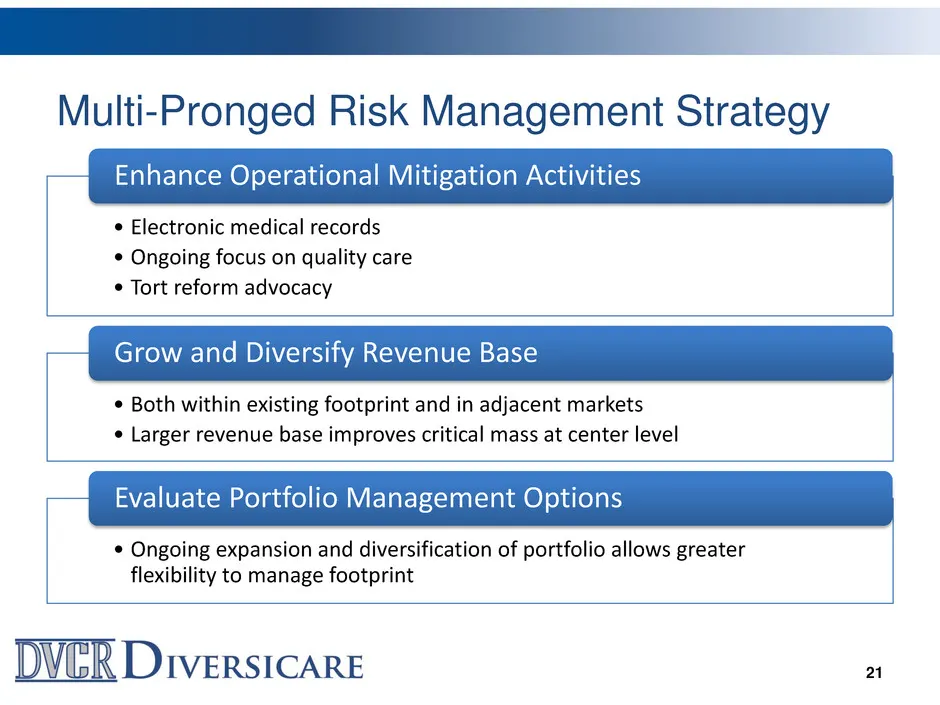
Slide 21: Multi-Pronged Risk Management Strategy
Multi-Pronged Risk Management Strategy Enhance Operational Mitigation Activities Electronic medical records * Ongoing focus on quality care * Tort reform advocacy Grow and Diversify Revenue Base * Both within existing footprint and in adjacent markets Larger revenue base improves critical mass at ce
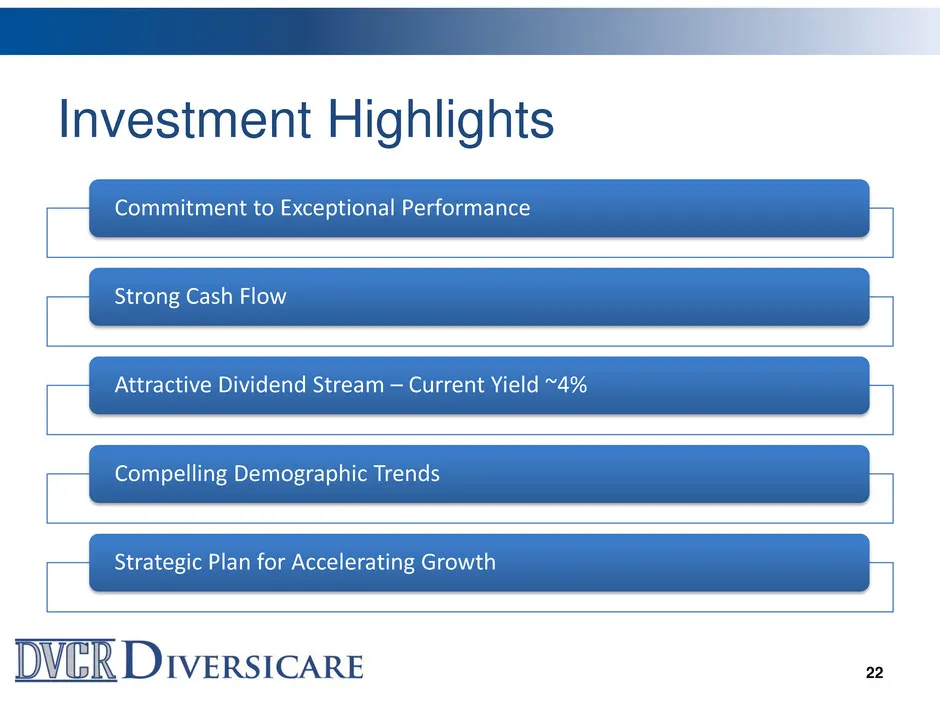
Slide 22: Investment Highlights
Investment Highlights Commitment to Exceptional Performance Strong Cash Flow Strategic Plan for Accelerating Growth Compelling Demographic Trends WER Diversicare 2
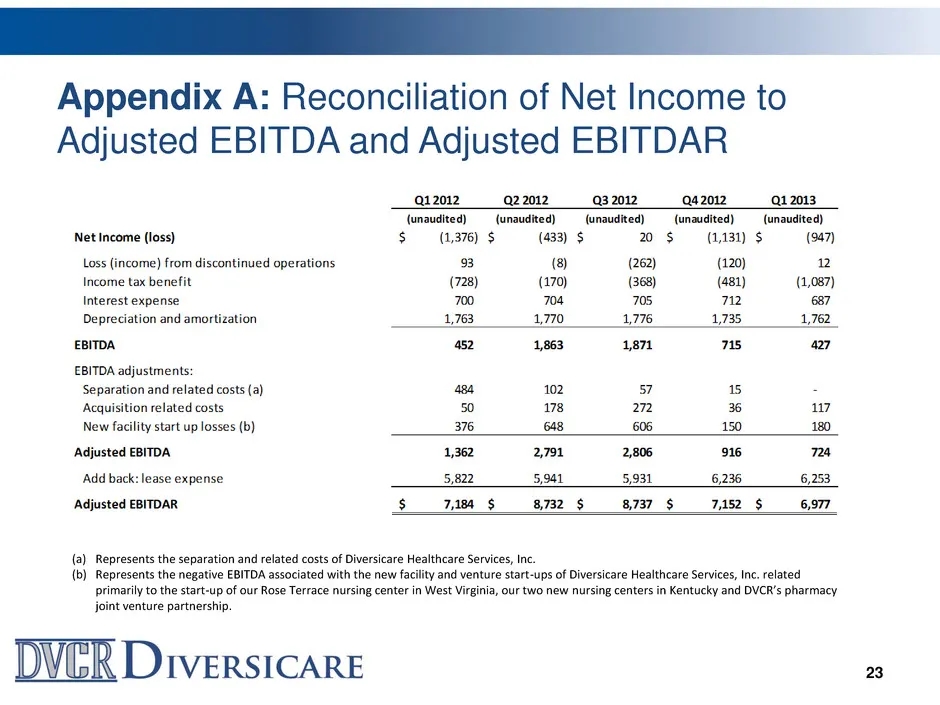
Slide 23: Appendix A: Reconciliation of Net Income to Adjusted EBITDA and Adjusted EBITDAR
Appendix A: Reconciliation of Net Income to Adjusted EBITDA and Adjusted EBITDAR Q12012 Q22012 Q3 2012 42012 unaudited) (unaudited) (unaudited) (unaudited) (unaudited) Net Income (loss) (1,376) $ (433) $ 2 $ (1,131) $ (947) Loss (income) from discontinued operations B (8) (262) (120) 2 Income tax be
Source: SEC EDGAR · 8-K filed Jun 7, 2013
More decks from Diversicare Healthcare Services Inc
 Q2 2021 Earnings Presentation31 slides · Aug 10, 2021
 Q1 2021 Earnings Presentation31 slides · May 11, 2021
 Q4 2020 Earnings Presentation31 slides · Mar 11, 2021
 Q3 2019 Earnings Presentation5 slides · Oct 31, 2019
 Q2 2018 Earnings Presentation35 slides · Aug 2, 2018
 Q1 2018 Earnings Presentation35 slides · May 3, 2018