Laidlaw International — Deutsche Bank Transportation Conference 2005
26 slides from Laidlaw International's conference presentation, Feb 16, 2005
Slide 1: Deutsche Bank Transportation Conference
Deutsche Bank Transportation Conference February 16, 2005 Kevin Benson, President and CEO Douglas Carty, SVP and CFO
Slide 2: Forward-looking Statement
The following presentation may contain forward-looking statements. Although such statements reflect our current reasonable judgment regarding the direction of our business, actual results may differ materially from those projected here. We undertake no obligation to update forward-looking statements

Slide 3: Original Portfolio of Companies
Original Portfolio of Companies
Slide 4: Portfolio of Companies Today
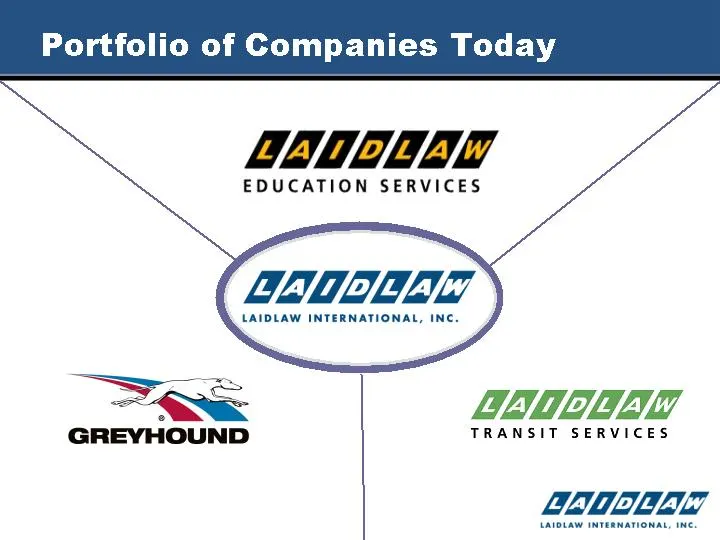
Portfolio of Companies Today
Slide 5: Laidlaw International Focus
Laidlaw International Focus Develop strategic plans Industry assessments Install new leadership Change portfolio Pay down debt Institute return on capital focus Accelerated change
Slide 6: Proforma Income Statement
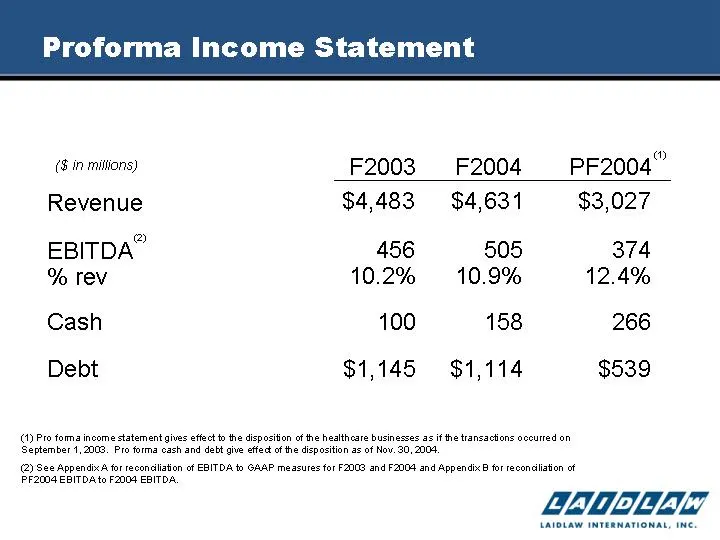
Proforma Income Statement (1) Pro forma income statement gives effect to the disposition of the healthcare businesses as if the transactions occurred on September 1, 2003. Pro forma cash and debt give effect of the disposition as of Nov. 30, 2004. (2) See Appendix A for reconciliation of EBITDA to G

Slide 7: Leader in School Transportation
Leader in School Transportation
Slide 8: Education Services Company Profile
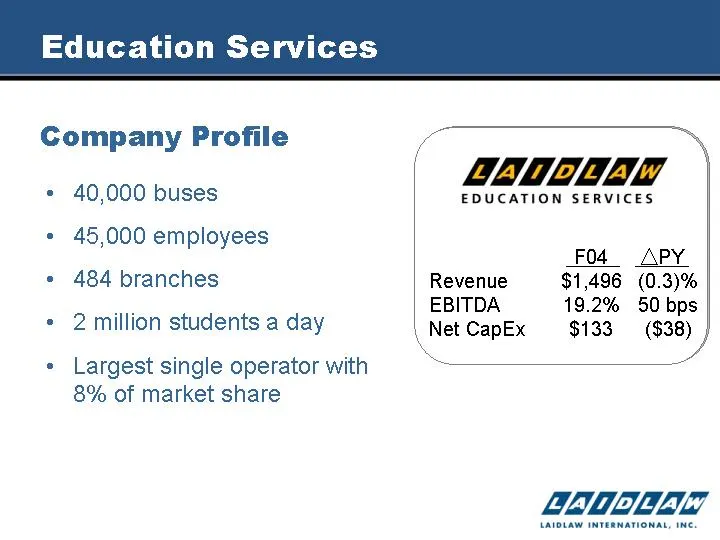
Education Services 40,000 buses 45,000 employees 484 branches 2 million students a day Largest single operator with 8% of market share Company Profile F04 PY Revenue $1,496 (0.3)% EBITDA 19.2% 50 bps Net CapEx $133 ($38)
Slide 9: Education Services: Lower Unit Costs
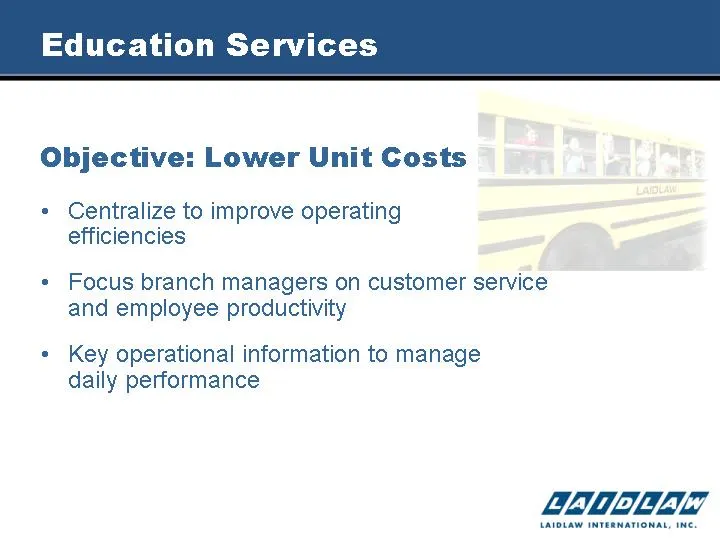
Education Services Centralize to improve operating efficiencies Focus branch managers on customer service and employee productivity Key operational information to manage daily performance Objective: Lower Unit Costs
Slide 10: Education Services: Focus on Return on Capital
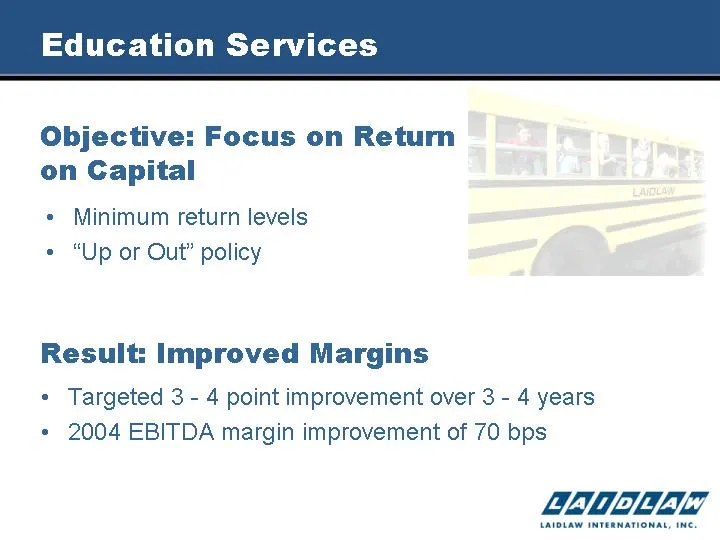
Education Services Minimum return levels "Up or Out" policy Objective: Focus on Return on Capital Result: Improved Margins Targeted 3 - 4 point improvement over 3 - 4 years 2004 EBITDA margin improvement of 70 bps
Slide 11: Education Services: New Revenue Sources
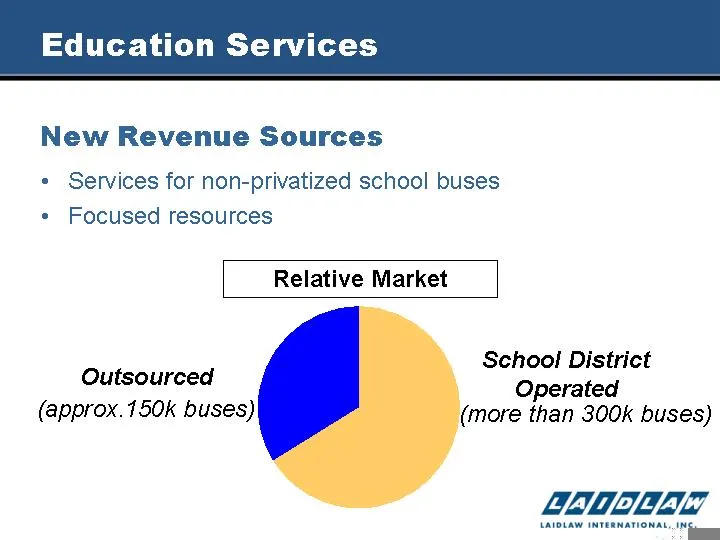
Education Services Services for non-privatized school buses Focused resources New Revenue Sources Sch Dist 317 Outsourced 163 School District Operated Outsourced Relative Market (approx.150k buses) (more than 300k buses)

Slide 12: An American Icon
An American Icon
Slide 13: Greyhound Company Profile
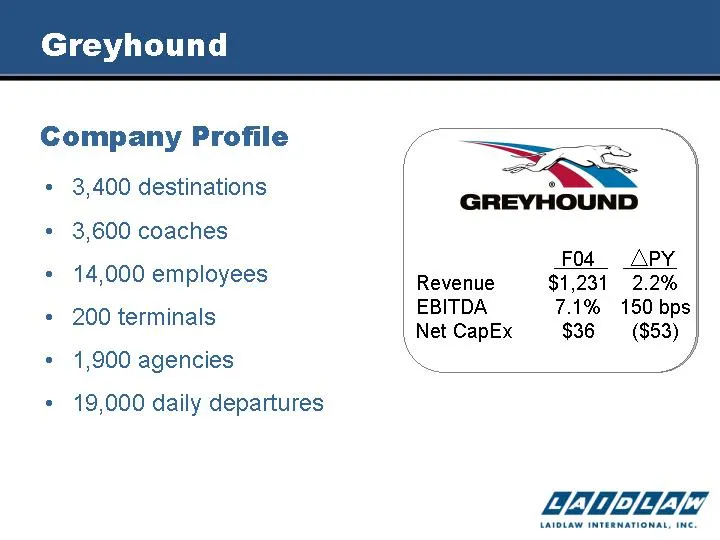
Greyhound 3,400 destinations 3,600 coaches 14,000 employees 200 terminals 1,900 agencies 19,000 daily departures Company Profile F04 PY Revenue $1,231 2.2% EBITDA 7.1% 150 bps Net CapEx $36 ($53)
Slide 14: Greyhound 2004 - Stabilization
Greyhound 2004 - Stabilization Eliminated excess miles Reduced fleet and overhead Executed three year labor contract Changed pricing strategy
Slide 15: Greyhound 2004 - Results
Greyhound 2004 - Results (GLI only) Passenger miles lowered by 11% Overhead staff reduced by 33% Bus fleet cut by 150 units; no new orders placed Revenue per mile increased by 8.7% EBITDA margin up 170 bps
Slide 16: Greyhound 2005 - Network Overhaul
Greyhound 2005 - Network Overhaul STOP LESS. GO MORE. Network focusing on regional short/medium haul passengers Detailed, route specific yield analysis Major route changes underway Restore operating disciplines
Slide 17: New Greyhound
Greyhound New Greyhound Increase penetration of traditional markets Deliver on the promise to the customer Aggressively manage costs Improve technology Objectives: Revenue per bus mile increase 15 to 20% Bus miles reduced 25 to 35%

Slide 18: Public Transit
yi [4/1 [o/s [a/rg AL LAIDLAW INTERNATIONAL, INC. Public Transit noone ill At Its Best
Slide 19: Public Transit Services Company Profile
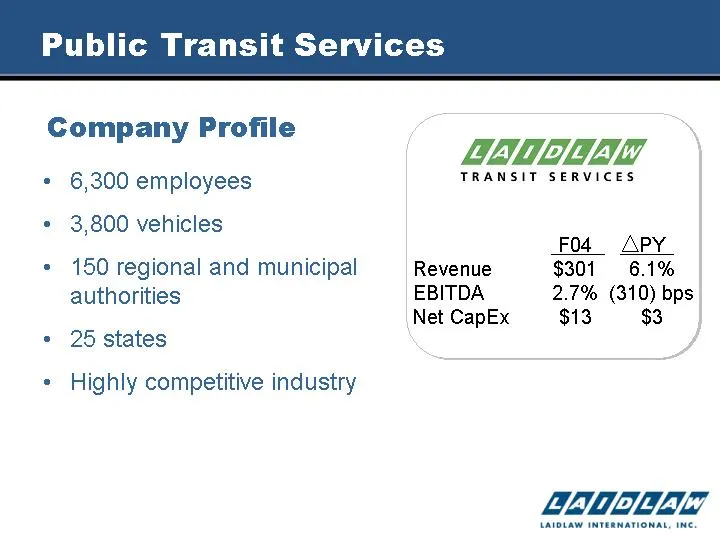
Public Transit Services 6,300 employees 3,800 vehicles 150 regional and municipal authorities 25 states Highly competitive industry Company Profile F04 PY Revenue $301 6.1% EBITDA 2.7% (310) bps Net CapEx $13 $3
Slide 20: Public Transit Services 2004 Achievements
Public Transit Services 2004 Achievements Reduced unit costs; compensation 65% of revenue Revised training and safety procedures Grew revenue by 6.2% Established foundation for 2005 revenue growth
Slide 21: Financial Snapshot
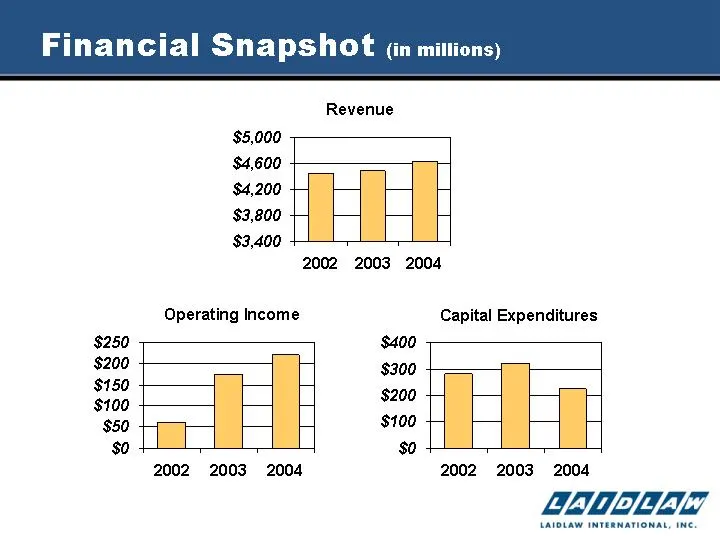
Financial Snapshot (in millions) 2002 2003 2004 Revenue 4432 4483 4631 2002 2003 2004 Operating Income 62 175 221 2002 2003 2004 Capital Expen 283 321 225
Slide 22: Next Steps
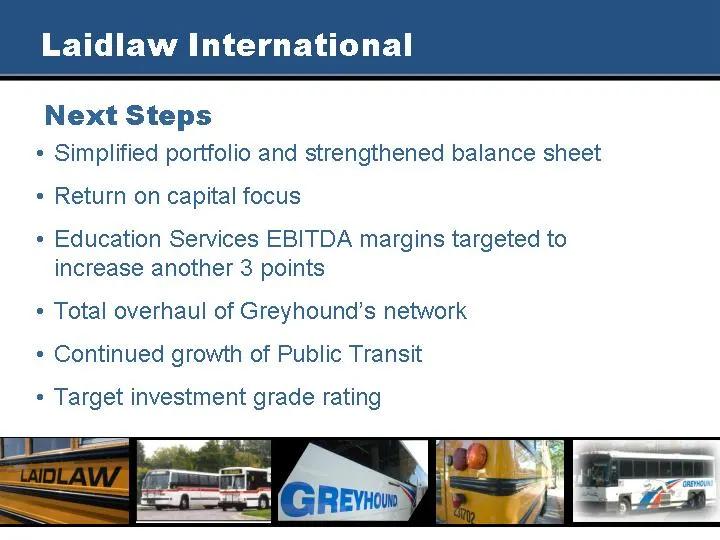
Laidlaw International Simplified portfolio and strengthened balance sheet Return on capital focus Education Services EBITDA margins targeted to increase another 3 points Total overhaul of Greyhound's network Continued growth of Public Transit Target investment grade rating Next Steps

Slide 23: LVAD LNT ala?
LVAD LNT ala?
Slide 24: Appendix A
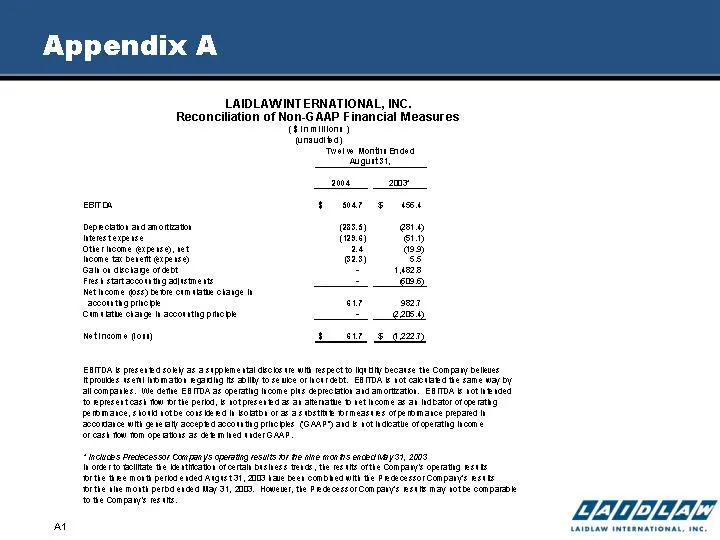
Appendix A LAIDLAWINT ERNATIONAL, INC. Reconciliation of Non-GAAP Financial Measures (einaition: tunsuarea} "fusloe Montn nasa Suguest esro $ war 5 tee Depot ard anomteat ss) aay inereterpeice (as) 6.) tier ncome expe aes) wt ae 35) hhoume tar benef exes) 625) 55 Cabo aeciane ora 1428 Fest strtascot
Slide 25: Appendix A
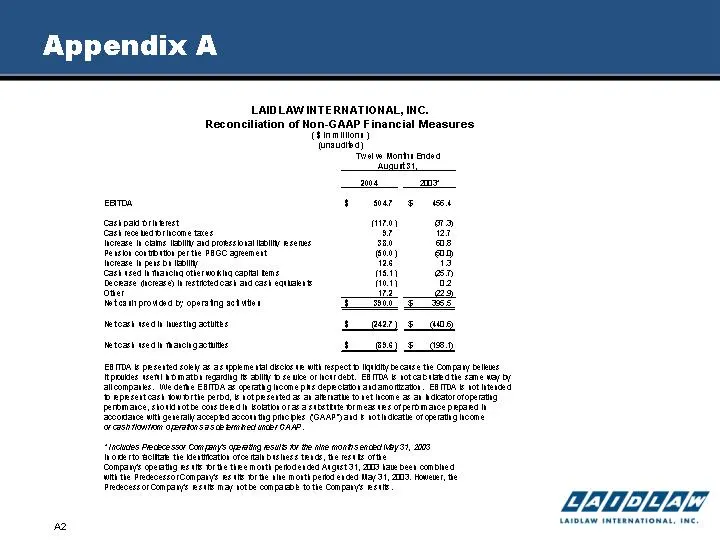
Appendix A LAID LAW INTERNATIONAL, INC. Reconciliation of Non-GAAP Financial Measures (Einmitions) tunauatea) “Feat wont emake ugue carat $ sar 5 ese cast pal orneret nen, cere bMS IDI ata pokes EDN keene 20 as Pensos covets parte PROC aeement 0) a heme peneD ED ae 12 Caetted hanca oer wok capa! nin
Slide 26: Appendix B
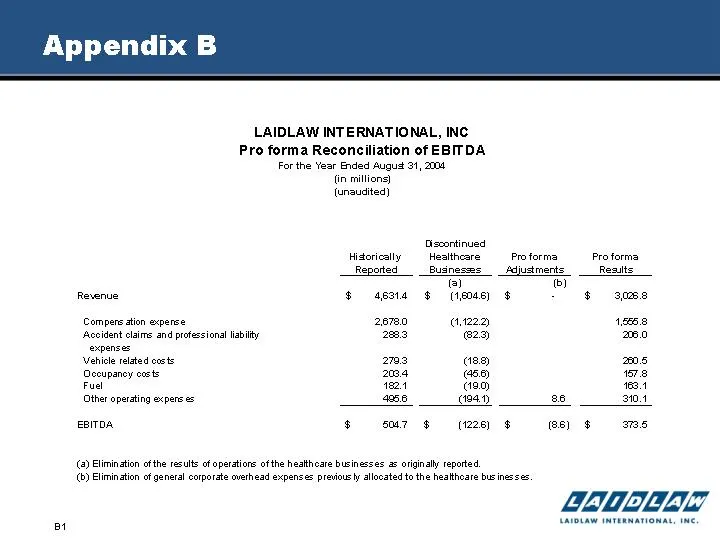
Appendix B LAIDLAW INTERNATIONAL, INC Pro forma Reconciliation of EBITDA For the Year Ended August 31, 204 {in millions} (unaudited) iscontinued Hidorically Healthcare Proforma Proforma Reported _Busnesmes _Aajustmants _ Results @) te) Revenue $ apse $1046) $ 8 308 Compere ation experce 2e780 9.1222
Source: SEC EDGAR · 8-K filed Feb 16, 2005
More decks from Laidlaw International Inc
 Shareholder Meeting (February 2007)26 slides · Feb 12, 2007
 Investor Presentation (May 2006)10 slides · May 9, 2006
 Shareholder Meeting (February 2006)36 slides · Feb 2, 2006
 Bear Stearns Global Transportation Conference 200513 slides · May 12, 2005
 Shareholder Meeting (February 2005)29 slides · Feb 8, 2005
 Investor Presentation (January 2005)14 slides · Jan 13, 2005